Abstract
The emerging of the fourth industrial revolution, also known as Industry 4.0 (I4.0), from the advancement in several technologies is viewed not only to promote economic growth, but also to enable a greener future. The 2030 Agenda of the United Nations for sustainable development sets out clear goals for the industry to foster the economy, while preserving social well-being and ecological validity. However, the influence of I4.0 technologies on the achievement of the Sustainable Development Goals (SDG) has not been conclusively or systematically investigated. By understanding the link between the I4.0 technologies and the SDGs, researchers can better support policymakers to consider the technological advancement in updating and harmonizing policies and strategies in different sectors (i.e., education, industry, and governmental) with the SDGs. To address this gap, academic experts in this paper have investigated the influence of I4.0 technologies on the sustainability targets identified by the UN. Key I4.0 element technologies have been classified to enable a quantitative mapping with the 17 SDGs. The results indicate that the majority of the I4.0 technologies can contribute positively to achieving the UN agenda. It was also found that the effects of the technologies on individual goals varies between direct and strong, and indirect and weak influences. The main insights and lessons learned from the mapping are provided to support future policy.
1. Introduction
The fourth industrial revolution, or so-called Industry 4.0 (I4.0), is emerging from the introduction of several advancements in a way that substantially and rapidly transforms the design, manufacturing, operation, and services related to manufacturing systems or products [1]. One important dimension of this transformation is that for the first-time technology is not seen simply as a new means to promote economic growth, but also as a pivotal element that will enable a more sustainable future. In the literature, the sustainablity implications of the I4.0 are investigated by several studies including implication on the flow of raw materials, energy, products, waste, assets, information, and supply chain [2,3,4,5]. However, the focus of these works is on some technological or sustainability aspects and there is a need to investigate these implications systematically and in a more comprehensive view.
In 2015, the United Nation (UN) adopted a 2030 Agenda for Sustainable Development, which intended to guide the global economy considering social equality and ecological boundaries [6]. The agenda composes of 17 Sustainable Development Goals (SDG) shown in Figure 1. The goals are supported by 168 targets and 330 indicators, which are detailed on the UN website (https://sdgs.un.org/ (accessed on 25 February 2021)). The 193 member states of the UN have committed to implement these ambitious goals by 2030. Since 2015, growing research dedicated to investigate different SDGs aspects, including indicators’ assessments [7], goals integrations [8], energy-related targets [9], soils and soil science impacts [8], Artificial Intelligent (AI) impact [10,11,12], bibliometric investigation of research in business and management field on the goals [5], and whether the goals focus is on the poor and ecological concerns or on economic growth [13].
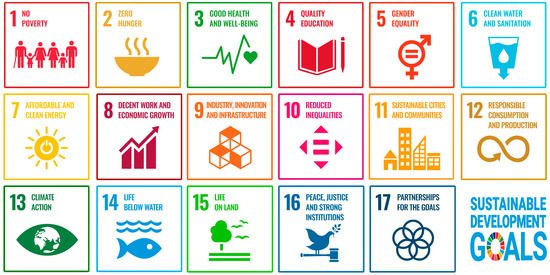
Figure 1.
United Nations Sustainable Development Goals.
I4.0 technologies have a significant impact on the achievement of the SDGs. This influence is explicitly stated in the 8 targets of SDG9; industry, innovation, and infrastructure, and can be implicitly deduced from the majority of the other 161 targets. As the SDGs aim to provide a blueprint for peace and prosperity for humanity and the earth, the influences of the I4.0 technologies are not equal on all these goals. While the influence is significant and straightforward for some goals, it is minor and indirect on others. Additionally, not all the I4.0 technologies contribute positively toward the achievement of the SDGs, where the implications of a few I4.0 technologies contradict with some SDGs targets [3]. Understanding the complex influence of the I4.0 technologies on the SDGs allows researchers and educators to better consult policymakers, in order to think systematically about exploiting new technologies toward the achievement of the 2030 UN Agenda, including how to gear some of these technologies toward sustainability. To date, the effects of I4.0 technologies on the SDGs has not yet been systematically investigated to bridge the gap between policy and technology development.
Enhancing the awareness of how I4.0 technology development impacts the SDGs is one of the most powerful tools to help future engineers to work towards a sustainable world. MAnufacturing Education for a SusTainable fourth Industrial RevOlution project (MAESTRO) is an ongoing research collaboration under the Erasmus+ of the European Commission [14]. Experts from diverse engineering disciplines and seven European institutions from Sweden, United Kingdom, Italy, Portugal, Poland, and Slovenia are putting together efforts to investigate the sustainable influence of the I4.0 technologies. This initiative aims to define and deliver new competences required by the future engineer to work in the I4.0 revolution, focusing on the aspects of the SDGs. To do so, the first step is to quantify the sustainable influence of the I4.0 technologies by mapping these technologies to the SDGs, which is presented in this paper.
I4.0 is enabled by a collection of technologies across a variety of fields related to industry [15]. These different fields span from computer science and communication, into robotics and additive manufacturing. In the literature, I4.0 technologies have been classified at a higher level of granularity such as Internet of Thing (IoT), Cloud Computing (CC), and Virtual Reality (VR) [16,17]. Indeed, each of these higher-level technology areas is a combination of a set of technologies. This high level of abstraction makes it difficult to study the influence of specific technology development on the SDGs. Hence, there is a need to define I4.0 technologies at a lower level of granularity beyond currently available classifications. To address this, the first part of the paper proposes a new break down of high level I4.0 enablers into technology elements.
The paper presents the first formative attempt to: (i) identify and classify the elements of I4.0 enabling technologies, and (ii) map these I4.0 technologies into the SDGs. The effect of the I4.0 technologies on each goal is identified using a consensus-based quantitative assessment and enriched by a deep discussion of selected evidence. The aim of this work is to provide a foundation for systematic exploration of the sustainable influence of the I4.0 technologies to achieve the UN SDGs from the perspective of academic experts.
The remainder of the paper is structured as follows. Section 2 presents the suggested methodology to systematically map the influence of the I4.0 technologies to the SDGs, organizing the experts brainstorming meeting and describing the developed quantitative measure. In Section 3, the technology elements of the I4.0 are identified and classified. The elements are defined, and their challenges are highlighted. Section 4 presents the mapping result and intensively discusses the experts’ opinions along with a variety of supporting arguments. Section 4 closed with a summary of learned lessons from the result. Section 5 concludes the paper, drawing the finding, and opening further research directions.
2. Method
Figure 2 shows the methodology used to map the influence of the I4.0 technology to the SDGs using a consensus-based quantitative assessment. This work is carried out by the MAESTRO team: seven groups, as a body of academic experts, from diverse engineering disciplines spanning industrial, mechanical and electrical engineering, computer science, automation, sustainable production, and engineering management. Each group consists of three to four experts and is headed by one senior expert. The work is carried out in two main tasks: (i) identify and define the I4.0 technologies and (ii) map and discuss the effect of these technologies to the SDGs. The following two subsections explain the method of tackling these two tasks, respectively.
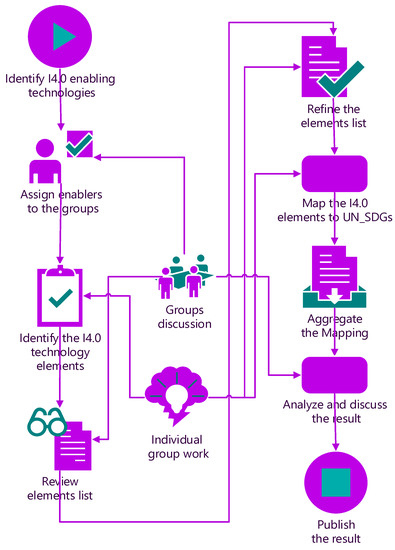
Figure 2.
Method for identifying the I4.0 technological elements and mapping them into the SDGs.
2.1. Identifying I4.0 Technologies
The I4.0 realization and implementation are based on several key technologies from interdisciplinary areas. In total, nine key enabling technologies are described in the literature. These nine enablers are adapted in many research articles, such as in [15,16,17], and also reported by publications of world consultant bodies such as [18]. This study builds on these recognized classifications. These technologies are, also, called pillars or building blocks of I4.0. In this article, they will be called Enablers due the semantic meaning of this word as these technologies make the realization of I4.0 possible rather than supporting its existence. The E letter will be used along with the number of the enabler to denote to specific enablers (i.e., E1 and E2).
By studying the classification of I4.0 technologies, it was found that the classification of the I4.0 enabling technologies into nine enablers is at a high granularity level, where each enabler represents a collection of several enabling technologies. Therefore, the enablers on their own are not sufficient to understand and investigate the effect of I4.0 on the SDGs. A lower level of granularity for these enabling technologies is required as the first step to achieving a meaningful mapping. In the remainder of this paper, these sub-enablers are called technology elements and denoted by adding number and dot after the enabler notation (i.e., E1.1 and E1.2).
To identify the I4.0 technology elements, each group of experts was assigned to be responsible for one or two enablers during the identification process. The assignment was based on the expertise of the groups on the enabled technologies. The identification process is carried out in four steps: (i) identification, (ii) reviewing and discussion, (iii) updating, and (iv) approving (cf. Figure 2). In the first step, the responsible group identified the technology elements for the enabler(s) they are responsible for.
The identified elements were then reviewed and discussed by the seven groups in the second step individually and in a team discussion. After that, each group commented on the elements identified by the other groups and then, the MAESTRO team met to discuss these elements. In the third step, the responsible group refined the elements according to the received comments and submitted the final list of elements for the approval in the fourth step. The consensus list of elements is discussed in detail in Section 3.
2.2. Mapping Method
After identifying the I4.0 technology elements, mapping the influence of these elements to the SDGs is the second task. The mapping started by developing an effective quantitative measure to assess such a complicated influence. The measure is designed to reflect the effect nature of the I4.0 technology elements on the SDGs, which can be direct (strong), indirect (weak), or no influence. Direct or strong influence is when the technology specifically contributes and touches the SDG targets, such as the effect of the big data and analytics on the sustainable industry, innovation, and infrastructure (SDG9), which strongly contribute to optimize its performance and outputs by intelligent decision making. On the other hand, an indirect or weak influence is when the technology does not contribute or touch the SDG targets, but it has a direct influence on another element, which has a direct influence on the SDG targets. An example of such a non-straightforward influence is the effect of cybersecurity on SDG9. Cybersecurity does not contribute directly to improve the sustainability of the goal targets, but it is a crucial enabler for other I4.0 technology (i.e., the big data and analytics), which have a direct influence on the goal. No influence is when the technology neither directly nor indirectly influences the goal.
Another important aspect of the measure is to reflect the direction of the influence toward the achievements of the SDGs either positive or negative. Not all the I4.0 technology elements contribute positively to all the SDGs achievements [3], where some elements influence positively on some SDGs, and at the same time, negatively on other SDGs. A good example of such a conflict influence is the contribution of autonomous robots and automation to SDG9 and reduced inequality (SDG10), affecting positively on the former and negatively on the latter. The autonomous robots and automation plummet the demand of human workforce, especially low skill workers, causing a decrease in their wages, and an increase in income inequalities [19]. Considering all the aforementioned aspects, a quantitative measure is developed to have five levels: (3)—strong positive influence; (1)—weak positive influence; (0)—no influence; (−1)—weak negative influence; (−3)—strong negative influence.
Using this scoring measure, the mapping task was carried out by the seven groups individually and blindly. The mapping process was carried out in three steps: (i) mapping, (ii) aggregating and analyzing, and (iii) discussing (cf. Figure 2). In the first step, experts from the same group met to score the influence of the full technology elements list to all the 17 SDGs. Consensus scores were elicited based on the opinions of experts. The outcomes of this step were seven mapping files, which then aggregated and analyzed in the second step. The average values of the seven scores and the standard deviations were calculated, providing more rigorous and credential scores. The full result of the mapping is reported in the Supplementary File. In the final step, the MAESTRO teams were met to discuss and interpret the results, which are presented in Section 4.
3. Industry 4.0 Enabling Technologies
As explained in the method section (cf. Section 2), the groups of experts (the MAESTRO team) have collaborated to identify and define these elements according to the growing I4.0 literature. The consensus list of elements is presented in Figure 3 and will be discussed in the following sub-sections.
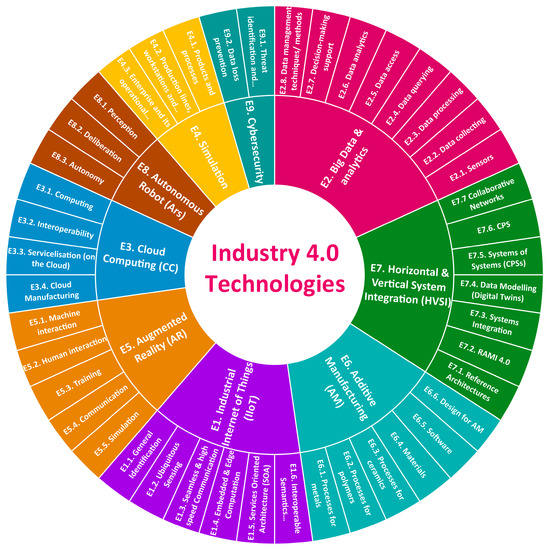
Figure 3.
I4.0 enablers and elements technologies.
3.1. Industrial Internet of Things
Internet of Things (IoT) semantically is the connection of two words “internet” and “things”. The “internet” means the networks that provide the connectivity of “thing”, which refers to a person, a physical object or logical agent. The IoT can be defined simply as “IoT allows people and things to be connected anytime, anyplace, with anything and anyone, ideally using any path/network and any service” [20]. Although the concepts of IoT exists decades before the I4.0 initiative, an Industrial Internet of Things (IIoT) is introduced to leverage and realize the IoT in the context of the I4.0 revolution. To achieve the functionality of IIoT enabler (E1), six technology elements are identified (E1.1 to E1.6):
- E1.1.
- General identification: General identification is the explicit designation of all the entities within the IIoT network, where entities can be internal in the system or external that are related to internal entities. Identification technology focuses on two main processes: naming, which refers to assign a specific name to the entity [21], and addressing, which specifies the entity unique address [22]. The key challenge of identification in IIoT is the applicability of the technology in heterogeneous platforms or networks, which facilitates the connection between industrial things.
- E1.2.
- Ubiquitous sensing: Sensing is the process of detecting events or change in the status of an object or system and sending this information into IIoT to enable deducing effective reactive actions or efficient future decisions. A variety of sensing devices exist including Radio-frequency identifier (RFID)tags, smart sensors, and wearable sensing devices [23]. These devices will be ubiquitous in wider contexts in IIoT, giving a digital nervous system for the industry [24].
- E1.3.
- Seamless and real-time communication: A seamless communication refers to sending or receiving information (i.e., message, files) between heterogeneous devices via any IIoT network at any bandwidth or speed. The connection in IIoT networks supposed to be with zero latency and has an unlimited throughput [25]. Many communication technologies can be utilized in IIoT including RFID [26], Near-field communication (NFC) [27], Bluetooth [28], Long-Term Evolution (LTE), and 5G Wi-Fi [29].
- E1.4.
- Embedded and edge computation: Products, machines, and even tools will be equipped with embedded boards and systems designed to perform a specific function, and it will be supported by processing hubs or cores located close to the endpoints of data source or usage. IIoT systems rely widely on embedded and edge computation to address the limitation of centralized computation such as latency, bandwidth, data privacy, and autonomy [30].
- E1.5.
- Service-Oriented Architecture (SOA): SOA refers to the availability of information or functions as services in the IIoT cloud, exerting ubiquitous services collaboration [31]. Services usage and collaboration are offered in a context-aware manner, where the identity of the objects who request the service is accessed, aggregated, and processed, as well as any related information. Services are available on time to respond to requests without rigidity about time or location [23].
- E1.6.
- Interoperable semantic-based communication: I4.0 devices are supplied by different manufacturers, connected to different domains, or use different communication protocols. This heterogeneity creates a lack of interoperability between these devices and means that achieving a flexible digitalization between such devices is a challenge. Semantic technology is the solution that enabling the interoperable and flexible communication between these seamless devices, as well as between human and artificial agents [32]. Semantic web technologies offer a standardized representation of knowledge (i.e., RDF, RDF Schema, and OWL) and a semantic query language called SPARQL [33].
3.2. Big Data and Analytics
The second enabler puts emphasis on data, information, and knowledge. One of the pillars of I4.0 concerns devices that generate data. “Big Data (BD)” is defined as large sets of heterogeneous data, coming from various sources, having different formats, and flowing in real time [34]. BD attributes are: volume—continuous data growth [35]; velocity—fast data processing; variety—data in various forms. Conventional analytical tools for analyzing industrial datasets are inappropriate because the analyst will not be able to capture the whole value of the data [36]. Due to this, the term “analytics” is also crucial for I4.0. Analytics includes various methods for discovering meaningful patterns in data. It uses data science to support making right decisions [37]. To achieve the functionality of BD and analytics enabler (E2), eight technological elements are identified (E2.1 to E2.8):
- E2.1.
- Sensors: Sensors are one of the most important data sources in the industry, e.g., sensors in industrial devices and machines recorded values of parameters of production processes, as well as sensors in medical healthcare, and in public utilities recording data on media consumption or failures. The variety of domains is a characteristic of BD sensing. Sensing is also associated with deploying sensor clouds, automation of data sensing, and ensuring sensors’ infrastructure scalability. In the context of BD, an important challenge is the creation of sensors networking and sensors cloud computing, which are needed to gain highly efficient BD services.
- E2.2.
- Data collecting: Dealing with continuous data growth is crucial for collecting large amounts of data. The basis for collecting BD is clusters of servers (nodes) and Distributed File Systems (DFS). Computational nodes allow for distributed processing. It provides high scalability and high fault tolerance [38]. Whereas DFS can handle hundreds of nodes in a cluster. It manages files on distributed nodes, reduces network congestion, and increases system performance. BD can also be collected in their native formats and uses flat architecture, thanks to “data lakes” [39].
- E2.3.
- Data processing: Processing BD based on two functions: Map and Reduce, that are combined as “MapReduce”–programming model, which allows creating applications running simultaneously on many computers. Other concepts that enable parallel execution of applications and use thousands of nodes at one time are “YARN” and “Dryad” [40,41]. BD can generate data streams at extremely high speed, so it will not be feasible or cost effective to store whole datasets. Therefore, a real-time processing of data streams is important challenge for modern data processing [42].
- E2.4.
- Data querying: In the case of BD, it is important to support data processing due to converting high level queries into MapReduce tasks, reducing MapReduce complexity, and simplifying exploration in parallel, especially in massive datasets. These challenges are met, e.g., by high level scripting language “Pig Latin” or declarative language “JAQL”. However, the above mentioned issues that concerning data querying optimization are still open challenges [40,43].
- E2.5.
- Data access: Technologies related to data access enable efficient data transfer between BD clusters of nodes and structured data stores (relational databases, enterprise data warehouses). Due to variety of BD sources, an integration of that data sources is a core challenge both for data collecting and data access. Other technologies provide in-memory data access that enable run applications many times faster, as well as support real-time processing, on-line machine learning, and continuous calculations [44,45].
- E2.6.
- Data analytics: In total, four types of analytics have been defined: descriptive —summarizing existing datasets in order to get insight into the past; diagnostic—determining why something happened in the past; predictive—using a model developed based on existing data to predict future data; prescriptive—using optimization methods to recommend a specific course of action. Despite the fact that listed types existed before the era of BD, they can also be used for large industrial datasets [35]. However, generating insights in a timely manner is still a core challenge for BD analytics.
- E2.7.
- Decision-making support: From the viewpoint of I4.0 and BD, machine learning, and deep learning can be crucial to support the decision-making process. They allow discovering information from large volumes of uncategorized data. This is confirmed by many real world applications, such as recommendation engines, recognition systems, autonomous control systems [46], and decision support systems for reducing production costs [47]. Data mining methods are complemented by visualization that helps present the information more intuitively and efficiently [41].
- E2.8.
- Data management techniques and methods: BD requires appropriate data management methods and techniques that will make it possible to: coordinate applications and nodes in clusters, replicate services to protect data and nodes from failures, and recover system automatically. Management tools also allow for making interface where developers can view the system, create and manage user accounts, and monitor cluster health [48]. Different enterprises may have their own transmission protocols, data storage procedures, data formats, etc. This can be a serious challenge that hinders the creation of a universal data management system.
3.3. Cloud Computing
Cloud computing (CC) is a model for enabling ubiquitous, convenient, on-demand network access to a shared pool of configurable computing resources (e.g., networks, servers, storage, applications, and services) that can be rapidly provisioned and released with minimal management effort or service provider interaction [49]. It provides a sharable approach in which the computing resources can be accessed from different platforms and locations, with low computing load at the front end. Even though I4.0 has high requirements of Information and Communications Technology (ICT) capabilities of the stakeholders, the local factories, and companies normally do not maintain sufficient knowledge and expertise for the latest technologies. Thus, CC provides the feasible solution to provide the computing resource in different terms, i.e., Software as a Service (SaaS), Platform as a Service (PaaS), and Infrastructure as a Service (IaaS). Eventually, the cloud users can distribute the Information technology IT tasks to the cloud provider based on their needs, to focus on the actual value-adding process in their core business. This section discusses the key technology elements of CC (E3.1–3.4).
- E3.1.
- Computing: CC technology is the delivery of computing resources and power from remote locations, which do not require high facility investments for the user. In the past years, many successful commercial CC solutions like Microsoft Azure [50], Amazon web services [51], IBM Cloud [52], Google compute engine [53], etc. Meanwhile, there are also open cloud platforms like Openstack [54], Apache CloudStack [55], Apache Mesos [56], and so forth. These platforms provide different options of the industry to facilitate the computing structure within a private, community or public domain. For cloud users, the challenge is to identify the proper computing solution that is suitable for the business and safety requirements.
- E3.2.
- Interoperability: Interoperability refers to the capability of different systems, components, or products to understand and work with each other. In practice, a feasible engineering system needs to guarantee the interoperability at different levels, i.e., semantic, syntax, database, hardware, protocol, system, etc. [57,58,59]. In an I4.0 scenario, multiple novel technologies must be able to communicate and work with each other [60].
- E3.3.
- Servicelisation: (on the Cloud): cloud-based servicelisation is the delivery of the computing resources in terms of service. Service user can use and pay based on the exact amount of service that is needed, i.e., pay-as-you-go principle. In the past years, different approaches have been proposed to offer the engineering resource and capability on the cloud in terms of services [61,62]. Both the hardware and software are capable to be encapsulated in terms of scalable services, and provided in the cloud resource pool [63].
- E3.4.
- Cloud Manufacturing: based on the success of CC and servicelisation, the cloud concept is further extended to the manufacturing domain, thus forming cloud manufacturing technology. Cloud manufacturing refers to network access to a shared pool of configurable manufacturing resources [64,65,66]. In cloud manufacturing, the manufacturing hardware and software can be servicelised and offered on the cloud to provide accessible and elastic manufacturing capabilities with a low initial investment for the users.
3.4. Simulation
Due to the complexity of I4.0 and the difficulties that are associated with the implementation and coordination of this concept, simulation can be helpful to facilitate the use of all components of such systems, e.g., robotics, IT, manufacturing, logistics. Simulation is a representation of operations that take place in the real world in a given function of time [67]. Besides, the network connection of certain I4.0 components, their mutual optimization is important, which is increasingly performed using simulation to present optimal or nearly optimal solutions to the decision-makers. This approach greatly reduces the waste of time for an experiment that would have to take place in the absence of simulation [68]. In total, three technology elements (E4.1 to E4.3) are identified for the simulation enabler (E4):
- E4.1.
- Product and processes: Product and processes simulation is crucial and provides the basis for simulating larger systems that creates I4.0. Simulation in this part includes Finite Element Analysis (FEA) [69], simulation of acoustics performance of the product [70,71] simulation of composites structures behavior and the progressive degradation [72,73] and fluid dynamics simulation [74] can be distinguished. One of process simulation challenges is the development of Computer Aided Manufacturing (CAM) to automate a manufacturing process [75].
- E4.2.
- Production lines, workstations, and internal logistics: The key role to create a virtual factory is to use Discrete Event Simulation (DES). According to [76], the virtual factory that also known as digital twin is an extended use of simulation not just in the design state and planning phase, but also in the entire lifecycle of manufactured products [77]. There is also a growing interest in implementing Virtual Reality (VR) to improve existing work procedures and factory layout planning [78].
- E4.3.
- Enterprise and its operational environment: Simulation allows for a better understanding of the dynamics of business complex systems, such as enterprises, supply chains, and networks. The main simulation approaches used in this area are system dynamics (SD), DES and agent-based simulation (ABS). The DES is highly mature and applied in many fields across enterprises [79,80]. Unlike SD and DES, ABS focuses on individual activities of system components [81]. These simulation techniques are often combined to enable simulating the work of the entire system of enterprises, which in fact a challenging in developing harmonized and reliable models [82].
3.5. Augmented Reality
Industry 4.0 emphasizes the use of ICT and aims to promote the enormous potential of virtualization and the exchange of information. Augmented Reality (AR) represents a perfect combination of the real world with the virtual one, making it possible to enhance human perception by superimposing a computer that generates information on the real-world environment. With technological development, it has become possible to solve critical problems by simulating, assisting, and improving production processes before they are carried out. By using mobile platforms, such as smartphones, tablets, and smart glasses, it is possible to add relevant information directly to the worker’s field of vision, providing assistance in the performed tasks [83,84]. Overall, five elements technology related to AR have been identified (E5.1–E5.5):
- E5.1.
- Machineinteraction: Through augmented reality devices, operator can perform complex actions and interact directly with machines. For example, in [85], a system including augmented reality to operate a crane was studied, or in [86] for real-time programming of collaborative robots.
- E5.2.
- Human interaction: The possibility of interaction between human beings is improved. It is possible to collaborate in an immersive manner even if the collaborators are not present in the same place. Anticipation long ago [87] is now pervasive by fast internet and cheaper devices.
- E5.3.
- Training: AR is also an enabling technology from the point of view of teaching and learning new tasks. For example, it is possible to directly support the operator during his operations by providing him or her with detailed information on the assembly or maintenance procedures for machinery [84,88]
- E5.4.
- Communication: Using optical devices, it is possible to superimpose images, text, and symbols on the operator’s visual field to facilitate and improve communication and the perception of the surrounding environment [84,89].
- E5.5.
- Simulation: Augmented reality is a useful tool for design, as it enables the simulation of production processes before they are performed. Using completely immersive virtual environments, it is possible, for example, to design industrial plants in detail, or to program computer numerical control machines by virtualizing the production process [83,84,86].
3.6. Additive Manufacturing
Additive Manufacturing (AM) is the term used to refer to a group of production technologies that contrapose to traditional subtractive or mass-conserving manufacturing techniques [90]. AM technologies are natively digital, since they were born after the advent of the personal computer, and their manufacturing workflow is based on the use and processing of digital data. The digital data stream flows from the virtual 3D model of the product through the completion of the build of the physical object. The opportunity of creating an infinite number of different shapes of (almost) any complexity, with one machine and without the use of any mold or die, makes mass customization economically viable [91]. AM has been identified as one of the key enabling technologies for I4.0 and the newest industrial revolution [92]. In the case of the AM enabler (E6), six key elements were identified as follows:
- E6.1.
- Processesfor polymers: AM processes for polymers exploit different physical principles for the layer-wise fabrication of parts made of thermoplastic or thermosetting materials. Composite parts with a polymeric matrix can also be manufactured with short or continuous reinforcement fibers. In the I4.0 framework, the digital workflow and process allow to constantly monitor the state of part production. Sustainability is promoted by the optimal use of material with low production waste and no specific production tools. Process productivity and a wider material range are the challenges for the future development of these technologies.
- E6.2.
- Processes for metals: AM processes for metals include direct and indirect technologies. Direct processes include powder bed fusion (PBF) with laser or electron beam sources and directed energy deposition (DED), also known as cladding. Nowadays, the application of powder-bed fusion technologies is consolidated in many industrial sectors as an alternative to traditional manufacturing for small production batches or single components [93]. Indirect processes are based on binder jetting or material extrusion and involve post-processing operations including a final sintering phase to fabricate dense metal parts [94]. Process productivity and a wider material range are the future challenges for these technologies.
- E6.3.
- Processes for ceramics: AM techniques for ceramic materials are not widely spread because of the limited industrial interest that often comes from niche sectors. Although most of AM processes are characterized by small build volumes, this limitation is even more stringent in the case of ceramics [95]. Ceramics are mainly processed by laser powder bed fusion or by binder jetting, an indirect process that requires post-processing phases and sintering to get dense parts [96]. Larger build volumes and productivity are the challenges for the future developments of AM processes for ceramics.
- E6.4.
- Materials: Raw materials for AM are supplied in the state of viscous liquid, powder or solid (pellets, filament, or wire) feedstock [97]. The variety of materials that can be processed by AM techniques is narrow if compared to that of traditional processes. However, R&D activities are continuously focused on developing new materials for AM, so the variety is constantly increasing. Optimal usage and exploitation of materials with lower production scraps are the potential benefits of AM [98]. Better process reliability and operator knowledge are the challenges for future improvements within the sustainability framework.
- E6.5.
- Design for AM: The key success for AM adoption is to identify a specific benefit that can provide an added value to the AM product by enhancing its performance and functionality. AM achieves its full potential (even under the environmental perspective) when the component is re-designed for the AM technology and the main benefit of the improved product performance is capitalized upon during the use phase [99]. The main challenge for this key element is the promotion and diffusion of this innovative way of designing and conceiving new products to be fabricated by AM technologies.
- E6.6.
- Software: Throughout the AM workflow, different software packages are generally employed. A 3D modeling package is used to define the virtual solid model of the product. Generative design or topology optimization are tools that compute the best material distribution within an assigned design volume while considering engineering constraints and loads [100]. A slicing software is used to generate the manufacturing path for each layer and to convert the path in the proprietary code or open ISO G-code to be sent to the AM machine. The main challenge for the software is to achieve a higher reliability in the simulation of AM processes for predicting part deformation and quality [101].
3.7. Horizontal and Vertical System Integration
In I4.0, systems and system components should not only communicate, but also, integrate and build a collaborative environment to improve the product and related services throughout the whole lifecycle. This integration is in two directions: horizontal and vertical. The horizontal integration is in three domains: within the shop floor (i.e., machine to machine) [102,103], within multiple production facilities [104], and across the entire value creation network [105]. The vertical integration is intra-company and focuses on the collaboration between different levels of the enterprise hierarchy from sensors to the company business level [17]. Overall, seven elements have been identified for this enabler.
- E7.1.
- ReferenceArchitecture: Integration needs common models and architectures to define a communication structure. To enable effective integration, a common language with signs, alphabets, vocabulary, syntax, grammar, semantics, and pragmatics cultures are essentials. When we are talking about vertical and horizontal integration reference architectures, such as the old CIM-OSA, PERA, GERAM, ISA-95 are those that immediately come to mind [106]. The Reference Architecture Model Industrie 4.0 (RAMI 4.0) is very important and will be discussed in the next point. However, other models exist such as the Industrial Internet Reference Architecture (IIRA), and the Internet of Things Reference Architecture (IoT RA) [107]. However, interoperability and security are open challenges for such reference architecture, especially in heterogeneous systems [108].
- E7.2.
- RAMI4.0: German ‘Platform I4.0’ developed a service-oriented architecture special for I4.0 so-called RAMI 4.0 [109]. It defines the domains of industry 4.0 represented in a three-dimensional model: Layers, Lifecycle and Value Stream, and Hierarchy Levels [110]. The layers represent various perspectives, including assets and hardware, data and communication, and functional description and business process. The Lifecycle and Value Stream cover the whole product lifecycle from the development stage into the end life (i.e., recycle and scrap). The third dimension describes the hierarchical levels in the I4.0 system, starting from the product and field devices through control devices and stations into the workstation and enterprises [111].
- E7.3.
- SystemsIntegration: System integration is one of the major difficulties in traditional automation systems. Different interoperability technologies and standardize models were developed to tackle these issues. This technology includes Electronic Device Description, Filed Device Integration, OPCU UA, Gateway and Mediator, AutomationML and semantic standardization, such as eCl@ss [112]. However, in the I4.0 environment, the integration problem is more complicated. I4.0 systems are intended to bring together sub-systems (i.e., machines, robots, sensors) that could be heterogenous, supplied by different manufacturer and have different interfaces [113]. Different models represent data information, functions, and diverse interfaces are used to access data. These heterogeneities make adaptation and mediation between models a major challenge [114].
- E7.4.
- DigitalTwins: Digital Twin (DT) is the effective tool to realize I4.0 smart manufacturing with dynamic modeling, real time simulation, and smart decision-making [115]. DT reflects the physical status of the factory in a virtual space using Computer-Aided Design models in high fidelity. It provides real-time 2-way communication, various scenario simulation, and interactive decision-support [116]. DT is a hot topic in both academia and industry, and many aspects has a room for improvements including modular based DT, modeling consistency and accuracy, VR integration into DT, efficient mapping between virtual and real data [117].
- E7.5.
- Cyber PhysicalSystem (CPS): CPS is a complex and multidimensional system that integrates the system physical resources into cyber world. CPS provides a real-time sensing, information and data feedback, dynamic control and more services through the collaboration and integration of communication, computing, and control [118]. The integration in CPS is in both the horizontal and vertical integrations, with more focus on the vertical direction [119]. Towards the realization of CPS, a lot of effort is needed in many areas, especially in modelling (i.e., CPS platform), models integration, verification and testing [120,121].
- E7.6.
- Systemof Systems (CPSs): CPSs are a collection of task-oriented or dedicated systems that pool their resources and capabilities together to create more complex systems, which offer more extended functionality and performance [112]. CPSs become alive by exchanging information and capabilities between systems’ constituents in both virtual and the physical environments via interfaces in a service oriented manner [118]. Interfaces are the enabler for many functionalities of CPSs and, therefore, need detailed attention in terms of authentication and security, as well as in data sovereignty and ownerships [108]. This intended system solidarity rises many challenges, especially in the horizontal direction such as integration and collaboration between CPSs [120].
- E7.7.
- CollaborativeNetworks (CNs): Collaboration exists and is needed for almost all the enablers and technological elements of I4.0, either explicitly or implicitly. CNs are applied to many domains and supported by variety of collaboration forms, which ranges from industry dynamic structure to supply chain and extended services [122]. CNs can be a goal-oriented or long-term strategic network. While the former characterizes by an intense interaction among participants to reach a common goal, the latter characterizes as a strategic alliance to act as a source breeding environment for the former, aiming to provide supportive networks [123]. Research in CNs are directed towards human-machine and machine-machine collaboration, development of collaboration platforms, enhancing resilience and sustainability, and building collaboration culture and awareness [124].
3.8. Autonomous Robots
Autonomous robots (AR) “are intelligent machines capable of performing tasks in the world by themselves, without explicit human control” [125]. They are the core of the autonomous production, which is an important part of the Smart Factory initiative. Smart Factory is one of the fundamental concepts of Industry 4.0 [126]. To achieve the functionality of the Autonomous Robot enabler (E8), three technological elements are identified (E8.1 to E8.3):
- E8.1.
- Perception: The key element in the development of ARs is perception, which consists of data acquisition and consequent extraction of useful information about the environment in which ARs operate. Due to the increased requirements for the ARs related to I4.0, this element is getting more challenging. The most basic task that robots can do, is positioning themselves relatively to some reference point in the environment. This can be done using various technologies: 2D and 3D digital cameras [127], GPS [128], lidar [129], ultrasonic and infrared sensors [130], magnetic sensors, etc. In addition, with the development of the soft robotics [131], new sensing principles are emerging [132].
- E8.2.
- Deliberation: In I4.0, there is an increasing need for flexible ARs that can be adapted to various tasks and interact to different situations, as well as integrated in any environment. In such a setting, the need for deliberation is highly expressed. Acting deliberately is related to the “actions that are motivated by some intended objectives and that are justified by sound reasoning with respect to these objectives” [133]. To act deliberately, the following functions are required [133]: planning, acting, observing, monitoring, goal reasoning, and learning. Descriptive, operational, open environment models, model acquisition, model verification issues, integration of the observing function with other deliberation functions and integration, as well as architecture issues are all open challenges within this element [133].
- E8.3.
- Autonomy: Autonomy in ARs is defined as “the extent to which a robot can sense the environment, plan based on that environment, and act upon that environment, with the intent of reaching some goal (either given to or created by the robot) without external control” [134]. Artificial Intelligence is of enormous importance for this purpose [135]. However, striking the right balance between robot autonomy and human control is a core challenge, in both technical and ethical terms [136]. An important concept related to autonomy is dependability—the “ability to deliver trusted services” [137]— which mainly focuses on fault management in terms of prevention, removal, forecasting, and tolerance [138].
3.9. Cybersecurity
Cybersecurity is “the ability to protect or defend the use of cyberspace from cyber-attacks” [139]. The International Telecommunication Union reports, in its Global Cybersecurity Index 2018 [140], that 42% of the 193 member states do not have a national cybersecurity strategy. This is alarming since the performance of most of the I4.0 enablers strongly rely on the applied cybersecurity measures. As a result, cybersecurity represents one of the major hurdles for the adoption of IIoT [141]. In addition, “digital development without cybersecurity is unsustainable” [142]. To achieve the functionality of the Cybersecurity enabler (E9), two technological elements are identified (E9.1 and E9.2):
- E9.1.
- Threat identification and detection: As the number and sophistication of cyber threats increases, security systems are being improved in detection capabilities [143]. In general, cyber threats can be of various kinds: malware, phishing and spear phishing, man-in-the-middle attacks, trojans, ransomware, denial or distributed denial of service attacks, attacks on IoT devices, data breaches, etc. All of these are related to Industry 4.0 at various degrees and also ways of fighting them are quite diverse [141,144,145,146]. These security threats are one of the biggest and ever-growing challenges for IIoT, and it is essential to substantially mitigate them for its success [147].
- E9.2.
- Data loss prevention: Data Loss Protection (DLP) denotes a set of tools and processes used to ensure that sensitive data is not lost, misused, or accessed by unauthorized users. In the vision of I4.0 a lot of processes are taking place in clouds, which makes DLP and cybersecurity in general even more challenging. A potential technology that gets mentioned often in relation to DLP is blockchain technology [148]. It is a promising technology from various aspects [149]: authentication, confidentiality, accountability and non-repudiation, traceability, and revocation.
4. Mapping Result
To help readers interpret this section and follow the discussion of the mapping result, Table 1 lists the SDGs and the corresponding abbreviations. The aggregated result of mapping the I4.0 enablers (E1–E9) into the 17 SDGs is shown inFigure 4. From each group result, each individual enabler score is calculated by summing the values of the elements scores and dividing it by the number of enabler elements and, then, the average of these calculated values is recorded inFigure 4. While the last row indicates the overall average influence of individual enabler on achieving the SDGs, the last column indicates the expected overall effect on individual SDG influenced by the nine enablers. In general, the I4.0 technological enablers are contributing positively towards achieving the sustainability goals as it can be deduced from the dominance of green color variants in Figure 4.

Table 1.
Abbreviations of the UN Sustainability Development Goals.
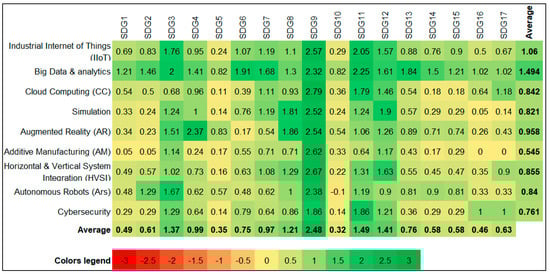
Figure 4.
Average scores of the enablers’ effect on the UN-SDGs.
The influences of the enablers on the SDGs lies between 1.49 and 0.54 scores, indicating the experts believe that the enablers contribution are between mild weak to mild strong positive effects. This is, also, noticeable from the homogeneity of colors in the last column in Figure 4. In contrast, the whole Figure 4shows a heterogeneity of colors, indicating the enablers differences in bestowing the SDGs.
E2: BD and analytics has the maximum overall effect on the SDGs at 1.49 score value. Indeed, this result is not surprising as decision making based on big data helps rigorously to achieve the SDGs (cf. Section 4.2). AM (E6) has the minimum influence at 0.54 score. This, in fact, noticeable as the AM row shows a strong positive influence only on industry, innovation, and infrastructure (SDG9) and either weak positive or no influence on the other SDGs (cf. Section 4.6).
The experts believe that the influence on the SDGs will be significantly different from one goal to another as it can be deduced from the variant of colors in the last row in Figure 4. So far, the strongest influence is recorded for the industry, innovation, and infrastructure (SDG9) at 2.48. This is followed by three goals: sustainable cities and communities (SDG11), responsible consumption and production (SDG12), and good health and well-being (SDG3) at 1.49, 1.41, and 1.37, respectively. There is a significant gap between the gained score for SDG9 and the second influenced goal (SDG3) at around one score value. This substantial gap reflects the fact that the I4.0 revolution focuses on reforming and empowering the industrial sectors and the UN sustainable agenda covers, not only this specific sector, but all the global economy aspects, maintaining human and environmental sustainability.
In contrast, the weakest influence is scored for reduced inequality (SDG10) at 0.32. Experts believe that I4.0 technologies will increase the income gap and so increase inequality. The gender equality (SDG5), peace and justice strong institutions (SDG16), and no poverty (SDG1) gained lowest scores after SDG10 at 0.35, 0.46, and 0.49, respectively. For these goals, experts think that the I4.0 technologies itself does not have a significant effect on these goals, and it could be employed to contribute either positively or negatively toward achieving these goals.
Looking at the scores of the individual cells in Figure 4, three scores are detectable and worth to discuss. Firstly, the maximum positive score is recorded for the influence of cloud computing (E2) to the industry, innovation, and infrastructure (SDG9) at 2.79. This value did not gain much consensus among the expert panel as deduced by a high standard deviation of 1.16 (cf. Figure 5). Secondly, a score of zero is recorded for the influence of AM enabler (E6) on both the peace and justice strong institutions (SDG16) and partnerships to achieve the goal (SDG17). It is worth to mention that these are the only cell that reach a strong consensus as concluded from the zero standard deviation (cf. Figure 5). Thirdly, the only negative score is recorded for the effect of the ARs (E8) on the reduced inequality (SDG10). This believe do not share a wide consensus among the experts as shown by the high standard deviation of 1.19.
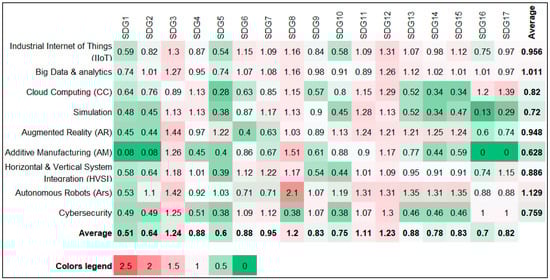
Figure 5.
Standard deviation of the enablers’ effect on the UN-SDGs.
Figure 5 shows the Standard Deviation (SD) of the scores carried out by the seven groups. Overall, the SD values indicate that the expert’s panels share a consensus about the influences of enablers on the SDGs as deduced from around 55% of the scores have SD values less than one. These values are shown in the table in green and lime colors. This implication is supported by the values in the last row, which indicate the overall effect of enablers on individual SDG. In total, 13 SDGs have average SD values less than one and only four goals have SD values between 1.11 and 1.24. The average SD values in the last column, which point out the overall influence of each enabler, are indicating the same. Only BD and analytics (E2) and ARs (E8) have average SD values greater than one at 1.01 and 1.13, respectively.
The two most controversial individuals’ scores are recorded for the influence of ARs (E8) and AM (E6) on decent work and economic growth (SDG8) at 2.1 and 1.51 SD, respectively. The 45% of scores that have SD values greater than one, which to some extent, indicates disagreement among the expert panels about these influences. This discrepancy reflects the diversity of engineering disciplines in the panels and the academic perspective in the seven countries, which to somehow manifest the overall perspectives in these countries.
4.1. Industrial Internet of Things
The result of mapping the IIoT elements (E1.1–E1.6) into the sustainability goals is shown in Figure 6, which shows the average scores of the IIoT technology elements provided by the seven groups. In general, the IIoT technology elements are contributing positively towards achieving the sustainability goals as it can be concluded from the dominance of green color variants in Figure 6. This positive influence is expected as the IIoT empowers the outputs of the industrial sector that has a substantial impact on achieving most of the sustainability goals.
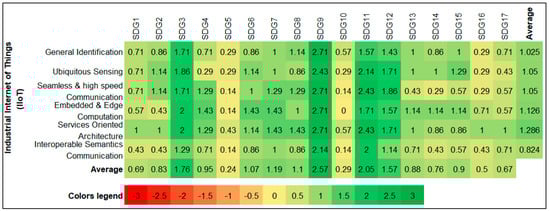
Figure 6.
Average scores of the effect of IoT elements on the UN-SDGs.
Looking at the average column, IIoT elements contribute to achieve the goals, on average, between 0.82 and 1.29 scores, which means they have a positive influence, to some extent, lies between mild weak to mild strong influences. They enable other technologies to contribute on achieving the goals. For example, general identification (E1.1) and ubiquitous sensing (E1.2) enable AI applications to improve farming activities, especially animal and fish farming, and so reduce hunger (SDG2). The animals are tracked and monitored to gather data that enable taking effective decisions to increase food productivity, and quality, improving animals’ health, as well as taking proactive decisions when diseases are identified at early stages.
SOA (E1.5) and semantics communication (E1.6) have the highest and the lowest influences, respectively, at average scores of 1.29 and 0.8. Services collaboration of SOA contributes significantly to improve human health and well-being (SDG3), industry (SDG9), and sustainable and smart cities (SDG1). In industry, for example, services collaboration allows manufacturers to produce products without the need to have all the equipment in their shop floor, where some functionalities can be accessed by using suitable services offered in the IIoT. SOA initiates synergies between components of the industrial sector, similarly in the health sector and smart cities. In the other hand, the influence of semantics communication (E1.6) on the goals is indirect, where it stimulates and strengthens the influence of other elements including seamless and real-time communication (E1.3), embedded and edge computation (E1.4), and SOA (E1.5). The interoperable semantics communication is the hidden spine of the IIoT that provides structural support and connectivity to other I4.0 technological elements.
Looking at the average scores shown in the last row, the overall effect of IIoT element technologies noticeably vary between goals. The industry, innovation, and infrastructure (SDG9) and the sustainable cities and communities (SDG11) gain the most benefits from these technologies as it can be noticed from the average scores of 2.57 and 2.05, respectively. This effect is expected as the focus of IIoT in fostering the industrial sector and stepping forwards the realization of smart and sustainable cites. In contrast, the IIoT elements do not have a significant influence on reducing the gender equality (SDG5) and income inequality (SDG10). In fact, IIoT offers many potentials that can consequently improve the living conditions sustainably, but the key issue is the way these technologies are used and integrated.
4.2. Big Data and Analytics
The influence of BD and analytics (E2) on the sustainability goals is presented in Figure 7, which shows the average scores of the BD and analytics elements provided by the seven groups. From the figure, in all cases, the technology has positive influences. Moreover, the overall influence is the highest between all the I4.0 enabling technologies (cf. Figure 7). The most influencing element is “Decision-making support” (E2.7). This is because decision-making technologies can be used in processes that help to reach any of the sustainability goals. Although, modern technologies are most often used to achieve sustainable industry, innovation, and infrastructure goal (SDG9). For example, sensors (E2.1) are used to collect data concerning energy consumption by machines, temperature of working engines, vibration of working equipment, condition of equipment construction elements, etc. [150,151]. The collected data is analyzed to identify the anomalies that can lead to failures, threaten the health and life of employees, cause additional costs or ecological disasters.
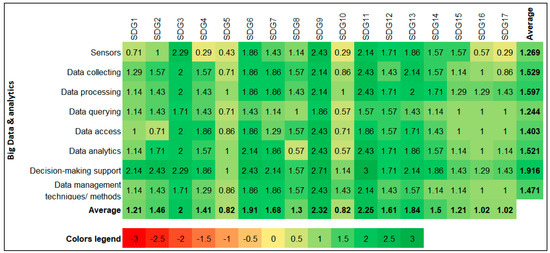
Figure 7.
Average scores of the effect of big data and analytics elements on the UN-SDGs.
The least influencing element on SDGs is “Data querying” (1.24) as the querying process alone cannot make significant change for example for reduced inequality (SDG10) although, wrongly performed process can influence on further made decisions. It was assessed that the goal most influenced by BD and analytics is the SDG9: industry, innovation, and infrastructure (2.32). Moreover, apart from “Data querying” (1.86) all other enablers received the scores higher than 2 for the SDG9.
BD and analytics also contributes to achieve zero hunger and clean water and sanitation (SDG2 and SDG6). Sensors can be used, for example, to monitor crops or to monitor water quality and to identify hazards [152]. The collected data can be used for analyzing the existing situation to identify regions with risk and predict future trends. Situations include water contamination or water level.
Technologies supporting decision-making process are also very important to achieve good health and well-being (SDG3). With the use of sensors that are embedded in different devices (i.e., Holter), human health can be monitored, providing vital signs such as the pulse. Such helpful functions are provided in small and common devices (i.e., smart watches). Gathering such data enable monitoring and predicting trends of human health in societies. In addition, availability of individuals’ health date enables physicians to diagnose diseases at early stages more accurately and track and monitor drugs effect, which speeds up the disease recovery time and drugs improvements [153].
The experts believe that the impact of BD and analytics on gender equality (SDG5) and reduced inequality (SDG10) goals is less than the other SDGs. The score in both cases is 0.82. Especially, when we are talking about sensors application, it is worth to emphasize that equality cannot be simply measured with the use of sensors and, moreover, the data can be collected with the use of other means. Generally, it can be concluded that BD and analytics is very important for sustainable development, which is also presented in other publications [154]. In addition, the implementation of its technology elements can lead to better understanding of the current situation and support identification of activities, which effectively and efficiently allows to achieve the SDGs.
4.3. Cloud Computing
The mapping results of the cloud computing technologies (E3) to the SDGs are shown in Figure 8, which shows the average scores of the cloud computing elements provided by the seven groups. It is noticeable that among all SDGs, the impact is very high in building resilient infrastructure, promote inclusive and sustainable industrialization and foster innovation (SDG9). It is a common understanding that cloud technology provides accessible and sustainable computing (E3.1) resources for a wide distribution of the users over the network. It thus offers a strong ICT support for the infrastructure development of industrialization and innovation, especially for the developing areas and small-and-medium enterprises. The cloud stakeholders do not need to heavily invest on the fundamental ICT facilities, while the computing resources in need can be hired from the cloud resource pool, which has a positive impact on the business in both developed and non-developed countries.
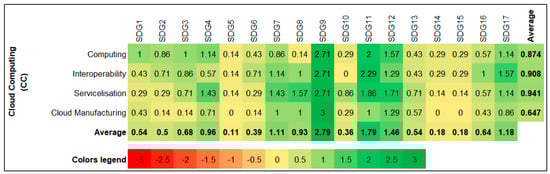
Figure 8.
Average scores of the effect of cloud computing elements on the UN-SDGs.
From the interoperability’s perspective (E3.2), the cloud system also provides strong support to guarantee that the heterogeneous components and technology modules in a complex I4.0 infrastructure can communicate and interact with each other smoothly. The cloud functions are integrated and servicelised in the same cloud structure under pre-defined protocols and interfaces when they are added to the cloud (E3.3). Hence, it guarantees the interoperability and accessibility of these functionalities and resources. Moreover, the technology extending cloud concept to the manufacturing domain (E3.4) is identified as the top impact to the affordable and clean anergy (SDG7), as the CC provides physical manufacturing services in the cloud as well. The manufacturing hardware and facilities are normally expensive, and, in many cases, the essential equipment must be invested but not frequently used. In the CC context, the missing manufacturing resource can be temporarily hired from the cloud, while the overall sustainability of the infrastructure development is achievable. From the bigger scale, the CC contributes to high energy efficiency and sustainability (SDG7) via global scheduling and optimization.
In addition, the impact of cloud computing technology is also identified on the sustainable cities and communities (SDG11). They make cities and human settlements inclusive, safe, resilient, and sustainable. In the I4.0 context, smart devices, monitors, cameras are needed in all places in the smart cities, as well as in human settlements. Thus, strong computing power is needed to support the huge amount of data and requests. Interoperability (E3.2) is especially important as the smart cities deploy more kinds of devices and data than industrial applications. Eventually, the cloud offers different types of services to process the data and request submitted from the smart cities and deliver the results in terms of scalable services (E3.3). It offers the fundamental knowledge and information structure for the development of sustainable cities and communities.
4.4. Simulation
The team of experts believe that overall impact of simulation enabler (E4) on SDGs achievement is positive as shown in Figure 9, which shows the average scores of the simulation elements provided by the seven groups. The aggregated value of the impact is 0.82 and is slightly lower than the arithmetic mean for all Industry 4.0 enablers, which is 0.91. This assessment shares a wide consensus by the experts as shown by the low SD of 0.72 (c.f. Figure 9), which is the second lowest SD among all I4.0 enablers after AM (E6).
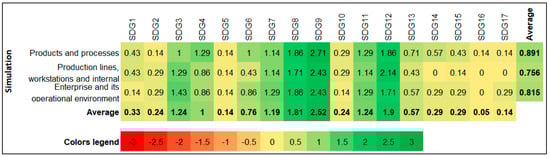
Figure 9.
Average scores of the effect of simulation elements on the UN-SDGs.
Figure 9 shows the result of mapping the effects of simulation technology elements (E4.1–E4.3) into the SDGs. Average results indicate positive to moderate positive effects. Figure 9 shows that simulation has the greatest impact towards the achievement of SDG9: build resilient infrastructure, promote inclusive and sustainable industrialization, and foster innovation. The reason for such a high assessment is widely justified in the literature through the applications of simulation methods to the validation of new products and processes [155], workstations and manufacturing lines modeling and analysis [156], supply chains analysis [157] and better understanding of the dynamics of business systems [76].
Experts also highly rated the impact of simulation on SDG12: ensure sustainable consumption and production patterns and SDG8: promote sustained, inclusive, and sustainable economic growth, full and productive employment and decent work for all at score values around 1.9 and 1.81, respectively. This is probably since both goals relate to productive employment and sustainable production patterns, which are often analyzed and improved by means of simulation methods. In contrast, the lowest impact of simulation is agreed to be on SDG16: promote peaceful and inclusive societies for sustainable development, provide access to justice for all and build effective, accountable, and inclusive institutions at all levels at score value of 0.05. This is because the goal does not refer to industry but focuses on building legal solutions to ensure sustainable development at national and international level. The influences of achieving gender equality and empowering all women and girls (SDG5) and strengthen the means of implementation and revitalize the global partnership for sustainable development (SDG17) have gained the same scores at 0.14.
The last column of Figure 9 shows that the overall influence of the three elements technology of simulations (E4.1–E4.3) is mild positive on all the SDGs ranged between 0.76–0.89. In summary, it can be stated that experts indicate a significant positive impact of simulation on those sustainable development goals that are related to I4.0 and its impact on environment (employment, consumption, use of natural resources).
4.5. Augmented Reality
Figure 10 shows the average scores of the AR elements provided by the seven groups. As shown in Figure 10, the overall influence of AR (E5) is quite related to the goals that need innovation in communication by the senses of sight and hearing, which are the core and key channels of VR. In fact, for this reason, it is understandable why E5.2–E5.4 technology elements have an average score higher than E5.1 and E5.5.
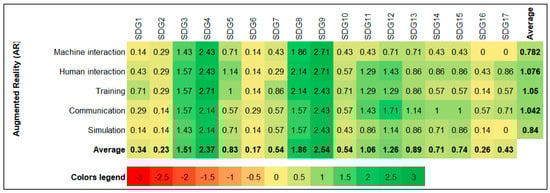
Figure 10.
Average scores of the effect of augmented reality elements on the UN-SDGs.
Therefore, focusing on the SDGs, the higher impact of this enabler is related to industrial, innovation, and infrastructure sectors (SDG9), as well as quality education (SDG4) in which an immersive real time simulation in a collaborative CPS boosts the productivity and the engagement of the users [83]. Other interesting outcomes emerged from economical (SDG8) and health (SDG3) frameworks reinforce the use of AR for enhancing the productivity and the ability of the workers as well as the mental workload (remote assisting and communication).
However, we argue that the remaining lower marks for the SDGs are due to a not completely direct influence of this technology. In fact, the fundamentals technology elements of AR allow the users to increase and improve his or her communication (E5.4) and collaboration (E5.2) skills, and this can certainly have an indirect influence on all the SDGs. For example, a documentary with AR on marine life can increase awareness of the care of life in the oceans (SDG14), a guided tour in AR of a wind or solar plant can help understand the importance of renewable energy (SDG7), or an installation in the public space that uses augmented reality to evoke empathy and build sustainable behavior among people regarding climate change (SDG13). Considering these aspects, we believe that AR can be used as a big tool either from an economical perspective both to communicate and raise awareness on urgent environmental aspects that affect our planet.
4.6. Additive Manufacturing
The aggregate mapping of AM on SDGs displays a slightly positive impact of this technology on the achievement of the 2030 Agenda ( Figure 11). AM got an overall average score of 0.54, which is the lowest among all the I4.0 enablers. This statement shares a wide consensus among the expert panel as shown by the low standard deviation results in Figure 11. Furthermore, looking at the disaggregated results of Figure 11, which shows the average scores of the AM elements provided by the seven groups, it is apparent that the low impact on SDGs regards all the technology elements of the AM, either the ones referring to the production technology or the ones concerned with product design methodology.
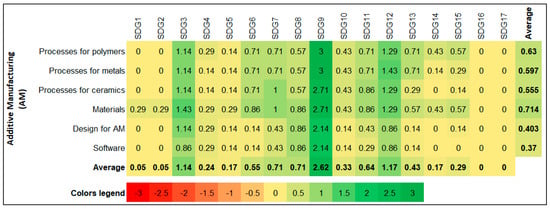
Figure 11.
Average scores of the effect of additive manufacturing elements on the UN-SDGs.
Nevertheless, considering the specific goals, it is possible to verify that AM has high impact on the SDG9: build resilient infrastructure, promote inclusive and sustainable industrialization and foster innovation. The average impact of all the AM technology elements on SDG9 is 2.62, indicating a strong positive influence. This result was expected, as AM will transform some old and disadvantageous manufacturing paradigms, allowing small factories in less favored areas of the world to be established, with limited resources and few infrastructures to produce complex and innovative products releasing from strict supply-chain requirements. It will be even possible to produce parts by cloud manufacturing, with lower concerns about where the production facility is and its adequacy to cope with an ever-changing demand.
It is important to point out that AM is a disruptive technology. Therefore, its impact on SDGs is not an automatic outcome of the additively manufactured products but requires a consistent effort to shift from present production and supplying practices to new ways of designing mass-customized products, supplying raw and semi-finished materials, and manufacturing them [158]. AM will be more likely for traditional manufacturing. The physical supports to production such as tools, fixtures, and dies will become redundant.
A recent occurrence of the impact of AM on SDG9 happened during the COVID-19-related crisis, in which several supply chains of essential medical devices have been interrupted, depriving some nations of fundamental tools to control the epidemic. Several factories had to reorganize their production to make these tools available [159], and AM provided them with the required flexibility [160].
4.7. Horizontal and Vertical System Integration
Figure 12 depicts the overall impact of Horizontal and Vertical System Integration (HVSI) enabler (E7), which shows the average scores of its seven elements provided by the seven groups. As shown in the figure, the team of experts concluded that the technology elements of this enabler (E7.1–E7.7) have positive influences. The experts believe E7 is a base ground for the other eight I4.0 enablers, which can be deduced from intermediate influences of score values around a positive one for most of the E7 elements. These opinions shared a good consensus among the experts, which can be concluded from the average SD of 0.89 (cf. Figure 5).
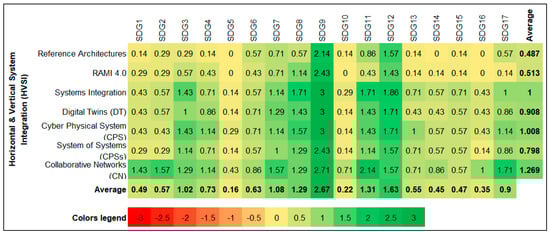
Figure 12.
Average scores of the effect of horizontal and vertical system integration elements on the UN-SDGs.
Looking to the effects of individual elements, shown in the last column of Figure 12, it is clear that CNs element (E7.7) is believed to have the highest influence among the E7 elements at 1.27 score. This result is justified in the literature from the importance of CNs to enable the realization of the I4.0 and achieve sustainability, especially in industry and innovation (SDG9) [122], partnership and collaboration (SDG17) [123], reasonable production and consumption (SDG12), and reduce extreme hunger and malnutrition (SDG2) [161]. System integration (E7.3), DT (E7.4), CPS (E7.6), and CPSs (E7.7) are followed at average scores values of 1, 0.91, 1.01, and 0.8, respectively. The experts believe that these four digital elements have a strong positive influence at scores around 3 and 2. This believe is shared undoubtedly among the experts for sustainable industry and innovation (SDGG9), and reasonable production and consumption (SDGG12). In contrast, the two reference related architecture elements (E7.1 and E7.2) are believed to have mild week influences at around 0.5. This is justified by the fact that architecture is a base ground of other I4.0 technological elements, including elements that have an indirect influence on the SDGs.
The effect of HVSI enabler (E7) on the UN-SDGs varied substantially from strong direct, and weak into very weak positive influences, as can be seen from the last row of Figure 12. The average impact on industry, innovation, and infrastructure (SDG9) has a 2.67 score, which indicates that almost all the elements of E7 have a strong positive influence to foster the industry and promote innovation environment. This result is not surprising, as the core objective of the I4.0 vision is to deploy existing technology and stimulate more advancements to improve the industrial sector [118]. HVSI enabler is also believed to have a mild positive impact on reasonable production and consumption (SDG12). This can be justified from the focus of the research on HVSI, enabling the development of technologies towards eco-friendly production and sustainable energy consumption [161]. The experts believe that HVSI has also mild positive impact, at around 1.3 score, on enhancing descent work and economic growth (SDG8) and sustainable cities and communities (SDG11). In contrast, the impact of HVSI on goals related to gender equality (SDG5) and social equality (SDG10) are believed to be limited.
4.8. Autonomous Robots
The results mapping the ARs elements (E8.1–E8.3) into the sustainability goals are pictured in Figure 13, which shows the average scores of the ARs elements provided by the seven groups. The prevailing green color variants indicate the positive effect of the three ARs elements on the SDGs.
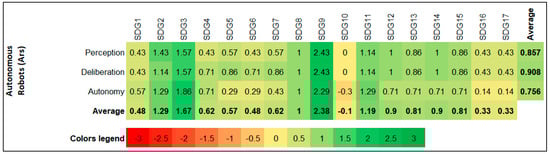
Figure 13.
Average scores of the effect of autonomous robot elements on the UN-SDGs.
Average scores for the ARs elements (last column in Figure 13) indicate indirect positive influence, with the autonomy element (E8.3) having the lowest and deliberation element (E8.2) the highest influence. Average scores for each SDG (last row in Figure 13) vary substantially and range from −0.1 for reduced inequality (SDG10) to 2.38 for industry, innovation, and infrastructure (SDG9). The strongest positive influence on SDG9 is expected since ARs enabler contributes to the development of quality, reliable, sustainable resilient infrastructure, and to sustainable industrialization, as well as enhance scientific research, which are all targets provided by the Inter-Agency and Expert Group on SDG Indicators (IAEG-SDGs) [6]. The second strongest positive effect is on good health and well-being (SDG3) due to the potential use of ARs in assisting elderly or ill people by monitoring their health, as well as in various clinical settings (e.g., surgeries). It is to be noted that when it comes to the ARs in broadest possible sense, autonomous weapons [162] can negatively affect not only SDG3 but also other SDGs. The ARs has a negative effect on SDG10, which is mainly due to the possible outsourcing of human duties (often the less paid ones) to the ARs.
The effect of the ARs elements is agreed to be less substantial on peace and justice strong institutions (SDG16) and partnerships for the goals (SDG17) SDGs. This can be explained by potential use of ARs for mentioned autonomous weapons and potential human rights violation [11]. The insignificant effect is also observed on no poverty (SDG1) and on clean water and sanitation (SDG6). The former effect is due to the potential negative effect of ARs on the employment rate especially in poor countries and on the overproduction and underemployment problem, while in the case of SDG6 one could argue that producing a robot also influences the environment. On the other hand, ARs, when operating, can be programmed in a way to lessen the ecological footprint. So, the overall effect could be balanced.
In comparison to the results of the mapping of other enablers to the SDGs, ARs enabler is not the key one when it comes to fulfilling the SDGs. This might be due to the above reasoning, as well as due to the fact that with an increasing number of ARs implemented in our everyday lives the chance of them to malfunction or getting hacked [163] is increasing. This can, of course, negatively impact all SDGs.
4.9. Cybersecurity
The results mapping the Cybersecurity technology elements (E9.1–E9.2) into the sustainability goals is depicted in Figure 14, which shows the average scores of the Cybersecurity elements provided by the seven groups. Like most of the other enablers, the results indicate an overall positive effect of these elements on SDGs.
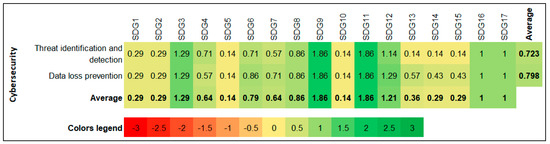
Figure 14.
Average scores of the effect of cybersecurity elements on the UN-SDGs.
Average scores for the Cybersecurity elements (last column in Figure 14) indicate indirect positive influence, with both elements having a similar influence. Average scores for each SDG (last row in Figure 14) range from 0.14 for gender equality (SDG5) and reduced inequality (SDG10) to 1.86 for industry, innovation, and infrastructure (SDG9), and sustainable cities and communities (SDG11). The strong influence on SDG9 is due to the contribution of the elements E9.1–E9.2 to quality, reliable, sustainable, and resilient infrastructure, and to the increase in access to information and communications technology. The strong influence on SDG11 is related to the concept of smart city, which mainly emphasizes issues related to sustainable transport system, sustainable urbanization, reduction in the adverse per capita environmental impact of the cities, and universal access to green and public spaces for all citizens. The lowest effect of Cybersecurity is on SDG5 and SDG10, which is most likely due to the existing gender bias in cybersecurity [164]. However, unequal access to cybersecurity tools increases the social, economic, and political inequalities, so this result is rather controversial for SDG10. Last, results show that average scores higher than or equal to one are achieved in SDGs that directly cover social aspect of sustainability (except for SDG9).
Cybersecurity has the second lowest score in comparison to the other enablers, which is due to its markedly indirect effect on the SDGs. In addition, part of this result might be due to the slight underestimation of the importance of this enabler. Such a case is not only within the research and pedagogic community, but also within the larger part of the society. This was confirmed during the ongoing coronavirus pandemic, which resulted in a wave of cyber-attacks, due to many people working and studying remotely while not being equipped with enough knowledge and resource to tackle these attacks [165].
4.10. Result Summary
This section summarizes the result of the mapping and interprets the main lessons learned from the study. The first lesson learned is depicted in Figure 15, which pictures the overall influence of I4.0 technologies on the 17 SDGs. The average normalized scores of the mapping are used to draw the graph. The graph shows significant differences of the influences on the 17 goals, ranged from very strong influence at around 0.9 for SDG9 to very weak influence at around 0.1 for SDG10. To interpret the result, the 17 goals can be grouped, based on the gained normalized scores, into four groups: high, middle, and low influenced goals at normalized scores of above 0.5, between 0.5 and 0.3, and below 0.3, respectively.
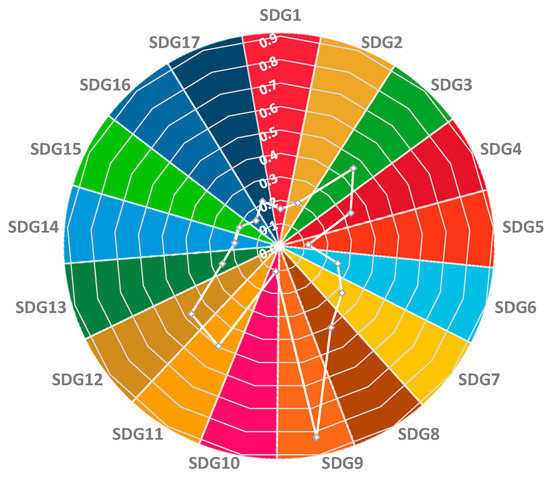
Figure 15.
Overall SDGs influences by I4.0 technologies.
SDG9: sustainable industry and innovation is the only goal in the high influenced category, which is the core focus of the I4.0. In the middle-influenced category, there are six goals: SDG3, SDG11, SDG12, SDG8, SDG7, and SDG4. However, these goals are focused on fields that are strongly related to the industry either by using industry output as their inputs (i.e., using manufactured equipment in health sector) or vice versa (i.e., the output of education supply the industry workforce). On the other hand, the remaining 10 goals in the lowest influenced group focus on thematic issues that do not have direct relations to the industry (i.e., justice, poverty, and hunger). The realization of I4.0 is promising to towards the achievements of the 7 goals that lays within the first and second categories. However, it is not expected to have substantial influences on the remaining goals.
The second lesson is learned from the expected contribution of I4.0 enabling technologies toward the achievement of the UN 2030 Agenda. The radar graph in Figure 16 outlines the expected influences of the nine enablers of I4.0. Normalized scores of the average mapping are used to draw this graph. E2: Big Data and Analytics enabler is believed to have the highest contribution and E6: Additive Manufacturing the lowest. The highest influence of the E2: Big Data and Analytics driven by the fact that it is applied in almost all the human aspects, from economy and social life to the environment. In contrast, E6: Additive Manufacturing contribution is confined to part of the economy, namely on industry and infrastructure. This is also noticeable from the remaining five enablers, where the scope of application is larger for technologies gained the highest scores (i.e., IIoT) and smaller for those gained quit lower scores (i.e., ARs). To achieve the sustainable agenda, more focus should be directed towards technologies that are applicable in wider fields.
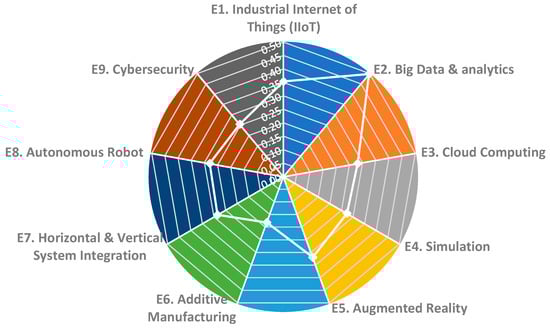
Figure 16.
Overall I4.0 enablers influences on SDGs.
The third lesson is about the contribution of I4.0 element technologies towards the sustainability. Figure 17 represents the elements that have average score above 1. Around 43% of the elements (19 out of 44) gained these high scores. These promising elements are mainly focused on five areas: decision making, data collection, processing and usage, communication, systems integrations, and human-machine collaboration. The summarize lesson from this figure is that the key success of I4.0 towards the goals’ achievement is the wide implementation of intelligent decision making (decision-making based on data) and exploit the ability of both human and machines, which could not be realized without human-machine collaboration, effective organization cooperation and efficient communication.
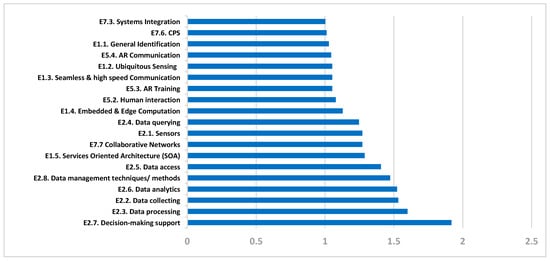
Figure 17.
Highest influencing I4.0 element technologies on the SDGs.
5. Conclusions
The paper presents the first formative attempt to investigate the sustainable influence of the I4.0 technologies in accordant with the 2030 Agenda of the United Nation. A panel of academic experts from different engineering disciplines investigated this complex influence. The paper contributes to a deeper perception of the fourth industrial revolution by identifying and defining 44 technology elements, as well as classifying these enabling elements into nine main categories. The influences of these heterogeneous elements are quantitatively mapped to the 17 sustainable development goals, consolidating the understanding of the relation between I4.0 and the SDGs.
This paper shows that I4.0 is enabled by a variety of technologies, which are known decades before the emerge of I4.0 vision, but the new in this area is how these technologies are being developed and applied in more intelligent, ubiquitous, and collaborative manners. Even though there are advancements in all the I4.0 technologies, there are still many challenges standing as barriers on the realization of the whole vision. Tremendous ongoing research efforts are trying to overcome these challenges.
The mapping shows that I4.0 technologies have a prominent influence toward the achievements of the SDGs. The expert’s panels believe that the influence varies between technologies and on different SDGs. The experts strongly believe that from the 17 goals SDG9: industry, innovation, and infrastructure, is the most influenced goal by I4.0 technologies. Additionally, a consensus has been reached that E2: Big Data and Analytics enabler has the highest contribution toward the achievement of the SDGs. This is driven by the fact that data-based technologies are widely applied in different fields from industry, education, and economy into social life, health, and the environment. Generally, the mapping showed that the majority of the I4.0 technologies are positively influencing the 2030 Agenda, and only very few elements are expected to negatively influence goals related to reducing inequality (SDG10). For such negative effect, the experts believe that the technology should be geared to comply with the SDGs, which can be achieved by initiating policies to turn the influences from negative into positive. Automation tax is an example of such an effective policy [19].
This work opens several further research opportunities. It is worth to study the influence of I4.0 technologies on individual goals, particularly goals that did not share wide consensus among the experts, which have standard deviation values greater than one. It is worth to investigate the reasons of the controversy mapping and discover whether it is caused by lack of explicitly in defining the SDGs, targets, or indicators, or by the ambiguity of the foreseeable influence of the technology.
Another direction is to extend this study by involving more experts from the academia and beyond. As this work is carried out by seven experts’ groups from seven institutions in six European countries, it is worth to extend the study to wider experts’ panels. This could be achieved by increasing number of experts, including more institutions and investigate it in other countries in Europe and overseas. In addition, as this work focuses on the academic view, it would be worth to conduct the mapping from the perspective of experts from industry, the economy as well as form human rights and environmental protection. Investigating the influence from different perspectives provides a complete picture and should help policymakers to initiate policies and actions that consider and compromise different views.
Our next step is to evaluate the current maturity level of I4.0 technologies, especially technologies that have high positive influence on the SDGs, which is essential to enable policies update in many sectors, including education, industry, and governmental. For industry, it helps to make plans to apply mature technologies and to prepare the infrastructure for transformation into semi-mature technologies soon. In education, knowing the maturity level of technologies enables updating curriculum such that the level of taught knowledge is linked to the technology maturity level. For government, it allows rules initiation that enforce using more sustainable and mature technologies (i.e., tax), and to encourage initiatives toward adopting and advancing non-matured technologies (i.e., bonuses, or loans with low-interest rate).
Supplementary Materials
The following are available online at https://www.mdpi.com/2071-1050/13/5/2560/s1, Supplementary Excel sheet.
Author Contributions
Conceptualization, M.M.M., P.F., A.M., D.A., D.S. and N.L.; methodology, M.M.M., P.F., A.M., D.S. and N.L.; software, M.M.M.; validation, M.M.M.; formal analysis, M.M.M., A.M., P.P., D.A., D.S. and N.L.; investigation, M.M.M.; resources, M.M.M.; data curation, M.M.M.; writing—original draft preparation, M.M.M., P.P., M.M., R.C., S.N.-H., X.V.W., P.C.P. and P.L.; writing—review and editing, M.M.M., A.M., M.L., J.B., M.F., P.L., P.M., D.S. and N.L.; visualization, M.M.M., and F.L.; supervision, D.A., M.L., J.B., E.B., and N.L.; project administration, A.M., and D.S.; funding acquisition, P.F., A.M., M.L., J.B., M.F., D.S. and N.L. All authors have read and agreed to the published version of the manuscript.
Funding
This work is part of an ongoing research project “MAESTRO—Manufacturing Education for a Sustainable fourth Industrial Revolution”(project No 2019-1-SE01-KA203-060572) co-funded by ERASMUS+ of the European Commission.
Institutional Review Board Statement
Not applicable.
Informed Consent Statement
Not applicable.
Conflicts of Interest
The authors declare no conflict of interest.
References
- Davies, R. Industry 4.0 Digitalisation for Productivity and Growth, Luxembourg. 2015. Available online: http://www.europarl.europa.eu/thinktank/en/document.html?reference=EPRS_BRI%282015%29568337 (accessed on 25 February 2021).
- Shrouf, F.; Ordieres, J.; Miragliotta, G. Smart factories in Industry 4. In 0: A review of the concept and of energy management approached in production based on the Internet of Things paradigm. In Proceedings of the IEEE International Conference on Industrial Engineering and Engineering Management, Selangor, Malaysia, 9–12 December 2014; pp. 697–701. [Google Scholar] [CrossRef]
- Bonilla, S.H.; Silva, H.R.O.; Terra, M.; Gonçalves, R.F.; Sacomano, J.B. Industry 4.0 and Sustainability Implications: A Scenario-Based Analysis of the Impacts and Challenges. Sustainability 2018, 2–24. [Google Scholar] [CrossRef]
- Dossou, P.-E. Impact of Sustainability on the supply chain 4.0 performance. Proc. Manuf. 2018, 17, 452–459. [Google Scholar] [CrossRef]
- Pizzi, S.; Caputo, A.; Corvino, A.; Venturelli, A. Management research and the UN sustainable development goals (SDGs): A bibliometric investigation and systematic review. J. Clean. Prod. 2020, 276, 124033. [Google Scholar] [CrossRef]
- UN Statistical Commission. Global Indicator Framework for the Sustainable Development Goals and Targets of the 2030 Agenda for Sustainable Development; UN Statistical Commission: New York, NY, USA, 2017. [Google Scholar]
- Hák, T.; Janoušková, S.; Moldan, B. Sustainable Development Goals: A need for relevant indicators. Ecol. Indic. 2016, 60, 565–573. [Google Scholar] [CrossRef]
- Stafford-Smith, M.; Griggs, D.; Gaffney, O.; Ullah, F.; Reyers, B.; Kanie, N.; Stigson, B.; Shrivastava, P.; Leach, M.; O’Connell, D. Integration: The key to implementing the Sustainable Development Goals. Sustain. Sci. 2017, 12, 911–919. [Google Scholar] [CrossRef] [PubMed]
- Nerini, F.F.; Tomei, J.; To, L.S.; Bisaga, I.; Parikh, P.; Black, M.; Borrion, A.; Spataru, C.; Broto, V.C.; Anandarajah, G.; et al. Mapping synergies and trade-offs between energy and the Sustainable Development Goals. Nat. Energy 2018, 3, 10–15. [Google Scholar] [CrossRef]
- Khamis, A.; Li, H.; Prestes, E.; Haidegger, T. AI: A Key Enabler of Sustainable Development Goals, Part 1 [Industry Activities]. IEEE Robot. Autom. Mag. 2019, 26. [Google Scholar] [CrossRef]
- Khamis, A.; Li, H.; Prestes, E.; Haidegger, T. AI: A Key Enabler for Sustainable Development Goals: Part 2 [Industry Activities]. IEEE Robot. Autom. Mag. 2019, 26, 122–127. [Google Scholar] [CrossRef]
- Vinuesa, R.; Azizpour, H.; Leite, I.; Balaam, M.; Dignum, V.; Domisch, S.; Felländer, A.; Langhans, S.D.; Tegmark, M.; Nerini, F.F. The role of artificial intelligence in achieving the Sustainable Development Goals. Nat. Commun. 2020, 11. [Google Scholar] [CrossRef]
- Gupta, J.; Vegelin, C. Sustainable development goals and inclusive development. Int. Environ. Agreements Polit. Law Econ. 2016, 16, 433–448. [Google Scholar] [CrossRef]
- MAESTRO. Manufacturing Education for a Sustainable Fourth Industrial Revolution (MAESTRO), Intelligence Automotive Centre, Wolfson School of Mechanical and Electronics Manufacturing Engineering. 2020. Available online: https://www.lboro.ac.uk/research/intelligent-automation/research/projects/maestro/ (accessed on 25 February 2021).
- Gilchrist, A. Introducing I4.0; Apress: Berkeley, CA, USA, 2016. [Google Scholar] [CrossRef]
- Saucedo-Martínez, M.J.A.; Pérez-Lara, J.A.; Marmolejo-Saucedo, T.E.; Salais-Fierro, P. Vasant, Industry 4.0 framework for management and operations: A review. J. Ambient Intell. Humaniz. Comput. 2018, 9, 789–801. [Google Scholar] [CrossRef]
- Alcácer, V.; Cruz-Machado, V. Engineering Science and Technology, an International Journal Scanning the Industry 4.0: A Literature Review on Technologies for Manufacturing Systems. Eng. Sci. Technol. Int. J. 2019, 22, 899–919. [Google Scholar] [CrossRef]
- MicKensy, McKinsey & Company. 2020. Available online: https://www.mckinsey.com/ (accessed on 25 February 2021).
- Zhang, P. Automation, wage inequality and implications of a robot tax. Int. Rev. Econ. Financ. 2019, 59, 500–509. [Google Scholar] [CrossRef]
- Sezer, O.B.; Dogdu, E.; Ozbayoglu, A.M. Context-Aware Computing, Learning, and Big Data in Internet of Things: A Survey. IEEE Internet Things J. 2018, 5, 1–27. [Google Scholar] [CrossRef]
- Liu, C.H.; Yang, B.; Liu, T. Efficient naming, addressing and profile services in Internet-of-Things sensory environments. Ad Hoc Networks. 2014, 18, 85–101. [Google Scholar] [CrossRef]
- Uddin, M.Y.S.; Akbar, M.M. Addressing techniques in wireless sensor networks: A short survey. In Proceedings of the 4th International Conference on Electrical and Computer Engineering ICECE, Dhaka, Bangladesh, 19–21 December 2006; pp. 581–584. [Google Scholar] [CrossRef]
- Burhan, M.; Rehman, R.A.; Khan, B.; Kim, B.S. IoT elements, layered architectures and security issues: A comprehensive survey. Sensors 2018, 18, 1–37. [Google Scholar] [CrossRef] [PubMed]
- Mabkhot, M.M.; Krid, M.; Al-Samhan, A.M.; Salah, B. An Ontology for Sensors Knowledge Management in Intelligent Manufacturing Systems. In Industry 4.0—Shaping the Future of the Digital World; Taylor & Francis: Manchester, UK, 2019. [Google Scholar]
- Shaikh, F.K.; Chowdhry, B.S.; Ammari, H.M.; Shah, A.; Uqaili, M.A. Communications in Computer and Information Science. In Proceedings of the Wireless Sensor Networks for Developing Countries, Jamshoro, Pakistan, 24–26 April 2013; Springer: Berlin, Germany, 2013. [Google Scholar] [CrossRef]
- Plessky, V.P. Review on saw RFID tags. In Proceedings of the 2009 IEEE International Frequency Control Symposium Joint with the 22nd European Frequency and Time Forum, Besancon, France, 20–24 April 2009; pp. 14–23. [Google Scholar] [CrossRef]
- Cao, Z.; Chen, P.; Ma, Z.; Li, S.; Gao, X.; Wu, R.X.; Pan, L.; Shi, Y. Near-field communication sensors. Sensors 2019, 19. [Google Scholar] [CrossRef]
- Darroudi, S.M.; Gomez, C. Bluetooth low energy mesh networks: A survey. Sensors 2017, 17. [Google Scholar] [CrossRef]
- Bajracharya, R.; Shrestha, R.; Ali, R.; Musaddiq, A.; Kim, S.W. LWA in 5G: State-of-the-Art Architecture, Opportunities, and Research Challenges. IEEE Commun. Mag. 2018, 56, 134–141. [Google Scholar] [CrossRef]
- I-scoop. Edge Computing: The What, How and Where of the Edge. 2020. Available online: https://www.i-scoop.eu/edge-computing-explained/ (accessed on 25 February 2021).
- Rayes, A.; Salam, S.; Rayes, A.; Salam, S. A Review on Service Oriented Architectures for Internet of Things (IoT). In Proceedings of the 2nd International Conference on Trends in Electronics and Informatics (ICOEI 2018), IEEE, Tirunelveli, India, 11–12 May 2018; pp. 466–470. [Google Scholar] [CrossRef]
- Kumar, V.R.S.; Khamis, A.; Fiorini, S.; Carbonera, J.L.; Alarcos, A.O.; Habib, M.; Goncalves, P.; Li, H.; Olszewska, J.I. Ontologies for Industry 4.0. Knowl. Eng. Rev. 2019, 34, 1–14. [Google Scholar] [CrossRef]
- Thuluva, A.S.; Anicic, D.; Rudolph, S. Semantic Web of Things for Industry 4.0. 2017. Available online: http://ceur-ws.org/Vol-1875/paper3.pdf (accessed on 25 February 2021).
- Ren, S.; Zhao, X.; Huang, B.; Wang, Z.; Song, X. A framework for shopfloor material delivery based on real-time manufacturing big data. J. Ambient Intell. Humaniz. Comput. 2019, 10, 1093–1108. [Google Scholar] [CrossRef]
- Minelli, M.; Chambers, M.; Dhiraj, A. Big Data, Big Analytics: Emerging Business Intelligence and Analytic Trends for Today’s Businesses; Wiley: Hoboken, NJ, USA, 2013. [Google Scholar]
- Sharma, N.; Shamkuwar, M. Big Data Analysis in Cloud and Machine Learning; Springer: Singapore, 2019; pp. 51–85. [Google Scholar] [CrossRef]
- Bae, J.; Falkman, G.; Helldin, T.; Riveiro, M. Visual Data Analysis; Springer: Cham, Switzerland, 2019; pp. 133–155. [Google Scholar] [CrossRef]
- Usha, D.; Jenil, A. A Survey of Big Data Processing in Perspective of Hadoop and Mapreduce. Int. J. Curr. Eng. Technol. 2014, 60244, 602–606. [Google Scholar]
- Miloslavskaya, N.; Tolstoy, A. Big Data, Fast Data and Data Lake Concepts. Proc. Comput. Sci. 2016, 300–305. [Google Scholar] [CrossRef]
- Lydia, E.L.; Swarup, M.B. Big Data Analysis using Hadoop components like Flume, MapReduce, Pig and Hive. Int. J. Comput. Sci. Eng. Technol. 2015, 5, 390–394. [Google Scholar]
- Oussous, A.; Benjelloun, F.Z.; Lahcen, A.A.; Belfkih, S. Big Data technologies: A survey. J. King Saud Univ. Comput. Inf. Sci. 2018, 30, 431–448. [Google Scholar] [CrossRef]
- Dinsmore, T.W. Streaming Analytics. In Disruptive Analytics; Apress: Berkeley, CA, USA, 2016; pp. 117–144. [Google Scholar] [CrossRef]
- Beyer, K.S.; Ercegovac, V.; Gemulla, R.; Balmin, A.; Eltabakh, M.; Kanne, C.C.; Ozcan, F.; Shekita, E.J. Jaql: A scripting language for large scale semistructured data analysis. Proc. VLDB Endow. 2011, 4, 1272–1283. [Google Scholar] [CrossRef]
- Sakr, S. General-Purpose Big Data Processing Systems. In SpringerBriefs Computer Science; Springer: Berlin, Germany, 2016; pp. 15–39. [Google Scholar] [CrossRef]
- Lyko, K.; Nitzschke, M.; Ngomo, A.C.N. Big data acquisition. In New Horizons a Data-Driven Econ. A Roadmap Usage Exploit; Big Data Eur.; Springer International Publishing: Berlin, Germany, 2016; pp. 39–61. [Google Scholar] [CrossRef]
- Qiu, J.; Wu, Q.; Ding, G.; Xu, Y.; Feng, S. A survey of machine learning for big data processing. EURASIP J. Adv. Signal Process. 2016, 2016, 1–16. [Google Scholar] [CrossRef]
- Paśko, Ł.; Litwin, P. Methods of Data Mining for Quality Assurance in Glassworks. In IFIP Advances in Information and Communication Technology; Springer: New York, NY, USA, 2019; pp. 185–192. [Google Scholar] [CrossRef]
- Lublinsky, B.; Smith, K.T.; Yakubovich, A. Professional Hadoop Solutions; Wiley: Hoboken, NJ, USA, 2013. [Google Scholar]
- Mell, P.; Grance, T. The NIST Definition of Cloud Computing; National Institute of Standards and Technology: Gaithersburg, MD, USA, 2011; Volume 800, p. 7, NIST Special Publication. [Google Scholar]
- Microsoft. Windows Azure Platform _ Microsoft Cloud Services 2012; Microsoft: Redmond, WA, USA, 2012. [Google Scholar]
- Amazon. Amazon Elastic Compute Cloud (EC2), 2012; Amazon: Seattle, WA, USA, 2014. [Google Scholar]
- IBM. IBM Cloud; IBM: Armonk, NY, USA, 2020. [Google Scholar]
- Google. Compute Engine: Virtual Machines; Google Cloud; Google: Mountain View, CA, USA, 2020. [Google Scholar]
- OpenStack. Home» OpenStack Open Source Cloud Computing Software; OpenInfra: Berlin, Germany, 2013. [Google Scholar]
- Apache CloudStack. Apache CloudStack: Open Source Cloud Computing; The Apache Software Foundation: Forest Hill, MD, USA, 2013. [Google Scholar]
- Apach. Apache Mesos; The Apache Software Foundation: Forest Hill, MD, USA, 2020. [Google Scholar]
- Sheth, A.P. Changing focus on interoperability in information systems: From system, syntax, structure to semantics. In Interoperating Geographic Information Systems; Springer: Berlin, Germany, 1999; pp. 5–29. [Google Scholar]
- Bishr, Y. Overcoming the semantic and other barriers to GIS interoperability. Int. J. Geogr. Inf. Sci. 1998, 12, 299–314. [Google Scholar] [CrossRef]
- ATHENA Consortium. D.A4.2: Specification of Interoperability Framework and Profiles, Guidelines and Best Practices. 25 February 2007. Available online: http://interop-vlab.eu/athena/ (accessed on 25 February 2021).
- Wang, X.V.; Wang, L.; Gördes, R.; Gordes, R. Interoperability in cloud manufacturing: A case study on private cloud structure for SMEs. Int. J. Comput. Integr. Manuf. 2018, 31, 653–663. [Google Scholar] [CrossRef]
- Tao, F.; Zhang, L.; Venkatesh, V.C.; Luo, Y.; Cheng, Y. Cloud manufacturing: A computing and service-oriented manufacturing model. Proc. Inst. Mech. Eng. Part B J. Eng. Manuf. 2011, 225, 1969–1976. [Google Scholar] [CrossRef]
- Zhang, L.; Luo, Y.; Tao, F.; Li, B.H.; Ren, L.; Zhang, X.; Guo, H.; Cheng, Y.; Hu, A.; Liu, Y. Cloud manufacturing: A new manufacturing paradigm. Enterp. Inf. Syst. 2014, 8, 167–187. [Google Scholar] [CrossRef]
- Wang, X.V.; Wang, L.; Mohammed, A.; Givehchi, M. Ubiquitous manufacturing system based on Cloud: A robotics application. Robot. Comput. Integr. Manuf. 2016, 45, 116–125. [Google Scholar] [CrossRef]
- Xun, X. From cloud computing to cloud manufacturing. Robot. Comput. Integr. Manuf. 2012, 28, 75–86. [Google Scholar] [CrossRef]
- Wang, X.V.; Wang, L. From Cloud manufacturing to Cloud remanufacturing: A Cloud-based approach for WEEE recovery. Manuf. Lett. 2014, 2, 91–95. [Google Scholar] [CrossRef]
- Li, B.H.; Zhang, L.; Wang, S.L.; Tao, F.; Cao, J.W.; Jiang, X.D.; Song, X.; Chai, X.D. Cloud Manufacturing: A New Service-oriented Networked Manufacturing Model. Comput. Integr. Manuf. Syst. 2010, 16, 1–7. [Google Scholar]
- Negahban, A.; Smith, J.S. Simulation for manufacturing system design and operation: Literature review and analysis. J. Manuf. Syst. 2014, 33, 241–261. [Google Scholar] [CrossRef]
- Krishnamurthi, R.; Kumar, A. Modeling and Simulation for Industry 4.0. In A Roadmap to Industry 4.0: Smart Production, Sharp Business and Sustainable Development; Springer: Berlin, Germany, 2020; pp. 127–141. [Google Scholar] [CrossRef]
- Van Dang, T.; Dong, T.; Gross, D. Finite Element Modeling of the TECCO Protection System for Rock-Fall under Impact Loading. In Lecture Notes in Civil Engineering; Springer: Berlin, Germany, 2020; pp. 131–136. [Google Scholar] [CrossRef]
- Kirkup, S. The boundary element method in acoustics: A survey. Appl. Sci. 2019, 9, 1642. [Google Scholar] [CrossRef]
- Navarro, J.M.; Escolano, J. Simulation of building indoor acoustics using an acoustic diffusion equation model. J. Build. Perform. Simul. 2015, 8, 3–14. [Google Scholar] [CrossRef]
- Bachmann, J.; Hidalgo, C.; Bricout, S. Environmental analysis of innovative sustainable composites with potential use in aviation sector—A life cycle assessment review. Sci. China Technol. Sci. 2017, 60, 1301–1317. [Google Scholar] [CrossRef]
- Zhang, W.; Ren, H.; Wang, Z.; Liu, W.K.; Chen, W.; Zeng, D.; Su, X.; Cao, J. An integrated computational materials engineering method for woven carbon fiber composites preforming process. In AIP Conference Proceedings; American Institute of Physics Inc.: College Park, MD, USA, 2016; p. 170036. [Google Scholar] [CrossRef]
- Buckingham, M.A.; Cunningham, W.; Bull, S.D.; Buchard, A.; Folli, A.; Murphy, D.M.; Marken, F. Electrochemically Driven C−H Hydrogen Abstraction Processes with the Tetrachloro-Phthalimido-N-Oxyl (Cl4PINO) Catalyst. Electroanalysis 2018, 30, 1698–1705. [Google Scholar] [CrossRef]
- Guilardi, L.; Soares, P.; Werner, A.; N, d.; Pereira, G.; Kleverlaan, C.; Rippe, M.; Valandro, L. Fatigue performance of distinct CAD/CAM dental ceramics. J. Mech. Behav. Biomed. Mater. 2020, 103, 103540. [Google Scholar] [CrossRef]
- Rodič, B. Industry 4.0 and the New Simulation Modelling Paradigm. Organizacija. 2017, 50, 193–207. [Google Scholar] [CrossRef]
- Rosen, R.; von Wichert, G.; Lo, G.; Bettenhausen, K.D. About the importance of autonomy and digital twins for the future of manufacturing. In IFAC-PapersOnLine; Elsevier: Amsterdam, The Netherlands, 2015; pp. 567–572. [Google Scholar] [CrossRef]
- Turner, C.J.; Hutabarat, W.; Oyekan, J.; Tiwari, A. Discrete Event Simulation and Virtual Reality Use in Industry: New Opportunities and Future Trends. IEEE Trans. Human-Machine Syst. 2016, 46, 882–894. [Google Scholar] [CrossRef]
- Kaihara, T.; Katsumura, Y.; Suginishi, Y.; Kadar, B. Simulation model study for manufacturing effectiveness evaluation in crowdsourced manufacturing. CIRP Ann. Manuf. Technol. 2017, 66, 445–448. [Google Scholar] [CrossRef]
- Wang, S.; Wan, J.; Zhang, D.; Li, D.; Zhang, C. Towards smart factory for Industry 4.0: A self-organized multi-agent system with big data based feedback and coordination. Comput. Networks. 2015, 101, 158–168. [Google Scholar] [CrossRef]
- Yazan, D.M.; Fraccascia, L. Sustainable operations of industrial symbiosis: An enterprise input-output model integrated by agent-based simulation. Int. J. Prod. Res. 2020, 58, 392–414. [Google Scholar] [CrossRef]
- Rabelo, L.; Helal, M.; Jones, A.; Min, H.S. Enterprise simulation: A hybrid system approach. Int. J. Comput. Integr. Manuf. 2005, 18, 498–508. [Google Scholar] [CrossRef]
- Gorecky, D.; Schmitt, M.; Loskyll, M.; Zühlke, D. Human-Computer-Interaction in the Industry 4. In 0 Era. In Proceedings of the 2014 12th IEEE International Conference on Industrial Informatics (INDIN 2014), Porto Alegre, Brazil, 27–30 July 2014; pp. 289–294. [Google Scholar]
- Ong, S.K.; Yuan, M.L.; Nee, A.Y.C. Augmented reality applications in manufacturing: A survey. Int. J. Prod. Res. 2008, 46, 2707–2742. [Google Scholar] [CrossRef]
- Syberfeldt, A.; Danielsson, O.; Gustavsson, P. Augmented Reality Smart Glasses in the Smart Factory. IEEE Access. 2014, 5, 9118–9130. [Google Scholar] [CrossRef]
- Nee, A.Y.C.; Ong, S.K.; Chryssolouris, G.; Mourtzis, D. Augmented reality applications in design and manufacturing. CIRP Ann. Manuf. Technol. 2012, 61, 657–679. [Google Scholar] [CrossRef]
- Billinghurst, M.; Kato, H. Collaborative augmented reality. Commun. ACM. 2002, 45, 64–70. [Google Scholar] [CrossRef]
- de Crescenzio, F.; Fantini, M.; Persiani, F.; di Stefano, L.; Azzari, P.; Salti, S. Augmented reality for aircraft maintenance training and operations support. IEEE Comput. Graph. Appl. 2011, 31, 96–101. [Google Scholar] [CrossRef]
- Dangelmaier, W.; Fischer, M.; Gausemeier, J.; Grafe, M.; Matysczok, C.; Mueck, B. Virtual and augmented reality support for discrete manufacturing system simulation. Comput. Ind. 2005, 56, 371–383. [Google Scholar] [CrossRef]
- Calignano, F.; Manfredi, D.; Ambrosio, E.P.; Biamino, S.; Lombardi, M.; Atzeni, E.; Salmi, A.; Minetola, P.; Iuliano, L.; Fino, P. Overview on additive manufacturing technologies. Proc. IEEE. 2017, 105. [Google Scholar] [CrossRef]
- Minetola, P.; Eyers, D.R. Additive Manufacturing as a Driver for the Sustainability of Short-Lifecycle Customized Products: The Case Study of Mobile Case Covers; Springer: Berlin, Germany, 2017. [Google Scholar] [CrossRef]
- Berman, B. 3-D printing: The new industrial revolution. Bus. Horiz. 2012. [Google Scholar] [CrossRef]
- Atzeni, E.; Iuliano, L.; Marchiandi, G.; Minetola, P.; Salmi, A.; Bassoli, E.; Denti, L.; Gatto, A. Additive manufacturing as a cost-effective way to produce metal parts. In High Value Manufacturing: Advanced Research in Virtual and Rapid Prototyping, Proceedings of the 6th International Conference on Advanced Research in Virtual and Rapid Prototyping, Leiria, Portugal. 2013; CRC Press: Boca Raton, FL, USA, 2014; VR@P 2013. [Google Scholar] [CrossRef]
- Galati, M.; Minetola, P. Analysis of density, roughness, and accuracy of the atomic diffusion additive manufacturing (ADAM) process for metal parts. Materials 2019, 12. [Google Scholar] [CrossRef] [PubMed]
- Zocca, A.; Colombo, P.; Gomes, C.M.; Günster, J. Additive Manufacturing of Ceramics: Issues, Potentialities, and Opportunities. J. Am. Ceram. Soc. 2015. [Google Scholar] [CrossRef]
- Jan Deckers, J.-P.K.; Vleugels, J. Title Additive Manufacturing of Ceramics: A Review. J. Ceram. Sci. Technol. 2014, 5, 245–260. [Google Scholar]
- Bourell, D.; Kruth, J.P.; Leu, M.; Levy, G.; Rosen, D.; Beese, A.M.; Clare, A. Materials for additive manufacturing. CIRP Ann. Manuf. Technol. 2017. [Google Scholar] [CrossRef]
- Ingarao, G.; Priarone, P.C. A comparative assessment of energy demand and life cycle costs for additive- and subtractive-based manufacturing approaches. J. Manuf. Process. 2020, 56, 1219–1229. [Google Scholar] [CrossRef]
- Priarone, P.C.; Ingarao, G. Towards criteria for sustainable process selection: On the modelling of pure subtractive versus additive/subtractive integrated manufacturing approaches. J. Clean. Prod. 2017. [Google Scholar] [CrossRef]
- Liu, J.; Gaynor, A.T.; Chen, S.; Kang, Z.; Suresh, K.; Takezawa, A.; Li, L.; Kato, J.; Tang, J.; Wang, C.C.L.; et al. Current and future trends in topology optimization for additive manufacturing. Struct. Multidiscip. Optim. 2018. [Google Scholar] [CrossRef]
- Song, X.; Feih, S.; Zhai, W.; Sun, C.-N.; Li, F.; Maiti, R.; Wei, J.; Yang, Y.; Oancea, V.; Brandt, L.R.; et al. Advances in additive manufacturing process simulation: Residual stresses and distortion predictions in complex metallic components. Mater. Des. 2020, 193, 108779. [Google Scholar] [CrossRef]
- Lin, Y.-C.; Hung, M.-H.; Huang, H.-C.; Chen, C.-C.; Yang, H.-C.; Hsieh, Y.-S.; Cheng, F.-T. Development of Advanced Manufacturing Cloud of Things (AMCoT)—A Smart Manufacturing Platform. IEEE Robot. Autom. Lett. 2017, 2, 1. [Google Scholar] [CrossRef]
- COPADATA, Industry 4.0: Networking, Communication and Efficiency, COPADATA. 2020. Available online: https://www.copadata.com/en/industries/horizontal-vertical-integration/ (accessed on 25 February 2021).
- Ferreira, D.R. Inter-Organizational Processes. In Enterprise System Integrations; Springer Nature: Cham, Switzerland, 2013. [Google Scholar] [CrossRef]
- Stock, T.; Obenaus, M.; Kunz, S.; Kohl, H. Industry 4.0 as enabler for a sustainable development: A qualitative assessment of its ecological and social potential. Process Saf. Environ. Prot. 2018, 118, 254–267. [Google Scholar] [CrossRef]
- Williams, T.J.; Li, H. PERA and GERAM—enterprise reference architectures in enterprise integration. In Information Infrastructure Systems for Manufacturing II; IFIP TC5 WG5.3/5.7, Proceedings of the International Working Conference on the Design of Information Infrastructure Systems for Manufacturing, Fort Worth, TX, USA, 18–20 May 1998; Mills, J.J., Kimura, F., Eds.; Springer: Boston, MA, USA, 1999; pp. 3–30. [Google Scholar] [CrossRef]
- Lin, S.-W.; Miller, B.; Durand, J.; Bleakley, G.; Chigani, A.; Martin, R.; Murphy, B.; Crawford, M. The Industrial Internet of Things Volume G1: Reference Architecture. 2017. Available online: https://www.mendeley.com/catalogue/industrial-internet-things-volume-g1-reference-architecture-1/ (accessed on 25 February 2021).
- Bader, S.R.; Maleshkova, M.; Lohmann, S. Structuring reference architectures for the industrial Internet of Things. Futur. Internet. 2019, 11, 1–23. [Google Scholar] [CrossRef]
- Schweichhart, K. RAMI 4.0 Reference Architectural Model for Industrie 4.0. 2020. Available online: https://ec.europa.eu/futurium/en/system/files/ged/a2-schweichhart-reference_architectural_model_industrie_4.0_rami_4.0.pdf (accessed on 25 February 2021).
- Knoll, D.; Reinhart, G.; Prüglmeier, M. Mining. Expert Syst. Appl. 2019, 124, 130–142. [Google Scholar] [CrossRef]
- Maiorki, H.G.; Santos, E.A.P.; de Loures, E.F.R. Multi-level log XES format: A RAMI4.0 perspective. In Proceedings of the 2019 IEEE International Conference on Systems, Man and Cybernetics (SMC) IEEE, Bari, Italy, 6–9 October 2019; pp. 1614–1620. [Google Scholar] [CrossRef]
- Bangemann, T.; Riedl, M.; Thron, M.; Diedrich, C. Integration of Classical Components into Industrial Cyber-Physical Systems. Proc. IEEE 2016, 104, 947–959. [Google Scholar] [CrossRef]
- Mabkhot, M.M.; Al-Ahmari, A.M.; Salah, B.; Alkhalefah, H. Requirements of the Smart Factory System: A Survey and Perspective. Machines 2018, 6, 23. [Google Scholar] [CrossRef]
- Liao, Y.; Deschamps, F.; Loures, E.d.R.; Ramos, L.F.P. Past, present and future of Industry 4.0—A systematic literature review and research agenda proposal. Int. J. Prod. Res. 2017, 55, 3609–3629. [Google Scholar] [CrossRef]
- Davis, J.; Edgar, T.; Porter, J.; Bernaden, J.; Sarli, M. Smart manufacturing, manufacturing intelligence and demand-dynamic performance. Comput. Chem. Eng. 2012, 47, 145–156. [Google Scholar] [CrossRef]
- Deloitte, Industry 4.0 and the Digital Twin, UK. 2017. Available online: https://www2.deloitte.com/content/dam/Deloitte/cn/Documents/cip/deloitte-cn-cip-industry-4-0-digital-twin-technology-en-171215.pdf (accessed on 25 February 2021).
- Lim, K.Y.H.; Zheng, P.; Chen, C.H. A state-of-the-art survey of Digital Twin: Techniques, engineering product lifecycle management and business innovation perspectives. J. Intell. Manuf. 2020, 31, 1313–1337. [Google Scholar] [CrossRef]
- Liu, Y.; Xu, X. Industry 4.0 and cloud manufacturing: A comparative analysis. J. Manuf. Sci. Eng. Trans. ASME 2017, 139, 1–8. [Google Scholar] [CrossRef]
- Tao, F.; Qi, Q.; Wang, L.; Nee, A.Y.C. Digital Twins and Cyber–Physical Systems toward Smart Manufacturing and Industry 4.0: Correlation and Comparison. Engineering 2019, 5, 653–661. [Google Scholar] [CrossRef]
- Zhou, K.; Liu, T.; Zhou, L. Industry 4.0: Towards future industrial opportunities and challenges. In Proceedings of the 2015 12th International Conference on Fuzzy Systems and Knowledge Discovery (FSKD), Zhangjiajie, China, 15–17 August 2015; pp. 2147–2152. [Google Scholar] [CrossRef]
- Ribeiro, L.; Rosa, R.; Barata, J. A structural analysis of emerging production systems. In Proceedings of the IEEE 10th International Conference on Industrial Informatics, Beijing, China, 25–27 July 2012; pp. 223–228. [Google Scholar] [CrossRef]
- Mezgár, I. Collaborative Networks and ICT Trends for Future CPPS and Beyond. In Networks Digit. Transform. PRO-VE 2019; Camarinha-Matos, L., Afsarmanesh, H., Antonelli, D., Eds.; Springer: Cham, Switzerland, 2019; Available online: https://link.springer.com/chapter/10.1007%2F978-3-030-28464-0_3#citeas (accessed on 25 February 2021).
- Benaben, F.; Mu, W.; Boissel-Dallier, N.; Barthe-Delanoe, A.M.; Zribi, S.; Pingaud, H. Supporting interoperability of collaborative networks through engineering of a service-based Mediation Information System (MISE 2.0). Enterp. Inf. Syst. 2015, 9, 556–582. [Google Scholar] [CrossRef]
- Camarinha-Matos, L.M.; Fornasiero, R.; Ramezani, J.; Ferrada, F. Collaborative networks: A pillar of digital transformation. Appl. Sci. 2019, 9, 1–33. [Google Scholar] [CrossRef]
- Bekey, G.A. Autonomous Robots: From Biological Inspiration to Implementation and Control; Bradford Books: Cambridge, MA, USA, 2017. [Google Scholar]
- Lasi, H.; Fettke, P.; Kemper, H.G.; Feld, T.; Hoffmann, M. Industry 4.0. Bus. Inf. Syst. Eng. 2014, 6, 239–242. [Google Scholar] [CrossRef]
- Cao, C.T.; Do, V.P.; Lee, B.R. Applying 3D Vision Sensing to an Industrial Robot for Vehicle Assembly under Noisy Environment. In Proceedings of the 2019 23rd International Conference on Mechatronics Technology (ICMT), Salerno, Italy, 23–26 October 2019. [Google Scholar] [CrossRef]
- Ross, R.; Hoque, R. Augmenting GPS with geolocated fiducials to improve accuracy for mobile robot applications. Appl. Sci. 2020, 10. [Google Scholar] [CrossRef]
- Sun, L.; Adolfsson, D.; Magnusson, M.; Andreasson, H.; Posner, I.; Duckett, T. Localising Faster: Efficient and Precise Lidar-Based Robot Localisation in Large-Scale Environments; Lincoln Centre for Autonomous Systems Research: Lincoln, UK, 2020. [Google Scholar]
- Adarsh, S.; Kaleemuddin, S.M.; Bose, D.; Ramachandran, K.I. Performance comparison of Infrared and Ultrasonic sensors for obstacles of different materials in vehicle/ robot navigation applications. IOP Conf. Ser. Mater. Sci. Eng. 2016, 149. [Google Scholar] [CrossRef]
- Polygerinos, P.; Correll, N.; Morin, S.A.; Mosadegh, B.; Onal, C.D.; Petersen, K.; Cianchetti, M.; Tolley, M.T.; Shepherd, R.F. Soft Robotics: Review of Fluid-Driven Intrinsically Soft Devices; Manufacturing, Sensing, Control, and Applications in Human-Robot Interaction. Adv. Eng. Mater. 2017, 19. [Google Scholar] [CrossRef]
- Felt, W. Sensing Methods for Soft Robotics, The University of Michigan. 2017. Available online: https://deepblue.lib.umich.edu/handle/2027.42/138590 (accessed on 25 February 2021).
- Ingrand, F.; Ghallab, M. Deliberation for autonomous robots: A survey. Artif. Intell. 2017, 247, 10–44. [Google Scholar] [CrossRef]
- Beer, J.M.; Fisk, A.D.; Rogers, W.A. Toward a Framework for Levels of Robot Autonomy in Human-Robot Interaction. J. Hum.-Robot Interact. 2014, 3, 74. [Google Scholar] [CrossRef]
- Kunze, L.; Hawes, N.; Duckett, T.; Hanheide, M.; Krajnik, T. Artificial Intelligence for Long-Term Robot Autonomy: A Survey. IEEE Robot. Auto. Lett. 2018. [Google Scholar] [CrossRef]
- Senft, E.; Lemaignan, S.; Baxter, P.E.; Bartlett, M.; Belpaeme, T. Teaching robots social autonomy from in situ human guidance. Sci. Robot. 2019, 4. [Google Scholar] [CrossRef] [PubMed]
- Avižienis, A.; Laprie, J.C.; Randell, B.; Landwehr, C. Basic concepts and taxonomy of dependable and secure computing. IEEE Trans. Dependable Secur. Comput. 2004, 1, 11–33. [Google Scholar] [CrossRef]
- Guiochet, J.; Machin, M.; Waeselynck, H. Safety-critical advanced robots: A survey. Rob. Auton. Syst. 2017, 94, 43–52. [Google Scholar] [CrossRef]
- CNSS. National Information Assurance (IA) Glossary; Committee on National Security Systems: Fort Meade, MD, USA, 2010. [Google Scholar]
- ITU. Global Cybersecurity Index (GCI) 2018 ITUPublications Studies & Research; ITU: Geneva, Switzerland, 2018. [Google Scholar]
- Thames, L.; Schaefer, D. Industry 4.0: An Overview of Key Benefits, Technologies, and Challenges; Springer: Cham, Switzerland, 2017; pp. 1–33. [Google Scholar] [CrossRef]
- Morgus, R. Securing Digital Dividens—Mainstreaming Cybersecurity in International Development; New America: Washington, DC, USA, 2018. [Google Scholar]
- Valero, J.M.J.; Pérez, M.G.; Celdrán, A.H.; Pérez, G.M. Identification and Classification of Cyber Threats Through SSH Honeypot Systems. In Igi-Global.Com; 2020; pp. 105–129. [Google Scholar] [CrossRef]
- Rodrigues, P.; Sreedharan, S.K.; Basha, S.A.; Mahesh, P.C.S. Security threat identification using energy points. In Proceedings of the 2017 2nd International Conference on Anti-Cyber Crimes (ICACC), Abha, United Arab Emirates, 26–27 March 2017; pp. 52–54. [Google Scholar] [CrossRef]
- Akatyev, N.; James, J.I. Evidence identification in IoT networks based on threat assessment. Futur. Gener. Comput. Syst. 2019, 93, 814–821. [Google Scholar] [CrossRef]
- Martinelli, F.; Mercaldo, F.; Nardone, V.; Santone, A.; Sangaiah, A.K.; Cimitile, A. Evaluating model checking for cyber threats code obfuscation identification. J. Parallel Distrib. Comput. 2018, 119, 203–218. [Google Scholar] [CrossRef]
- Ahanger, T.A.; Aljumah, A. Internet of things: A comprehensive study of security issues and defense mechanisms. IEEE Access 2019, 7, 11020–11028. [Google Scholar] [CrossRef]
- Gatteschi, V.; Lamberti, F.; Demartini, C.; Pranteda, C.; Santamaria, V. To Blockchain or Not to Blockchain: That Is the Question. IT Prof. 2018, 20, 62–74. [Google Scholar] [CrossRef]
- Asuquo, P.; Ogah, C.; Hathal, W.; Bao, S. Blockchain Meets Cybersecurity: Security, Privacy, Challenges, and Opportunity; Springer: Singapore, 2020; pp. 115–127. [Google Scholar] [CrossRef]
- Zabiński, T.; Mączka, T.; Kluska, J.; Kusy, M.; Gierlak, P.; Hanus, R.; Prucnal, S.; Sęp, J. CNC Milling Tool Head Imbalance Prediction Using Computational Intelligence Methods; Lecture Notes on Artificial Intelligence (Subseries Lecture Notes on Computer Science); Springer: Berlin, Germany, 2015; pp. 503–514. [Google Scholar] [CrossRef]
- Vališ, D.; Mazurkiewicz, D. Application of selected Levy processes for degradation modelling of long range mine belt using real-time data. Arch. Civ. Mech. Eng. 2018, 18, 1430–1440. [Google Scholar] [CrossRef]
- Bazargan-Lari, M.R. An evidential reasoning approach to optimal monitoring of drinking water distribution systems for detecting deliberate contamination events. J. Clean. Prod. 2014, 78, 1–14. [Google Scholar] [CrossRef]
- Dyczkowski, K.; Stachowiak, A.; Wójtowicz, A.; Żywica, P. An uncertainty aware medical diagnosis support system. In Communications in Computer and Information Science; Springer: Berlin, Germany, 2018; pp. 381–390. [Google Scholar] [CrossRef]
- Belhadi, A.; Kamble, S.S.; Zkik, K.; Cherrafi, A.; Touriki, F.E. The integrated effect of Big Data Analytics, Lean Six Sigma and Green Manufacturing on the environmental performance of manufacturing companies: The case of North Africa. J. Clean. Prod. 2020, 252, 119903. [Google Scholar] [CrossRef]
- Mourtzis, D.; Doukas, M.; Bernidaki, D. Simulation in manufacturing: Review and challenges. Proc. CIRP 2014, 213–229. [Google Scholar] [CrossRef]
- Antonelli, D.; Litwin, P.; Stadnicka, D. Multiple System Dynamics and Discrete Event Simulation for manufacturing system performance evaluation. Proc. CIRP 2018, 178–183. [Google Scholar] [CrossRef]
- Jakieła, J.; Litwin, P.; Olech, M. Multiagent Based Simulation as a Supply Chain Analysis Workbench; Springer: Berlin, Germany, 2012; pp. 84–104. [Google Scholar] [CrossRef]
- Minetola, P.; Priarone, P.C.; Ingarao, G. Sustainability for 3DP Operations. In Managing 3D Printing; Springer International Publishing: Cham, Switzerland, 2020; pp. 97–126. [Google Scholar] [CrossRef]
- Pearce, J. Distributed Manufacturing of Open-Source Medical Hardware for Pandemics. J. Manuf. Mater. Process. 2020. [Google Scholar] [CrossRef]
- Karabag, S.F. An Unprecedented Global Crisis! The Global, Regional, National, Political, Economic and Commercial Impact of the Coronavirus Pandemic. J. Appl. Econ. Bus. Res. 2020, 10, 1–6. [Google Scholar]
- Chavarría-Barrientos, D.; Espinosa, J.M.M.; Batres, R.; Ramírez-Cadena, M.; Molina, A. Innovation Ecosystems: A Collaborative Networks Perspective Ricardo. In IFIP Advances in Information and Communication Technology; Springer: Berlin, Germany, 2015; pp. 243–254. [Google Scholar] [CrossRef]
- Future of Life Institute. Open Letter on Autonomous Weapons—Future of Life Institute; Future of Life Institute: Cambridge, MA, USA, 2015. [Google Scholar]
- Russell, S.; Dewey, D.; Tegmark, M. Research priorities for robust and beneficial artificial intelligence. AI Mag. 2015, 36, 105–114. [Google Scholar] [CrossRef]
- Peacock, D.; Irons, A. Gender Inequalities in Cybersecurity: Exploring the Gender Gap in Opportunities and Progression. Int. J. Gender Sci. Technol. 2017, 9, 25–44. [Google Scholar]
- Ahmad, T. Corona Virus (COVID-19) Pandemic and Work from Home: Challenges of Cybercrimes and Cybersecurity. SSRN Electron. J. 2020. [Google Scholar] [CrossRef]


Publisher’s Note: MDPI stays neutral with regard to jurisdictional claims in published maps and institutional affiliations. |
© 2021 by the authors. Licensee MDPI, Basel, Switzerland. This article is an open access article distributed under the terms and conditions of the Creative Commons Attribution (CC BY) license (http://creativecommons.org/licenses/by/4.0/).