1. Introduction
According to Hoy, Hänsel and Maugeri [
1], the accumulation of hot European summers since the 1990s could be regarded as unprecedented within the instrumental past. Moreover, the National Oceanic and Atmospheric Administration states that 2018 was the fourth hottest year on record, after 2015, 2016 and 2017, being 0.83 °C warmer than the average set between 1951 and 1980 [
2]. As for the northern hemisphere, the summer of 2018 was characterized by an abnormally huge number of extreme weather events (record temperatures, heatwaves, droughts, wildfires, etc.) caused by a jet stream that was weaker than usual [
3]. According to the European Drought Observatory, the drought mainly affected Northern and Central Europe [
4]. The most uncommon temperatures were concentrated in the South-Western Scandinavian Peninsula, with strong positive anomalies extending around the Baltic Sea in all directions [
1]. Furthermore, the last boreal winter season of 2019/2020 is currently considered, according to the Copernicus Climate Change Service, the warmest winter season ever recorded in Europe, with the three months from December 2019 to February 2020 being the warmest period on record in the entire region [
5].
Heat effects have a critical impact on urban areas due to lower surface albedo, less air circulation, and less shade. In climatology, a “heatwave” refers to a period of heat and a “heat island” refers to an area in the city center where the surface and air temperatures are consistently higher than in the outskirts. Heatwave conditions are generally defined as follows: “summertime weather that is substantially hotter in a location during a specific time band” [
6], while “an urban heat island means that an urban area or metropolitan area is significantly warmer than its surrounding rural areas due to human activities” [
7]. Urban heatwaves and heat islands are considered the major environmental problem of the 21st century [
8]. Urbanization aggravates the problem of extreme heat; the massive replacement of natural vegetation by manmade structures in cities significantly alters the energy (temperature) balance. High-rise residential areas (urban “canyons”) reflect down the light and heat, lowering albedo in comparison with plants [
9]. Due to the formation of urban heat islands, air temperature in a city can be up to 3 °C to 5 °C higher than in the outskirts and countryside [
10,
11].
As a part of green infrastructure, urban vegetation can reduce temperatures in cities through shading and evaporative cooling [
12,
13,
14]. According to the EU’s basic definition given in the Green Infrastructure Strategy, “Green Infrastructure can be broadly defined as a strategically planned network of high-quality natural and semi-natural areas with other environmental features, which is designed and managed to deliver a wide range of ecosystem services and protect biodiversity in both rural and urban settings. More specifically GI, being a spatial structure providing benefits from nature to people, aims to enhance nature’s ability to deliver multiple valuable ecosystem goods and services, such as clean air or water” [
15]. In a broad sense, green infrastructure may be regarded as a vast source of benefits, in particular, the climate-related biophysical ones [
16].
According to multiple sources [
17,
18,
19], areas with dense vegetation (the “green areas”) are always cooler than the areas that are less green; this effect is called “cool island” or “park cool island”. Plants also make other positive impacts in cities, such as CO
2 absorption in the daytime, noise isolation, and dust retention. Urban vegetation is therefore an essential element that shapes the city microclimate. This network of “natural and semi-natural pieces of land” is a cornerstone for the well-being of local people [
20], which makes up the “capital” concept of green infrastructure. This concept, however, “does not recognize the agency of climate change, nor does it indicate the explicit content about new institutional arrangements” [
16]. Another challenge is related to management considerations; although many researchers around the world have provided a scientific background for the management of urban green spaces [
14,
21,
22,
23,
24,
25,
26], these outputs cannot be extrapolated from one region to another due to the area-specific combination of factors pertinent to climate, plant species, soils and water sources. Studies show [
27] that there are no universal standards to calculate the best-recommended quantities, types and locations for urban vegetation, and in terms of the species selection, the great variety of green infrastructure could be challenging for the practitioners.
In this regard, the importance of urban vegetation inventory cannot be overestimated. Proper planning and implementation of an inventory can provide accurate information on the condition, diversity and spatial distribution of trees in urban areas and might also become an important starting point for further analysis and planning. Tree or forest inventory can be defined as “the systematic collection of data on the forestry resources within a given area… that allows assessment of the current status and lays the ground for analysis and planning, constituting the basis for sustainable forest management” [
28]. Tree inventories are claimed to be one of the multiple approaches used by urban foresters that include data collected on individual trees or groups of trees by site visits or other methods. Östberg [
29] defines urban tree inventory as “a method of gathering data; and the data is used by cities, researchers and other stakeholders in the field of urban forestry”.
According to various sources [
29,
30,
31], an effective inventory of urban green infrastructure, among other things, contributes to the following lines of activity:
Decision-making on which tree species to plant in urban areas; estimation of variations in tree structures and species within urban areas [
32,
33];
Modelling of the role of the local climate and trees in shaping the urban microclimate [
11,
13];
Estimation and analysis of the damage to trees by droughts [
34];
Estimation of the overall importance and economic benefits of urban trees, the value of ecosystem services, and the economic value of individual trees [
35,
36].
Ukrainian city dwellers are barely aware of the negative impact of climate change on their residential areas. In addition, there a no direct field measurements of urban ecosystem parameters in Ukraine that could be organized in a systematic way. We have a gap in field data of direct microclimatic and CO2 measurements in our cities and outskirts. Such datasets could be helpful in estimating the impact of urban greening and heatwaves on the quality of life in the relevant areas. However, there is no comprehensive database that local authorities could use in the decision-making on the mitigation of climate change in cities. In addition, there is no data-supported evidence for local communities to push on the local authorities to take a more active approach to addressing the negative impacts of climate change, such as heat islands and heatwaves.
Based on this, we have formulated the key research question as follows: How can municipal governments and private land managers use open-access and low-cost urban greenery inventory methods for local estimation of urban tree contribution to mitigation of urban heat impacts?
This paper provides a case study of the urban greenery inventory research of courtyards in high-rise residential districts in Kyiv, Ukraine. Kyiv, the capital of Ukraine, with a population of 2,963,149 people as of December 2020 [
37], was selected for this research for a few of reasons. First, it is Ukraine’s largest city [
37]; being a capital, it is expected to lead the progress in municipal governance in all respects. Second, it combines two important factors: high population density and a relatively large number of urban green spaces. According to the 2017 ranking of 43 European capitals based on the Normalized Difference Vegetation Index (NDVI) [
38], Kyiv ranks 15th, with a median NDVI value of 0.389, following Sarajevo (capital and largest city of Bosnia and Herzegovina) with an NDVI value of 0.678. At the same time, Kyiv was found to be the greenest European metropolis with a population above 2 million people [
38]. This is why a case study of Kyiv might have practical value in terms of both regional importance and local applicability and replicability for other Ukrainian cities. The overall objective of the research was to develop a scientific basis for strategic planning of adapting urban green areas and residents to climate change in Ukraine.
The study also focused on the effectiveness of cooling and microclimate formation by urban vegetation in hot weather as an approach for the local people to adapt to such negative impacts of climate change as heatwaves. We used field study results and legislation analysis to produce recommendations on vegetation management and planning (such as species, density, types of greenery, etc.) for urban public utility companies as well as for national and municipal authorities, where relevant to potential legislation improvements.
2. Materials and Methods
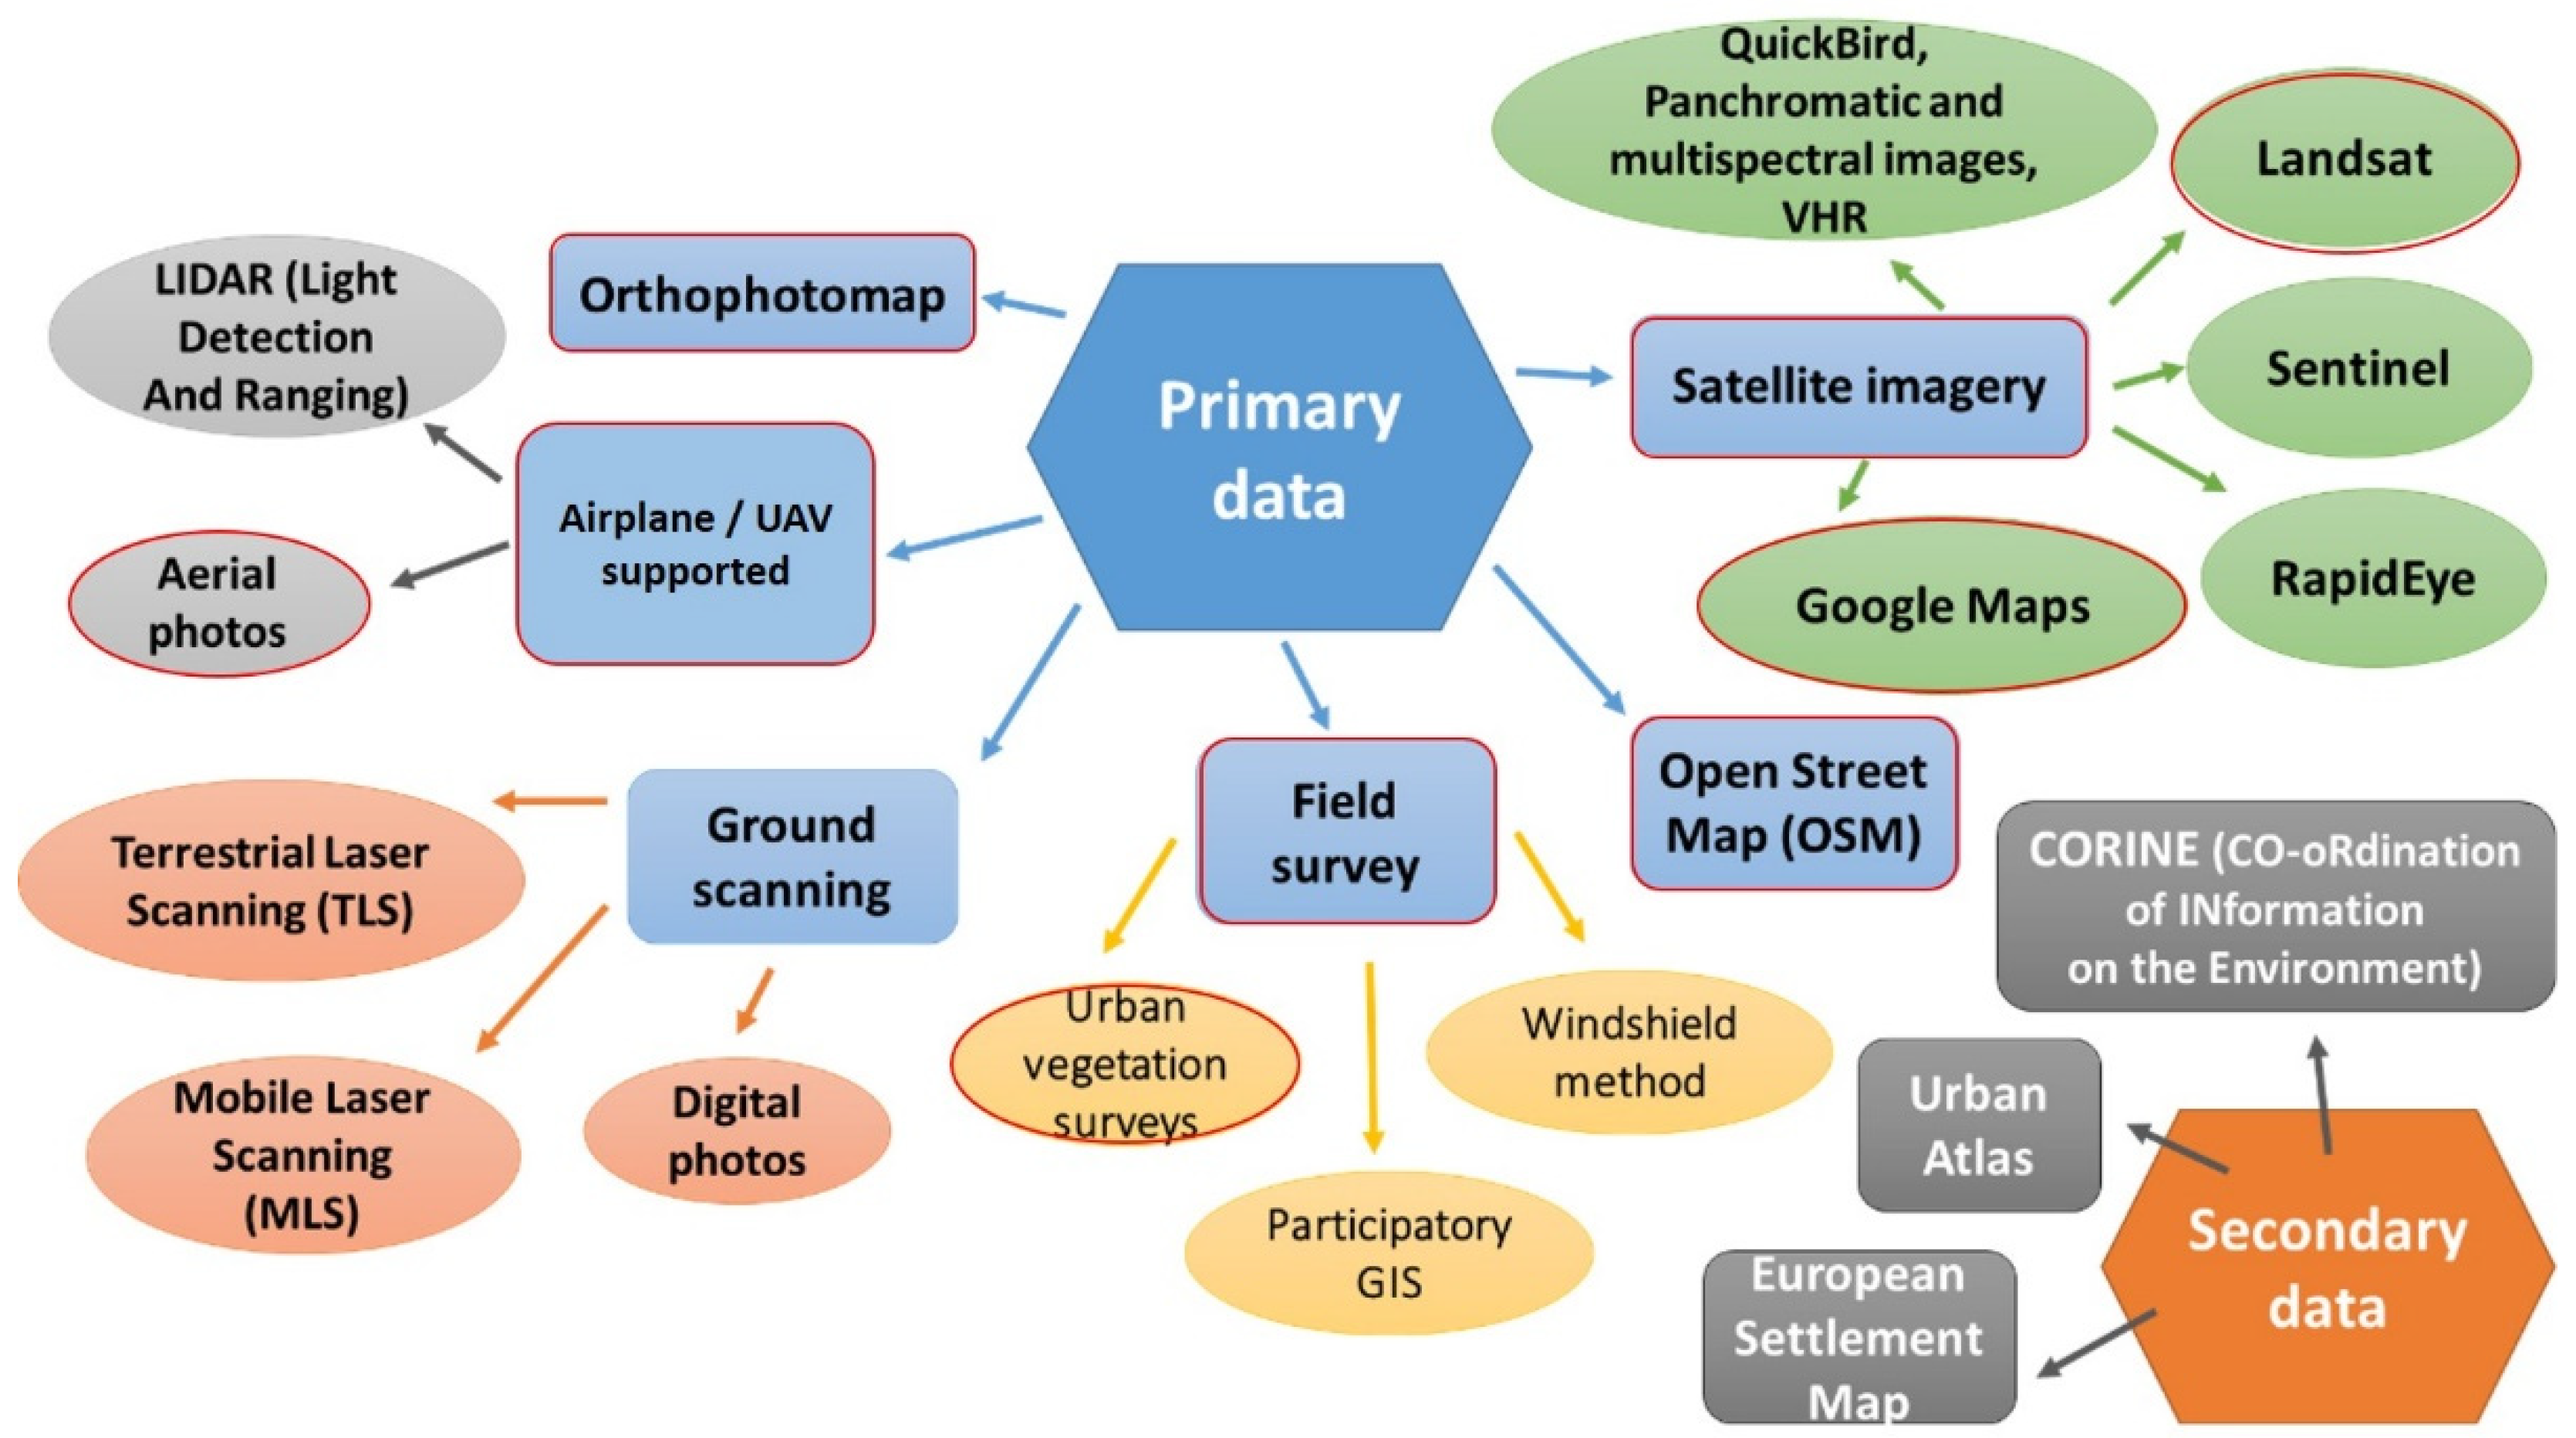
Generally speaking, it is important to clearly set out the purpose of the inventory when planning it and choosing the data parameters [
29] to avoid a potential inefficient allocation of time and resources that might result, in a long run, in a lack of consistency between the dataset and the initial needs of the stakeholders. Various inventory methods, technologies and data sources may be used in an urban greenery inventory project. In order to select the methods relevant to the scope of this research, we combined most of the methods for urban green infrastructure inventory and available data sources in one diagram (
Figure 1).
The inventory planning design depends on the project scale, budget, time, human resources and data accessibility. Having come to the idea of using open-source and low-cost inventory methods in our case study, we estimated the methods presented in
Figure 1 and finally decided to use a combination of open satellite imagery data and field-based data collected by the project team, as circled in red in
Figure 1 and further explained below.
2.1. Spatial Levels of the Research
The research was stepwise downscaled from the city level to the level of individual trees. In the first stage, we analyzed visual and thermal satellite images of Kyiv. This helped us assess the distribution of building density, greenery density and surface temperatures in the residential districts of Kyiv and select the locations for proximal measurements. In the second stage, we conducted thermal aerial mapping using an unmanned aerial vehicle (UAV) in the selected courtyards of high-rise residential areas. Finally, we took point measurements of temperature, humidity and photosynthesis rate of the selected tree species in the selected courtyards. In this research, we downscaled from all types of greenery, starting with estimating the effectiveness of microclimate formation by trees and lawns (including all vegetation objects other than trees), gradually progressing down to trees (individual and grouped), regarding them as complex systems in terms of microclimate condition formation as compared to lawns (grass and bushes).
2.2. Satellite Analysis
OSM. We used Open Street Maps (OSM) data to define the borders of the residential districts and calculate the building density. All residential districts in Kyiv were split into segments (approximately 100 × 100 m2), based on architectural similarity. For each segment, building density was calculated as the area percent using the OSM buildings layer.
World View. We used two World-View RGB satellite images that cover Kyiv and are available on Google Earth. The images were captured on 7 September 2014 and 10 August 2017 and have a spatial resolution of approximately 0.6 × 0.6 m2. The images were downloaded using SAS Planet software and used for the supervised classification to generate the following classes:
trees
lawns (grass)
large shades
water features
artificial objects
other/unclassified
Tree and shade density was calculated as an area percent for each segment of the residential districts.
Landsat-8 TIR. For the analysis of surface temperature distribution, we used thermal infrared (TIR) images of Landsat-8. The images have a spatial resolution of 30 × 30 m
2. Two thermal products were used: averaged summer surface temperature in 2013 to 2015 [
33] and single-shot surface temperature converted from images captured on 8 June 2018. The conversion was made using QGIS Semi-automatic classification plugin (SCP). These two products showed high similarity. The surface temperature on 8 June 2018 was used for further analysis.
2.3. Selection of Research Locations
The Dnipro River divides Kyiv into western part and eastern parts, which are significantly different in terms of microclimate. The right-bank (western) part is older and more diverse in terms of building and greenery density. The air temperature and humidity indicators are milder and more evenly distributed compared to the left-bank (eastern) part, which is densely built-up and sandy and has less greenery. These differences make the comparison of the climate research data between the two banks more difficult. For this reason, we decided to focus on the right-bank part of Kyiv only (Holosiivsky District). Within this area, we selected four residential courtyards (hereafter, the “locations”). Each location has a similar low building density and varying levels of greenery (see
Table 1).
2.4. Aerial Thermal Mapping and Precise Tree Classification
Aerial thermal imaging was performed using the UAV DJI matrice 100 and thermal camera Flir Vue Pro R to explore the distribution of surface temperatures around specific urban infrastructure elements in the locations. Thermal imaging was conducted during two days (August 1: Locations 2 and 3; August 3: Locations 1 and 4) from 12 a.m. to 3 p.m., from a 100 m height, in AUTO mode.
The data was processed in Pix4D Mapper. Two products were obtained: (1) thermal maps with a spatial resolution of 10 cm to 13 cm and (2) digital surface maps (DSMs) with a 20 cm spatial resolution. The DSMs were used for accurate tree classification on an elevation basis.
2.5. CO2 Fluxes at the Leaf Level
To evaluate the photosynthetic activity of the selected city tree species in hot temperatures, we measured light-induced CO2 uptake by live intact leaves of the trees. Five tree species that are commonly found in Kyiv were selected: Tilia cordata, Robinia pseudoacacia, Acer negundo, Salix babylonica, and Salix fragilis.
All trees were located in a non-shaded part of the yard. Measurement details include the following:
Date and timing: 22, 23, 25, 31 July and 3 August 2018, mostly from 11 a.m. to 5 p.m.;
Two sets of measurements: in comfortable (22 to 25 July) and hot (31 July and 3 August) temperatures (see Figure 12 for temperature dynamics);
Repetitions: 5 leaves on each tree; 4 trees for
Salix, 3 trees for
Robinia Pseudoacacia, and 2 trees for
Tilia Cordata and
Acer Negundo (see
Table 2);
Parameters: leaf CO2 fluxes, air temperature and relative humidity, atmospheric CO2, atmospheric pressure, and light intensity.
CO2 fluxes were measured using CO650 Plant CO2 Analysis Package (Qubit Systems Inc., Kingston, ON K7M 3L5 Canada), based on the infrared gas analyzer and leaf camera (3 × 3 cm) with a stable light source (LED, light intensity 1000 µE/m2/s).
2.6. Recording Air Temperature and Humidity
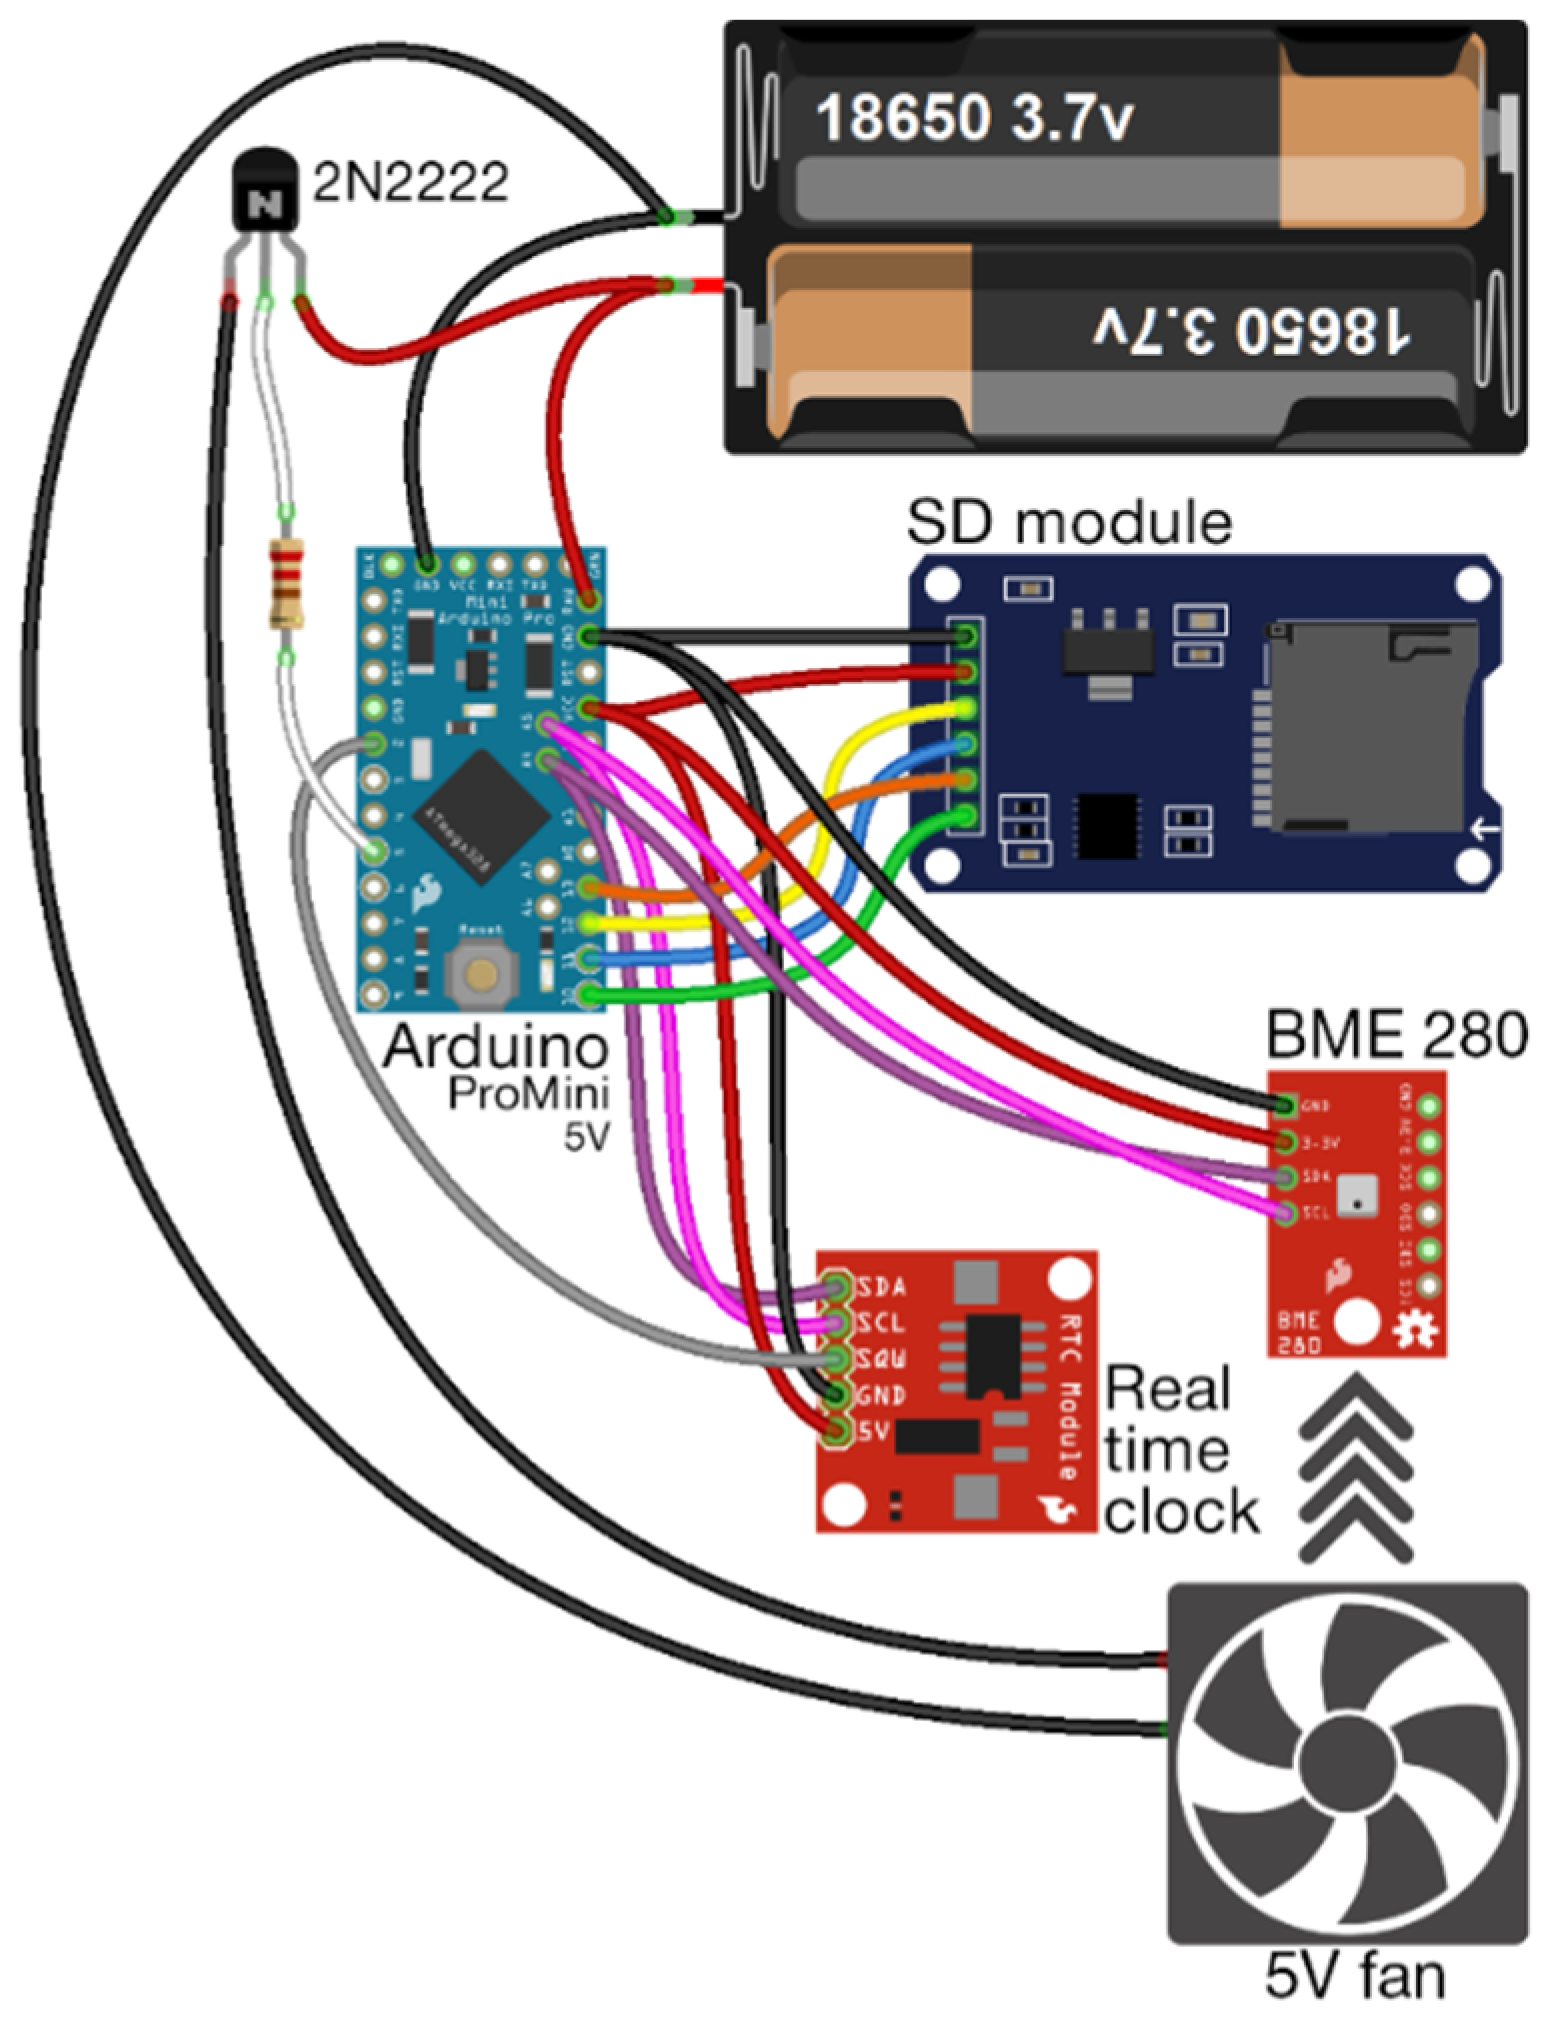
To estimate the microclimate formation within differently sized green (shaded) and non-shaded parts of all 4 locations in different weather conditions, 16 stand-alone portable systems were fixed on trees and lampposts, 3 m to 4 m above the ground. The sensors measured air temperature and relative humidity every 10 min from 24 July to 8 August 2018. In every location, we placed 4 sensors: one on a lamppost (a “non-shaded” area exposed to direct sunlight), one on a single tree (a light shade), and two different sensors (one “passive” and one “active”) for a group of 3 to 4 trees standing close to each other (a deep shade). During the data collection stage, two sensors in Location 4 were lost (might have been removed by locals): one “active” and one “passive”, fixed at the group of trees.
For air temperature and humidity measurements, we chose the DHT22 sensor, as it provides good accuracy and repeatability of data. The logger recorded the data every 10 min as an average of 10 measurements with an interval of 2 s between each. Each system was based on Arduino Pro Mini (5 V version), powered with 7.4 V from two Li-ion batteries through its RAW pin. A DS3231 Real Time Clock module was installed to monitor time/date monitoring and wake the logger up from the sleeping mode, which saved the battery charge while waiting for the next measurement to be taken. Data were saved to an SD card with a relevant timestamp. All components of the system were tightly packed and secured in a 3D-printed coPET plastic box to protect them against any rain or other unwanted weather impacts (see
Figure 2).
The temperature of the air inside the box with a sensor was considered the same as what we felt while standing in the same location where the sensor was placed (so-called “subjective” temperature of a “passive” sensor). It helped us estimate the temperature “comfort” of the microclimate of residential micro-districts with different greenery density. To compare it with the “real” air temperature, we added one system in each location, where the sensor was equipped with a ventilation fan providing an air flux during the temperature recording (so-called “active” sensor) in order to equalize the temperature of the sensor with the temperature of the ambient air (see
Figure 3).
We used a Bosch BME 280 combined temperature/humidity/pressure sensor for this particular setup. A printed circuit board with a sensor was mounted inside the fan duct. Averaged measurements were taken every 10 min after a 10 s fan purge and saved on an SD card with a relevant timestamp. To exclude unwanted heat input from direct sunlight, active loggers were placed in shaded spots.
2.7. Legislation Analysis
In addition to the fieldwork, we analyzed the Ukrainian legislation on the maintenance of urban green spaces at the local, regional, and country levels, aiming to evaluate the extent to which its provisions promote a comfortable microclimate in residential districts in terms of vegetation planning and planting density requirements, ownership structure, and designation of responsibilities.
3. Results and Discussion
As reflected by many researchers worldwide [
8,
9,
10,
11,
12,
13,
14,
17,
18,
19,
26,
30,
31], urban green spaces––as complex formations consisting of both abiotic and biotic factors, which provide a unique set of ecosystem services for residents––should be analyzed on different levels and at different angles. This is why, in this research, as we were trying to estimate the contribution of urban trees to the mitigation of the heat impacts in the city, we built the work in a downscaling format, from the city level down to an individual tree level; we also employed different methods and data sources to get a full understanding of the processes taking place in Kyiv’s residential courtyards.
3.1. City Level: Relationship between the Structure (Component Density) and Surface Temperature in Residential Districts
For the purpose of the city-level analysis, all residential districts in Kyiv were grouped into 11 regions based on location and historical attributes (
Figure 4). The regions were named according to the historical names of Kyiv districts, where the official name “Holosiivsky District” corresponds to “Golosievo” as its historical counterpart, keeping the same area and borders. Since this regional division is still being used by locals and municipal workers, we calculated the averaged values of the studied parameters within each region, including percentage area of trees, buildings, lawns, shades and open areas as well as surface temperature (see
Table 3).
Vynogradar and Golosievo appeared to be the greenest and the coolest regions in terms of surface temperatures. Troeschina and Obolon were the “hottest” regions, and Podil and Center were the most built-up regions.
We analyzed the correlation between the density of components and the surface temperature in the residential districts. Segments of districts with uniform architecture were taken as elementary units (see Methods). We found that tree density had a high impact on the reduction of surface temperatures in the districts (
Figure 5).
In the multiple regression analysis, the tree density described 50% of the temperature variability; the second important factor was the density of large shades created predominantly by buildings. Another way to describe the temperature variability was to calculate the density of open areas exposed to direct sunlight. We can assume that these three parameters (trees, open areas and shades) play a major role in determining the thermal conditions in residential districts.
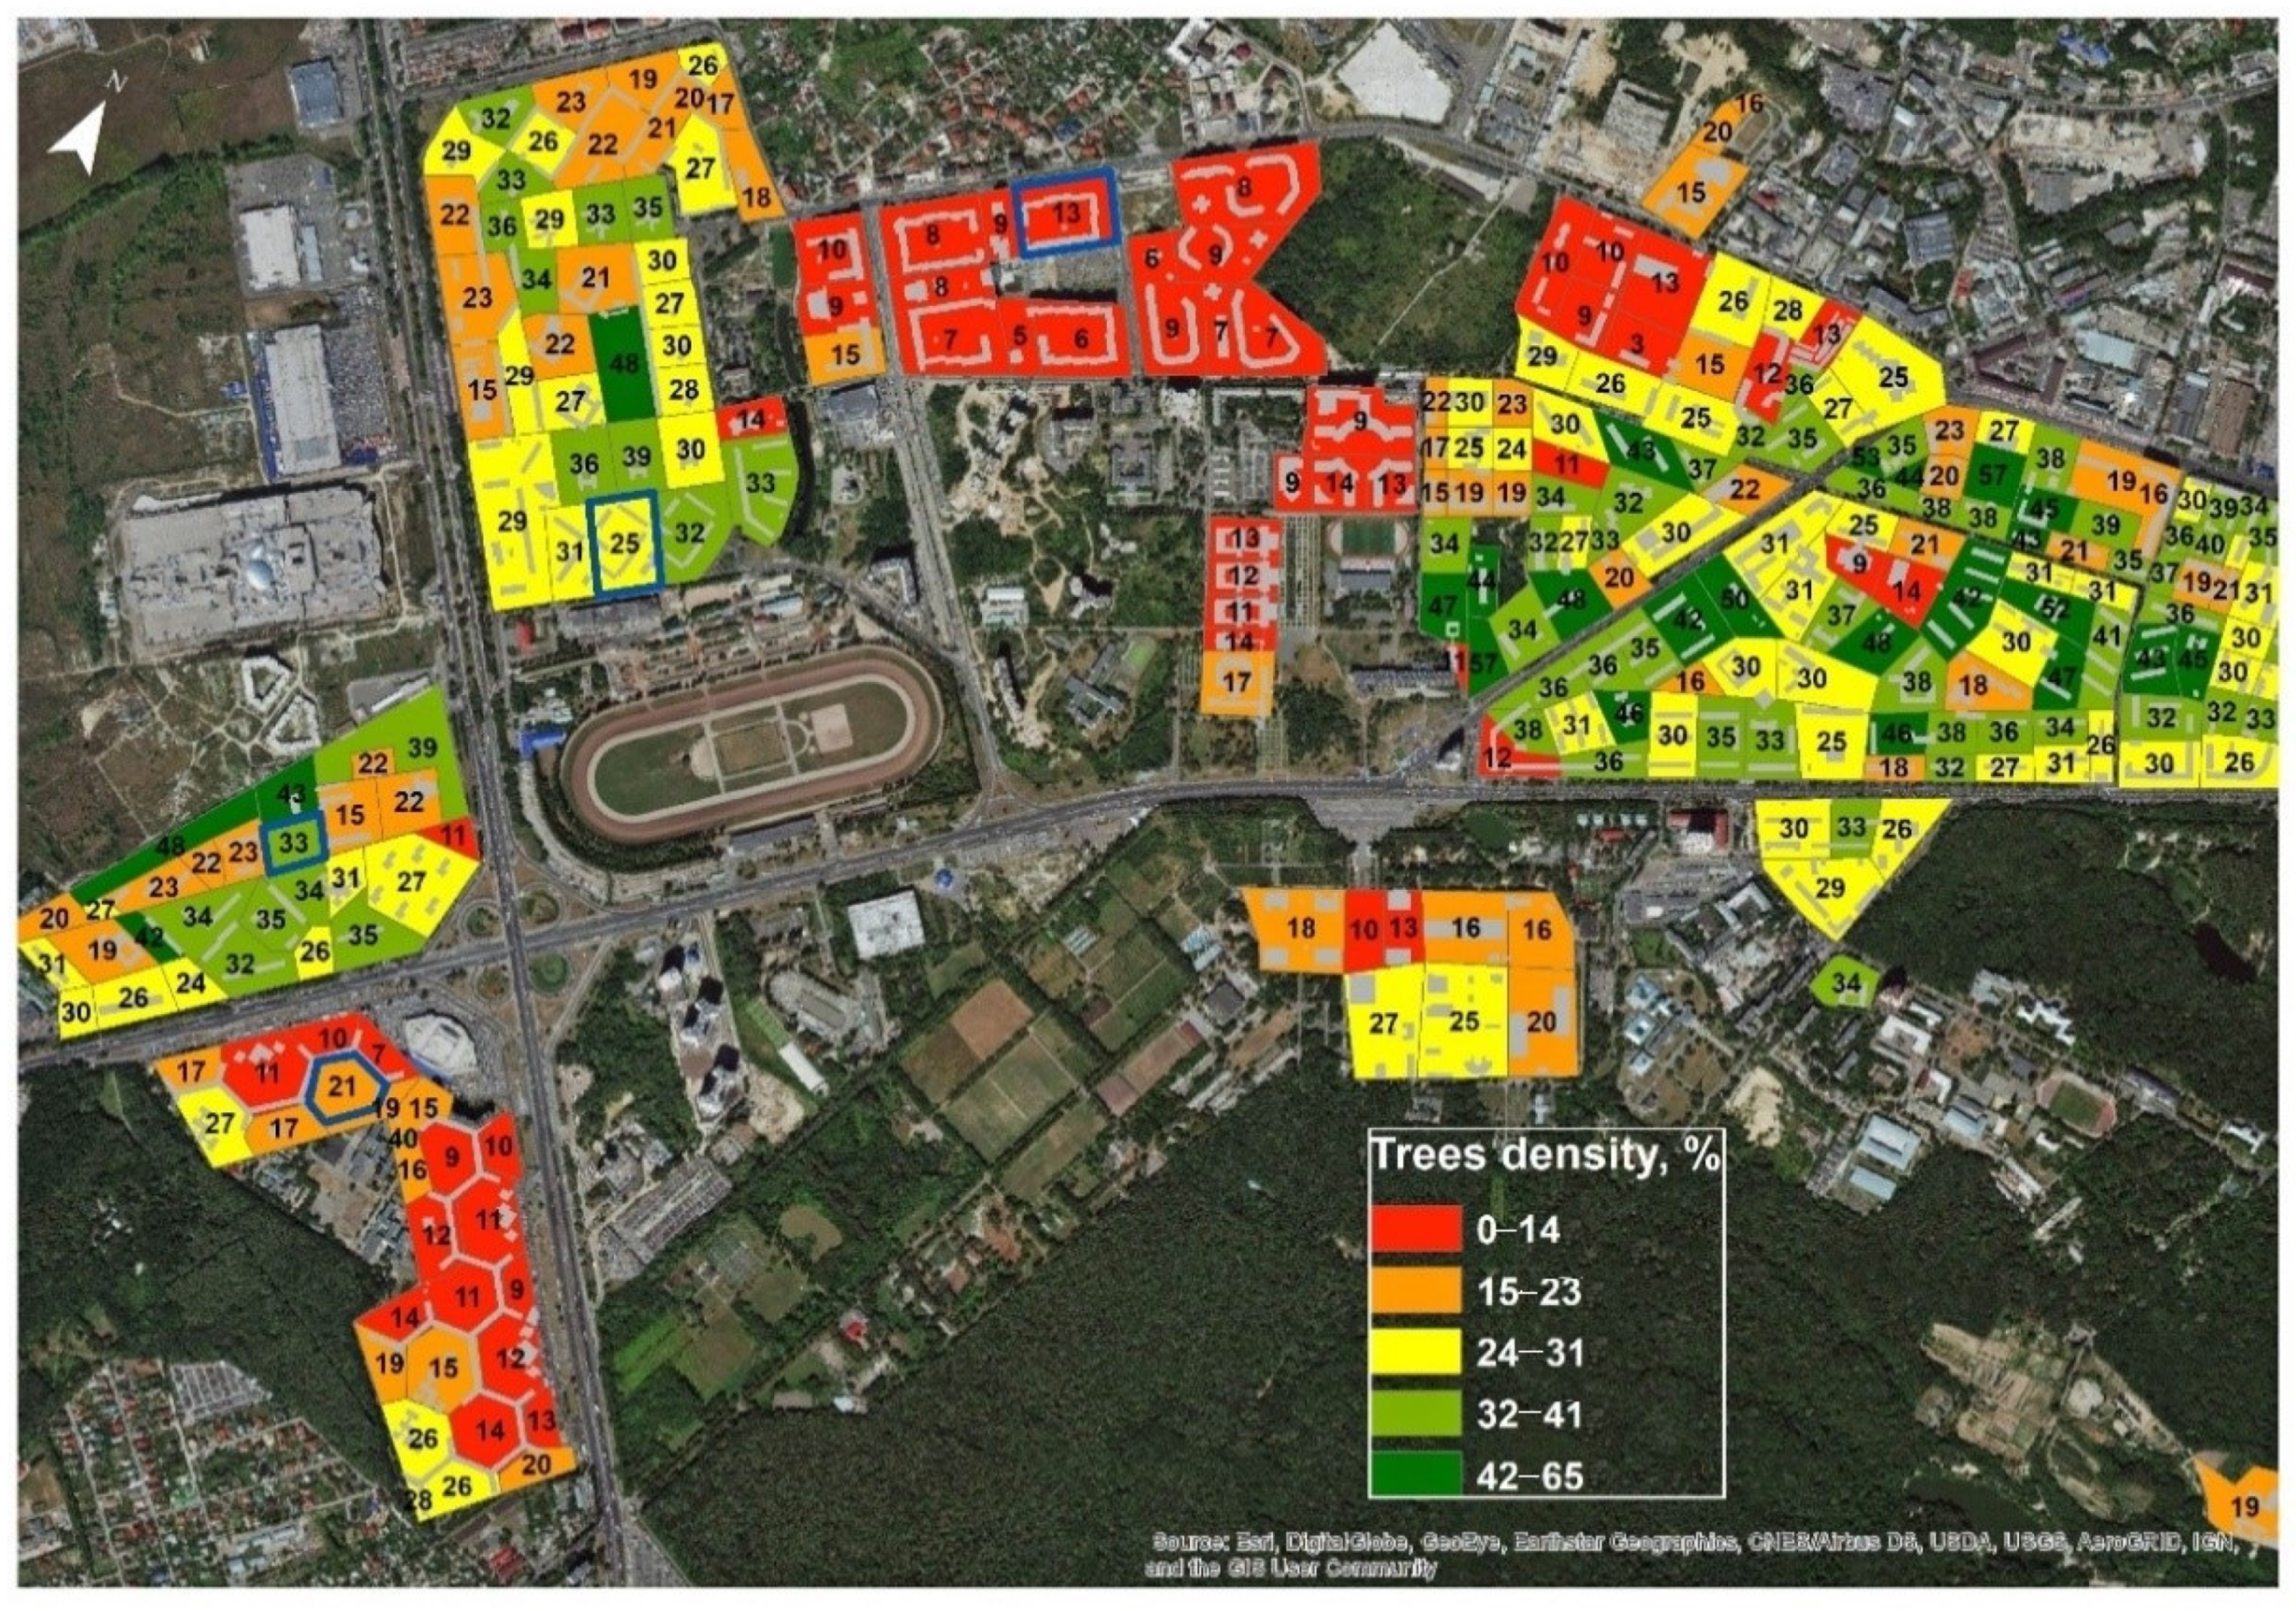
In the Holosiivsky District (historical name, Golosievo), which featured in the research, we classified the residential area segments in terms of vegetation coverage and building density (
Figure 6). Residential area segments (specifically, courtyards of high-rise buildings) appeared to be quite diverse in terms of urban vegetation coverage, ranging from poorly (up to 14%) greened areas of newly built-up segments to courtyards that have a lot of greenery and well-established vegetation infrastructure.
Our locations (marked blue in
Figure 6) spread northwest of the district, covering both the newly built-up residential area with low greenery density (the upper one in
Figure 6) and “old” courtyards with large trees and arranged green spaces with varying density of greenery. This part of the city has been growing dynamically over recent years, and the new residential areas have not been properly organized by the municipal public utility companies in terms of green infrastructure.
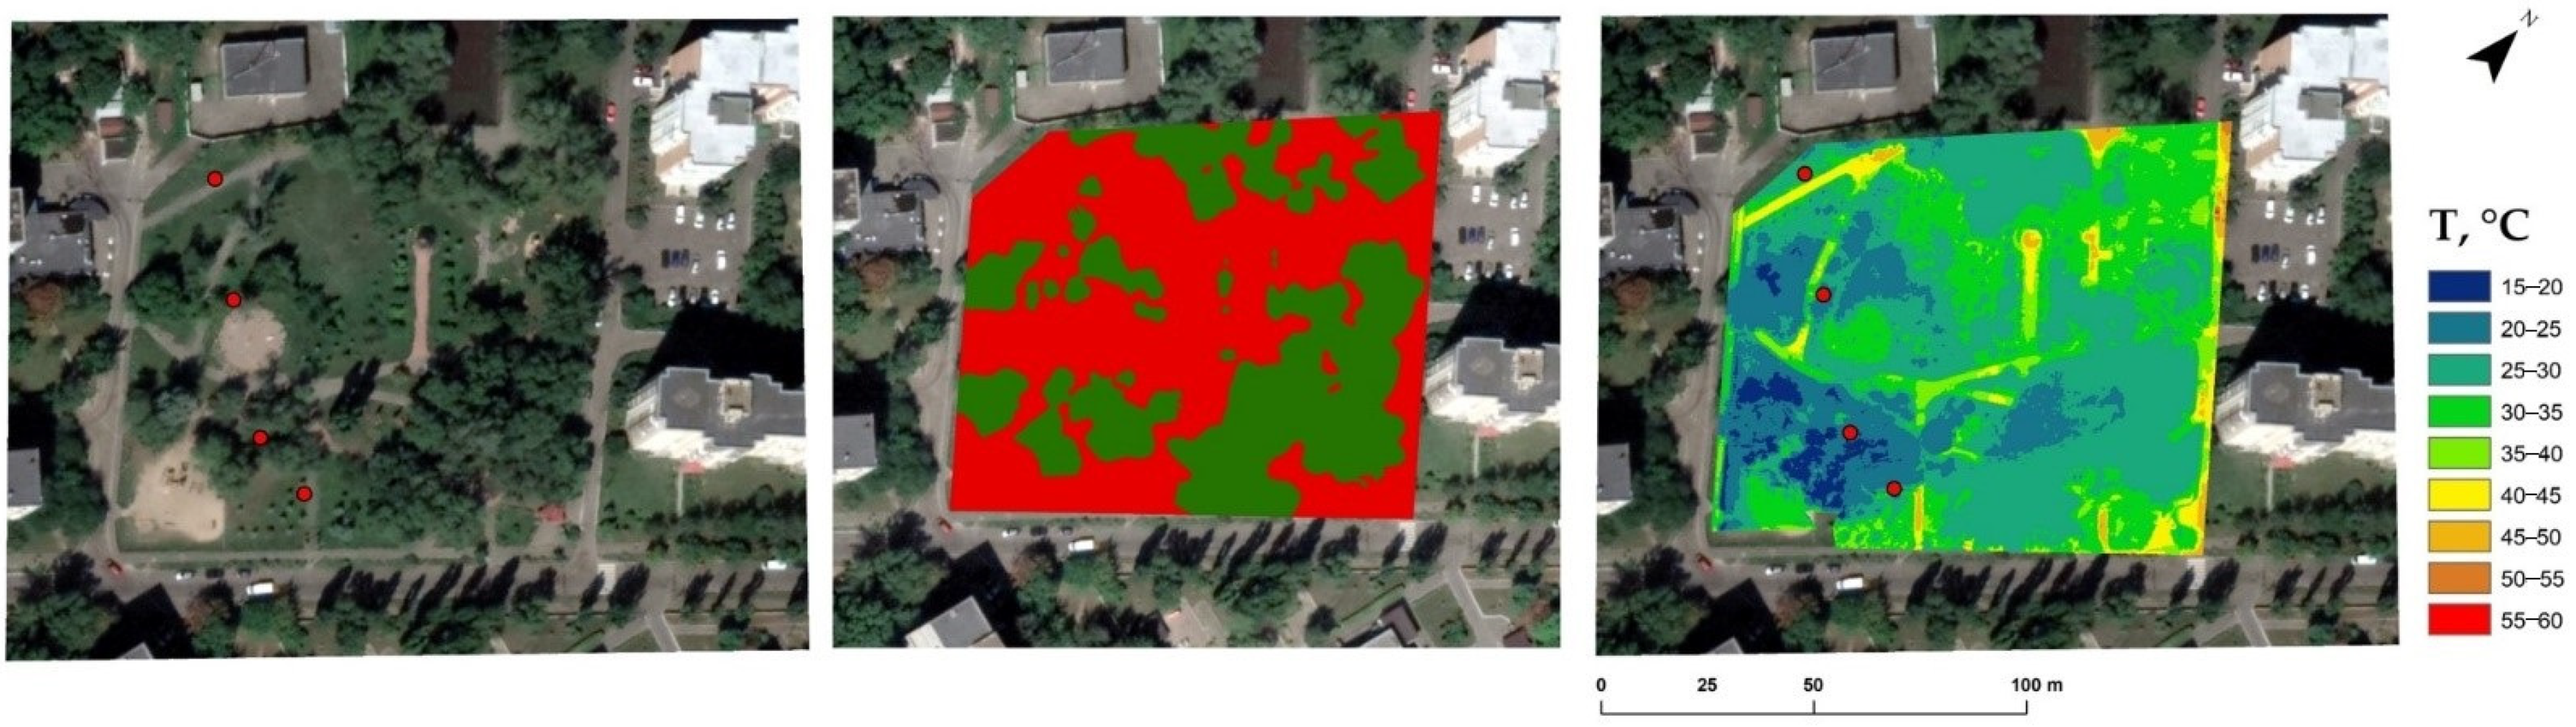
3.2. Yard Level: UAV-Borne Thermal Maps
According to the thermal maps derived from the UAV, temperature distribution patterns were highly varied in the four selected locations. All locations in focus had a relatively similar temperature range in open areas (38 °C to 54 °C) but a quite varied and broad range of tree species with different canopy structures, age and other characteristics (see
Table 4). Location 2 had the largest greenery coverage (40.6%) and the lowest maximum surface temperature in open areas (55.8 °C).
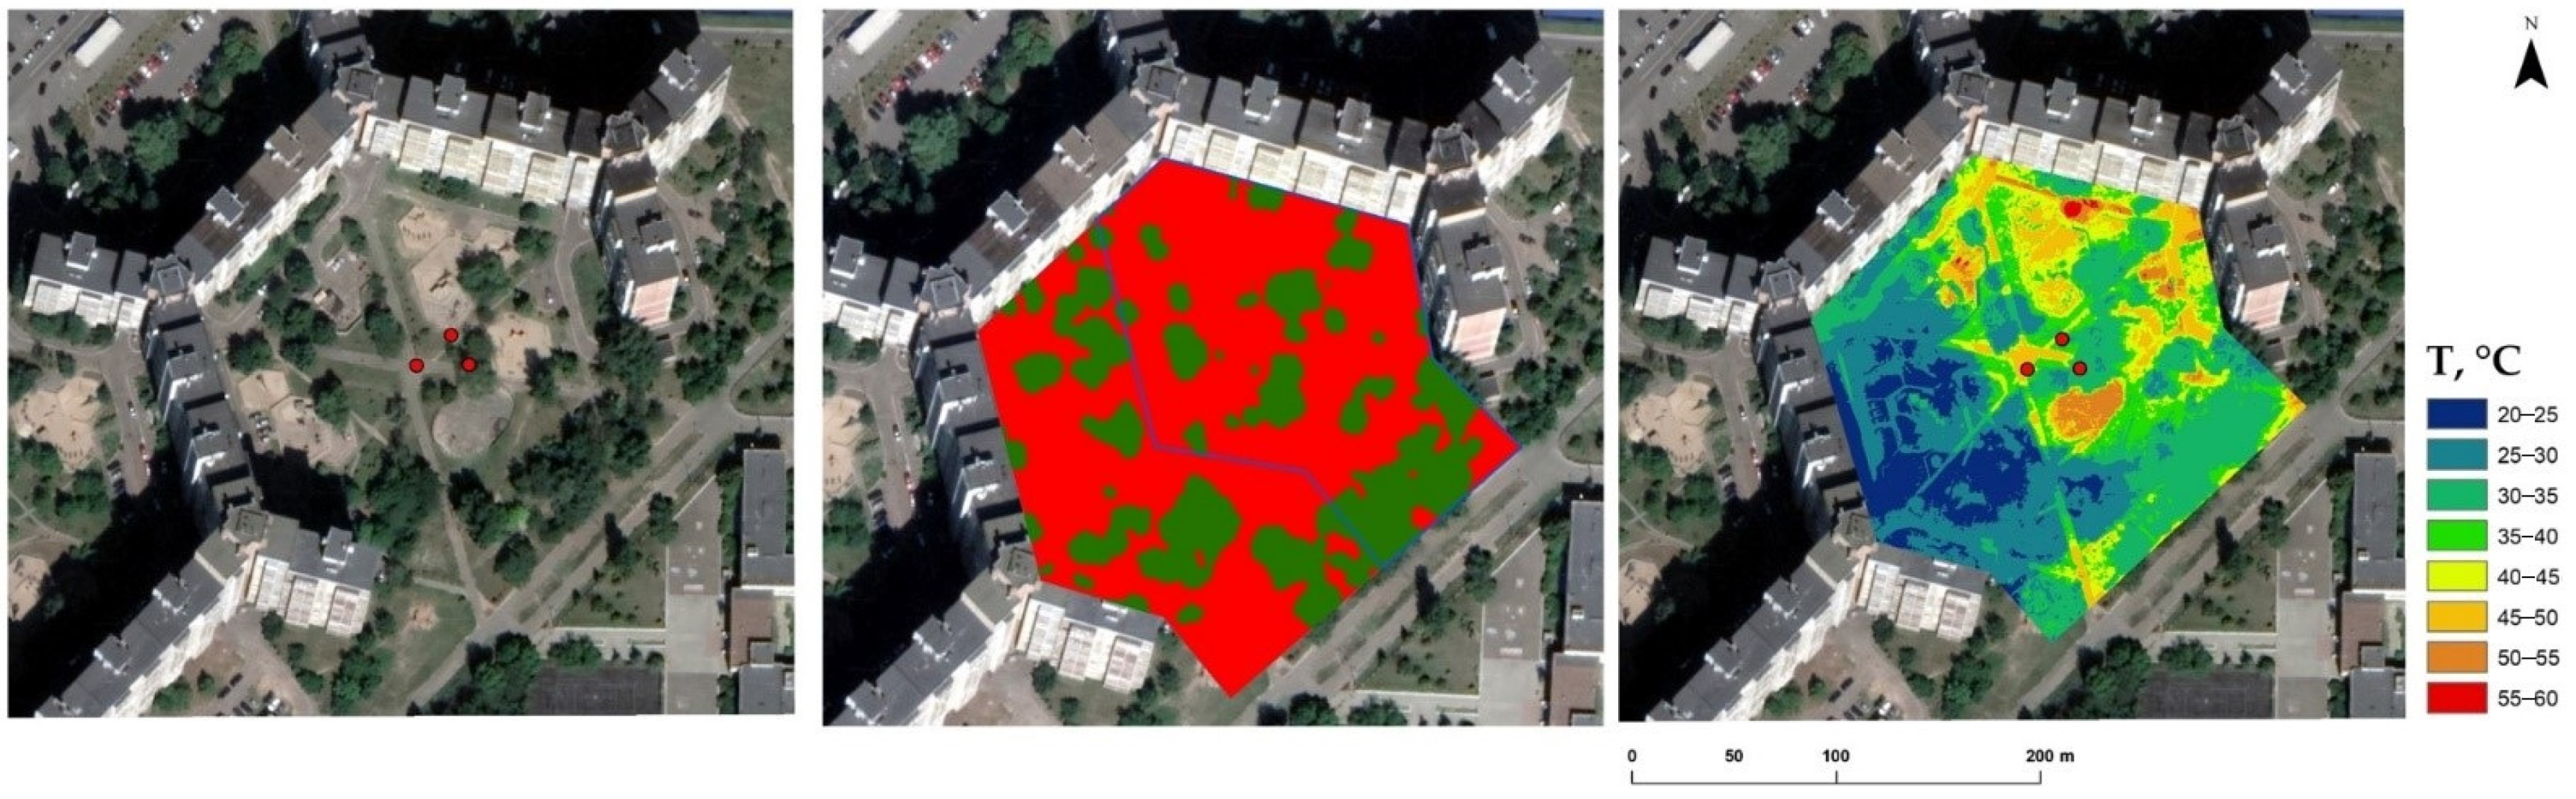
The thermal map of the Location 1 (see
Figure 7) shows a large cool spot, representing a shade in the southwestern part of the yard cast by a high building. We placed the temperature sensors (marked with red dots) outside this shade. The gap in surface temperatures of the shaded and unshaded parts was between 10 °C and 20 °C.
In the non-shaded area, temperatures were above 50 °C in the hottest spots, which included the asphalt paths and the playground. Thermal maps clearly show that the playground—which is supposed to be a comfortable place for children to play and exercise in summer—was warmer than other parts of the yard due to lack of greenery and not being in the cover of the shade cast by the building.
Even though Location 2 had a large open area, the temperature profile of this yard featured lower temperatures compared to other yards featuring in this study (
Figure 8). The reason for this might be the grass that covers the largest part of the open area. However, even grass-free open areas, such as concrete paths, had lower temperatures compared to other locations.
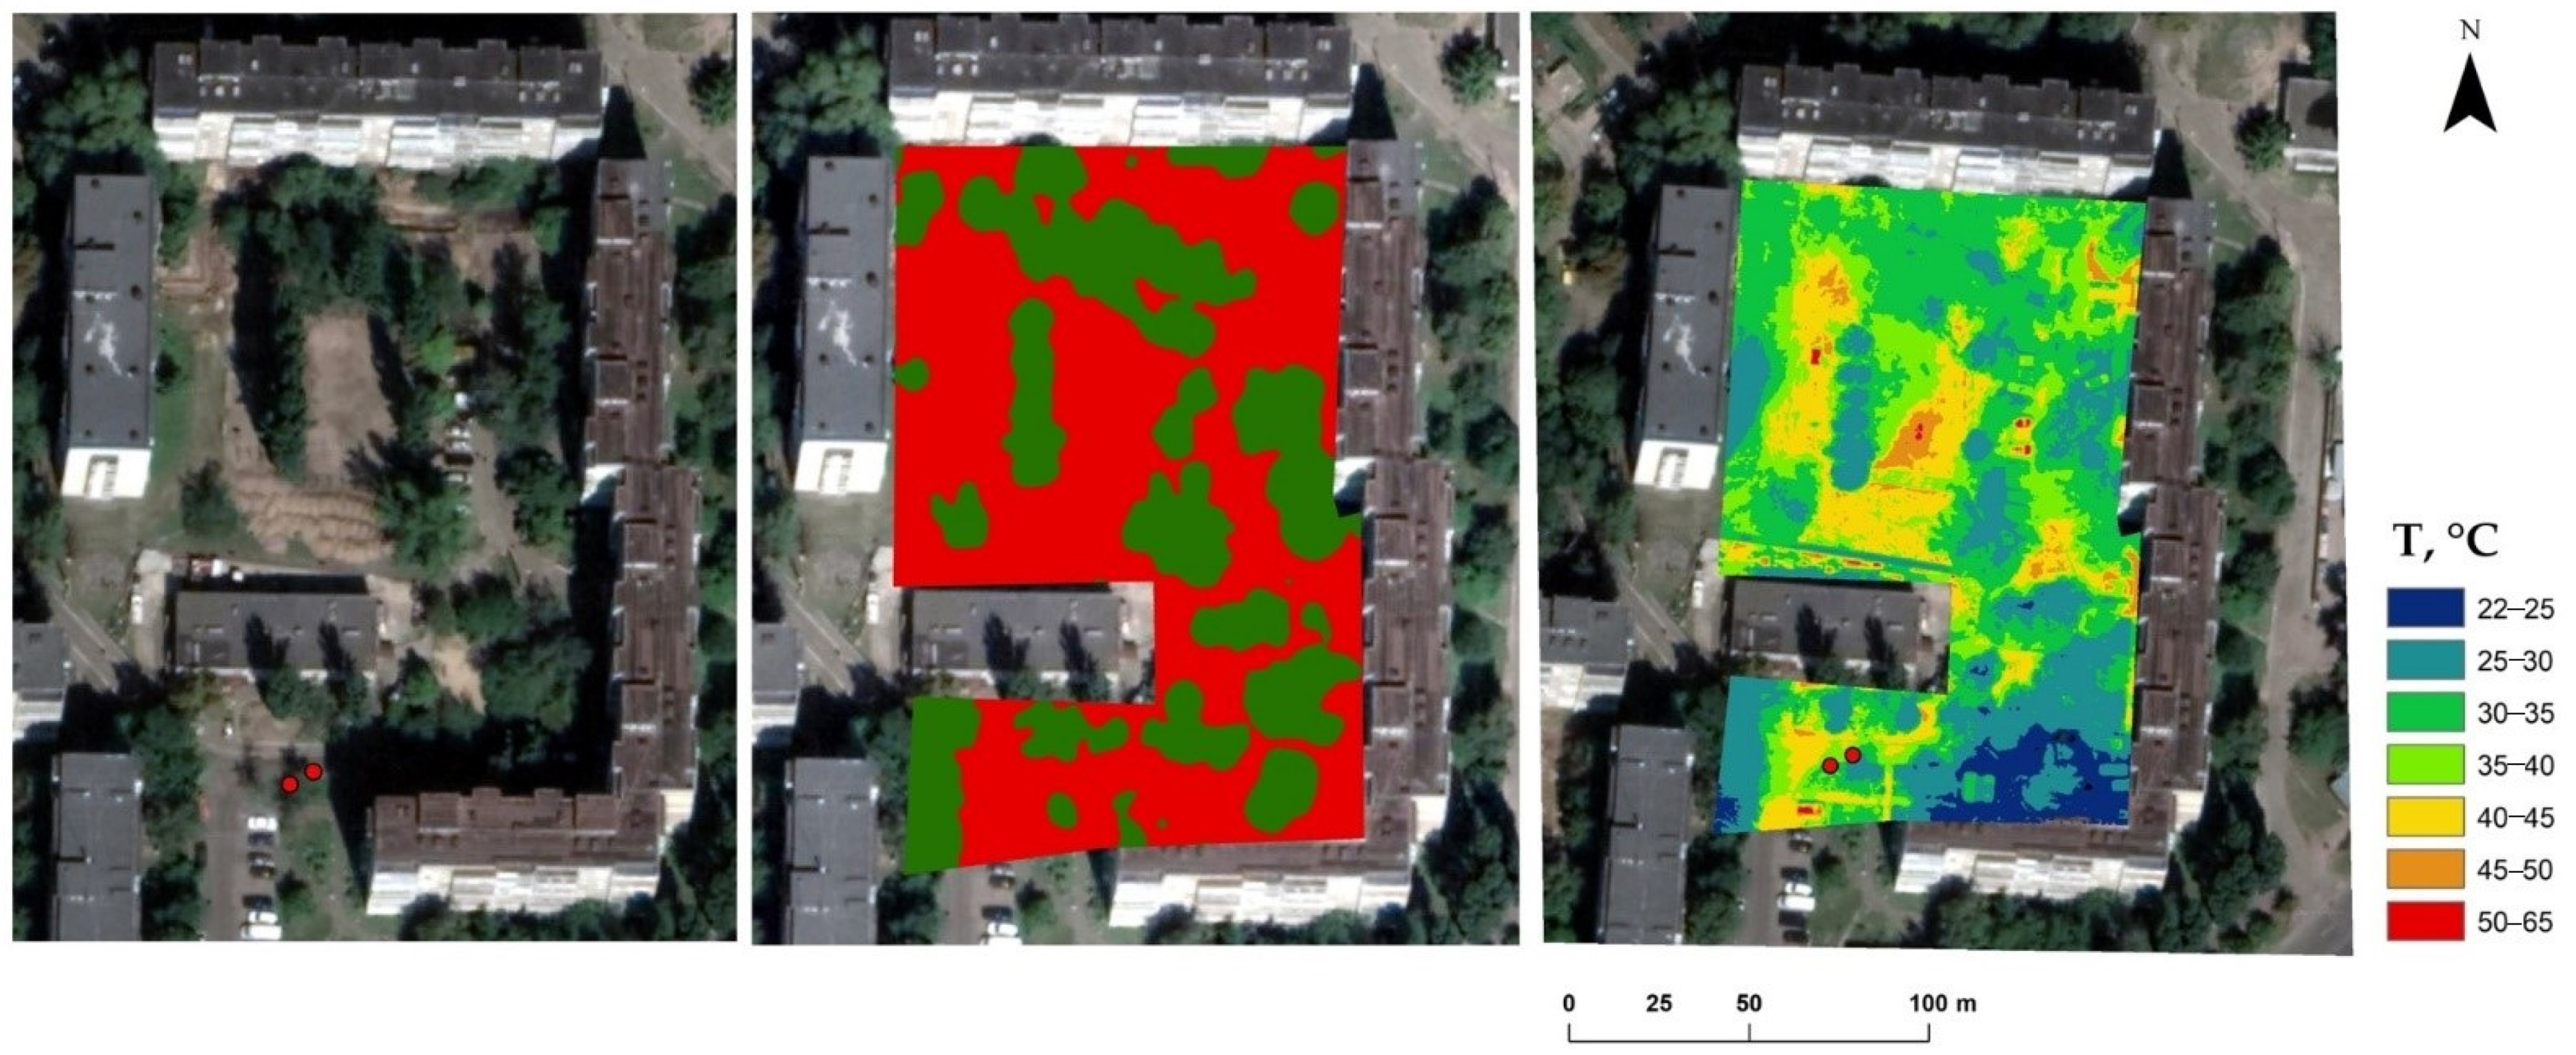
Similar to Location 1, the yard in Location 3 had shaded and non-shaded areas (
Figure 9). Most of the trees were in the shaded area and provided no additional shade, while the open unshaded area was much warmer. The warmest place in the yard was an open asphalt parking lot, shown in the upper left corner of the image. Like in Location 1, the high-rise buildings did not cast shade over the playground inside the courtyard. On the other hand, this playground was surrounded by trees, and we could clearly see the cooling impact. We mounted the temperature and humidity sensors outside the yard, as it was a relatively newly built one, and the trees inside were quite young and not high enough for placement of the sensors.
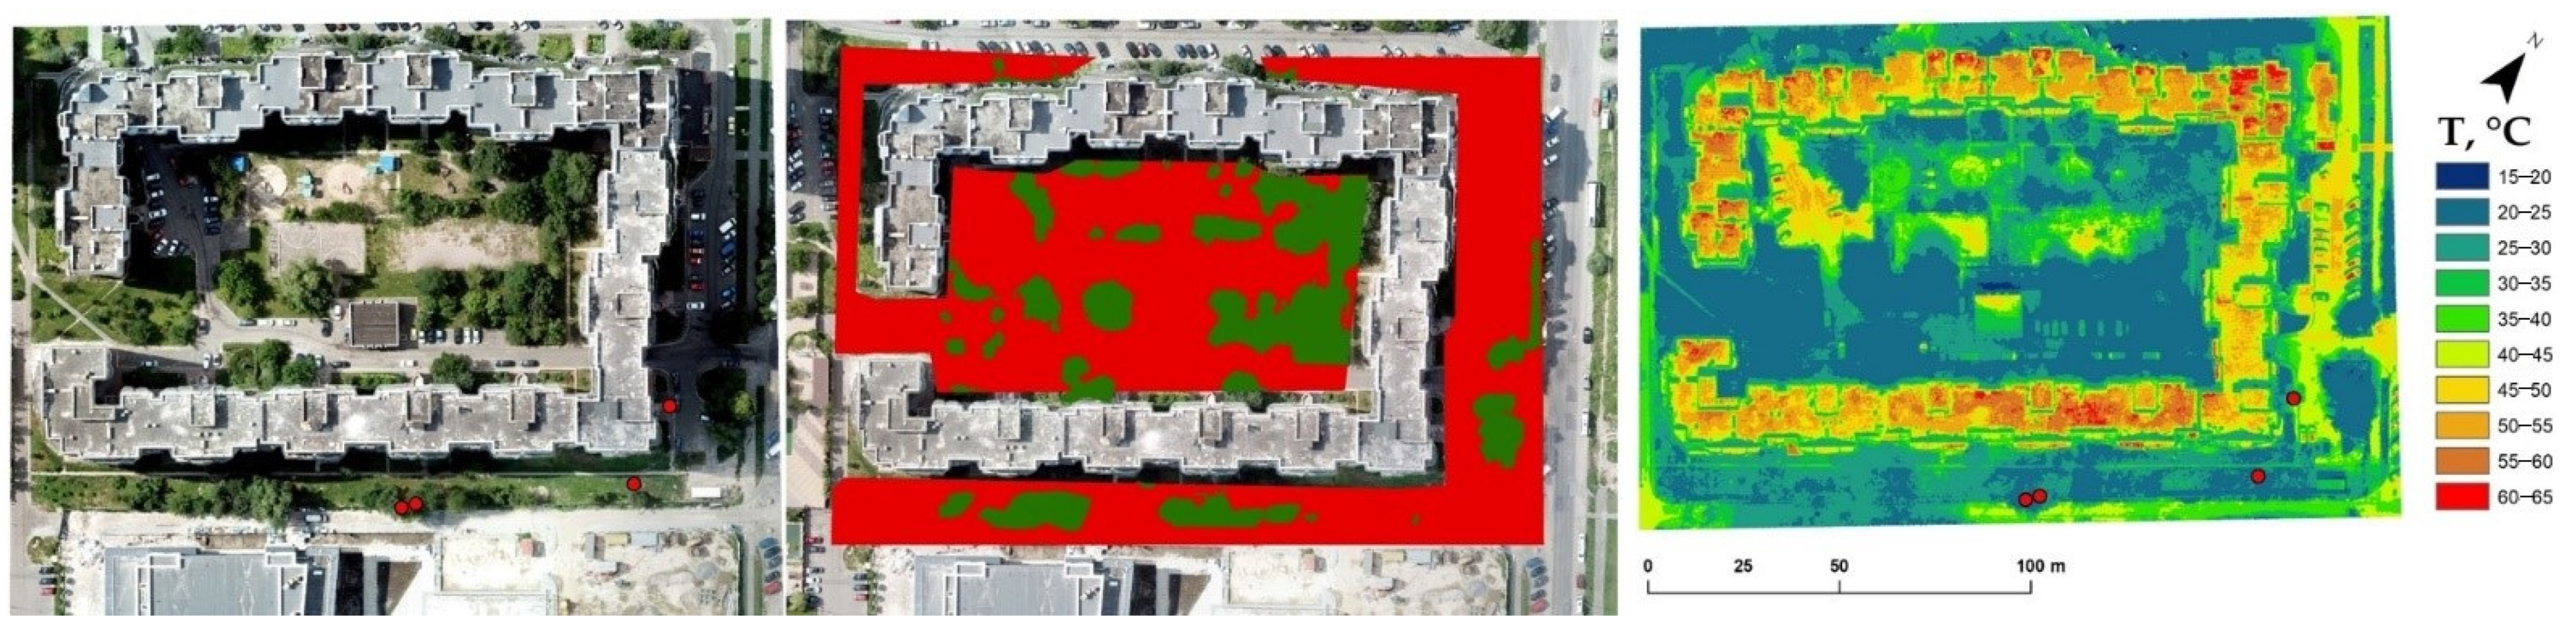
In Location 4, the building did not give any significant shade. It was predominantly the trees that determined the temperature distribution within the entire yard. This yard had the largest tree coverage; the cooling impact of the trees expanded beyond the shaded areas (see
Figure 10).
Location 2 featured a combination of different types of urban greenery, which contributed to cooling, unlike other locations that had less grass and fewer shrubs. Even large trees, if located in a permanently shaded part of the yard, do not play any significant role in shaping a comfortable microclimate during summer heatwaves when there are adjacent large exposed areas with asphalt or ground coverage only (Location 1 being an example).
In general, we may conclude that the shade cast by buildings and other urban structures can play an essential role in shaping the microclimate in residential districts. A combination of tree coverage and shading may contribute to the mitigation of summer heatwaves in public places such as playgrounds and sports grounds. On the other hand, trees planted in spots that are permanently shaded by buildings are of less value in terms of shaping the microclimate.
3.3. Air Temperature and Humidity Recording
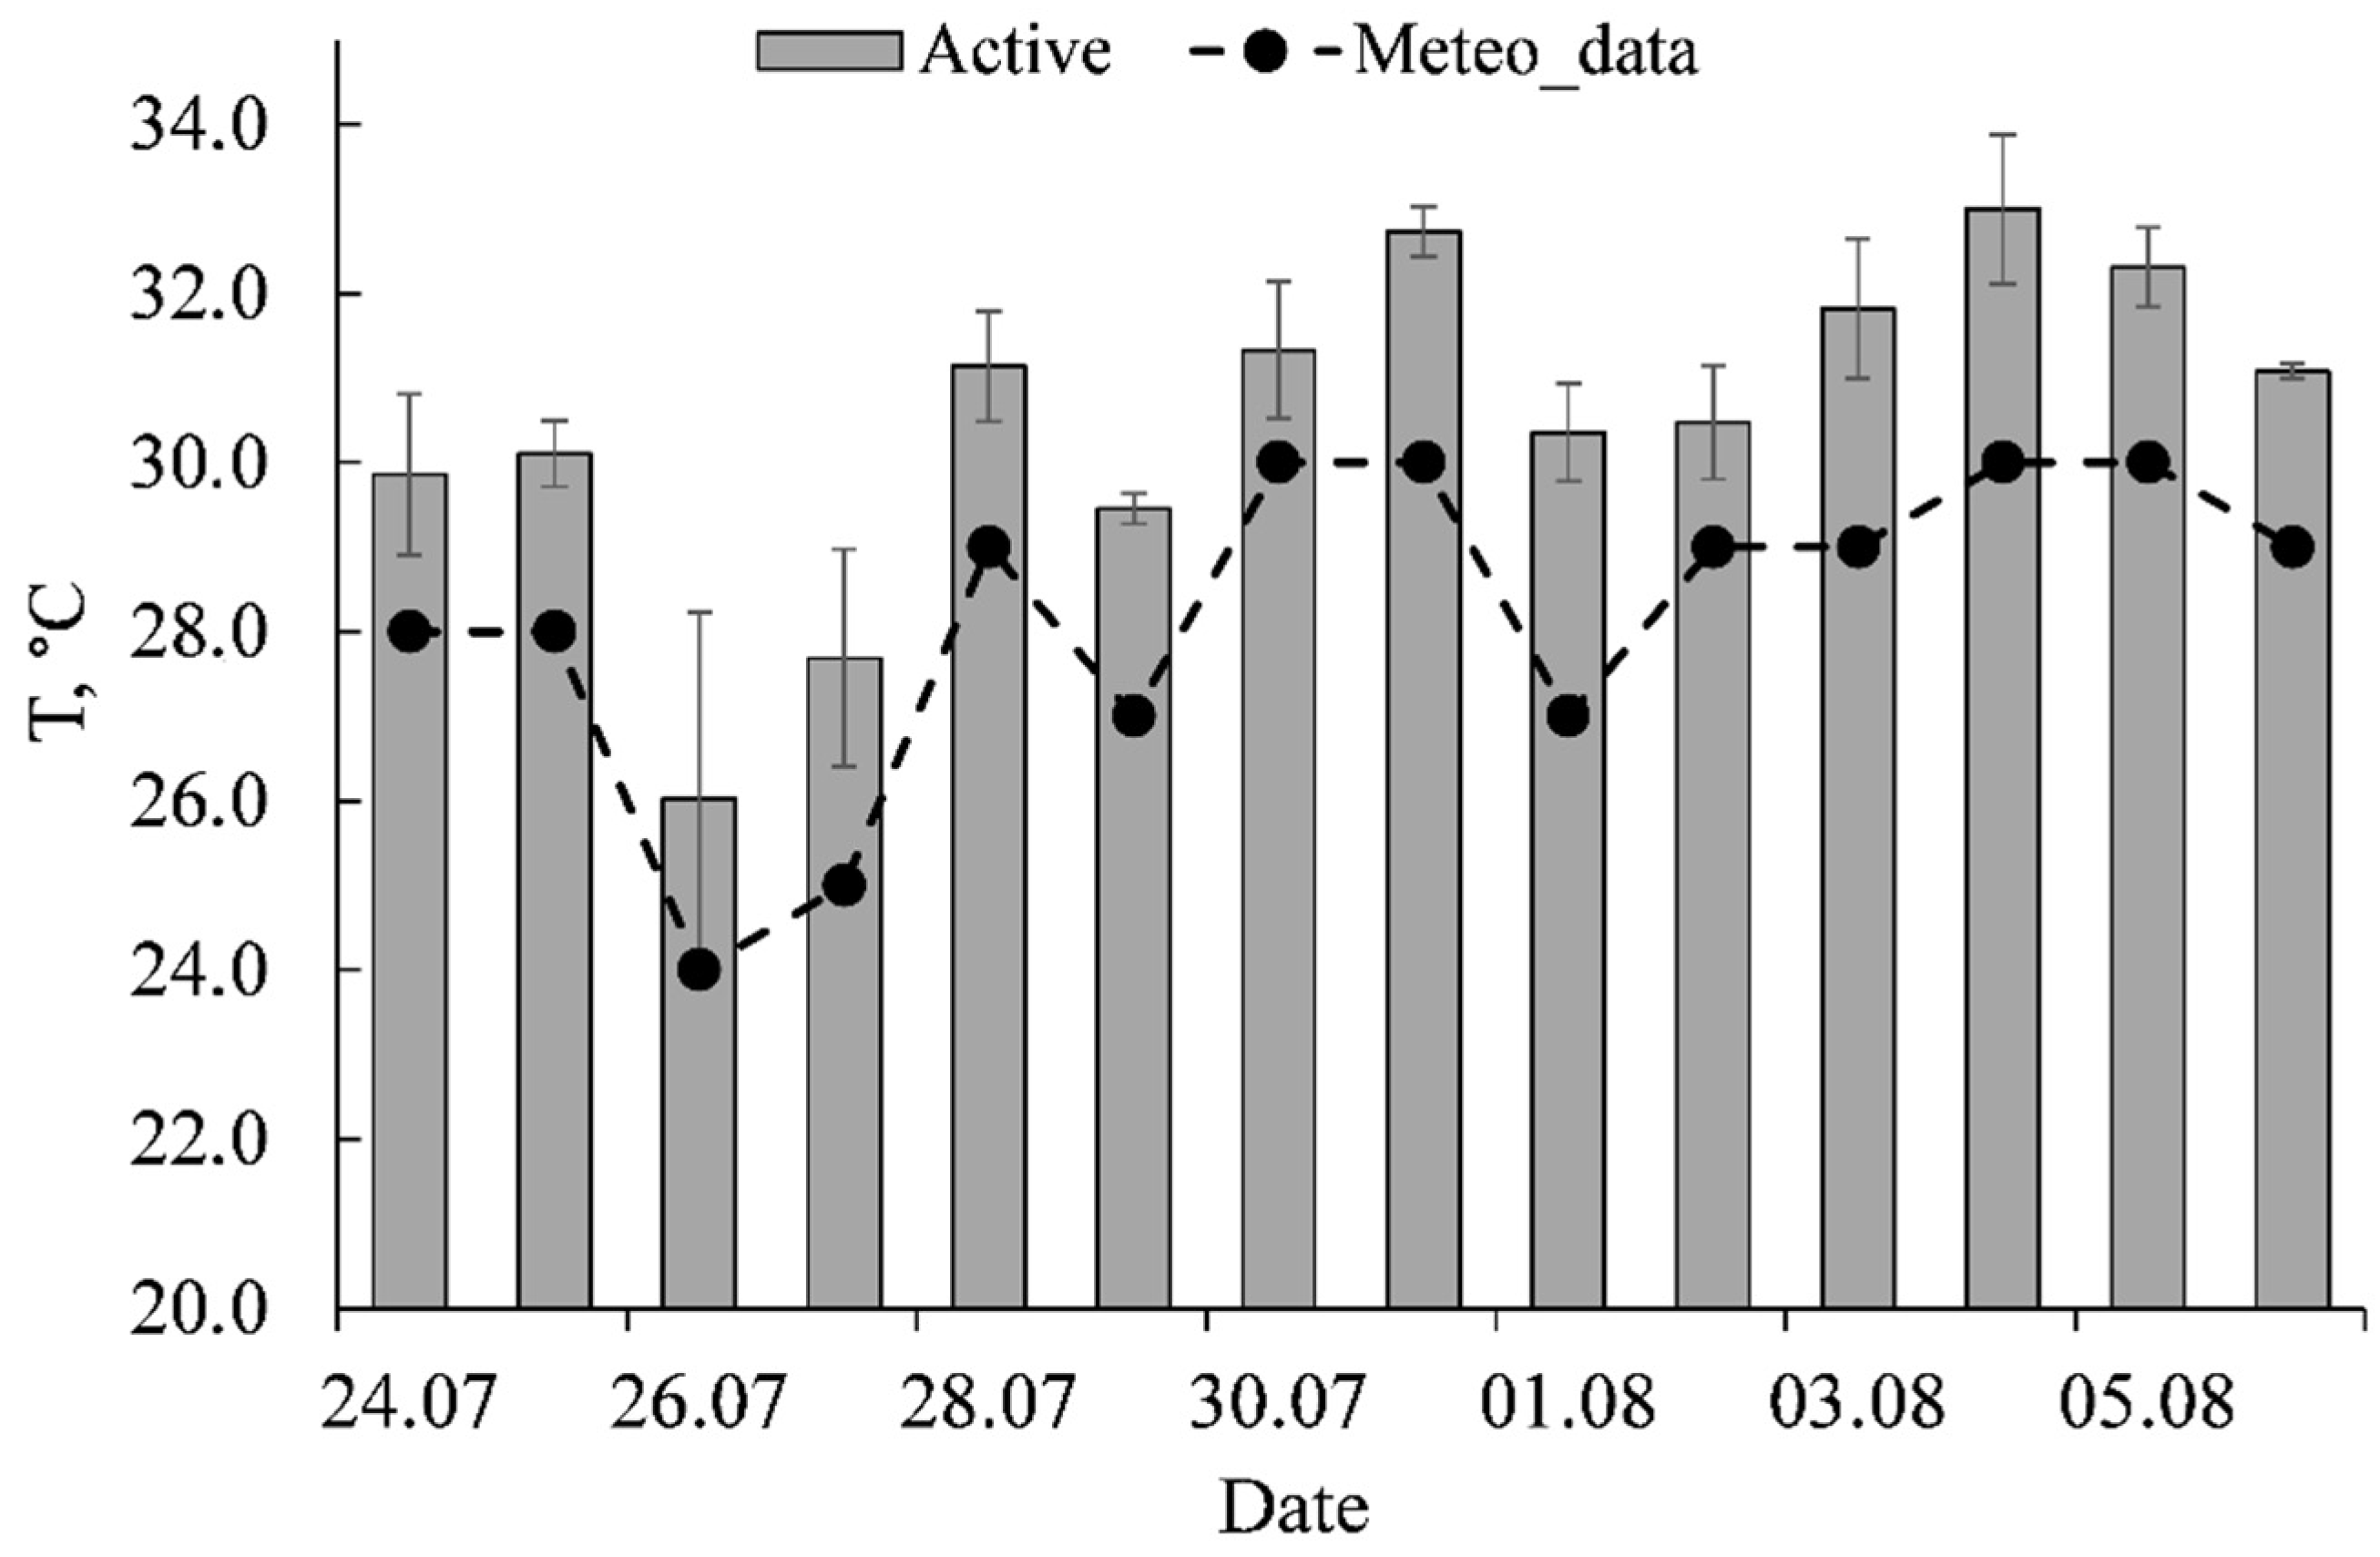
Due to the ongoing measurements (every ten minutes 24 × 7 from 24 July to 7 August 2018), we obtained a large set of air temperature and humidity data. For the purposes of data analysis, we selected three days that were the most representative in terms of steadily hot temperatures over the entire period of measurements: 3 to 5 August. These days had similar temperature distribution profiles (see
Figure 11).
For the data analysis, we considered the daytime temperatures only. During the period of measurements, the average maximum daily air temperature recorded by our “active” sensors in all four locations varied from a comfortable range of 24 °C to 28 °C to high levels of 30 °C to 34 °C. Weather station records taken from the Zhuliany Airport (15 km distance) for these days demonstrated the same air temperature dynamics (see
Figure 12).
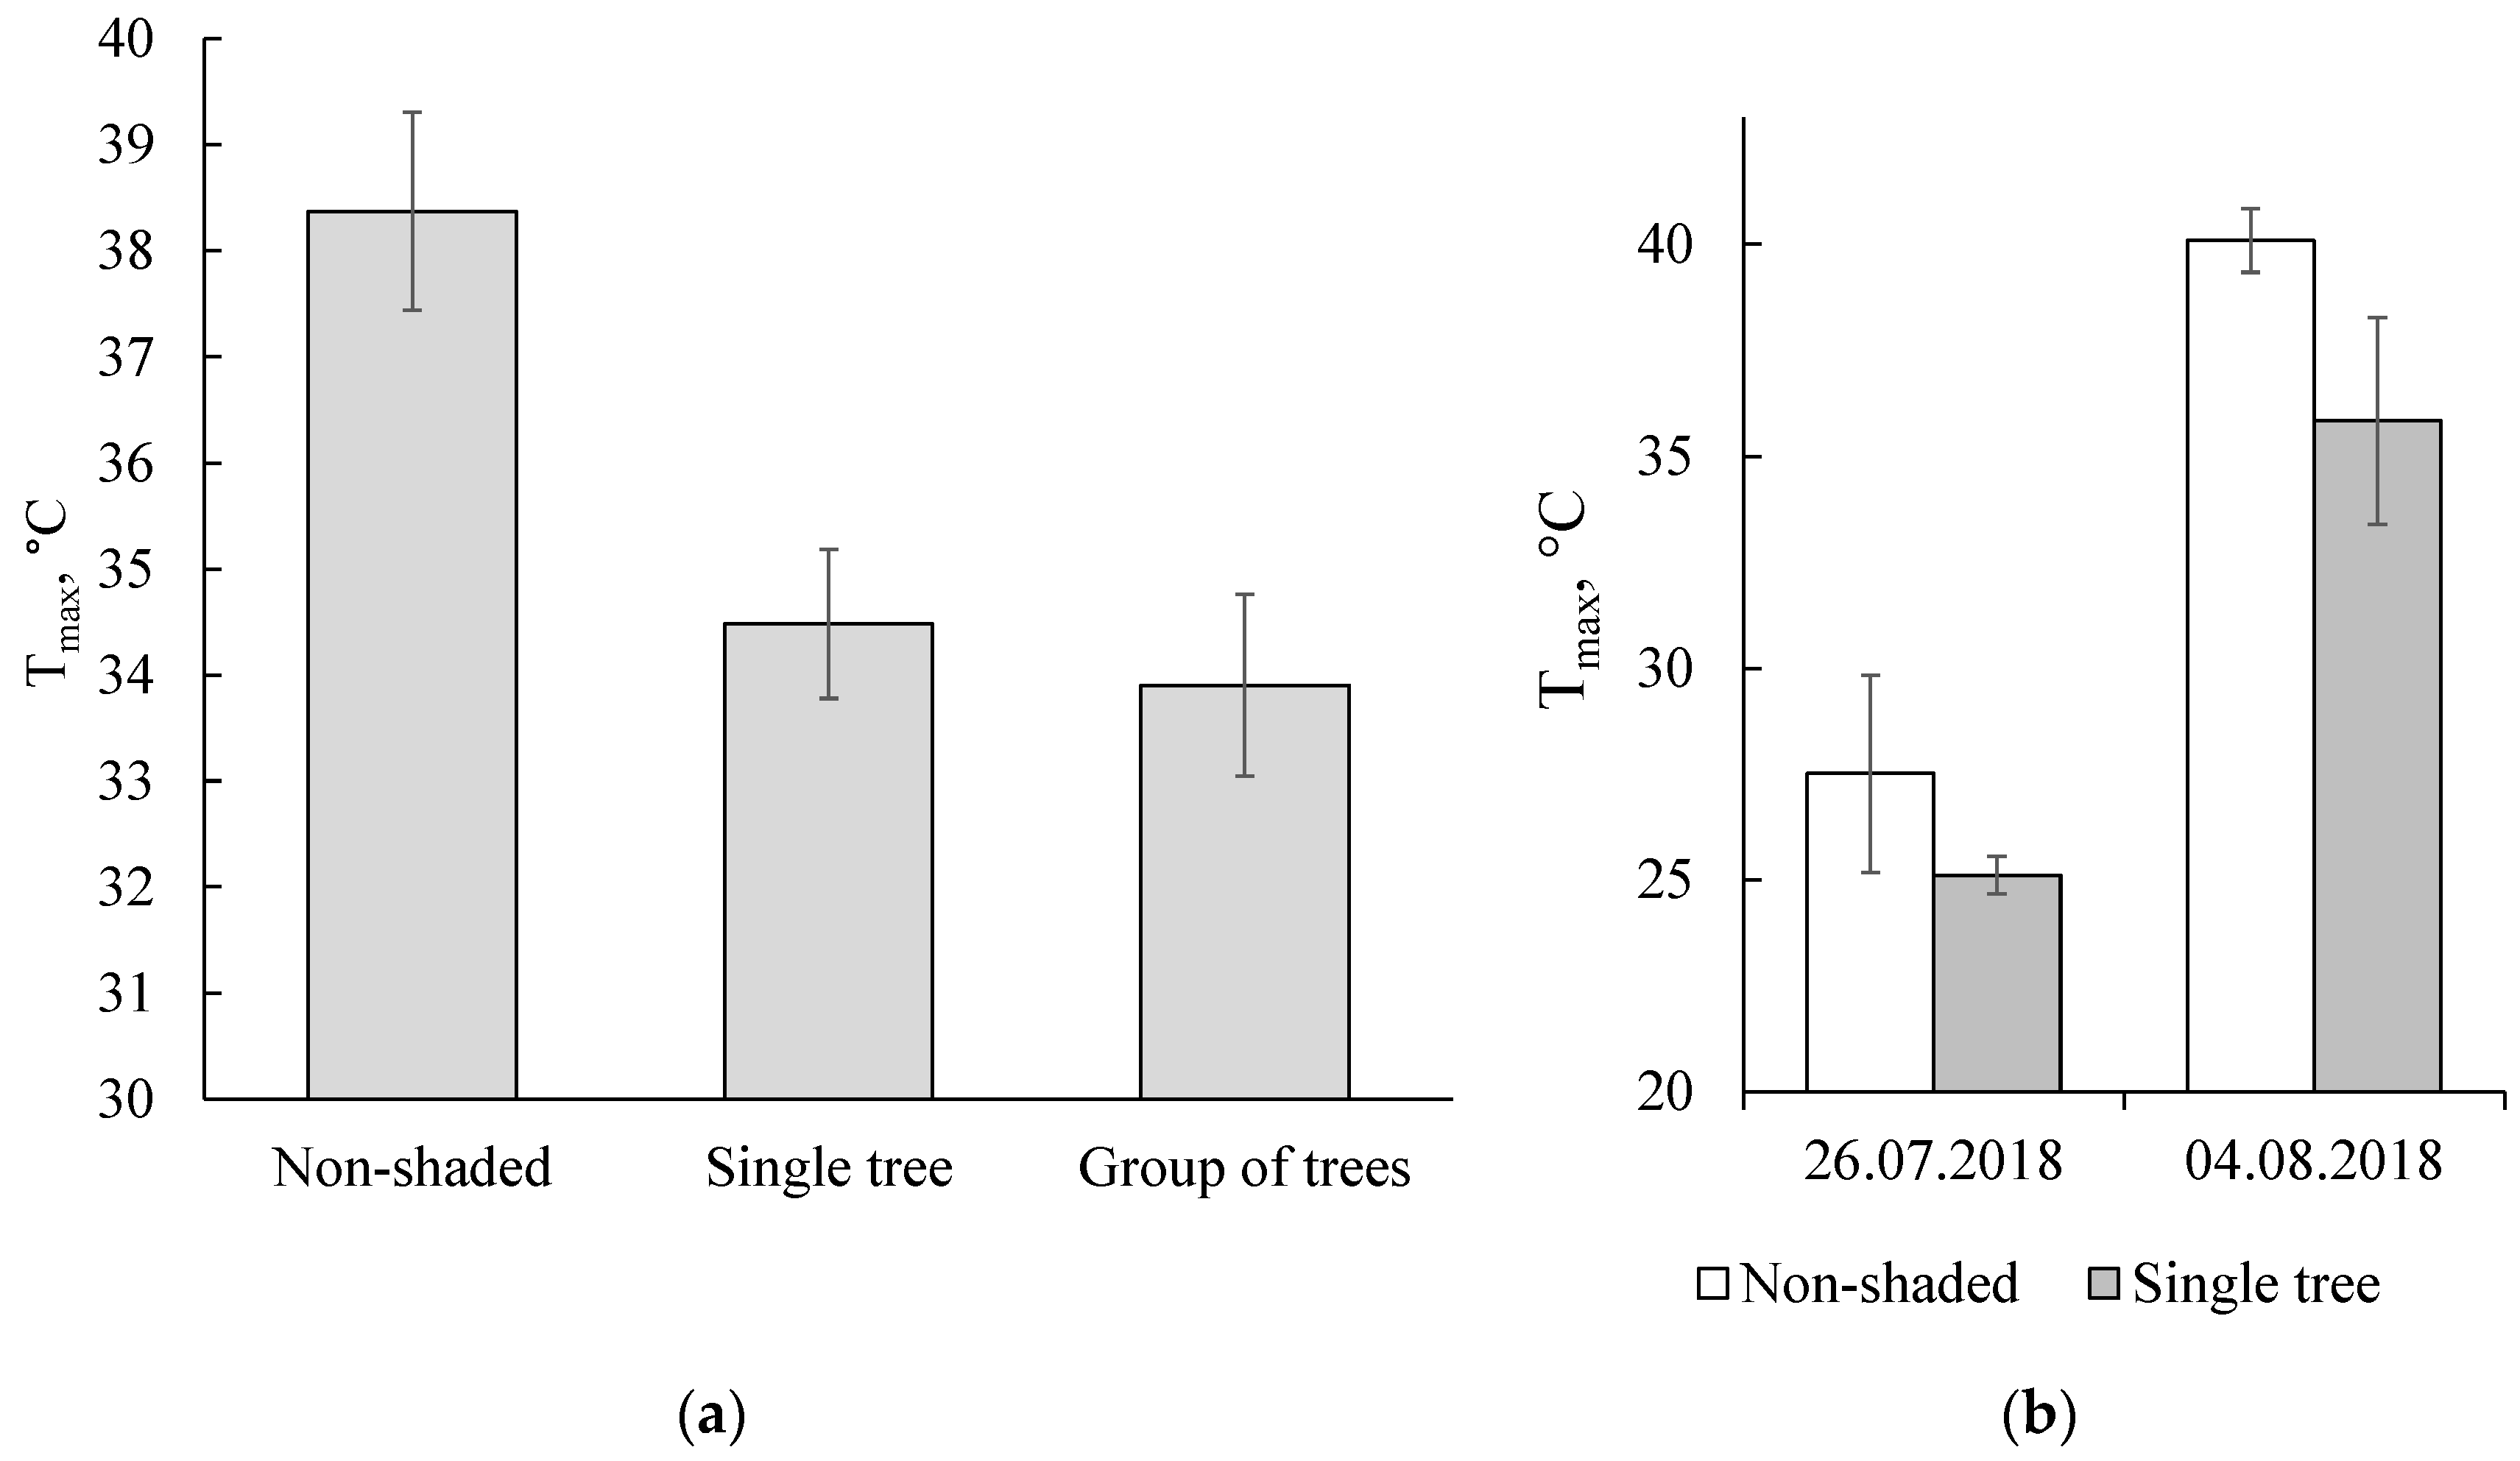
To compare the cooling impact of single trees and groups of trees as opposed to exposed areas, we grouped the daytime data for three hottest days (as described above), gathered from the sensors, in corresponding groups. The average maximum temperatures from all sensors were significantly higher for a “non-shaded” area (38.4 ± 0.94 °C) compared to a “single tree” or a “group of trees” on the selected days (see
Figure 13a). At the same time, the difference in maximum temperatures between a single tree (34.5 ± 0.7 °C) and a group of trees (33.9 ± 0.85 °C) was not significant.
We also evaluated the temperature gap between the “non-shaded” and “single tree” points on the two days that were the most divergent in terms of daytime air temperature: the “coolest” day (26 July), with a maximum daytime temperature of 23.9 °C, and the warmest day (4 August), with the maximum daytime temperature of 33.9 °C. As is shown in
Figure 13b, the difference is obvious in both cases; however, it becomes quite significant on a hot day. The non-shaded area had a maximum average temperature of 27.5 ± 2.3 °C on the cool day and 40 ± 0.75 °C on the hot one, and the shade cast by a single tree cooled the air down with a difference of 2.4 °C–5.2 °C on the relevant days.
This means that the shading mechanism is more efficient––and more crucial––on a hot day. Looking at the standard error variance of the data presented in
Figure 13b, a conclusion can be made that on a cool day the air temperature depends more on the local micro-conditions in the given location, while on a hot day the shading parameters of the “single tree” are important.
These results are quite in line with other experiments aimed at estimating the shading and cooling effect of urban trees on a microclimatic level; Bau-Show Lin and Yann-Jou Lin [
39] recorded a 0.64 to 2.52 °C difference of air temperatures under the canopies and in the unshaded exposed areas of a subtropical urban park.
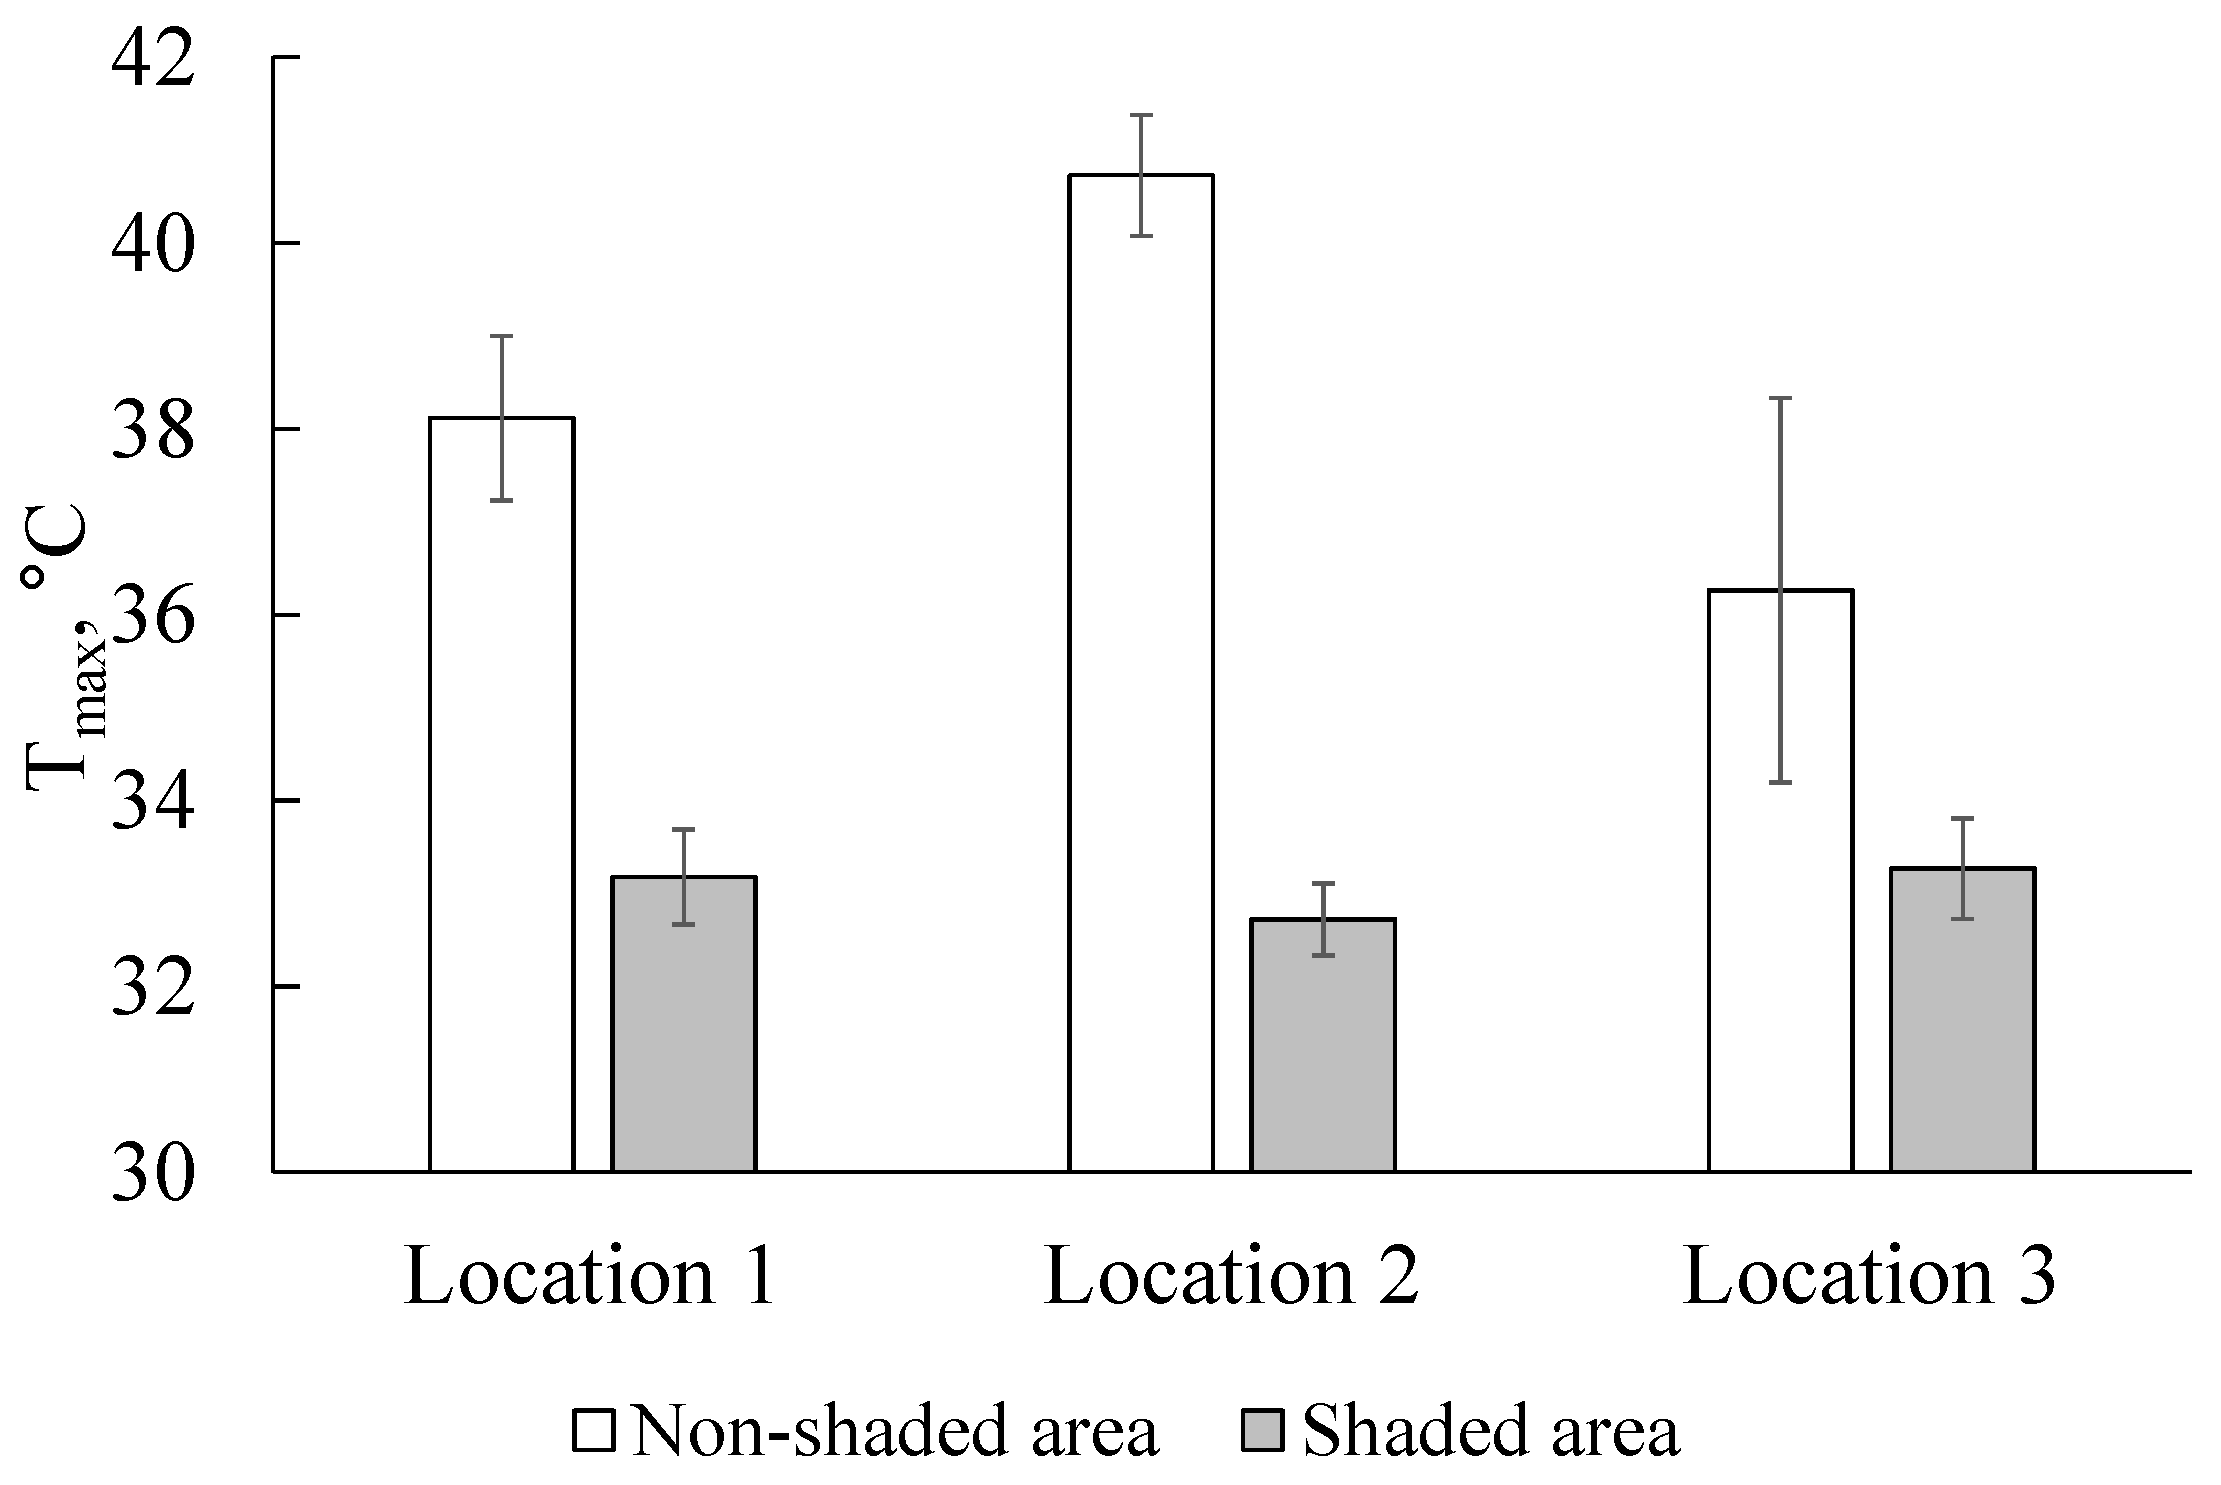
If we group the maximum average temperatures by location (
Figure 14), we can see that Location 2 (greenery coverage 40.6%) has the highest temperature profile for the non-shaded area (40.7 ± 0.4 °C). There is no difference between maximum average air temperatures recorded by “active” sensors; this means that the greenery density (number of trees) did not have an impact on the air temperature in the shaded areas of given locations.
The reason for this might be in an insufficient gap in the greenery density levels of the locations, which ranged from 21.5% to 40.6%. Our previous study [
33] showed a strong negative relationship (r
2 = 0.72) between the vegetation density and average summer temperatures in Kyiv. The lowest level of vegetation density of 0% to 10% corresponded to the highest average surface temperatures in summer (35 °C to 37 °C), according to the thermal infrared imagery derived from the Landsat-8 satellite. Nyuk Hien Wong and Tyng Tyng Peck [
40] described the same effect in Singapore: a location with 22% vegetation coverage had a lower ambient air temperature (32.5 °C) compared to a location with 7% vegetation coverage (34.6 °C). On the other hand, an empirical model from Shashua-Bar and Hoffman [
41], based on field data gathered in eleven various wooded sites in Tel-Aviv, also demonstrated the same cooling effect of the shade factor for all sites, with shade being the major factor in determining the cooling effect of the site.
To estimate the efficiency of trees in mitigating sharp temperature fluctuations on a hot day, we compared the dynamics of temperature changes for all four sensors (“non-shaded”, “single tree”, “trees in a group”, and “active”) in Location 2 for August 4, from 6 a.m. until noon. To make the dynamics clearer, we also compared the differentials of the temperature slopes (see
Figure 15).
Therefore, while the temperature of the sensors placed in the areas exposed to direct sunlight (lampposts) was rapidly increasing, all other locations that had at least some shade (like a single tree without a dense canopy) showed a buffering capacity against the heat on a microclimatic level. In terms of heat mitigation, groups of trees proved to be the most effective; even though they had the same afternoon air temperature readings as “single trees”, they ensured a smooth increase in temperature throughout the day.
3.4. CO2 Fluxes at the Leaf Level
The rate of CO
2 exchange at the leaf level varied greatly not only in different tree species but also between separate trees. That is why we did not group the data derived from trees of one species, assuming their differences in physiological activity at the time of measurements (see
Figure 16).
The dynamics of CO2 fluxes at the leaf level of the selected tree species in comfortable and hot temperature conditions showed that
Tilia cordata and Acer negundo did not have any significant differences between hot and comfortable temperature conditions but were not active in photosynthesis overall. Possibly, increased repetitions might have revealed a more significant temperature gap.
Robinia pseudoacacia is a heat-tolerant species; there was no significant difference in photosynthetic activity during the measurements on both days with intensive photosynthesis.
Salix significantly reduced its photosynthetic activity on hot days but, at the same time, appeared to be the most productive species among all investigated.
The building density did not influence the CO2 fluxes of the selected tree species at the leaf level.
3.5. Legislation Analysis, Drawbacks, and Urban Tree Inventory Challenges
Rules for maintenance of green spaces in Ukrainian towns and cities (2006, as presented in
Table 5) classify all types of green spaces in cities and towns of Ukraine in the following way:
Public green spaces (parks, zoos and botanical gardens, squares, boulevards);
Limited-access green spaces (vegetation in the territories adjacent to public and residential buildings, educational institutions, health care institutions, industrial enterprises, etc.);
Special-purpose green spaces (planted along highways and streets, green belts around industrial enterprises and high voltage transmission lines, etc.).
Authorities responsible for the maintenance and management of all types of green spaces in cities are listed in
Table 6.
Limited regulatory access and lack of governmental control and monitoring of green spaces within residential areas is highlighted in the scope of this research. Since the ownership of and responsibility for greenery are those of the area owners, the decision-making process and compliance with legislative requirements remain non-transparent and difficult to control.
In order to estimate the adequacy of the existing regulations in terms of ensuring proper management, development, and planning of urban vegetation under different ownership schemes, we analyzed a set of legislative provisions, as presented in
Table 5. The analysis supports all the challenges mentioned above that stem from an unclear allocation of responsibilities, unnecessary degree of freedom and flexibility in control procedures, and a “closed-loop” of owners who are obliged to manage the urban greenery and control the quality and sufficiency of this management.
Another issue related to the ability of urban vegetation to create a comfortable microclimate for people on hot summer days stems from the vegetation coverage requirements set by Ukrainian legislation. The “State Building Standards B.2.2-12:2018” establishes that vegetation in residential districts of Ukrainian towns and cities is supposed to cover at least 25% of the district’s area. In this study, we have demonstrated why covering 25% of the area with vegetation would be not sufficient to mitigate heatwaves in a large city. In contrast, the “State Sanitary Rules for Urban Planning and Development” designate that the coverage level must be 40%. Therefore, regulations need to be harmonized and brought in line with each other to consistently designate the required share of vegetation in a given area.
A significant number of challenges related to the state and process of the urban green infrastructure inventory have been recently addressed in research papers [
29,
32]. The majority of these challenges and issues are also of relevance to Ukrainian towns and cities. National legislation defines that urban green infrastructure inventory must be taken at least once every five years (Decree N 226 of 24 December 2011). This is a clearly inadequate data collecting scheme, given how dynamically climate change impacts appear at the local level. To be able to respond in a timely manner to extreme climatic changes, the overall municipal decision-making process on green space management should be based on more regularly updated data.
In addition, Ukrainian municipalities already have quite a lot of urban tree inventory data; these data, however, are localized in city databases and are not shared between cities and towns or with researchers. Since 2018, a number of new interactive maps of urban green spaces have been introduced to make the green inventory process more transparent and participatory; they include
Map of tree planting plans of Kyiv public utility company Kyivzelenbud (2020)
Open access inventory map of Odessa (SoftPro 2020)
Common database platform with the open access inventory maps of Lviv, Lutsk, Rivne, and Dubno (InspectTree 2019–2020)
Open access inventory map of Bila Tserkva (SoftPro 2019)
Another issue is that different urban green areas are managed by different stakeholders (public vs. non-public, central municipal administrations vs. district administrations); these stakeholders are not all accessible to the public in the same manner and are subject to a lot of other administrative distinctions. This might result in limited access to inventory work and the exclusion of some urban spaces from formal classifications (sometimes due also to their small spatial scale and temporal or transitory nature).
Among other challenges, there is a lack of detailed coherent guidelines on inventory work approved by local authorities. The limited inventory data are primarily used in operational tasks in a non-transparent manner, public engagement is extremely low, and municipal technical staff lacks the skills to use special remote sensing data. Overall, the level of cooperation between various institutions responsible for data collection and management of urban green spaces in Ukrainian municipalities is insufficient. The lack of techniques for evaluating and measuring the urban vegetation quality and the lack of tactical partnerships between various management levels are also described in the case of Norwegian municipalities [
42], which might be evidence of the general existence of such barriers in European cities.
4. Conclusions and Recommendations
Although the research helped produce many recommendations for the planning and management of urban green spaces in Ukrainian towns and cities undergoing climate change impacts, the general limitation of local relevance should be taken into account. The general conclusions on the interrelation between various types of greenery and the cooling effect they have on a microclimatic level might be relevant to other cities of the same size and in the same climatic zone. Nevertheless, as highlighted by [
27], for accurate recommendations on urban vegetation planning, they should be localized in every particular case. This need for localization validates the added value of this research in providing a case study that describes a combination of low-cost urban greenery inventory methods that could be used by municipal governments and private land managers to estimate the contribution of urban trees to the mitigation of urban heat impacts. This combination of methods and datasets may be used to build a research database necessary for local decision makers in any European city.
To proceed to more detailed conclusions, satellite and UAV-borne mapping clearly showed that the shades cast by urban vegetation and buildings are key in determining the temperature conditions within residential areas. In other words, it is important to consider shades from buildings and trees when planning the yard layout and infrastructure. A well-thought-out combination of tree coverage and shading factors may contribute to the reduction of summer heatwaves in public places like playgrounds and sports grounds. On the other hand, trees planted in spots that remain constantly shaded by buildings provide less benefit in terms of microclimate formation. Lawns significantly decrease the surface temperatures of open areas, even when exposed to direct sunlight. Also, combining various types of urban greenery proved to be effective for cooling, as opposed to other locations that had less grass and fewer shrubs.
A planting density of over 30% results in a good cooling impact even outside the shaded areas. As we found in 2016 [
33], a 10% increase in the planting density results in decreasing the mean surface temperatures in summer by 1 °C in Kyiv. Many researchers highlight the importance of the planting density. Huang Y. et al. [
43] showed that an additional 25% increase in the urban tree coverage could save 25% to 40% of the annual cooling energy use in an average American house, depending on the climatic zone. According to the Ukrainian State Building Standards, vegetation is supposed to cover at least 25% of the area in residential districts of Ukrainian towns and cities. However, “State Sanitary Rules for Urban Planning and Development” recommend 40% coverage, which is, in our opinion, a lot closer to a beneficial level of greenery.
In terms of the air temperature redistribution in space and time on the micro-level of a courtyard, it was found that on a cool day the air temperature depends more on the local micro-conditions in the given location, while on a hot day the shading parameters of the “single tree” are important. In the summertime, the air temperature in sun-exposed areas increases sharply; all other locations that had at least some shade (like a single tree with not very dense canopy) showed a buffering capacity against the heat on a microclimatic level. In terms of heat mitigation, groups of trees proved to be the most effective; even though they had the same afternoon air temperature readings as “single trees”, they ensured a smooth increase in temperature throughout the day.
Heat tolerance of the various urban tree species should also be taken into consideration. Our research demonstrated that Tilia cordata and Acer negundo do not have any significant differences in hot or comfortable weather conditions but do not actively absorb CO2 during the photosynthetic processes. Robinia pseudoacacia is a heat-tolerant species. Salix significantly reduced its photosynthetic activity on hot days, but at the same time, it appeared to be the most productive species among all featured in this study. Public utility companies should consider the productivity of the trees they are planning to plant, but also the activity of photosynthesis during heatwaves and extreme temperatures, since these will be occurring more often due to climate change impacts in Ukraine.
The overall scheme of municipal decision-making on urban green infrastructure inventory should be based on more frequently updated data sources to enable the municipality management to provide a timely response to extreme climatic changes as well as the dynamically changing urban environmental conditions that are threatened by climate change impacts. Overall, the research shows that the implementation of a complex system of advanced operational monitoring of indicators, which would characterize not only weather conditions (and hence the climate) but also how comfortable the living environment is for people who are facing climate change threats in municipalities, is of high relevance. The current World Meteorological Organization (WMO) concept of the Urban Integrated Hydro-Meteorological, Climate and Environmental Services may be used as a basis. This involves the usage of weather, air quality and hydrological models to produce spatial (1 km) and temporal (15 min to 1 h) high-resolution data for “state-of-the-art eco-centric city planning and design”, as stated in WMO Bulletin “Climate Change: Science and solutions” [
44]. A set of “climatological impact indicators” may be built on an urban scale to make the decision-making process for the municipal authorities more science-based. Moreover, the multi-step process of green infrastructure design planning can be applied as described by Capotorti et al., with the definition of the priority objectives, locations, and restoration and conservation actions [
45].


