Abstract
The main aim of this paper is to point out the assumptions of motorway operation effects on local transport. We assume positive effects of starting motorway operation on the specific section of road I/11. This section connects the cities of Žilina and Čadca. It is considered as one of the most problematic sections of the Slovak Republic because of the high intensity of individual transport and freight or cargo transport. This transport issue is growing beyond the regional level and is reaching alarming proportions. It needs to be solved as soon as possible. One of the available possibilities is to start the operation of the mentioned motorway D3. We have created a simulation model of a current state and also the state with the motorway. We have used intensities from the last national traffic census as basic inputs for simulation. These intensity values have been recalculated by relevant growth coefficients defined in Technical Conditions no. 102. Based on the results of a dynamic simulation, we have compared the average speed, delay times, and the length of congestions in two scenarios—the current state and effects of motorway operation.
1. Introduction
At present, a network with a total length of approximately 18,072.1 km is used in the Slovak Republic [1]. The forecast for the development of the degree of motoring for 2020 is 2.24 (446 passenger cars/1000 inhabitants), while in 2000, there was one passenger car for more than four inhabitants [2,3]. Munich, Berlin, Hamburg, Vienna, and Zurich—the largest cities in Germany, Austria, and Switzerland—have significantly reduced the car share of trips over the past 25 years in spite of high motorization rates. The key to their success has been a coordinated package of mutually reinforcing transport and land-use policies that have made car use slower, less convenient, and more costly while increasing the safety, convenience, and feasibility of walking, cycling, and public transport [4].
Road I/11 via Kysuce is an international route to the Czech Republic. The traffic load is constantly increasing, especially in the case of freight transport, which represents 42% of the total number of vehicles [5,6,7]. A number of factors affect the traffic flow [8,9,10]. The traffic flow also influences its surroundings both quantitatively and qualitatively by its behavior [8,11]. Analysis of the relationship between traffic flow parameters can make and provide a basis for rational planning and efficient traffic management [12,13,14].
The transport performance of road freight transport is significantly growing [15,16,17], while the importance of transport modes suitable for the transport of large volumes of goods without excessive burden on infrastructure and the environment declines, or it is completely negligible in the total transport volume [18,19]. Many studies [20,21,22,23,24] have focused on traffic modeling using simulation, which is a cost-effective solution. Simulation is used for answering the question “what if?” about things that are too complicated or expensive to test in reality. The transport system is under intensive investigation through modeling and simulation. The simulation model describes the specific abstractions of the proposed one and is built in an effort to understand the system [25,26]. The behavior of vehicles and their interaction can be accurately imitated using dynamic simulation. Traffic flow monitoring was performed on the first-class road I/11, which is part of the European road E75 [27]. Using simulation, the impact of the highway bypass on delay time, maximum queue, and speed was verified. In [28], the authors focused on the impact of the bypass on air pollution in the city.
The D3 motorway section of Žilina–Svrčinovec should have been already completed according to construction plans but the completion date is still shifting. The construction of the Kysuce part of the D3 motorway will bring a safer transport solution for the region. In addition, a comfortable connection will be created between Slovakia and neighboring Poland and the Czech Republic [29]. Statistics show that there are currently about 30,000 cars passing through. The EU forecast assumes an increase of up to 50,000 to 60,000 cars in 24 h. The current road has no chance to accommodate such a large amount of transit traffic. Therefore, it is obvious that a complete motorway is needed throughout the Kysuce region in its full profile [30]. Partial construction still only pushes the problem up and down and never solves it. The missing motorway is a problem in Slovakia and an international problem [31].
The completion of the D3 motorway (Figure 1) thus reaches the economic and political level in terms of priorities. It is a question of mobility of Kysuce region and, in a broader view, of transport corridors a European issue, but above all, it is a question of mobility of the whole Slovakia. The missing part of the road network complicates the economic development of the northern and eastern parts of Slovakia [32,33,34].
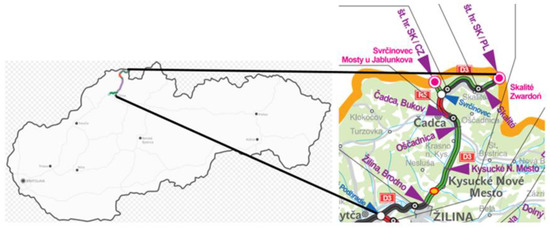
Figure 1.
Motorway D3 [30].
In our paper, we have set a hypothesis on how the traffic flow will be affected after the completion of the D3 motorway. We have used traffic planning software to verify this hypothesis.
2. Traffic Flow Modeling on the Selected Road Communication
The first-class road E75 connects northern and southern Europe [24]. It enters Slovakia via the Svrčinovec border crossing and leads to the town of Žilina with a length of 36.8 km. The construction of the motorway is led along the foot and the peripheral parts of the slopes. Their inclination sometimes reaches more than 25°. The new motorway section will be connected to the existing road network and motorists will be able to use the interconnection of the three states—Slovak Republic, Czech Republic, and Poland.
The selected section of road E75 is relatively loaded with individual passenger transport and road freight transport. It represents a major transit artery to neighboring states. Congestions of vehicles (sometimes more than 10 km long) are an everyday part of this road [35,36], especially around Čadca and Kysucké Nové Mesto during peak hour. The main causes of the congestions’ occurrence around these places are intersections, which are limited by their maximum capacity. Except for these negative effects, it is also a section with the highest number of traffic accidents in Slovakia [37].
The traffic situation in Kysuce is critical; buses and people traveling to the district town are delayed for work. On average, 30 percent of buses run late during the working days. More than 40 percent of buses running late during traffic peak from 14:00. to 17:00. These problems increase even more during the winter. The motorway in this region is the only way how to improve these traffic situations [38].
2.1. Road Safety on the Selected Section of Road Network
Road safety is usually determined by traffic accident indicators. Safety is a result of risk and a degree of risk exposure. The risk is expressed by the number of traffic accidents and a degree of risk exposure is expressed by intensity. The indicators are always related to the same time period, in this case, a year. Based on that it is possible to determine the intensity of traffic accidents (1).
where
- -
- N—number of traffic accidents;
- -
- t—time period [year].
The relative traffic accident rate is represented by the probability of accident occurrence on a road section. It is calculated as the number of traffic accidents divided by transport performance. When calculating this indicator, it is necessary to distinguish whether it is a calculation of the relative accident rate at intersections or at the specific road sections [39,40].
where
- -
- R—relative traffic accident rate;
- -
- N—number of traffic accidents;
- -
- RPDI—annual average of daily intensities;
- -
- t—time period;
- -
- L—length of the selected road section.
A density of traffic accident rate is another indicator that is used for the evaluation of transport safety. This density is related to the number of traffic accidents and the length of the road section. It does not take into account intensity. It can be calculated by the following formula:
where
- -
- H—density of traffic accidents;
- -
- N—number of traffic accidents;
- -
- L—length of the selected road section;
- -
- t—time period.
Table 1 shows that a relative accident rate, dependent on the traffic performance, is not critical in any case. It should be noted that minor incidents were not taken into account because these statistics were not available. Otherwise, the relative accident rate would have achieved higher values. The highest value of traffic accident density was recorded on section I/11, Čadca–Kysucké Nové Mesto, in the number of 1.17 accidents per kilometer per month. Minor accidents were not included in the calculations in this case either.

Table 1.
Indicators of traffic accidents (own study).
Completion of highway construction would significantly increase traffic safety on the selected section of the road network, decrease the total travel time and negative effects of transport on the environment due to reduction of emissions produced in congestions, the number of vehicles’ stops would be reduced (waves of overflowing traffic, which often lead to secondary accidents, would be eliminated) and the drivers’ well-being would be increased.
2.2. Traffic Simulation Model
The simulation model includes mathematical and logical relations, which represent parts of the simulated system related to the aim of simulation. Random effects are included in form of probabilistic characteristics.
The model allows us to perform calculations repeatedly and change input data. The transport simulation model tries to describe the mathematical issue of interaction of vehicles and infrastructure [41]. The infrastructure consists of a road network and its operational parts. Transport simulation models are divided into two categories—microscopic approaches and macroscopic approaches.
Microscopic models of traffic flow simulate a single-vehicle driving unit. Dynamic variables of models represent microscopic attributes as position, speed, etc. of a driving unit [42]. The models seek to understand the behavior of the operating vehicle that creates a traffic flow. Among the best-known models is the car-following model, which describes the modeling of a vehicle’s movement (speed and position).
Due to drivers with different individual behaviors, it is possible to look at the traffic flow from a macroscopic point of view. The macroscopic simulation model evaluates the flow of traffic as an entity regardless of the individual vehicle’s characteristics in the operation of the traffic flow. In this case, the term “flow variables” leads to a macroscopic description of the traffic flow. Flow variables are as follows [43]:
- Intensity (or volume)—it is a distribution of vehicles in time (veh/h);
- Density (or concentration)—it is a distribution of vehicles in space (veh/km).
These variables are used in models that characterize traffic flows. Macroscopic models are able to describe the dynamic development of traffic on road networks.
2.3. Calibration and Validation of Model
Model calibration addresses the relationships between the model and real data. Therefore, it is necessary to adjust the partial parameters of the model in order to achieve the greatest possible match with the real behavior of the traffic flow. The software contains a large number of editable parameters, so it is not possible to calibrate them all. Validation is considered the final test of the created model. It is important to know that due to the stochastic nature of the elements, the modified data will never equal reality. A confidence level of around 70% is considered low, but 95% is a very good match. A confidence level of 90% is therefore recommended [44,45].
Road I/11 is very busy, and the D3 motorway (Figure 1) is being built in parallel to relieve the Kysuce region of increasing traffic. Another section of the mentioned D3 motorway, Čadca—Svrčinovec (marked in red), was put into operation in December 2020. Due to this fact, a dynamic simulation was performed using the simulation software Aimsun. The aim of the simulation was to verify the impacts resulting from the launch of this section, on the town of Čadca and on the rest of the road I/11.
2.4. Modeling of the Selected Road Section
For the need of creating a transport model, we used a base map on a specific scale. The transport network was created on this map. This network copies the actual road network with set parameters such as the speed of vehicles, lane widths, etc.
The most important nodes (origins and destinations) were created on the road network, which can be seen in the following Figure 2. The whole modeled network is simplified in form of a graph considering its length of 36 km.
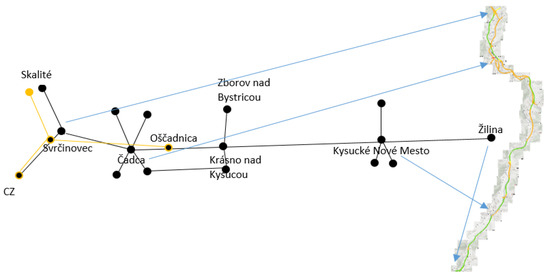
Figure 2.
Simplified road network map as a graph (own study).
Maximum speeds on the road sections were set from 30 km/h to 100 km/h. These settings are based on the actual vehicles’ speed on the road network. At the roundabout, the speed of traffic is chosen in the range of 20—40 km/h. For the needs of traffic modeling, a value of 30 km/h was chosen, which is suitable for a smooth and safe passage [46,47]. The next step was to set up signal plans at the three intersections, which form significant transport nodes.
It was also necessary to create a matrix of transport relations between each district and redistribution according to specific vehicle categories. Based on the available statistic transport surveys data, the following two situations were compared:
- Current state of traffic without the influence of D3 motorway;
- Prognosis with the influence of D3 motorway operation.
In both cases, an average density, speed, travel time, and delay time were compared. The input intensity of simulation was the same for both compared cases.
3. Transport Data Collection
The monitored section of the road belongs to the main road transit routes in Slovakia. According to the prognosis of the average daily intensity of traffic, on the most loaded section of road I/11, it is assumed the intensity of 24,097 veh/24 h in 2020, which on average represents 1004 veh/h (an orange node in Figure 1) [33].
For simulation creation (an origin/destination matrix), data from the last national census of transport (2015) were used. These traffic intensities were multiplied by the relevant forecast coefficient according to TP 007 (technical regulation)—forecast of intensities on the road network until 2040 [48,49].
The composition of the traffic flow was different on each road. Three types of vehicles were considered, and their average composition in the simulation model was as follows: individual passenger cars (61%), trucks (37%), and buses (2%). The values of intensities between origins and destinations were modified in a way that the results of simulation correspond as much as possible to reality. Another important step was to modify the centroids of the roads, so generating vehicles in the dynamic model reflected real data. Basically, it was a percentage between two origins (destinations) of the route, which were generated from one source. Specifically, it was a centroid CZ and Skalité, where there is a choice between two roads—the D3 highway and the road I/11 (Figure 2).
There are three intersections with traffic lights, where congestions occur regularly on the selected road section because of a high number of passing vehicles. The biggest traffic issue occurs in front of the intersection in the direction from Svrčinovec to Čadca and at the intersection near Kysucké Nové Mesto (see Figure 3).
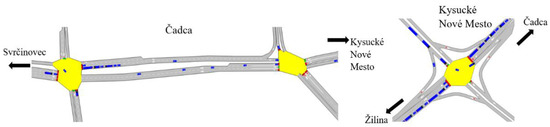
Figure 3.
Intersections in road I/11 in the city of Čadca and Kysucké Nové Mesto (own study).
Long queues of vehicles are formed every day in these places. The length of the queue exceeds several kilometers and the delay time of vehicles reaches more than 1 h; of course, the longest queue and highest delay time occur during traffic peak hour. We have assumed the reduction of the number of vehicles passing through the intersections in Čadca by a half when traffic is diverted on the motorway. This solution includes also a reduction of negative impacts of transport on the city of Čadca. On the other hand, we have expected also a higher volume of vehicles at the intersection in Kysucké Nové Mesto. Vehicles redirected on the motorway will not waste time in congestions and will move faster to this intersection. It can be assumed that the delay time that vehicles would spend at the intersection in the city of Čadca will be shifted to the delay time spend in front of this intersection in Kysucké Nové Mesto. The considered facts and hypothetical questions were verified using dynamic simulation.
3.1. Results of Dynamic Simulation
The aim of the computer simulation was to verify the consequences of the decision to start the operation of the selected section on the behavior of the transport system, identify where road weaknesses and problems are, and what their permeability is. A total of 50 simulations were performed (each simulation lasted 1 h). From these simulations, the average for both compared cases was generated. Simulated data were evaluated every 10 min. The principles of descriptive statistics are most often used to evaluate the measured data from traffic surveys. The most used characteristics of the position of one-dimensional distributions are the average value (arithmetic average), median, mode, and quantiles [48].
Based on the results of the dynamic simulation for three investigated quantities, the answers to the above questions were sought. The investigated quantities were the average speed, the delay time of the vehicles, and the length of the congestion on the established network. First, a simulation that did not include the possibility of using the D3 motorway was performed—the current state. The results of this simulation were compared to the results of the second simulation reflecting the impact of motorway completion and operation. The simulation should be used at the beginning of the project because the highest potential of parameters’ improvement can be achieved in the initial phase. In both cases, the most problematic sections were compared, sections near mentioned junctions. The first section was in front of the junction in the city of Čadca and the second one in front of the junction in the city of Kysucké Nové Mesto (see Figure 2). The commissioning of the motorway will have the greatest impact on these sections.
Following Figure 4 shows the basic characteristics of the macroscopic model as a simulation result of a whole road network (these are average values). The intensities of vehicles can be considered as requirements entering the service system from the theory of collective service point of view. Delay time of vehicles at the intersection represents in this case a time of service.
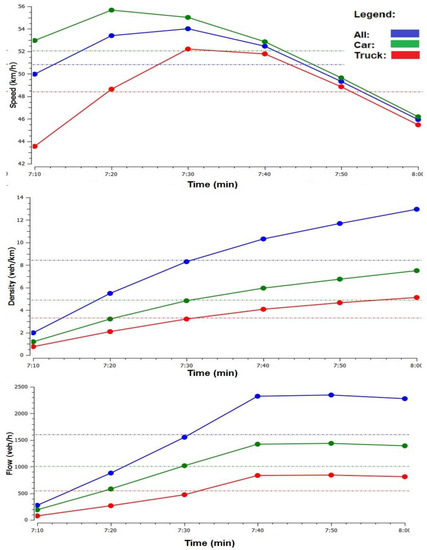
Figure 4.
Simulation outputs—intensity, speed, and density of traffic flow (own study).
Figure 4 represents averaged values of the three basic characteristics of traffic flow. The highest intensity of 2330 veh/h was recorded at 7:40. The speed of vehicles was decreasing with increasing intensity. For a more detailed comparison, we chose two sections of the road network, which are described in the next chapter.
3.2. Currant State
The total number of vehicles entering the simulation was 3169 per hour. The highest number of vehicles according to traffic census was on the sections Svrčinovec–Čadca (average simulated intensity of 447 veh/h) and Krásno nad Kysucou—Kysucké Nové Mesto (average simulated intensity of 418 veh/h). Following Figure 5 and Figure 6 show the simulation outputs of speed, delay time, and length of queue for each particular section.
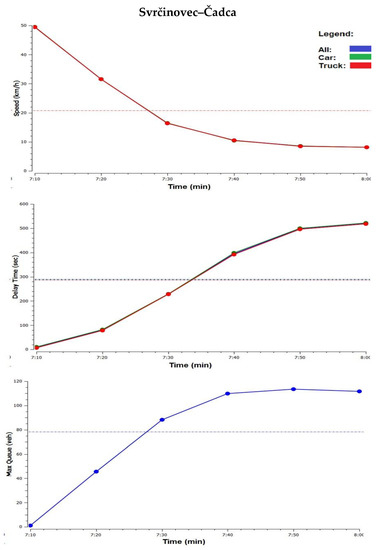
Figure 5.
Current state—speed, delay time, maximum queue as simulation outputs on the Svrčinovec–Čadca road section (own study).
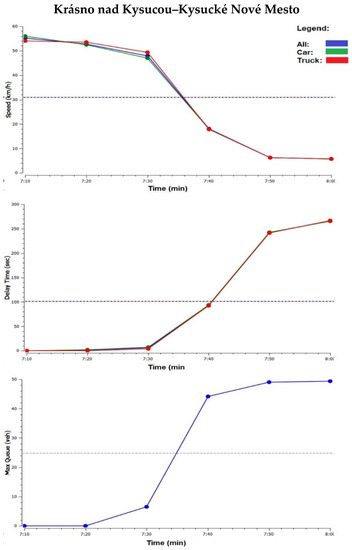
Figure 6.
Current state—speed, delay time, and maximum queue as simulation outputs on the Krásno nad Kysucou–Kysucké Nové Mesto road section (own study).
Figure 5 represents the running of speed, delay time, and queue in 10-minute intervals, which were recorded as a simulation average. Vehicles on the selected section reached a speed of 50 km/h at the beginning of the simulation; however, it started to decrease, and at the end of the simulation, speed decreased to 10 km/h. This fact caused that delay time at the end of simulation exceeded 500 s and vehicles had to wait for the green signal in front of the intersection. Regarding the exceeded delay time, the maximal length of the queue after 50 min of simulation running achieved 114 vehicles and then started to decrease. The length of the queue reached 684 m (it is assumed that one vehicle has an average length of 6 m). The mentioned facts describe with sufficient precision the development of the traffic situation on this section of the road at present.
Figure 6 describes a similar situation as in the previous case, but in front of the next intersection at Kysucké Nové Mesto. In this case, according to the simulation, the vehicle speed was reduced from 55 km/h to 6 km/h. The delay time of vehicles in front of the intersection increased to 270 s at the end of the simulation and the length of the queue reached 49 vehicles or 294 m.
3.3. Planned State—Prognosis
In the planned state, it is assumed that the opening of the motorway between Svrčinovec and Čadca will alleviate the problematic section of the road between the above-mentioned nodes. Vehicles passing along this section will avoid two traffic light intersections on the road I/11, which will shorten their travel time and delay time.
On the other hand, it is assumed that vehicles will move faster in front of the intersection in Kysucké Nové Mesto, which will cause an even higher increase of traffic load before the mentioned intersection. These assumptions were confirmed using dynamic simulation. First, the values of speed, delay time, and length of congestion were obtained for each section. An average simulated intensity in Svrčinovec–Čadca section was 228 veh/h, and in Krásno nad Kysucou–Kysucké Nové Mesto section, it was 445 veh/h.
Figure 7 shows that on the first road section between nodes of Svrčinovec and Čadca, the average speed of vehicles decreased from 52.5 km/h to 51 km/h. The simulated delay time was recorded in the range of 3 s to 5 s, which represents a very good result. The queue of vehicles did not reach even one vehicle at the end of the simulation. We can state that traffic flow was passing through the selected section without any disturbing effects.
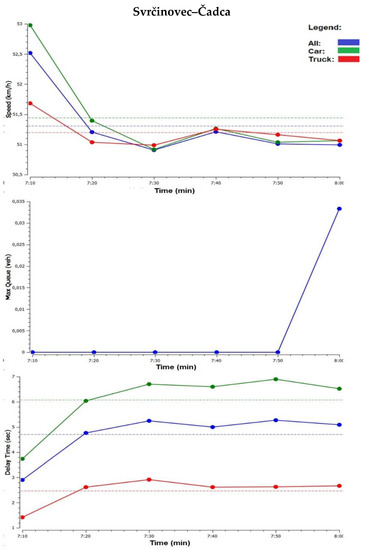
Figure 7.
Planned state—speed, delay time, and maximum queue as simulation outputs on the Svrčinovec–Čadca road section (own study).
Figure 8 describes the influence of the motorway on the second section of the road network. In this case, the average speed decreased from 55 km/h to 6 km/h. Delay time reached the value of 275 s, starting to increase 20 min after the beginning of the simulation. The vehicle queue reached the value of 57 vehicles, 10 min before the end of the simulation. It represents the queue’s length of 342 m.
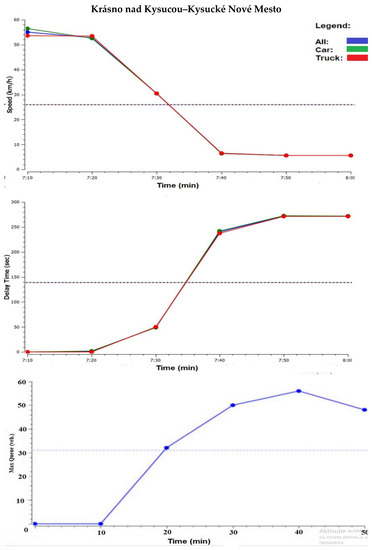
Figure 8.
Planned state—speed, delay time, and maximum queue as simulation outputs on the Krásno nad Kysucou–Kysucké Nové Mesto road section (own study).
4. Results and Discussion
In the previous figures, the measured values of two monitored sections were graphically processed. The following Figure 9, Figure 10, Figure 11 and Figure 12 present the values as output from a simulation to compare the speed, delay time, and length of queue.
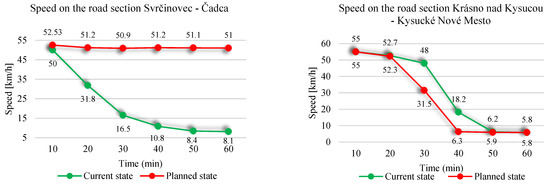
Figure 9.
Comparison of simulated speed on the two road sections for the current and planned states [own study].
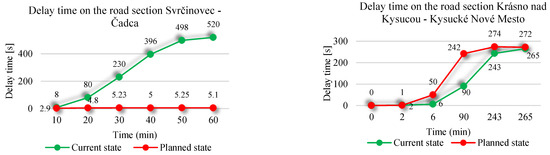
Figure 10.
Comparison of simulated delay time on the two road sections for the current and planned states [own study].
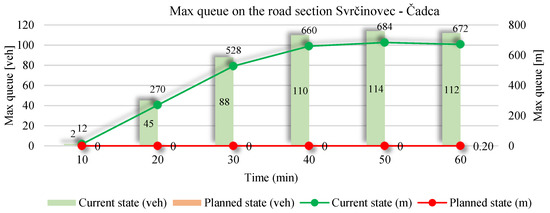
Figure 11.
Comparison of the simulated maximum queue for the current and planned states on the Svrčinovec–Čadca road section (own study).
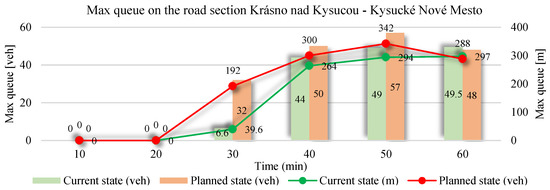
Figure 12.
Comparison of simulated max queue for the current and planned states on the Krásno nad Kysucou–Kysucké Nové Mesto road section [own study].
4.1. Comparison of Speed for Every Direction of the Traffic Flow
It is a graphical comparison of speed as an average of 50 simulations according to the direction of the traffic flow in road sections. Therefore, it is a combination of simulation outputs for the current state and prognosis (see Figure 9).
On the left side of Figure 9, the speed of the current state reached the maximum value of 50 km/h and then gradually decreased and at the end of the simulation reached the value of 8.1 km/h. However, in the second simulation, after the motorway was put into operation, its average value was 59% higher, 51.31 km/h. It means that according to simulation results, the redirection of vehicles to the motorway has a positive effect on the selected section of road I/11. The intensity of vehicles decreased by 67.7% from 878 veh/h to 284 veh/h. The right side of Figure 9 describes the progress of speed on the second selected road section. The average speed of traffic flow was in the current state higher by 18.6%, 31 km/h. The operation of the motorway confirmed the assumption that vehicles move faster to the intersection near Kysucké Nové Mesto. This fact caused that the speed decreased to 26.1 km/h and the intensity of vehicles increased by 9% on the Krásno nad Kysucou–Kyscké Nové Mesto road section.
4.2. Comparison of Delay Time for Every Direction of Traffic Flow
The delay time can be defined as a time by which travel time is extended compared to the time spent on the road without any obstacles in the same transport mode. Based on that indicator, a degree of transport quality is assessed. As a second indicator, we compared the average delay time of vehicles. Figure 10 shows the running of an average delay time in the current state and in prognosis.
Simulated delay time on the first selected road section (on the left side of Figure 10) reached much higher values in the current state, as shown in the figure. The maximum delay time of 520 s was reached at the end of the simulation, which corresponds to high intensity as was mentioned before. In the prognosis, delay time decreased significantly by more than 98%. In this case, the average delay time reached the value of 4.71 s, which reflects the best quality degree of traffic flow.
4.3. Comparison of Congestion Length for Every Direction of Traffic Flow
As the last indicator, the congestion length was compared, which used to occur in front of the intersections because of a high number of passing vehicles (see Figure 11 and Figure 12). In this case, we have compared two options. The first one includes the length of congestion as a number of vehicles and the second one was recalculated to the unit of length in meters. In this comparison, we have assumed a vehicle length of 6 m. We have set this length of a vehicle in our simulation model.
Figure 11 graphically shows the process of creating congestion of vehicles as an output of the simulation. According to simulation results, the congestion on the monitored road section reached 79 vehicles on average in the current state. It represents the length of congestion of 471 m. The highest value of 114 vehicles (684 m) was recorded after 50 min of simulation.
As shown in Figure 11, congestion did not occur in the prognosis according to simulation results. This means that the vehicles could pass through smoothly without any delay.
The following Figure 12 shows the running of the simulation results for the second monitored section.
In this case, the congestions of vehicles reached zero values (for the current state and for prognosis) during 10 min and 20 min of simulation. The change of zero values of congestions was recorded after 30 min of simulation.
In the current state (on the Krásno nad Kysucou–Kysucké Nové Mesto road section), the maximum length of queue reached the value of 50 vehicles, which represent 297 m, at the end of the simulation. However, in the prognosis, the average length of queue increased by almost 21%. Therefore, the number of vehicles in queue increased by 6.32 vehicles (40 m). The maximum length of 342 m of queue was recorded at 50 min.
All comparisons mentioned above were processed into tables, using average and maximum values. The results and their comparisons are shown in the following tables. Table 1 represents the average and maximum values of the speed reached during the simulation.
The average value of speed in the current state simulation reached 20.93 km/h in the direction Svrčinovec–Čadca. The maximum speed was set up at 50 km/h. After the motorway section was put into operation, it was found that the average speed increased by 59.21% to 51.31 km/h, and the maximum speed increased by 4.82%.
When simulating the second road section, the average speed in prognosis decreased by 18.56% and the maximum speed reached the same values of 55 km/h. This may be due to the fact that during the simulation of the Svrčinovec–Čadca section, putting the motorway into operation had a positive effect on the current situation. Vehicles passing through the city of Čadca were diverted from this route. The intensity of traffic flow in front of the city of Kysucké Nové Meste started to increase and the average speed decreased by 26.13 km/h. As Table 2 shows, in the current state, the average speed was higher on that road section (30.98 km/h), and the maximum speed stagnated.
Table 2.
Comparison of average and maximum speed values as outputs from the simulation (own study).
The average and maximum differences from the data shown in Figure 10 are shown in Table 2. The following Table 3 represents the delay time values and their comparison and evaluation.
Table 3.
Comparison of average and maximum delay time values as outputs from the simulation (own study).
At the current state, the delay time obtained a value of 288.67 s on the Svrčinovec–Čadca road section, while the maximum value was 520 s. In the planned state, delay time recorded a huge decrease by 98.37% and for maximum values 98.99%. The unsatisfactory condition of the traffic became excellent.
On the second monitored section, it behaved exactly the opposite. At the current state, it had an average value of 101 s and reached a maximum of 265 s. At the prognosis, it increased by 27.77% (on average) and 3.28% (maximum value), which is 139.83 s and 274 s in absolute numbers.
Lastly, the average and maximum values of the queue length were compared (Table 4). As can be seen in Table 4, there was an almost 100% decrease in the first chosen section. This means that at the planned state, there was no traffic congestion, and the movement of traffic flow is smooth without any interferences.
Table 4.
Comparison of average and maximum queue values as outputs from the simulation (own study).
In the second monitored road section (on the right side of Figure 10), the highest value of delay time (274 s) was reached in the prognosis. An average delay time in the current state decreased by 28% and reached the value of 101 s. The fact that the negative effect caused by motorway commissioning has shifted from the first monitored section to the second one was confirmed. However, on the other hand, in the second monitored section, the queue of vehicles at the planned state has increased compared to the current state. This change was reflected in absolute terms at 20.28%. The queue was extended by 6.32 vehicles (37.9 m). At the maximum value, there was a lower decrease, only by 13.16% (45 m). Due to the fact that the permeability of traffic flow increased (speed increased, while delay time and length of queue decreased) on the first monitored road section, we can state that the opening of motorway D3 has a positive effect on traffic in this section. However, in the second case, this change has a negative effect because the monitored quantities achieved the opposite results.
In the study of [50] on the studied road section, the authors found under the restrictions of flow type by simulation a reduction of intensity by 23–30%. In our study, there was a decrease in intensity at the monitored intersections in the town of Čadca by 67%.
According to the study [51], the results of the performed research on the probable benefits of bypasses showed that the average speed on the bypass should be 1.57 times higher than on the original route.
We recorded an increase of 59% in average speed, compared to the bypass condition. Vehicles driving on any type of fuel release 35% less carbon monoxide into the air. A bypass generates less noise caused by the higher speed of vehicles, which can increase by three times on average. The delay time is decreased by six times during traffic peaks. The authors of the study of the analysis of traffic flow during road construction in urban road networks [22] found out that the more closed lanes a network has, the faster the network speed decreases at a certain network density. They also found that in various cases, there is a relatively fixed range of road construction impact and that the right proportion of vehicles detour can improve the efficiency of road network operation in semi-enclosed construction.
Most of the recent studies were carried out in big cities suffering from chronic issues of congestion, so the aim of research [52] was to analyze the impacts of bypasses in small and non-congested cities using the traffic model of Bajdoza (Spain). This research resulted in the conclusion that small cities without congestion issue should plan bypass as near as possible to the city because they are the most economical, can redirect more vehicles, hence decreasing the delay time, and reduce most of the CO2 emissions from the city center, as was recorded also in our research. An alternative to reducing emissions from the city center may also include a car-sharing system, preferably electric. The authors in [53] focus on calculating the consumption of equipment in urban traffic. In this way, it is possible to focus on modeling to optimize the energy consumption of vehicles.
Another interesting study [54] includes the research of noise impact on the quality of life and mental health of the population during a bypass building. However, they concluded that no evidence was provided that the construction of the bypass would have a negative impact on the population in terms of the examined factors. In [55], the authors of the analysis found that during the construction of the bypass only two changes in the vehicles routing significantly affected the city in all examined areas—the number of accidents and their consequences, i.e., distribution of places of their occurrence within the city borders, land prices in various districts in the city, the spatial distribution of housing and commercial activities, and land use (including agriculture). Nyongesa et al. assessed the functions of the eastern bypass in Nairobi, specifically to determine road composition and traffic flow characteristics, current and future levels of congestion, and congestion based on traffic volumes, origin and destination, travel time, and delay time. They found out that after the opening of the bypass, it attracted unexpectedly high intensities of traffic and ceased to function as a bypass in a short time [56]. In line with other published studies dealing with the construction of the bypass, our study also brought positive results of the impact of the construction of the highway bypass on the city of Čadca. We proved that on the investigated section of the road there was an increase in the average speed and a decrease in the delay time and the maximum queue. This fact also has a significant impact from the economic point of view due to losses during the delay time. This also includes reducing CO2 emissions from the city center.
5. Conclusions
Bypass functions and their impacts have been evaluated in several world studies. These ways are significant when solving traffic congestion, air pollution, and environment, traffic accidents, and urban economic growth. The goal of this paper was to describe the assumptions of the impact of putting the D3 motorway into operation on the local transport. We have focused on the specific road network section of the road I/11, which connects the cities of Žilina and Čadca. This section belongs to the most problematic in Slovakia. We have used data from the last national transport census as inputs for the analysis and evaluation. The next step was to perform two simulations (current state—no highway, planned state—with the highway), each consisting of 50 repetitions, and an average was created. We were interested in the three basic characteristics of traffic flow—speed, delay time, and length of congestion. Based on the simulation results, we chose the two most loaded road sections of the road I/11 and compared the results. Based on the comparison results, we verified the hypothesis.
An increase and decrease in speed, delay time, and queue length can already be seen in the graphical comparison of the simulation. We compared the current state and the planned state for each chosen road section. The analysis and comparison of individual sections showed that the number of vehicles in the first section was decreased by 67.7% and in the second section increased by 9%. In the first section, the delay time was decreased to a minimum in the planned state; it was almost by 100%. This is the result of redirecting individual passenger vehicles and transit transport to the motorway. Delay time decreased due to lower intensity of traffic flow at the selected road section and reduction of congestions. The speed also increased and the queue of vehicles reached zero value. On the other side, in the second road section, the motorway had an opposite effect. The speed was reduced by 27%, which caused an increase in delay time by 19%. The length of the vehicle queue was extended by 40 m.
Based on the findings, it can be argued that the commissioning of the motorway will have a positive effect on increasing the quality of traffic flow on the first monitored section. The D3 motorway will decrease the intensity of traffic flow on the road I/11 mainly in the urban areas and transit transport. Transit transport includes passenger vehicles and trucks. Nowadays, it is more than 14,000 vehicles per day, where 35% of this intensity is road freight transport. The Transport Research Institute estimates that traffic intensities in the northern part of the city will be reduced to 4000 vehicles per day from the current traffic volume of around 17,000 vehicles, which represents a decrease of 76.45%. This solution will improve the quality of life and safety for inhabitants of Čadca and city surroundings by unburdening the negative effects of transport such as noise, emissions, and traffic accidents.
Author Contributions
Conceptualization, V.H. and S.K.; Data curation, V.H., A.K. and S.K.; Formal analysis, V.H. and A.K.; Investigation, V.H.; Methodology, V.H.; Resources, V.H.; Visualization, V.H., A.K. and S.K.; Writing—original draft, V.H. and S.K.; Writing—review & editing, V.H.; supervision, A.K.; project administration, A.K.; funding acquisition, A.K. All authors have read and agreed to the published version of the manuscript.”
Funding
This contribution is made within project VEGA 1/0436/18 Externalities in road transport, origin, causes, and economic impacts of transport measures. This contribution is made within project Basic research of the causes of transport system failure, ID 12294.
Institutional Review Board Statement
Not applicable.
Informed Consent Statement
Not applicable.
Data Availability Statement
Not applicable.
Conflicts of Interest
The authors declare no conflict of interest.
References
- Road Network Length. Available online: https://www.cdb.sk/sk/Vystupy-CDB/Mapy-cestnej-siete-SR/SR.alej (accessed on 1 January 2020).
- National Project: Modernization of Local Territorial Government. Available online: https://npmodmus.zmos.sk/download_file_f.php?id=1153719 (accessed on 1 January 2020).
- Transport Traffic Indicators by Region. Available online: https://www.mindop.sk/files/statistika_vud/reg_prev_ukazovatele.htm#k3 (accessed on 2 January 2021).
- Buehler, R.; Pucher, J.; Gerike, R.; Götschi, T. Reducing car dependence in the heart of Europe: Lessons from Germany, Austria, and Switzerland. Transp. Rev. 2016, 37, 4–28. [Google Scholar] [CrossRef]
- Poliak, M.; Lakhmetkina, N.; Oleinikov, A. Infrastructure development of international importance for the modern transport system. Arch. Motoryz. 2019, 84, 103–116. [Google Scholar]
- Fowkes, A.S.; Firmin, P.E.; Tweddle, G.; Whiteing, A.E. How highly does the freight transport industry value journey time reliability—and for what reasons? Int. J. Logist. Res. Appl. 2004, 7, 33–43. [Google Scholar] [CrossRef]
- O’Connor, A.; O’Brien, E.J. Traffic load modelling and factors influencing the accuracy of predicted extremes. Can. J. Civ. Eng. 2005, 32, 270–278. [Google Scholar] [CrossRef]
- Palúch, J.; Kalašová, A. Traffic modelling on the roundabout in the town of Hlohovec and using the information from the traffic counter. In International Conference on Transport Systems Telematics; Springer: Cham, Switzerland, 2018; pp. 129–141. [Google Scholar]
- Kalašová, A.; Skřivánek Kubíková, S.; Harantová, V. Modelling of the Traffic Flow Basic Characteristics at the Road Net-work Selected Section. Commun. Sci. Lett. Univ. Zilina 2020, 23, A44–A53. [Google Scholar]
- Leitner, B.; Sventeková, E.; Novák, L. Possibilities of traffic flow parameters testing at losing of the functionality of selected road network element. Perners Contacts 2014, 9, 120–131. [Google Scholar]
- Greenberg, H. An Analysis of Traffic Flow. Oper. Res. 1959, 7, 79–85. [Google Scholar] [CrossRef]
- Gartner, N.H.; Wagner, P. Analysis of Traffic Flow Characteristics on Signalized Arterials. Transp. Res. Rec. J. Transp. Res. Board 2004, 1883, 94–100. [Google Scholar] [CrossRef]
- Elefteriadou, L. Flow, Speed, Density, and Their Relationships. In An Introduction to Traffic Flow Theory. Springer Optimization and Its Applications; Springer: New York, NY, USA, 2014; Volume 84, pp. 61–91. [Google Scholar]
- Kerner, B.S.; Klenov, S.L.; Hiller, A. Empirical test of a microscopic three-phase traffic theory. Nonlinear Dyn. 2007, 49, 525–553. [Google Scholar] [CrossRef]
- Dablanc, L. Goods transport in large European cities: Difficult to organize, difficult to modernize. Transp. Res. Part A Policy Pr. 2007, 41, 280–285. [Google Scholar] [CrossRef]
- Lindholm, M.; Behrends, S. Challenges in urban freight transport planning—A review in the Baltic Sea Region. J. Transp. Geogr. 2012, 22, 129–136. [Google Scholar] [CrossRef]
- Mostert, M.; Caris, A.; Limbourg, S. Road and intermodal transport performance: The impact of operational costs and air pollution external costs. Res. Transp. Bus. Manag. 2017, 23, 75–85. [Google Scholar] [CrossRef]
- Schandl, H.; Hatfield-Dodds, S.; Wiedmann, T.; Geschke, A.; Cai, Y.; West, J.; Newth, D.; Baynes, T.; Lenzen, M.; Owen, A. Decoupling global environmental pressure and economic growth: Scenarios for energy use, materials use and carbon emissions. J. Clean. Prod. 2016, 132, 45–56. [Google Scholar] [CrossRef]
- Wang, D.D. Assessing road transport sustainability by combining environmental impacts and safety concerns. Transp. Res. Part D Transp. Environ. 2019, 77, 212–223. [Google Scholar] [CrossRef]
- Mandžuka, S.; Ivanjko, E.; Vujić, M.; Škorput, P.; Gregurić, M. The Use of Cooperative ITS in Urban Traffic Management. Intell. Transp. Syst. 2015, 272–288. [Google Scholar] [CrossRef]
- Zeng, J.; Qian, Y.; Wang, B.; Wang, T.; Wei, X. The Impact of Traffic Crashes on Urban Network Traffic Flow. Sustainability 2019, 11, 3956. [Google Scholar] [CrossRef]
- Shi, J.; Hu, Y.; Li, S.; Li, Z.; Zhang, X.; Mao, C. Simulation and analysis of road construction traffic flow in urban road networks. Adv. Mech. Eng. 2015, 7, 1687814015618176. [Google Scholar] [CrossRef]
- Yang, D.; Zhou, X.; Su, G.; Liu, S. Model and Simulation of the Heterogeneous Traffic Flow of the Urban Signalized Intersection with an Island Work Zone. IEEE Trans. Intell. Transp. Syst. 2019, 20, 1719–1727. [Google Scholar] [CrossRef]
- Sun, J.; Liu, H.; Ma, Z. Modelling and simulation of highly mixed traffic flow on two-lane two-way urban streets. Simul. Model. Pr. Theory 2019, 95, 16–35. [Google Scholar] [CrossRef]
- Palúch, J.; Čulík, K.; Kalašová, A. Modeling of Traffic Conditions at the Circular Junction in the City of Hlohovec. Comput. Devices Commun. 2019, 52, 65–76. [Google Scholar] [CrossRef]
- Gnap, J.; Konečný, V. The impact of a demographic trend on the demand for scheduled bus transport in the Slovak Republic. Commun. Sci. Lett. Univ. Zilina 2008, 10, 55–59. [Google Scholar]
- Harantová, V.; Hájnik, A.; Kalašová, A. Comparison of the Flow Rate and Speed of Vehicles on a Representative Road Section before and after the Implementation of Measuresin Connection with COVID-19. Sustainability 2020, 12, 7216. [Google Scholar] [CrossRef]
- Méline, J.; Wicherek, S.; Julien-Laferrière, B.; Oudinet, J.P. Assessment of exposure to air pollution from road traffic: Use of air dispersion model CALINE4 at a fine scale in Cracow. Prace Geogr. 2011, 127. [Google Scholar]
- Michniak, D.; Więckowski, M.; Stępniak, M.; Rosik, P. The impact of selected planned motorways and expressways on the potential accessibility of the Polish-Slovak borderland with respect to tourism development. Morav. Geogr. Rep. 2015, 23, 13–20. [Google Scholar] [CrossRef]
- One of the Reasons May Be the Numbers, in: My Kysuce. Available online: https://www.mojekysuce.sk/spravodajstvo/podvod-na-kysucanov-dostavba-dialnica-d3-sa-odsúva (accessed on 15 January 2020).
- Key Days for the Construction of the D3 in Kysuce. Waiting for What to Do Next. Available online: https://www.mojekysuce.sk/spravodajstvo/klucove-dni-pre-vystavbu-d3-na-kysuciach (accessed on 16 January 2020).
- Webster, C. Pricing accessibility: Urban morphology, design and missing markets. Prog. Plan. 2010, 73, 77–111. [Google Scholar] [CrossRef]
- Slovenská Správa Ciest. Available online: https://www.ssc.sk/files/documents/dopravneinzinierstvo/csd_2015/za/scitanie_tabulka_za-2015.pdf (accessed on 16 January 2020).
- Astarita, V.; Giofré, V.P. From traffic conflict simulation to traffic crash simulation: Introducing traffic safety indicators based on the explicit simulation of potential driver errors. Simul. Model. Pr. Theory 2019, 94, 215–236. [Google Scholar] [CrossRef]
- Length of Road Network. Available online: https://www.cdb.sk/sk/Vystupy-CDB/Mapy- (accessed on 1 January 2020).
- Synák, F.; Gaňa, J.; Rievaj, V.; Mokričková, L. Ways of reducing carbon dioxide from road transport. Arch. Motoryz. 2019, 86, 41–54. [Google Scholar]
- Harantová, V.; Kubíková, S.; Rumanovský, L. Traffic Accident Occurrence, Its Prediction and Causes. Commun. Comput. Inf. Sci. 2019, 1049, 123–136. [Google Scholar] [CrossRef]
- There Are More Cars in Kysuce, with Them also Columns and Delays. Available online: https://spravy.pravda.sk/regiony/clanok/305297-aut-na-kysuciach-pribuda-s-nimi-aj-kolony-a-zdrzania/ (accessed on 15 January 2020).
- Shortle, J.F.; Thompson, J.M.; Gross, D.; Harris, C.M. Fundamentals of Queueing Theory; John Wiley & Sons: Hoboken, NJ, USA, 2018; Volume 399. [Google Scholar]
- Kalašová, A.; Mikulski, J.; Kubíková, S. The Impact of Intelligent Transport Systems on an Accident Rate of the Chosen Part of Road Communication Network in the Slovak Republic. In Communications in Computer and Information Science; Springer International Publishing: Berlin/Heidelberg, Germany, 2016; pp. 47–58. [Google Scholar]
- Małecki, K. A computer simulation of traffic flow with on-street parking and drivers’ behaviour based on cellular automata and a multi-agent system. J. Comput. Sci. 2018, 28, 32–42. [Google Scholar] [CrossRef]
- Lopez, P.A.; Wiessner, E.; Behrisch, M.; Bieker-Walz, L.; Erdmann, J.; Flotterod, Y.-P.; Hilbrich, R.; Lucken, L.; Rummel, J.; Wagner, P. Microscopic Traffic Simulation using SUMO. In Proceedings of the 2018 21st International Conference on Intelligent Transportation Systems (ITSC), IEEE, Maui, HI, USA, 4–7 November 2018; pp. 2575–2582. [Google Scholar]
- Thonhofer, E.; Palau, T.; Kuhn, A.; Jakubek, S.; Kozek, M. Macroscopic traffic model for large scale urban traffic network design. Simul. Model. Pr. Theory 2018, 80, 32–49. [Google Scholar] [CrossRef]
- Shafiei, S.; Gu, Z.; Saberi, M. Calibration and validation of a simulation-based dynamic traffic assignment model for a large-scale congested network. Simul. Model. Pr. Theory 2018, 86, 169–186. [Google Scholar] [CrossRef]
- Lee, G.; Kim, W.; Oh, H.; Youn, B.D.; Kim, N.H. Review of statistical model calibration and validation—from the perspective of uncertainty structures. Struct. Multidiscip. Optim. 2019, 60, 1619–1644. [Google Scholar] [CrossRef]
- Casas, J.; Ferrer, J.L.; Garcia, D.; Perarnau, J.; Torday, A. Traffic simulation with Aimsun. In Fundamentals of Traffic Simulation; Springer: New York, NY, USA, 2010; pp. 173–232. [Google Scholar]
- Palúch, J.; Veterník, M.; Kalašová, A. November. Impact of Public Transport Priority on Traffic in Chosen Part of the City of Martin. In First International Conference on Intelligent Transport Systems; Springer: Cham, Switzerland, 2017; pp. 3–11. [Google Scholar]
- Slovenská Správa Ciest. Available online: https://www.ssc.sk/files/documents/technicke-predpisy/tp/tp_070.pdf (accessed on 26 August 2020).
- Konečný, V.; Berežný, R.; Kostolná, M.; Šaradín, P. Comparative Analysis of the Importance of the Requirements of Passengers and Evaluating the Quality of Air and Bus Transport. In MATEC Web of Conferences; EDP Sciences: Les Ulis, France, 2018; pp. 1–8. [Google Scholar]
- Dombalyan, A.; Kocherga, V.; Semchugova, E.; Negrov, N. Traffic Forecasting Model for a Road Section. Transp. Res. Procedia 2017, 20, 159–165. [Google Scholar] [CrossRef]
- Vitkūnas, R.; Meidutė, I. Evaluation of bypass influence on reducing air pollution in Vilnius city. Transport 2011, 26, 43–49. [Google Scholar] [CrossRef]
- Coloma Miró, J.; García García, M.; Guzmán Caballero, R.F. Effects of bypass in small and non-congested cities: A case study of the city of Badajoz. Promet-Traffic Transp. 2018, 30, 479–489. [Google Scholar] [CrossRef]
- Turoń, K.; Kubik, A.; Chen, F. Operational Aspects of Electric Vehicles from Car-Sharing Systems. Energies 2019, 12, 4614. [Google Scholar] [CrossRef]
- Stansfeld, S.A.; Haines, M.M.; Berry, B.; Burr, M. Reduction of road traffic noise and mental health: An intervention study. Noise Health 2009, 11, 169. [Google Scholar] [CrossRef]
- Rosca, M.; Oprea, C.; Petrescu, R.; Burciu, S.; Stere, A. Improving Safety and Traffic Conditions on National Roads Passing through Towns without Bypass. Procedia Manuf. 2020, 46, 217–224. [Google Scholar] [CrossRef]
- Nyongesa, C.B. Assessing Functions of Bypass Roads in Cities and Towns: A Case Study of Eastern Bypass in the City of Nairobi. Ph.D. Thesis, University of Nairobi, Nairobi, Kenya, 2019. [Google Scholar]


Publisher’s Note: MDPI stays neutral with regard to jurisdictional claims in published maps and institutional affiliations. |
© 2021 by the authors. Licensee MDPI, Basel, Switzerland. This article is an open access article distributed under the terms and conditions of the Creative Commons Attribution (CC BY) license (http://creativecommons.org/licenses/by/4.0/).