Article

Recycled Glass Blends with Recycled Concrete Aggregates in Sustainable Railway Geotechnics

1
Department of Civil and Construction Engineering, Swinburne University of Technology, Melbourne 3122, Australia
2
School of Civil Engineering, Civil and Infrastructure Engineering Program, and Center of Excellence in Innovation for Sustainable Infrastructure Development, Suranaree University of Technology, Nakhon Ratchasima 30000, Thailand
3
Academy of Science, The Royal Society of Thailand, Dusit, Bangkok 10300, Thailand
*
Author to whom correspondence should be addressed.
Sustainability 2021, 13(5), 2463; https://doi.org/10.3390/su13052463
Submission received: 29 January 2021 / Revised: 21 February 2021 / Accepted: 22 February 2021 / Published: 25 February 2021
(This article belongs to the Special Issue Sustainability and Innovation in Transport Infrastructure Geotechnics)

Abstract

:
This research investigates the static and cyclic characteristics of recycled glass (RG) as a supplementary material with recycled concrete aggregate (RCA) in the rail track capping layer. RG was blended by-weight with RCA in 10% increments up to 50% RG content. A performance-based laboratory testing scheme was designed according to the field loading conditions of capping layers in rail tracks. Basic geotechnical properties of RG + RCA blends were evaluated through their particle size distribution, compaction properties, and California bearing ratio. Effect of flooding was assessed with one-dimensional static and cyclic compression tests. Multistage triaxial compression tests were performed to determine the effect of RG content on shear strength parameters. A new repeated loading triaxial testing protocol was introduced for railway capping layer materials to assess the stiffness of RG blends to cyclic loading. Long term performance of samples also was evaluated through multistage cyclic permanent deformation tests. The shakedown concept was used to assess the permanent deformation results of RG + RCA samples. Results indicated that RG can be used effectively as a supplementary geomaterial in construction of rail track substructure.

1. Introduction

The non-biodegradable nature of waste glass has become an environmental concern worldwide. More than 10 million tonnes of waste glass are landfilled each year [1]. Most of the developed and developing countries have a recycling rate of less than 60% and face challenges in efficiently increasing their recycling rate [1]. Australia in particular has a relatively constant recycling rate of below 60% with a landfilling amount of approximately 0.5 million tonnes per year over the past decade [2].
Recycled glass (RG) contains different types of materials with a variety of colors, properties, and chemical components resulting in difficulties of reusing them in new glass productions [3]. However, RG has shown promising results in the construction and building industry [4]. Other recycled materials such as recycled concrete aggregate (RCA) with similar properties to quarry materials can also be used to address the environmental concerns [5]. Recent studies have focused on the geotechnical properties of both RG and RCA [6]. However, limited studies have evaluated the performance of both recycled materials, particularly RG, in rail track substructure [4]. The performance of RG and RCA separately or in blends has been studied in applications other than railway substructure including pavement layers, structural fills, and concrete materials [7,8,9]. RG has shown similar geotechnical properties to those of natural sand and can be used as a viable alternative for both structural and nonstructural construction purposes [6].
The railway capping layer is placed between ballast and subgrade to enhance the structural integrity of the rail track substructure [10]. This layer transfers the cyclic loading applied by moving trains to allowable stress for subgrade soil [11]. The capping layer is designed with a similar methodology employed for the road base/subbase layer. Therefore, granular aggregates are often used with some amount of fine contents. However, the field condition of capping layer is outstandingly different from road base/subbase layers. The capping layer of ballasted rail track is exposed to the surface water and rainfall. This layer also experiences a complex set of cyclic loadings with high deviator stresses at low confinements [12]. Both conditions can result in undesirable local and overall instabilities. Hence, it is essential to investigate the performance-based behavior of capping materials properly. Recent research studies have focused on enhancing recycling and sustainability in railway substructure [13,14]. Moreover, the application of recycled materials in the railway capping layer has been investigated in several research studies [15,16,17,18].
The current guidelines and standards for the design and construction of rail track substructure and capping layer are prepared based on both physical and strength properties of quarry materials [19]. Nevertheless, the performance of capping layer geomaterials should be characterized on the basis of their stiffness and deformation under cyclic loading simulating the condition of moving trains. In addition, recycled materials can have different physical characteristics to quarry materials. Therefore, the behavior of recycled materials should be assessed based on their application. Previous studies have shown similar or even superior stiffness and strength of recycled materials compared to those of conventional quarry materials [4]. Thus, a performance-based testing procedure should be utilized to assess the response of recycled materials [20].
In this research study, the performance-based responses of RG + RCA blends were assessed under a comprehensive set of laboratory tests. RG was blended in different percentages with RCA to determine the effect of RG content on the overall performance of the RG + RCA blends. Basic geotechnical characteristics of RG + RCA blends were initially investigated based on their particle size distribution, compaction properties, and CBR values. The effect of flooding on RG blends was assessed by the means of one-dimensional (1D) static and cyclic compression tests. Multistage triaxial compression tests were conducted to measure the variation in shear strength of blends with RG content. The results of this test were also used to link the shear strength of materials to their deformation under cyclic loading.
The stiffness of RG + RCA samples was determined based on the repeated load triaxial (RLT) tests. A new testing protocol was designated based on the field stress levels of rail track capping layer and the currently available testing protocols for pavement base/subbase layers. Finally, the long-term behavior of samples was evaluated by conducting multistage cyclic permanent deformation tests. A new permanent deformation model was adopted, which takes into account the effect of both shear strength and applied stress. The shakedown concept was also employed to rank the long-term performance of RG + RCA samples.

2. Materials and Methods

RG and RCA were sourced from a recycling facility in Australia. Both recycled materials were processed with standard pulverization technics to create well-graded aggregates following the local guidelines and standards [21]. Figure 1 presents the particle size distribution of both materials. RG had the maximum particle size of 5 mm, while that of RCA was at 20 mm. RG and RCA were classified as well-graded gravel and well-graded sand, respectively [22]. RCA was produced to meet the maximum requirements of undesirable and foreign materials specified in [21]. RCA had less than 2% high-density materials including brick and ceramic, less than 0.5% low-density materials such as plastic, paper and rubber, and less than 0.1% wood or other vegetables. RG was also produced from recycling kerbside collection of bottles and glass containers with less than 2% contaminants such as paper, corks, metals, and other harmful materials specified in [21]. RCA had a specific gravity of 2.7, whereas the specific gravity of RG was measured to be 2.47. Water absorption of RCA was measured to be approximately 9%, while that of RG was recorded to be less than 1% following the procedure outlined in [23,24]. RCA experienced a Los Angeles Abrasion loss of 31 using grading B outlined in [25]. This value was lower than the maximum limit set by Li et al. [10] for subballast materials.
RG was blended with RCA in 10% increments by weight to a maximum of 50% replacement as presented in Table 1. RG percentages were chosen based on the previous studies on the blends of RG with aggregates [7]. The particle size distribution lines of RG + RCA are also shown in Figure 1 in comparison to the limits set for capping materials [19]. The particle size distribution lines of all blends were in the upper and lower limits, except for the finer sand section with the diameter of 0.15 and 0.075 mm, which was just below the lower limit.
Compaction tests were conducted to determine the maximum dry density (MDD) and optimum moisture content (OMC) of blends using standard Proctor energy [26]. The compaction parameters of blends are presented in Table 1. The OMC of blends reduced with the increase in RG content as shown in Figure 2. Nonetheless, between 40% and 50% RG content, the OMC did not change significantly. MDD values also showed a decreasing trend until 30% RG content, after which the MDD increased substantially with 40% and 50% RG percentages. The shift of PSD curves of blends in the coarse section toward the finer values facilitated the densification of aggregates for the case of 40% and 50% RG contents. This behavior is shown in Figure 2, which presents the plots of void ratio, e, at MDD of blends with RG content. Void ratio of both blends with 40% and 50% RG content was calculated to be less than the parent aggregates.
Table 2 summarizes the compressibility, stiffness, and strength tests carried out on RG + RCA blends. Sample dimensions, compaction method, and loading conditions of each test are also presented. California bearing ratio (CBR) tests were conducted following the procedure outlined in [27]. Samples were submerged for four days with a surcharge load of 9 kg and were tested with the loading rate of 1.27 mm/min as presented in Table 2. For each blend, three samples were tested, and the average value is reported.
Conventional ballasted rail track substructures are exposed to groundwater level fluctuations [28]. Therefore, new testing methods were implemented to capture the effect of flooding on the one-dimensional (1D) compression behavior of RG + RCA blends under both static and cyclic k0-loadings. Samples were compacted in a mold with a diameter of 152.4 ± 0.1 mm to the final height of 50.0 ± 1.0 mm in two layers using the dry tamping method. The dry tamping method was chosen to evaluate the effect of flooding at the worst-case field scenario in which the capping layer is compacted at a loose condition. The sample dimensions were selected to yield a height-to-diameter ratio of less than unity, a diameter-to-maximum particle size ratio of more than five, and a height-to-maximum particle size of more than two. These ratios were chosen to minimize the frictional boundary effects on the sample’s response based on the previous studies on the 1D compression behavior of aggregates [29,30].
The vertical load was applied using a rigid plate with a diameter and thickness of 151.4 ± 0.1 and 20.0 ± 0.1 mm, respectively. Two-way drainage was maintained for the sample with the use of two rigid porous disks with a thickness of 10 mm at the top and bottom of the mold. Vertical stress of 5 kPa was initially imposed for 5 min to reduce the effect of the sample’s top surface irregularities on the displacement readings. The detailed loading condition of this test is presented in Table 2. The sample was flooded from the bottom with a fully automated pump with a volume rate of 20 cm3 per minute for at least 24 hours. The maximum pressure from the pump was also set to 2 kPa to ensure the minimal effect of flooding on the movement of fine particles. After achieving the submerged condition, the loading was continued with the vertical stress values presented in Table 2.
Loading details for the 1D cyclic compression tests are presented in Table 2. The first three stages with maximum vertical stress, σ v m a x , of 25, 50, and 100 kPa were applied for 1000 cycles at each stage. Stage four was continued with the σ v m a x of 200 kPa for 2000 cycles. With the start of stage 5, the σ v m a x of 200 kPa was maintained, while the sample was flooded from both top and bottom to reach the submerged condition. Although the 1D static compression loading test can provide ample time for the sample to saturate after flooding, the sample might not reach the saturated condition in 1D cyclic compression loading test due to the high frequency of loading. However, 1D cyclic compression loading can still simulate the field condition of railway track substructure under the moving load of trains. In this condition, the substructure may experience settlements due to being submerged.
In order to determine the effect of RG inclusion on shear strength characteristics of the blends, multistage triaxial compression tests were conducted with the loading rate of 1 mm/min following [31]. Samples were confined at the first confining pressure, σ3, of 10 kPa, and shearing continued until reaching a horizontal line of the stress–strain curve where dq/dɛa = 0. The confining pressure was then increased to the target pressure of 40 kPa while the loading was maintained. After reaching the dq/dɛa = 0, the third stage of shearing with the confinement of 70 kPa was performed until reaching an axial strain of 10%. Confining pressures were selected based on the previous studies on the shear strength tests performed on subballast and capping materials [12,32,33].
RLT tests were conducted to evaluate the resilient behavior of the blends. Existing RLT testing protocols in literature are developed based on the loading conditions of pavement base/subbase layers. As presented in Table 3, a new loading regime was designated to capture the field condition of the rail track substructure based on the previous field and laboratory studies on the rail track capping layer [4,5,34]. The testing procedure was adopted from CEN EN 13286-7 [35] and AASHTO T307 [36], and it was performed in 15 stages. The conditioning phase was used to minimize the top and bottom irregularities of the sample for 1000 cycles. Each stage of loading was repeated for 100 cycles, and the average results of the last 10 cycles were reported as the resilient modulus of that stage. Details of loading shape, frequency, minimum, and maximum deviator stresses are presented in Table 2 and Table 3.
The long term behavior of blends under cyclic loading was evaluated by conducting multistage permanent deformation tests. The tests were performed at three stages with qmax of 80, 160, and 240 kPa at a constant confining pressure of 40 kPa. The values of qmax in three stages were calculated to impose cyclic stress ratios (CSR) of one, two, and three, respectively. CSR was defined as the ratio of qmax to two times of confining pressure [37]. The applied CSR was also chosen to cover the range of values used in previous studies on capping materials [12,38,39]. Each loading stage has been repeated for 10,000 cycles. Other parameters of loading conditions are presented in Table 2.

3. Results and Discussions

The Australian Rail Track Corporation [19] specifies a CBR value of more than 50% as the singular strength requirement for the granular materials to be acceptable for capping layer construction. As presented in Table 1, the CBR value decreased with increasing the RG content such that for 50% RG + 50% RCA, the value was measured to be below 50%. Blend of 40% RG + 60% RCA had a CBR value of just above the limit, while RG + RCA blends with up to 30% RG content had a CBR value similar to the conventional capping materials reported in the literature [4].
1D compression responses of recycled blends under static and cyclic loading are shown in Figure 3 and Figure 4. 1D static compression results in Figure 3 consisted of five distinguished sections, namely loading, unloading–reloading in the dry state, flooding, and loading–unloading in the submerged state. The materials showed a nonlinear response upon loading with decreasing the non-linearity upon unloading. Inclusion of RG changed the recorded values of vertical strain among different samples, while the trend of stress–strain response of all blends was almost similar. Moreover, Figure 4 illustrates the variation of permanent vertical strain, ɛpv, with the number of loading cycles under 1D cyclic compression loading. Total vertical strain response of granular materials under one-way haversine cyclic loading consisted of a resilient portion and a permanent response [32], the latter of which is presented in Figure 4. Based on Figure 4, all samples experienced an initial rise in their ɛpv with the increase in the applied σ v m a x . After approximately 500 cycles, the rate of ɛpv accumulation reduced in all stages, and ɛpv values were increasing almost linearly with the number of loading cycles. With the addition of water, the ɛpv experienced another rise due to the facilitation of particles’ rearrangements and reduction of matric suction [40]. In both 1D compression tests, RG content did not have a clear trend of change on samples’ responses. However, RG + RCA blends with 40% and 50% RG content generally showed a lower level of deformations under the k0-loading condition. This was due to the better packing density (i.e., void ratio) of 40% RG + 60% RCA and 50% RG + 50% RCA compared to the other blends (Figure 2).
The effect of RG on shear strength and stress–strain responses’ RG + RCA blends is shown in Figure 5. The strain-softening behavior associated with the reduction of deviator stress after reaching the peak deviator stress, qpeak, can be observed in Figure 5a. Addition of RG had a noticeable effect on the stress–strain behavior of RCA. The qpeak of recycled blends decreased at all three confining pressures with increasing the RG content. This was due to the lower shear strength of RG particles compared to that of RCA. However, the axial strain corresponding to the qpeak increased at each confinement with the increase in RG percentage. This was related to the low level of strain-softening of RG at low to high confining pressures [41]. Therefore, the increase in RG content reduced the brittle response of RCA toward more ductility due to the increase in RG particles interaction in the samples’ force chain skeleton. Volumetric strain responses in Figure 5b indicate minimal compression of recycled blends at the first confinement of 10 kPa with the limited effect of RG content on the results. However, dilation of blends decreased noticeably with increasing the RG percentage due to lower dilation of RG compared with that of RCA.
Shear strength of granular materials can be assessed based on their Mohr–Coulomb strength envelope. Figure 5c shows the variation in the shear failure envelopes of recycled blends with the change in RG content. The slope, m, corresponds to the frictional resistance of the soil matrix, while the intersection, s, is related to the cohesion. With the inclusion of RG, the intersection of RCA with the vertical axis decreased due to the non-cohesive nature of RG particles as presented in Figure 5c. In contrast, the parameter m was higher for samples with up to 30% RG content compared to that of RCA. The considerable reduction in cohesion resulted in a slight anticlockwise rotation of the Mohr–Columb failure envelopes of blends with the addition of up to 30% RG. This effect was reversed for samples with 40% and 50% RG content, where the RG to RG particles contact forces were found to be dominant in the soil matrix.
The stiffness of capping layer materials under cyclic loading is the governing factor in designing the thickness of this layer [11]. The stiffness of granular materials can be assessed by measuring their resilient modulus, Mr, at different loading conditions. Mr is defined as the ratio of qmax to the corresponding recoverable axial strain [35]. Figure 6a illustrates the variation in Mr with the loading sequences of the proposed testing protocol for the rail track capping layer. The general upward trend of all samples was related to the stress-dependency nature of Mr with both increasing confining pressure and qmax. The highest Mr values were recorded for 10% RG + 90% RCA followed by 20% RG + 80% RCA. These two samples had noticeably higher frictional resistance (Figure 5c) than RCA, which contributed to higher inter-particle contacts and lower recovery of axial strain under cyclic loading. Moreover, all the samples showed higher Mr values than the minimum requirement for capping materials, between 55 and 105 MPa specified in [10]. The RG blends also had similar or superior stiffness responses compared to the conventional or alternative subballast capping materials [4,12].
Stress-dependency relation of Mr with confining pressure and qmax can be correlated with the following equation [42]:
M r = k 1 P a ( σ 3 P a ) K 2 ( q m a x P a + 1 ) K 3 ,
where Pa is atmospheric pressure (= 100 kPa) and k1, k2, and k3 are regression parameters presented in Table 4. The performance of Equation (1) was assessed in Figure 6b by using the coefficient of determination, R2, and the ratio of standard error, Se/Sy. This ratio is defined as the ratio of the standard deviation of the errors, Se, to the standard deviation of the measured permanent strain of the sample, Sy [4]. Witczak [43] considered the goodness of fit as “excellent” when Se/Sy ≤ 0.35 and R2 ≥ 0.90, “good” when 0.36 ≤ Se/Sy ≤ 0.55 0.70 ≤ R2 ≤ 0.89, and “fair” when 0.56 ≤ Se/Sy ≤ 0.75 and 0.40 ≤ R2 ≤ 0.69. According to the results presented in Table 4, the prediction model performance in Equation (1) can be considered as “excellent”.
Based on the test results, RG + RCA blends showed a reasonably high stiffness and strength under different loading conditions. However, their cyclic behavior should be further assessed under long-term loading conditions. Figure 7a,b present the development of permanent axial deformation, ɛpa, and Mr of RG + RCA blends under cyclic loading. At the first stage of loading with qmax of 80 kPa, the ɛpa of all samples reached almost a constant value after the first 1000 cycles at similar axial strain levels. In contrast, there was a significant difference in Mr values of samples at the first stage. RG + RCA blends with 10 and 20% RG content had higher Mr values than other samples, similarly to the RLT test results (Figure 6). This was related to the higher frictional resistance of these two blends compared to other samples, presented as parameter m in Figure 5. At the second stage of loading, the ɛpa curves started to scatter with the lowest and highest values being recorded for 10% RG + 90% RCA and 50% RG + 50% RCA samples, respectively. Stage three was followed by a noticeable rise in the ɛpa of 40% RG + 60% RCA and 50% RG + 50% RCA. The Mr values of blends were also on an increasing trend with the number of loading cycles after passing the first 100 cycles.
Considering the effects of applied stress and shear resistance on the deformation of granular materials, Chow et al. [44] proposed the concept of shear stress ratio, SSR, which is defined as the ratio of mobilized shear stress, τ n , to the effective shear strength, τ f , on the shear failure plane [44]:
S S R = A p p l i e d   s h e a r   s t r e s s S h e a r   s t r e n g t h = τ n τ f ,
where [45]:
τ n = σ d c o s ( ϕ ) 2 ,
and
τ f = c + σ n t a n ( ϕ ) = c + ( σ 3 + σ d ( 1 s i n ( ϕ ) ) 2 ) t a n ( ϕ ) ,
where σn is the normal stress on the failure plane, ϕ and c are friction angle and cohesion, respectively.
Based on the concept of SSR, an existing permanent deformation model proposed by Erlingsson et al. [46] was modified. Parameter Sf, which only accounted for the applied stress in the original equation proposed by Erlingsson et al. [46], was replaced with the parameter SSR. The regression parameter c was also added as a power to SSR to enhance the flexibility of the model:
ɛ p a = a N b S S R c S S R c ,
Equation (5) can only be used for the results of single-stage permanent deformation tests. Erlingsson et al. [46] proposed a time-hardening approach to predict the permanent deformation of granular materials under multistage cyclic loading. In this method, an equivalent number of loading cycle, N i e q , is introduced at each loading stage, i, to generate the same amount of permanent axial strain as the previous stage (i − 1, ɛ p a i 1 ). Therefore, parameter N in Equation (5) should be changed to the effective number of loading cycles, N i [46]:
N i = N N i 1 + N i e q ,
where N i 1 is the total number of loading cycles from the beginning of the test. Using the time hardening approach, Equation (5) can be further modified for multistage testing results:
ɛ p a = a N i b S S R c S S R c = a ( N N i 1 + N i e q ) b S S R c S S R c ,
where
N i e q = ( ε p i 1 a S S R c ) 1 b S S R c    
Figure 8 demonstrates the predicted versus measured permanent deformation data of RG + RCA blends with regression parameters being presented in Table 4. The model performed reasonably accurately in predicting the permanent deformation responses of blends. Both regression coefficients of R2 and Se/Sy were categorized as “excellent” according to Witczak [43] classification in Table 4. The noticeable difference between the measured and predicted results could be observed for RG + RCA blends with 40% and 50% RG content at stage 3 of loading. This could be due to the noticeable increase in the measured permanent deformation values of these samples, particularly at stage 3 of loading. However, the differences between predicted and measured values were still well below 0.2% strain.
The long-term cyclic behavior of granular materials can be evaluated with the application of shakedown theory [32,39]. According to this concept, three ranges of responses, namely Range A (plastic shakedown), Range B (plastic creep), and Range C (incremental collapse), can be observed based on the applied level of cyclic loading [47]. Range A is associated with reaching a stable level of permanent deformation and thereby showing a limited accumulation of ɛpa. At Range C, however, the ɛpa increases substantially toward failure with the increase in the number of loading cycles. Therefore, the rate of permanent strain accumulation either increases noticeably or does not decrease. Range B is considered as an intermediate state between Ranges A and C. At Range B, the rate of permanent deformation accumulation reduces to a low or constant value [39]. After a large number of cycles, permanent deformation may increase significantly toward Range C of response [47].
The main advantage of the shakedown theory is its ability to rank the performance of materials based on their trend of responses rather than the actual values [32]. In fact, it is possible for a sample to experience values of permanent deformation and resilient modulus below the requirements at the end of a test while showing a relatively high rate of permanent deformation accumulation. Therefore, Werkmeister et al. [47] proposed evaluating the variation in permanent deformation rate versus permanent deformation as an indicator of the shakedown response of materials as shown in Figure 9. Werkmeister [48] also proposed the following criteria to rank the shakedown responses of granular materials:
Range   A :   ɛ p a 5000 ɛ p a 3000 4.5 × 10 5 Range   B :   4.5 × 10 5 < ɛ p a 5000 ɛ p a 3000 4.0 × 10 4 Range   C :   4.0 × 10 4 > ɛ p a 5000 ɛ p a 3000     ,
where ɛ p a 5000 and ɛ p a 3000 are the ɛ p a at loading cycles of 5000 and 3000, respectively.
At the first stage of loading in Figure 9a, all blends showed an almost vertical shape of decline in permanent strain rate with permanent strain. Therefore, the responses were categorized at Range A according to the classifications provided in [39]. At stage two (Figure 9b) and three (Figure 9c), the ɛpa rate decreased nonlinearly with the increase in ɛpa. At Range C of response, it is expected that ɛpa rate either stops decreasing or increases rapidly [39]. However, none of the samples showed these trends of responses at stages two and three of loading. Therefore, the responses of blends at stages two and three of loading were categorized as Range B.
The shakedown ranking of RG + RCA blends according to the Werkmeister [48] criteria in Equation (9) was compared with the authors’ ranking as presented in Figure 9. Conflicting results were obtained in terms of shakedown ranking of 50% RG + 50% RCA at stages one and three. At the first stage of loading, the ɛpa rate of 50% RG + 50% RCA was similar to other samples, which were categorized at Range A based on Werkmeister [48] criteria. Therefore, the ranking of Range A was selected for this stage. Additionally, at stage three the ɛpa rate of 50% RG + 50% RCA was recorded to be on a decreasing trend, although with a lower rate than other samples. The ɛpa rate did not cease to decrease or rapidly increase at this stage. Therefore, the ranking of Range B was selected for the sample similar to other blends.
Inclusion of RG and its percentage increase showed a different trend of responses according to the testing method and the applied loading regime. Therefore, the effect of RG content on different aspects of geotechnical characteristics of RG + RCA blends is summarized in Figure 10. The summary of results obtained from 1D static and cyclic compression loadings are presented in Figure 10a,b. The presence of between 10% and 30% RG resulted in higher maximum vertical strains than that of 100%RCA in Figure 10a. Nonetheless, samples with 40% and 50% RG content had values fairly similar to or slightly lower than the parent aggregate. The trend of responses has created a bell-shaped curve with maximum values belonging to samples with 10% to 30% RG content. A similar trend of response was observed for the collapse potential of materials, depicted in Figure 10b. Collapse potential was defined as the difference in the vertical strain before and after the addition of water. All the RG + RCA blends experienced a collapse of less than 1% from both tests except for 50% RG + 50% RCA in 1D cyclic compression loading. Additionally, the sample with 40% RG content showed the lowest collapse potential among the blends in both 1D compression tests.
Figure 10c,d illustrate the effect of RG content on shear strength parameters of recycled samples obtained from multistage triaxial tests. At all confinements, qpeak of samples decreased with increasing the RG content from 10% to 40%, while the qpeak values of 40% RG + 60% RCA and 50% RG + 50% RCA were close to each other (Figure 10c). This could be due to the contact separation of RCA gravel particles and the dominancy of sand-sized RCA and RG particles in the matrix. Based on Figure 10d, friction angles of blends with 10% to 30% RG content were higher than RCA, while the other two samples had values of just above 40°. Cohesion, on the other hand, was on a noticeable decreasing trend with increasing RG content. The presence of RG reduced the possibility of cementitious bond developments among the RCA particles in the sample matrix.
The summary of RG + RCA blends responses under multistage cyclic triaxial loading is shown in Figure 10e,f. The average values of Mr obtained from both RLT and cyclic permanent deformation tests are plotted against the RG content in Figure 10e. Both RLT and cyclic permanent deformation tests resulted in fairly close values of Mr. It should be noted that the differences in values obtained from these tests were related to the applied stress histories and the number of loading cycles. The values obtained from the RLT test were used to evaluate the stress-dependent stiffness of the materials [4]. The results from the multistage cyclic permanent deformation test were measured to evaluate the variation in stiffness with the number of cycles and stability of materials using shakedown theory [32]. Moreover, RG + RCA blends showed a similar trend of Mr values to friction angles versus the RG content shown in Figure 10d, indicating the governing effect of friction angle on Mr values. Sample 10% RG + 90% RCA had the highest Mr value. The Mr value showed a decreasing trend after 10% RG content with 50% RG + 50% RCA having a lower Mr than that of RCA.
The lowest permanent axial deformation at all three stages of cyclic permanent deformation testing was also observed at 10% RG content in Figure 10f. The values of ɛpa increased with RG content after 10% RG content. This was in contradiction with the trend of results in Figure 10a,b under k0–loading conditions. Therefore, the inclusion of RG and increasing RG samples illustrated different trends of responses according to the testing method and the applied loading regime. Considering all the parameters presented in Figure 10, samples with between 10% and 20% of RG content provided reasonable levels of deformation and strength compared to the other samples. 10% RG + 90% RCA and 20% RG + 80% RCA can therefore be proposed as suitable recycled blends for the railway capping layer.

4. Conclusions

This research study was focused on the application of RG blends with RCA as alternative geomaterials in rail track capping layers. A detailed series of laboratory tests were proposed and conducted to evaluate the behavior of RG + RCA blends as rail track capping materials. Geotechnical properties of RG blends were assessed under loading conditions of 1D compression, multistage triaxial, RLT, and multistage cyclic permanent deformation tests. The following conclusions were made accordingly:
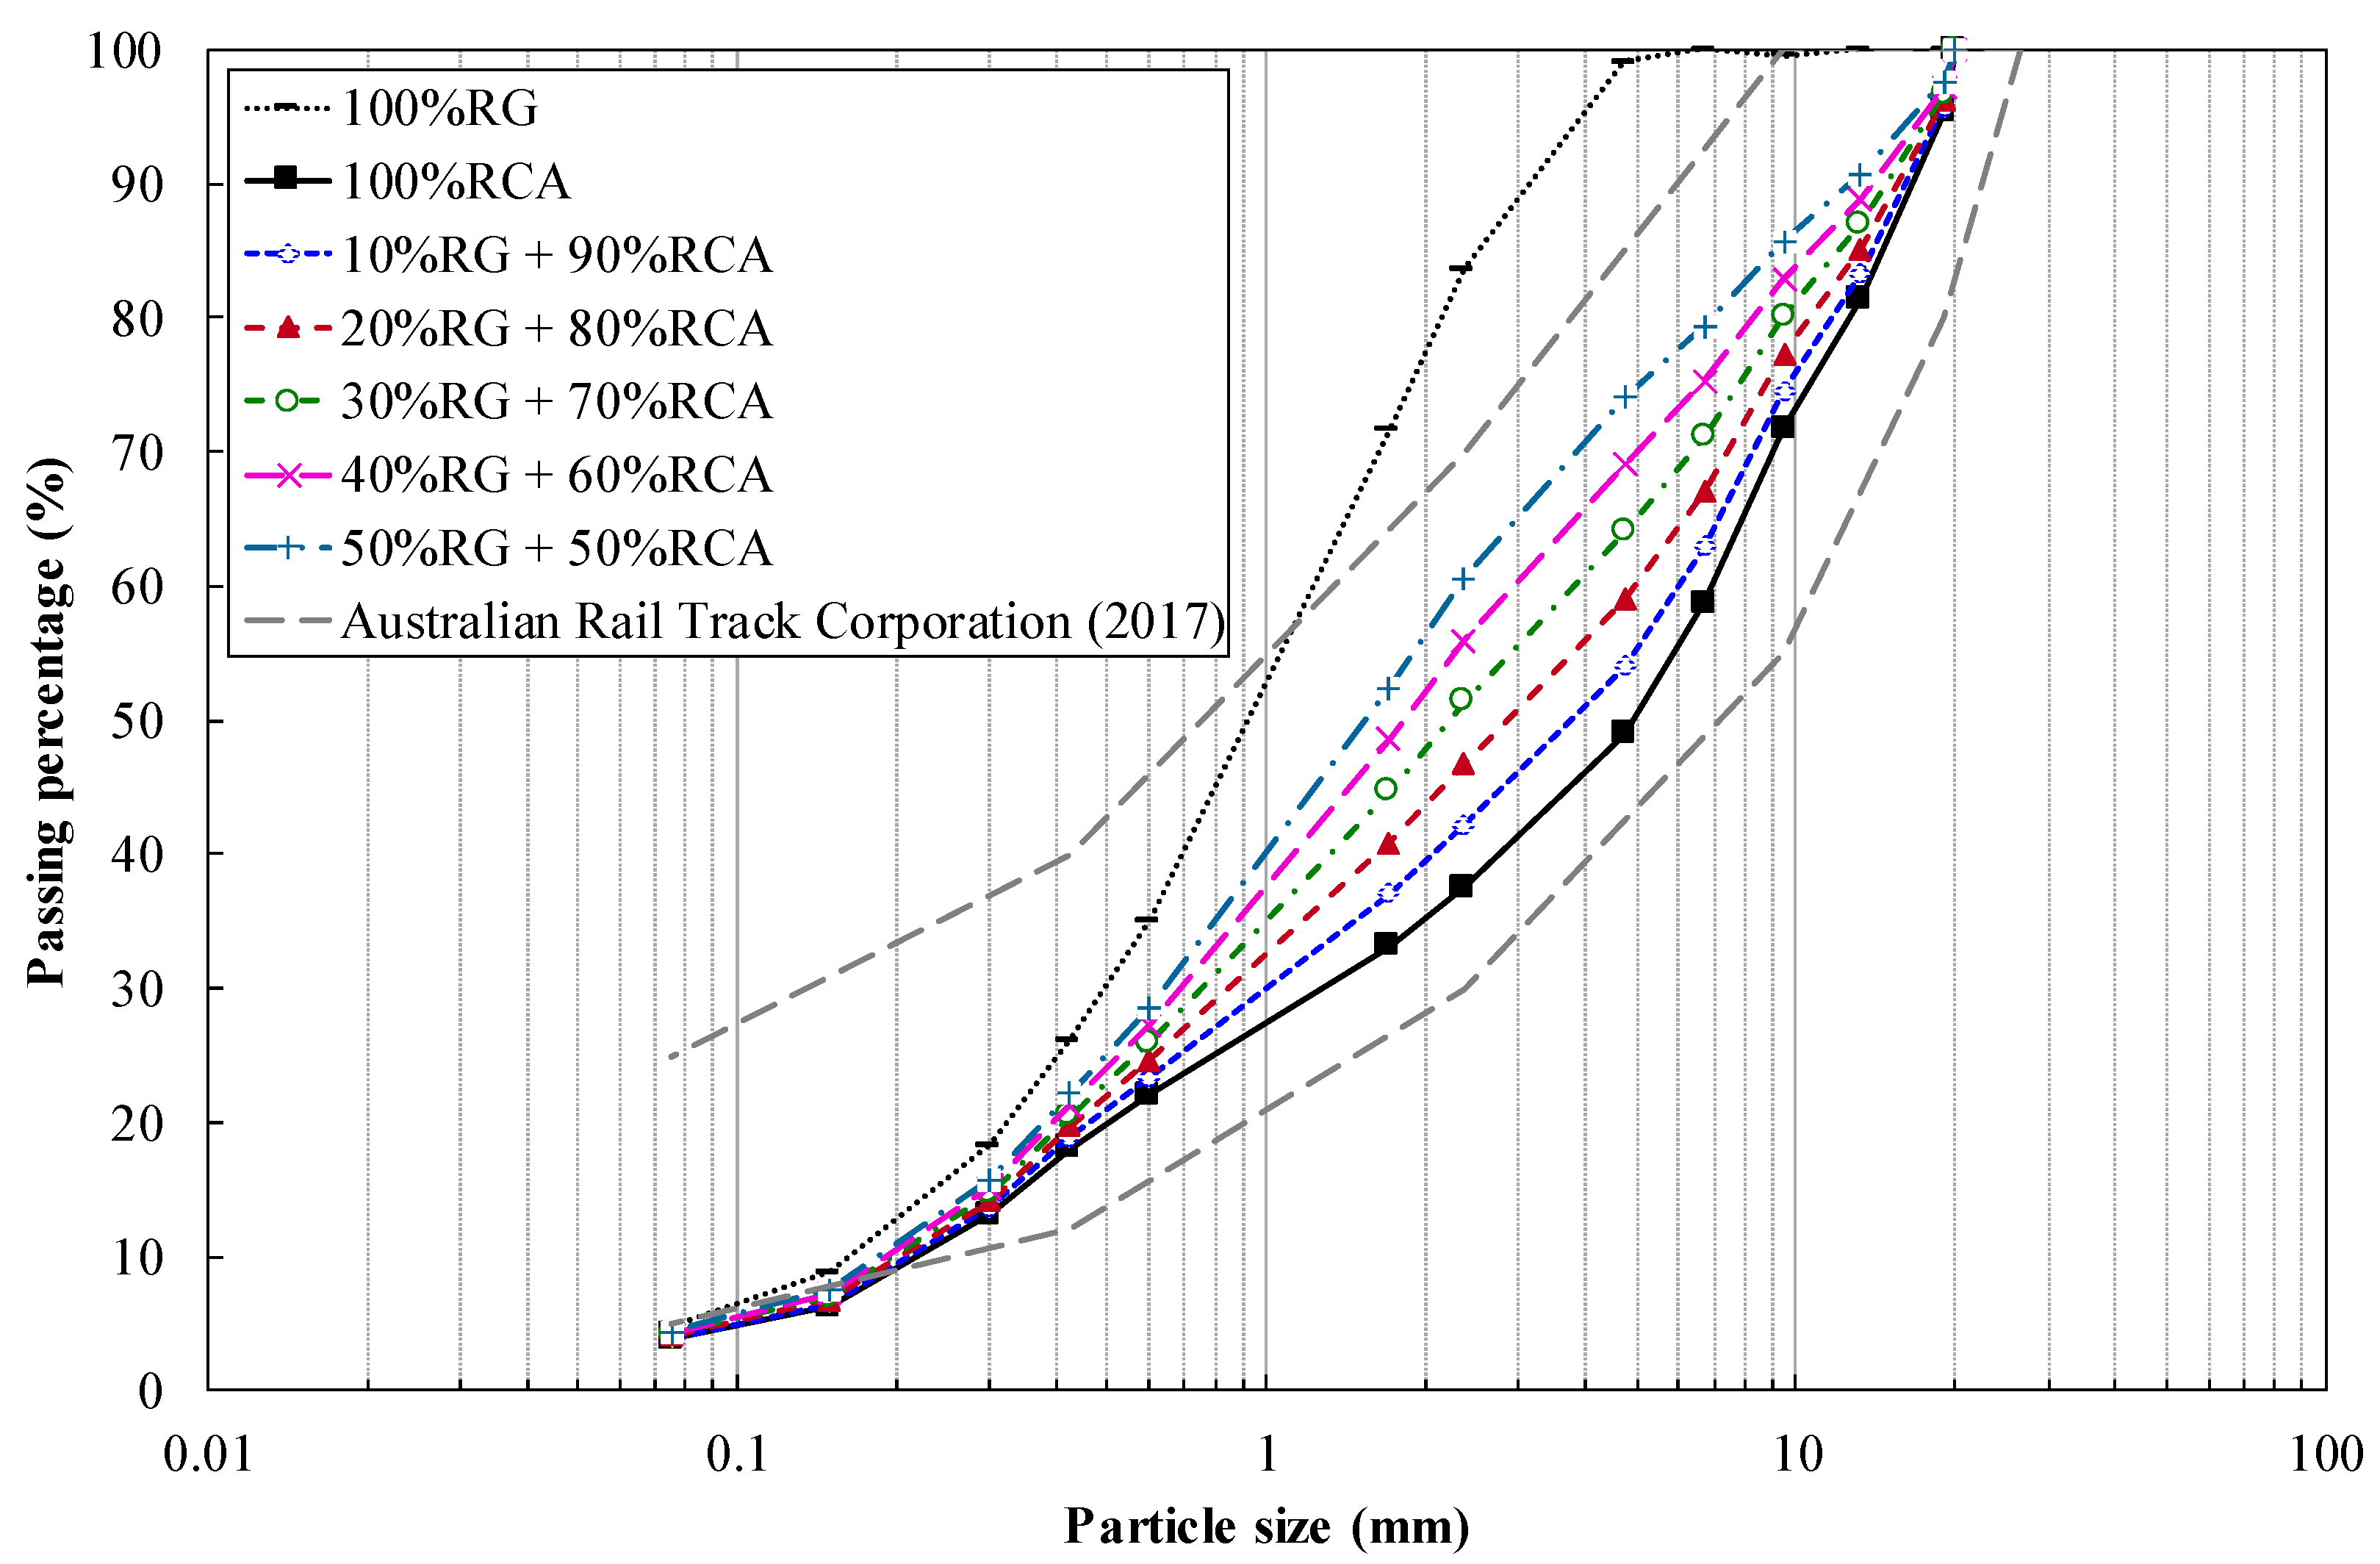
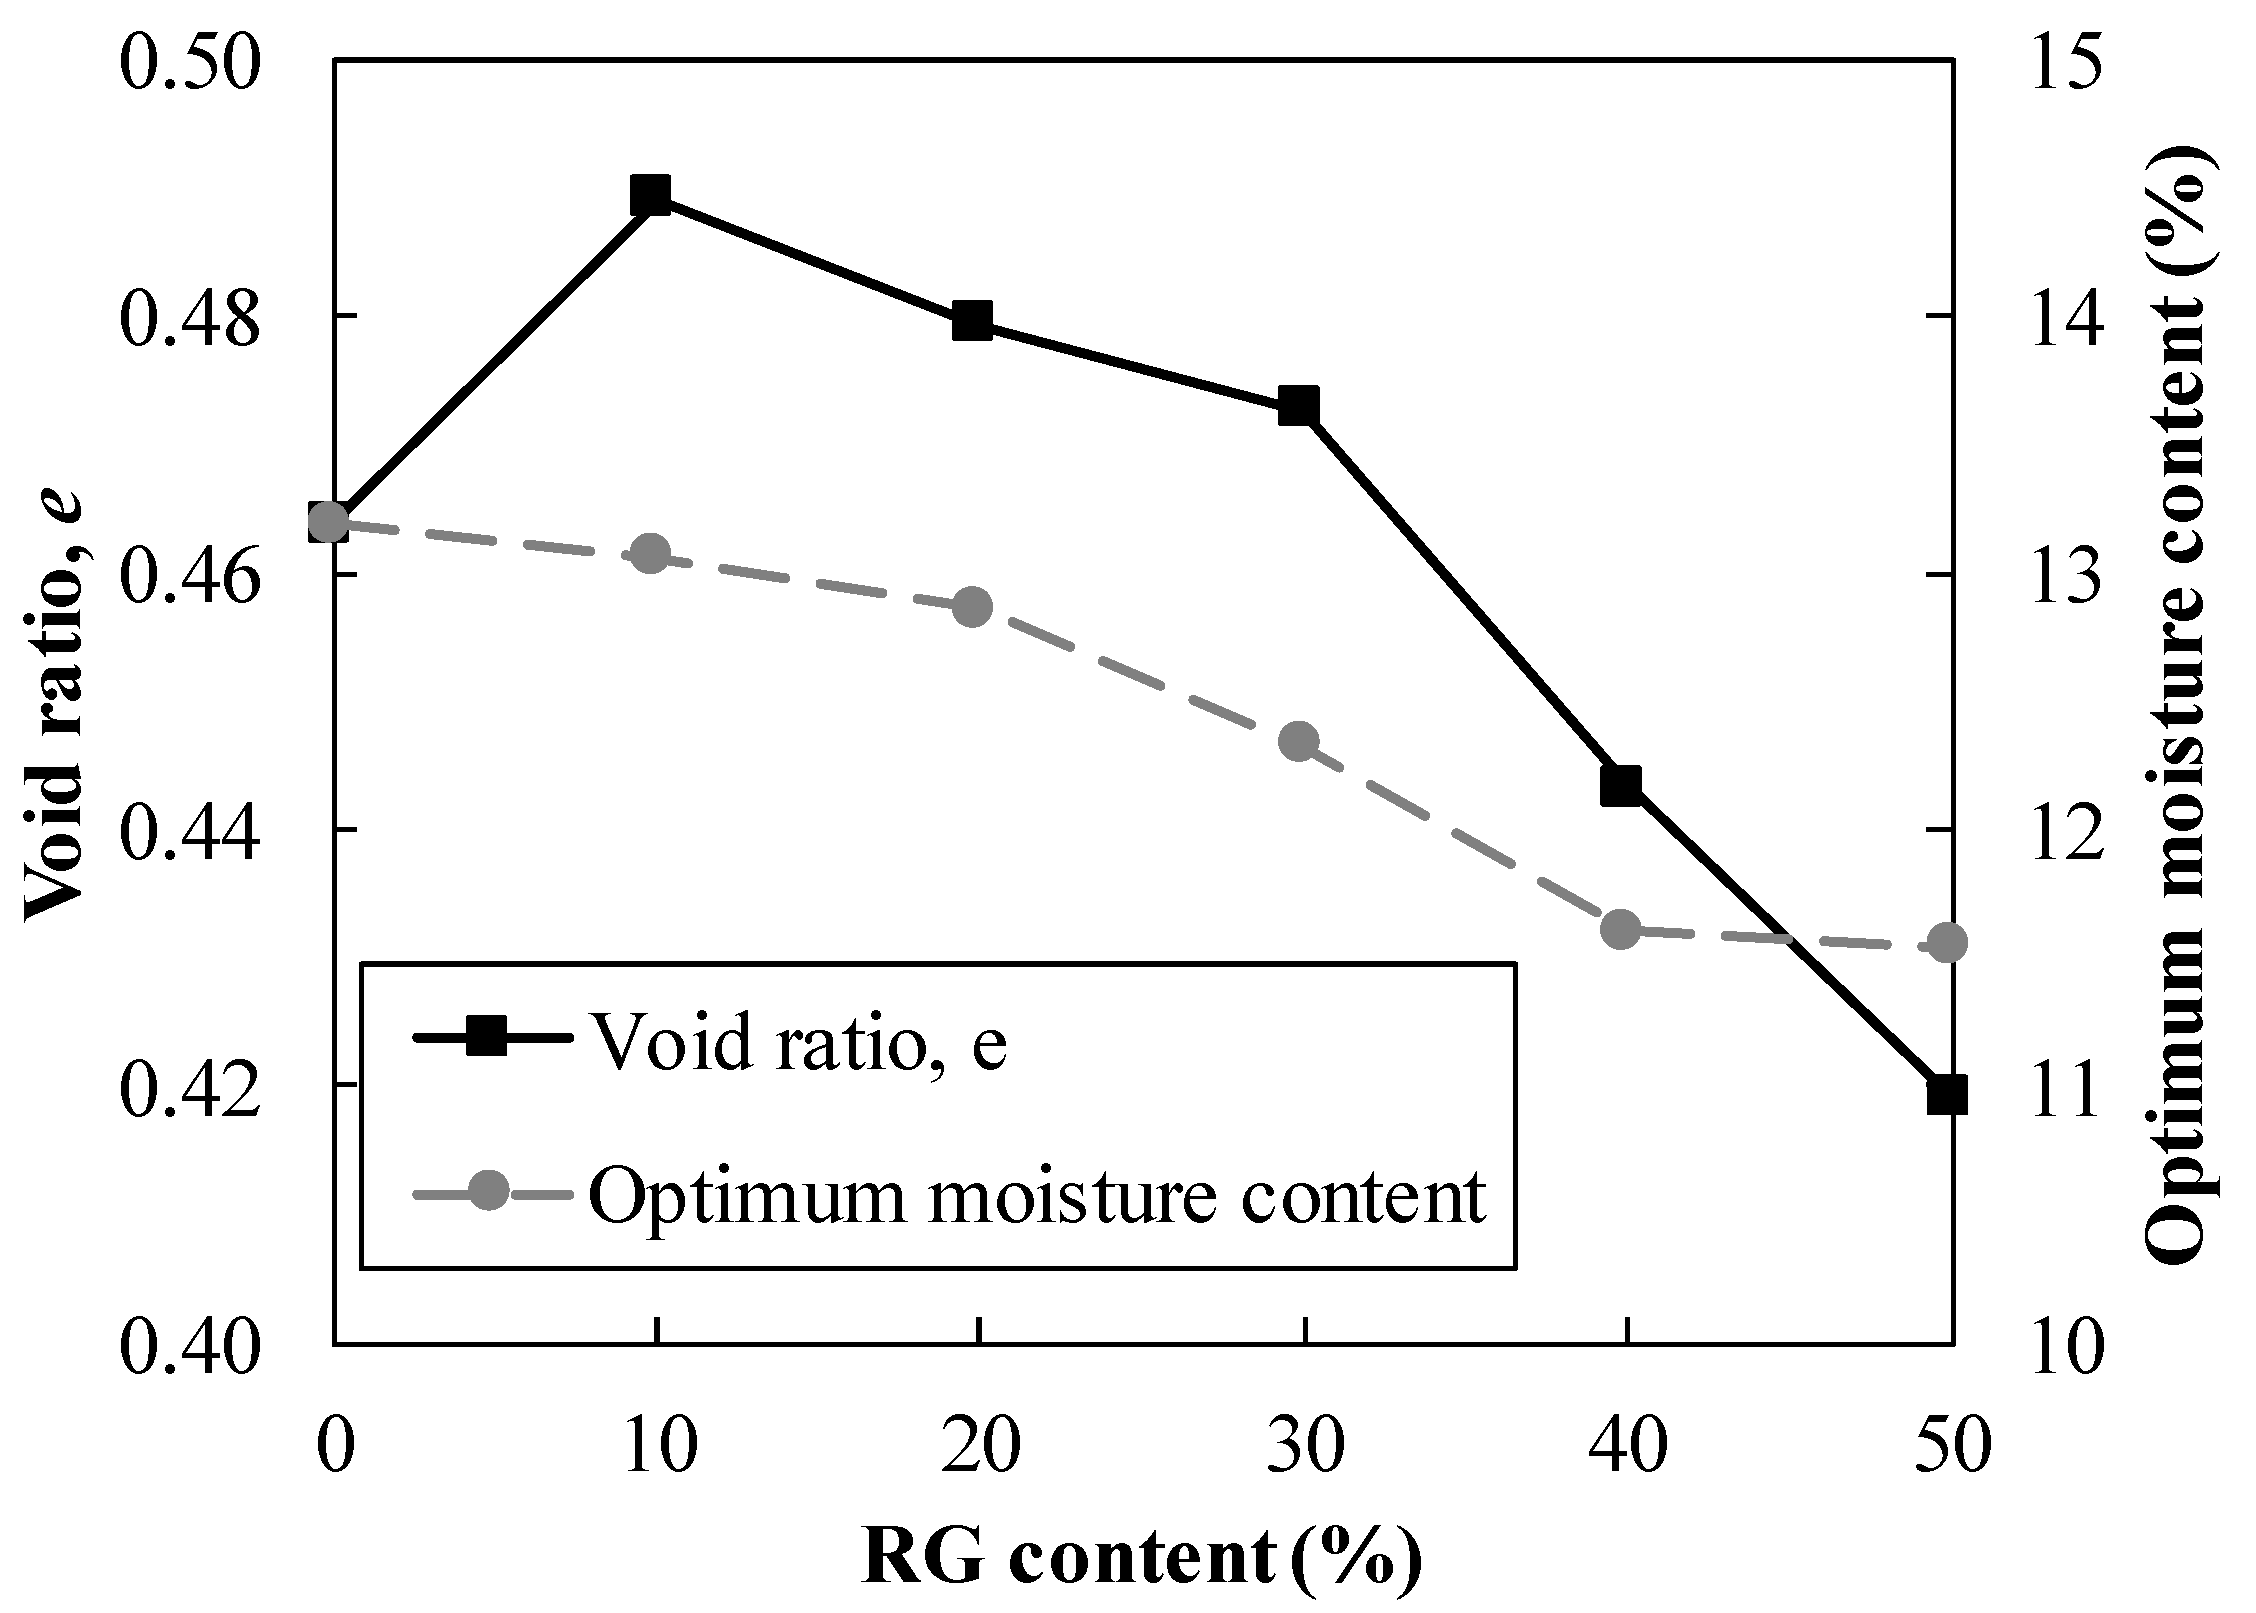
  • The inclusion of RG increased the sand content and reduced the maximum dry density of RCA for up to 30% RG content. However, as the RG content increased, the required moisture content to reach the maximum dry density decreased. Additionally, CBR values of RG + RCA blends decreased with increasing the RG content. Up to 40% RG can be used with RCA to meet the minimum requirement of local railway authorities.
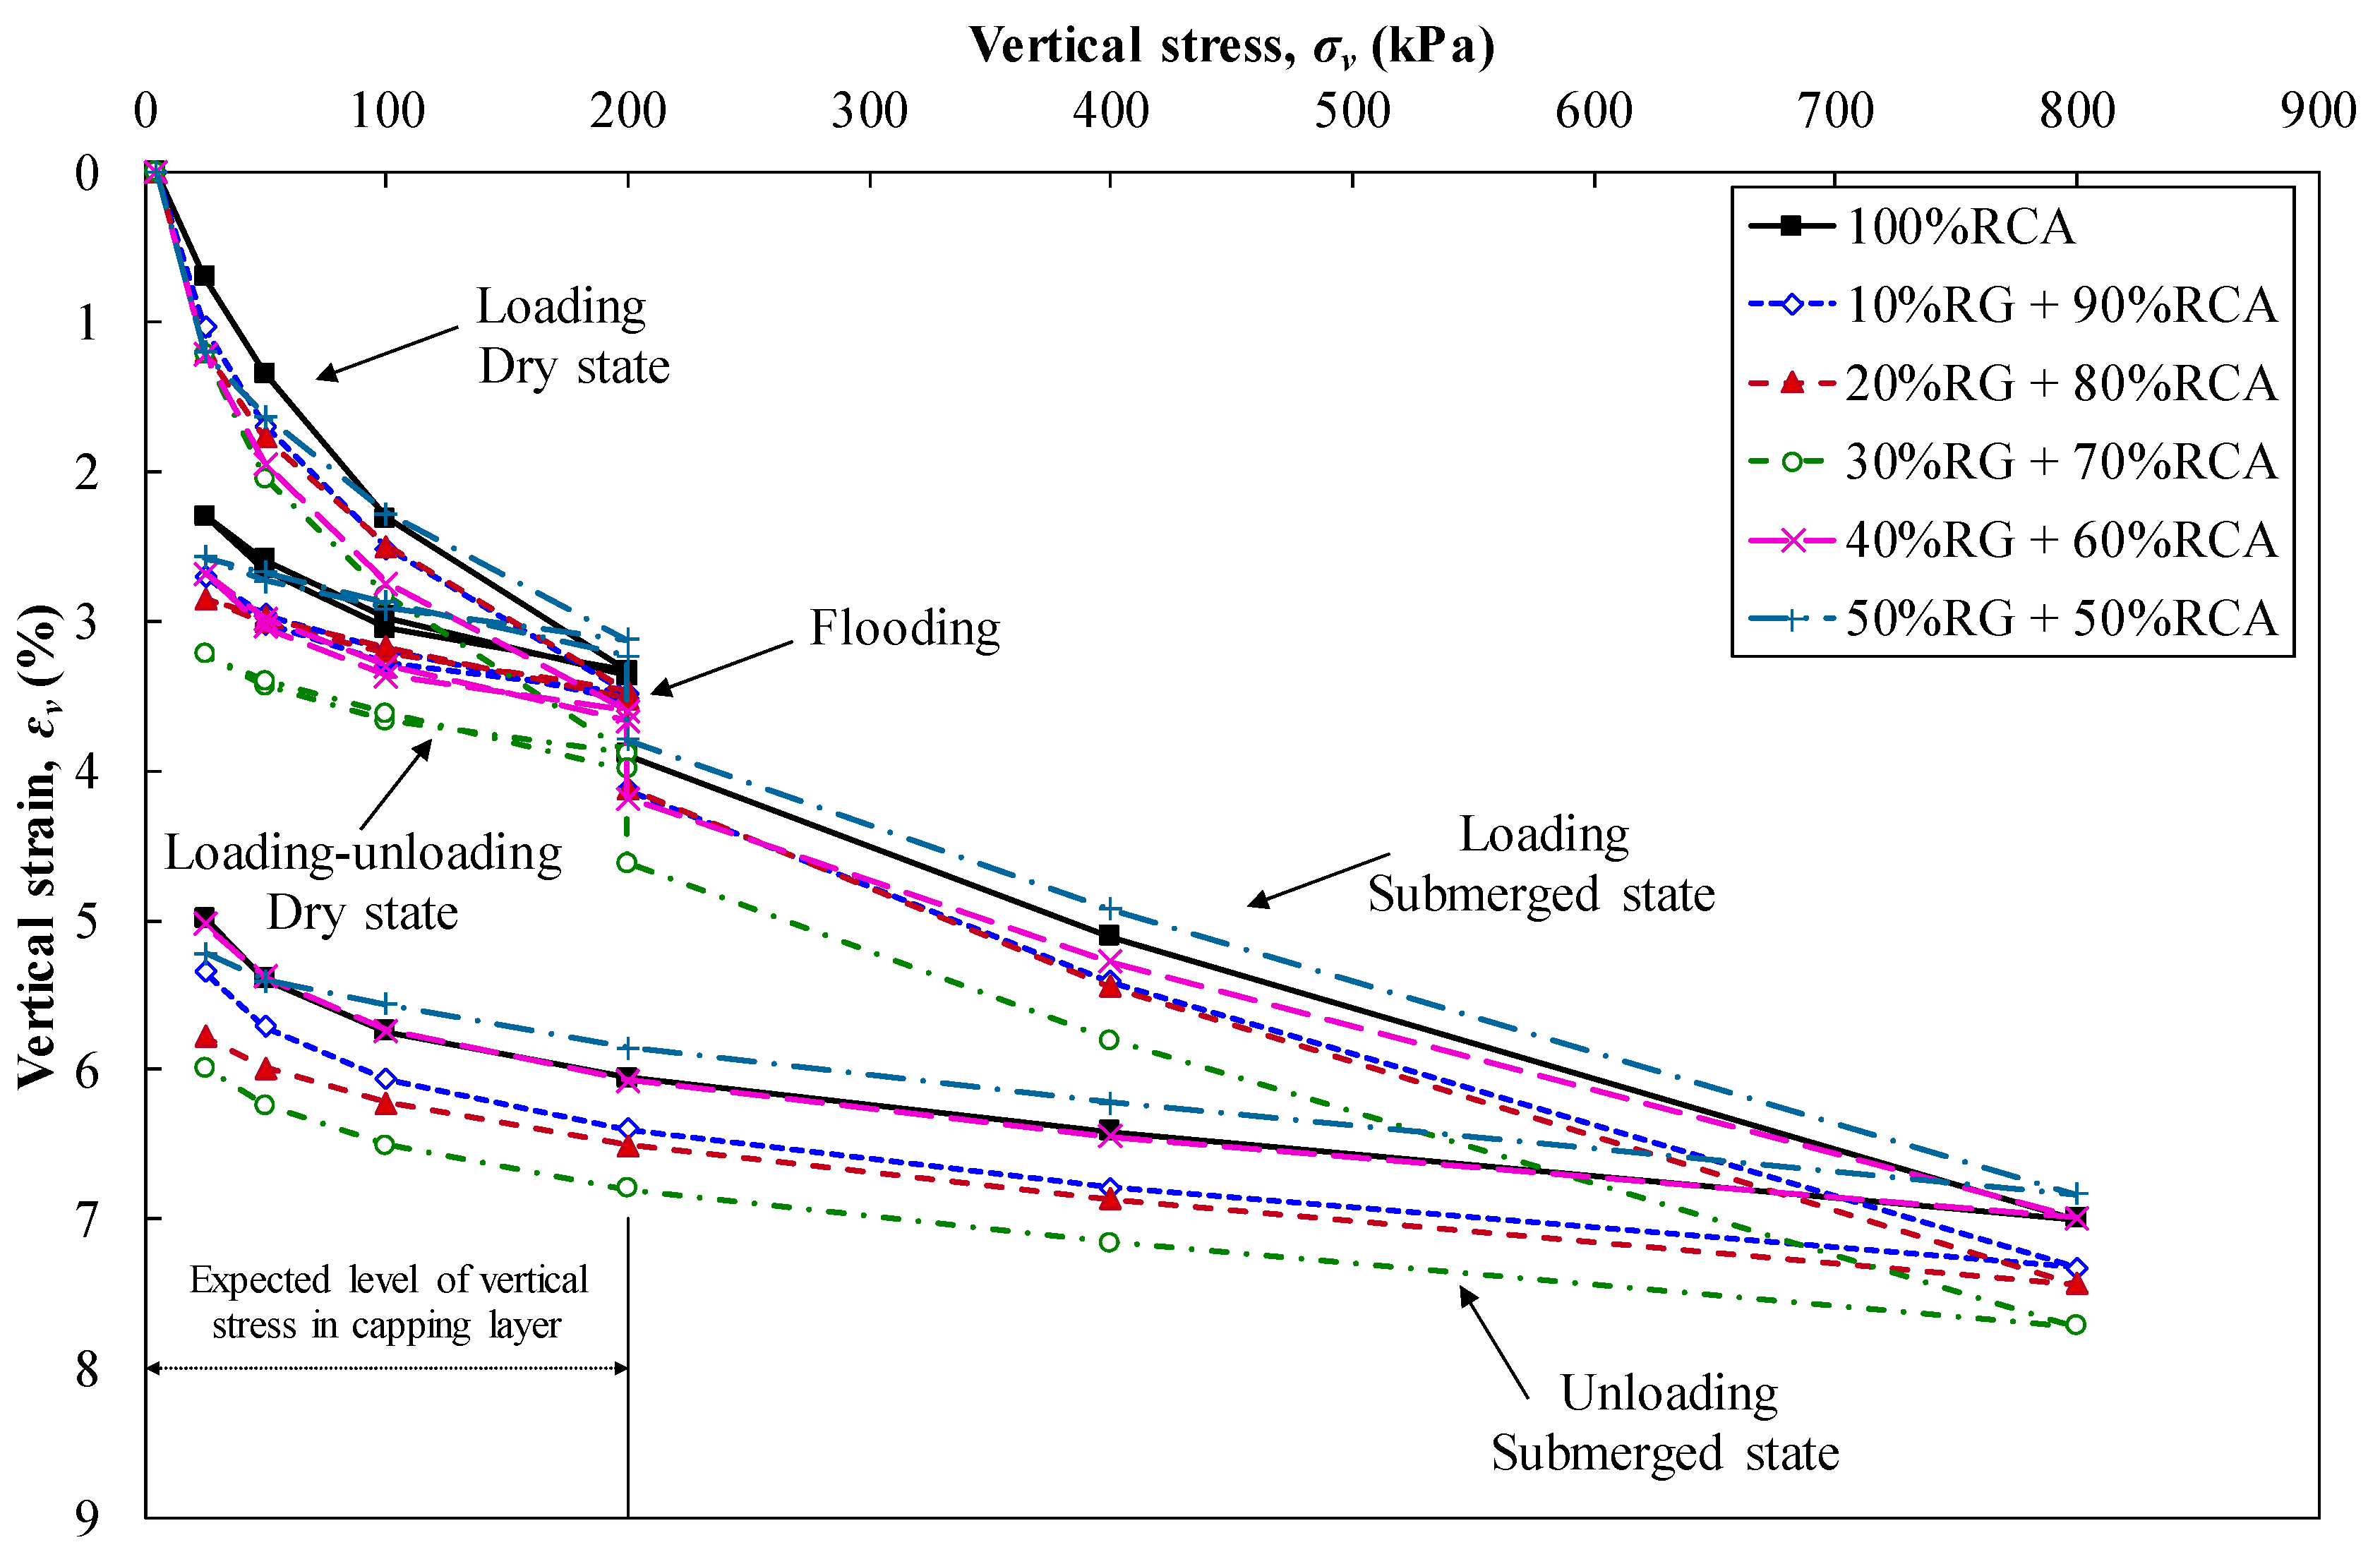
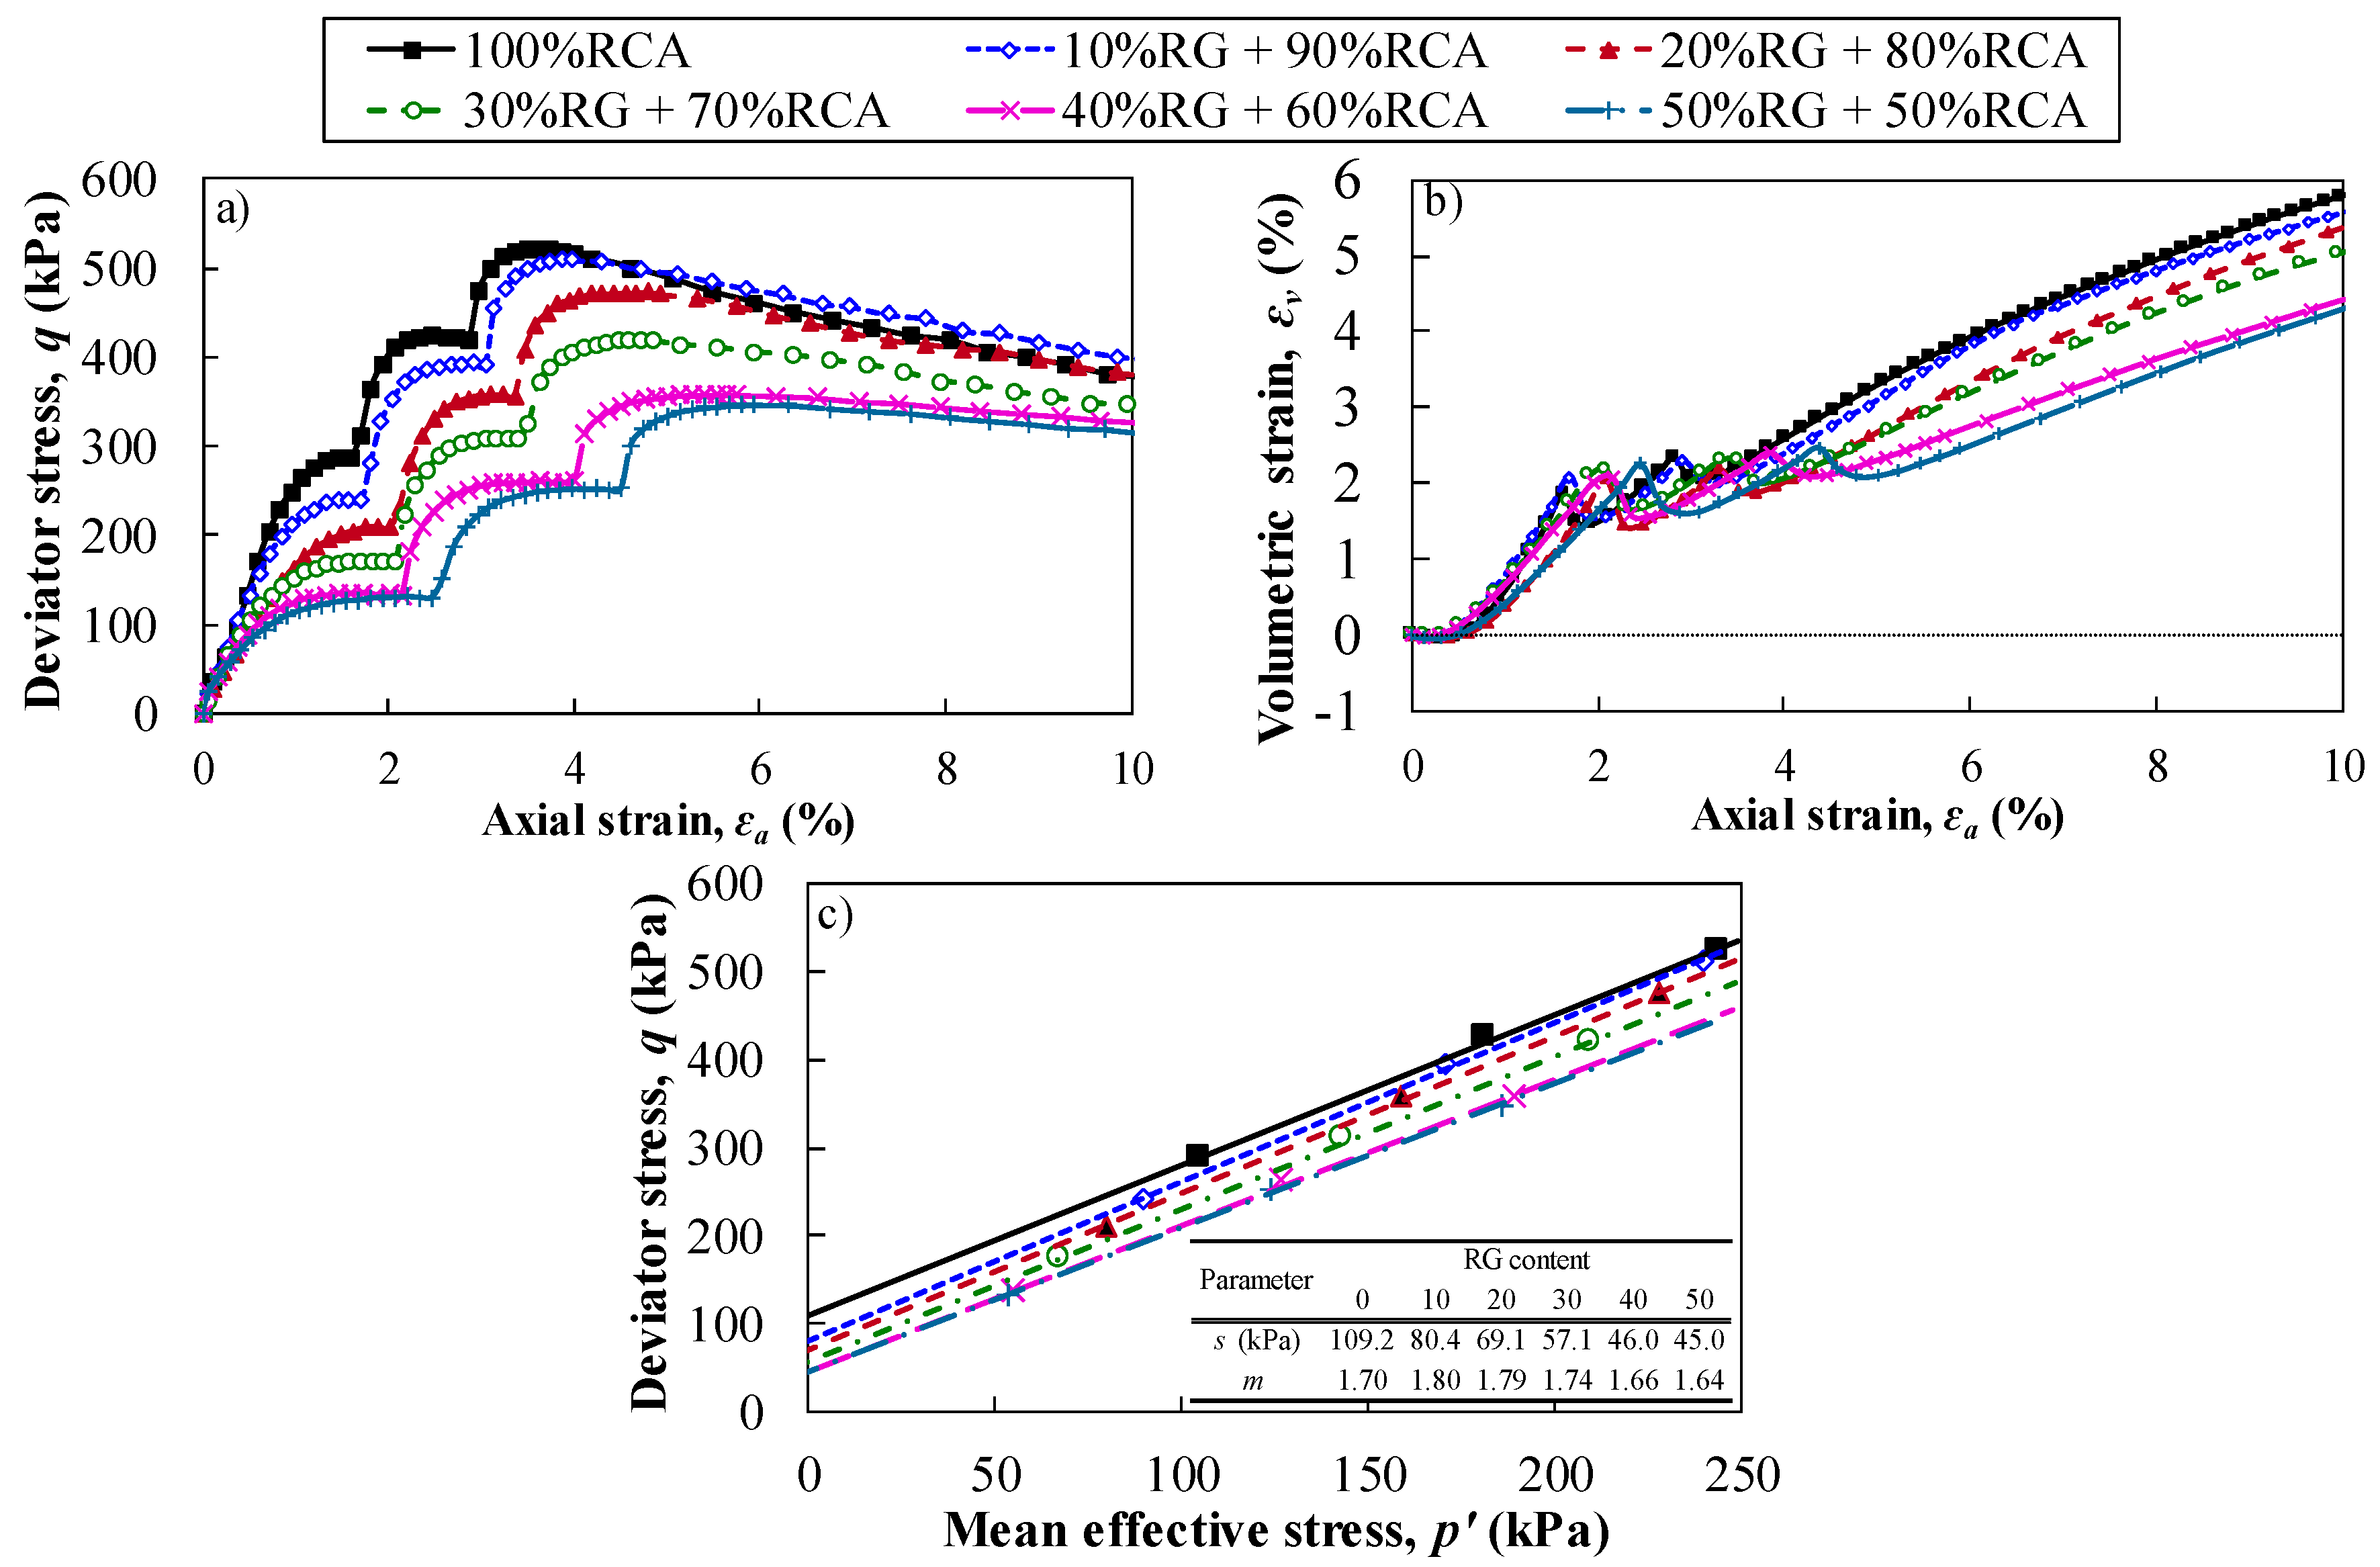
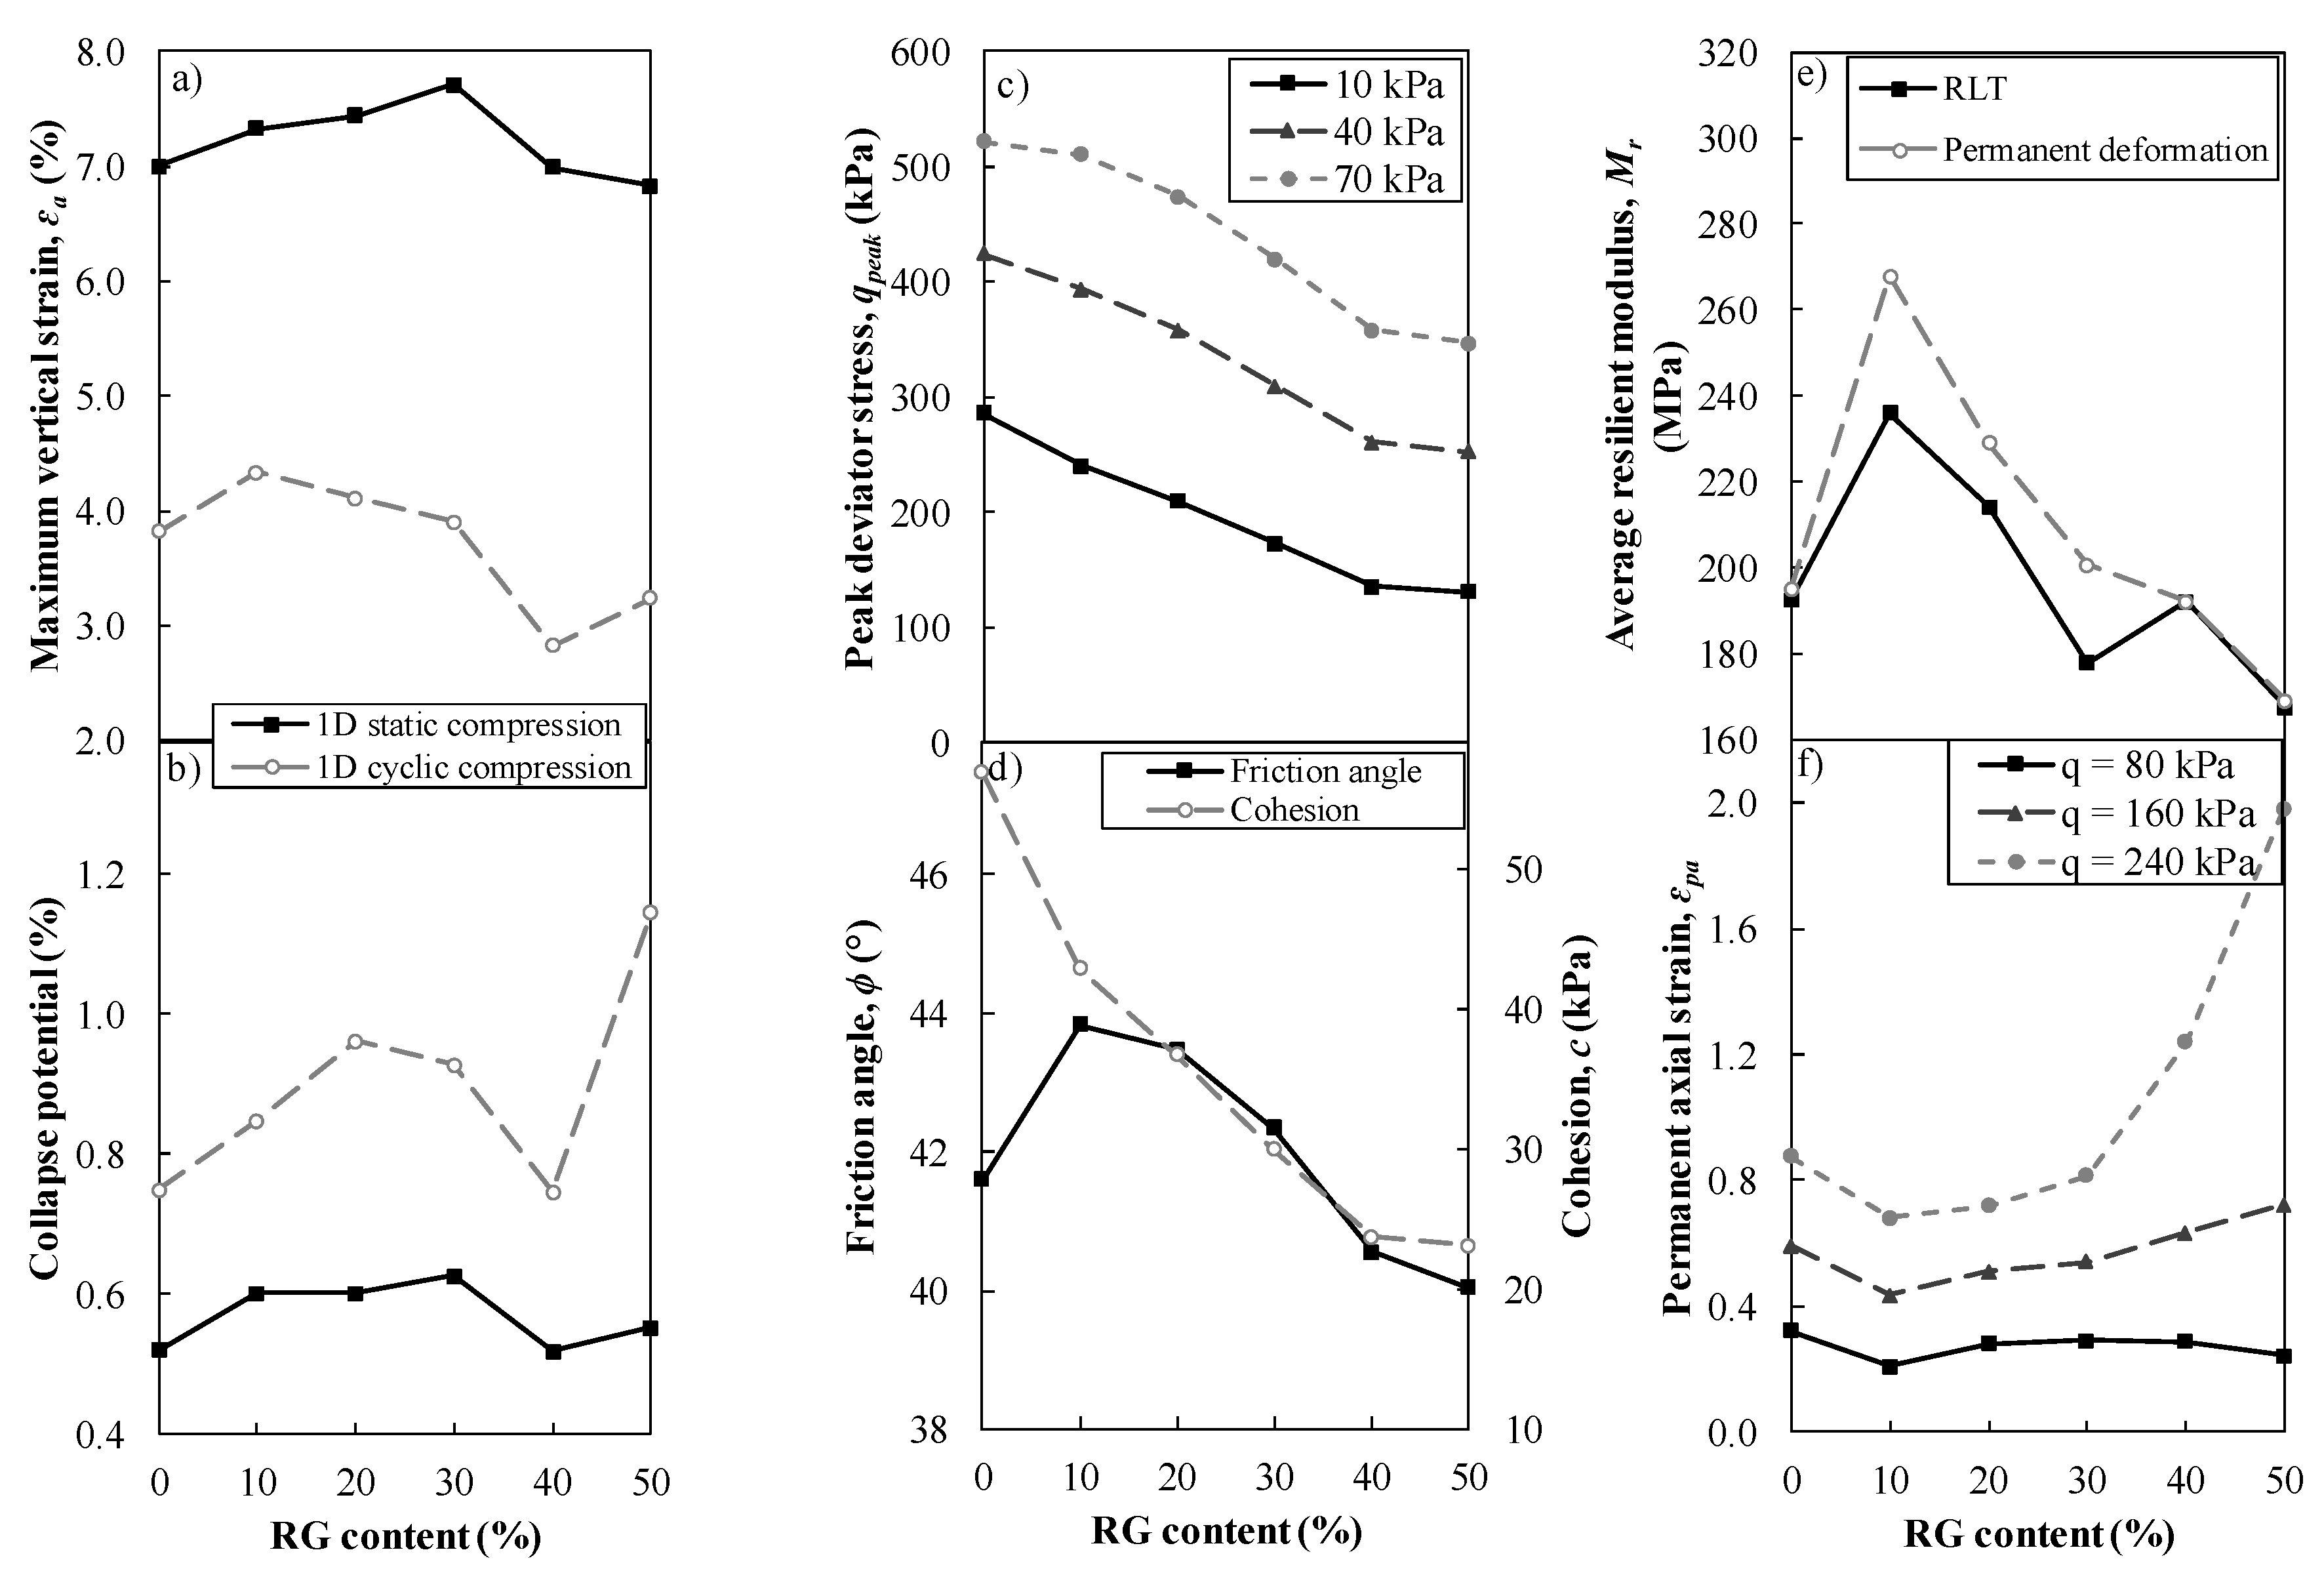
  • RG percentage was a governing factor in responses of blends under 1D compression loading. Samples with 40% and 50% RG content could present even lower deformations than the parent aggregates, RCA. However, the collapse potential of blends did not significantly alter with the addition of RG particles. Moreover, the presence of RG increased the ductility of RCA and reduced the shear strength parameters of RCA under multistage triaxial compression loading. A reduction in dilatancy of the blends was observed for samples with higher RG content.
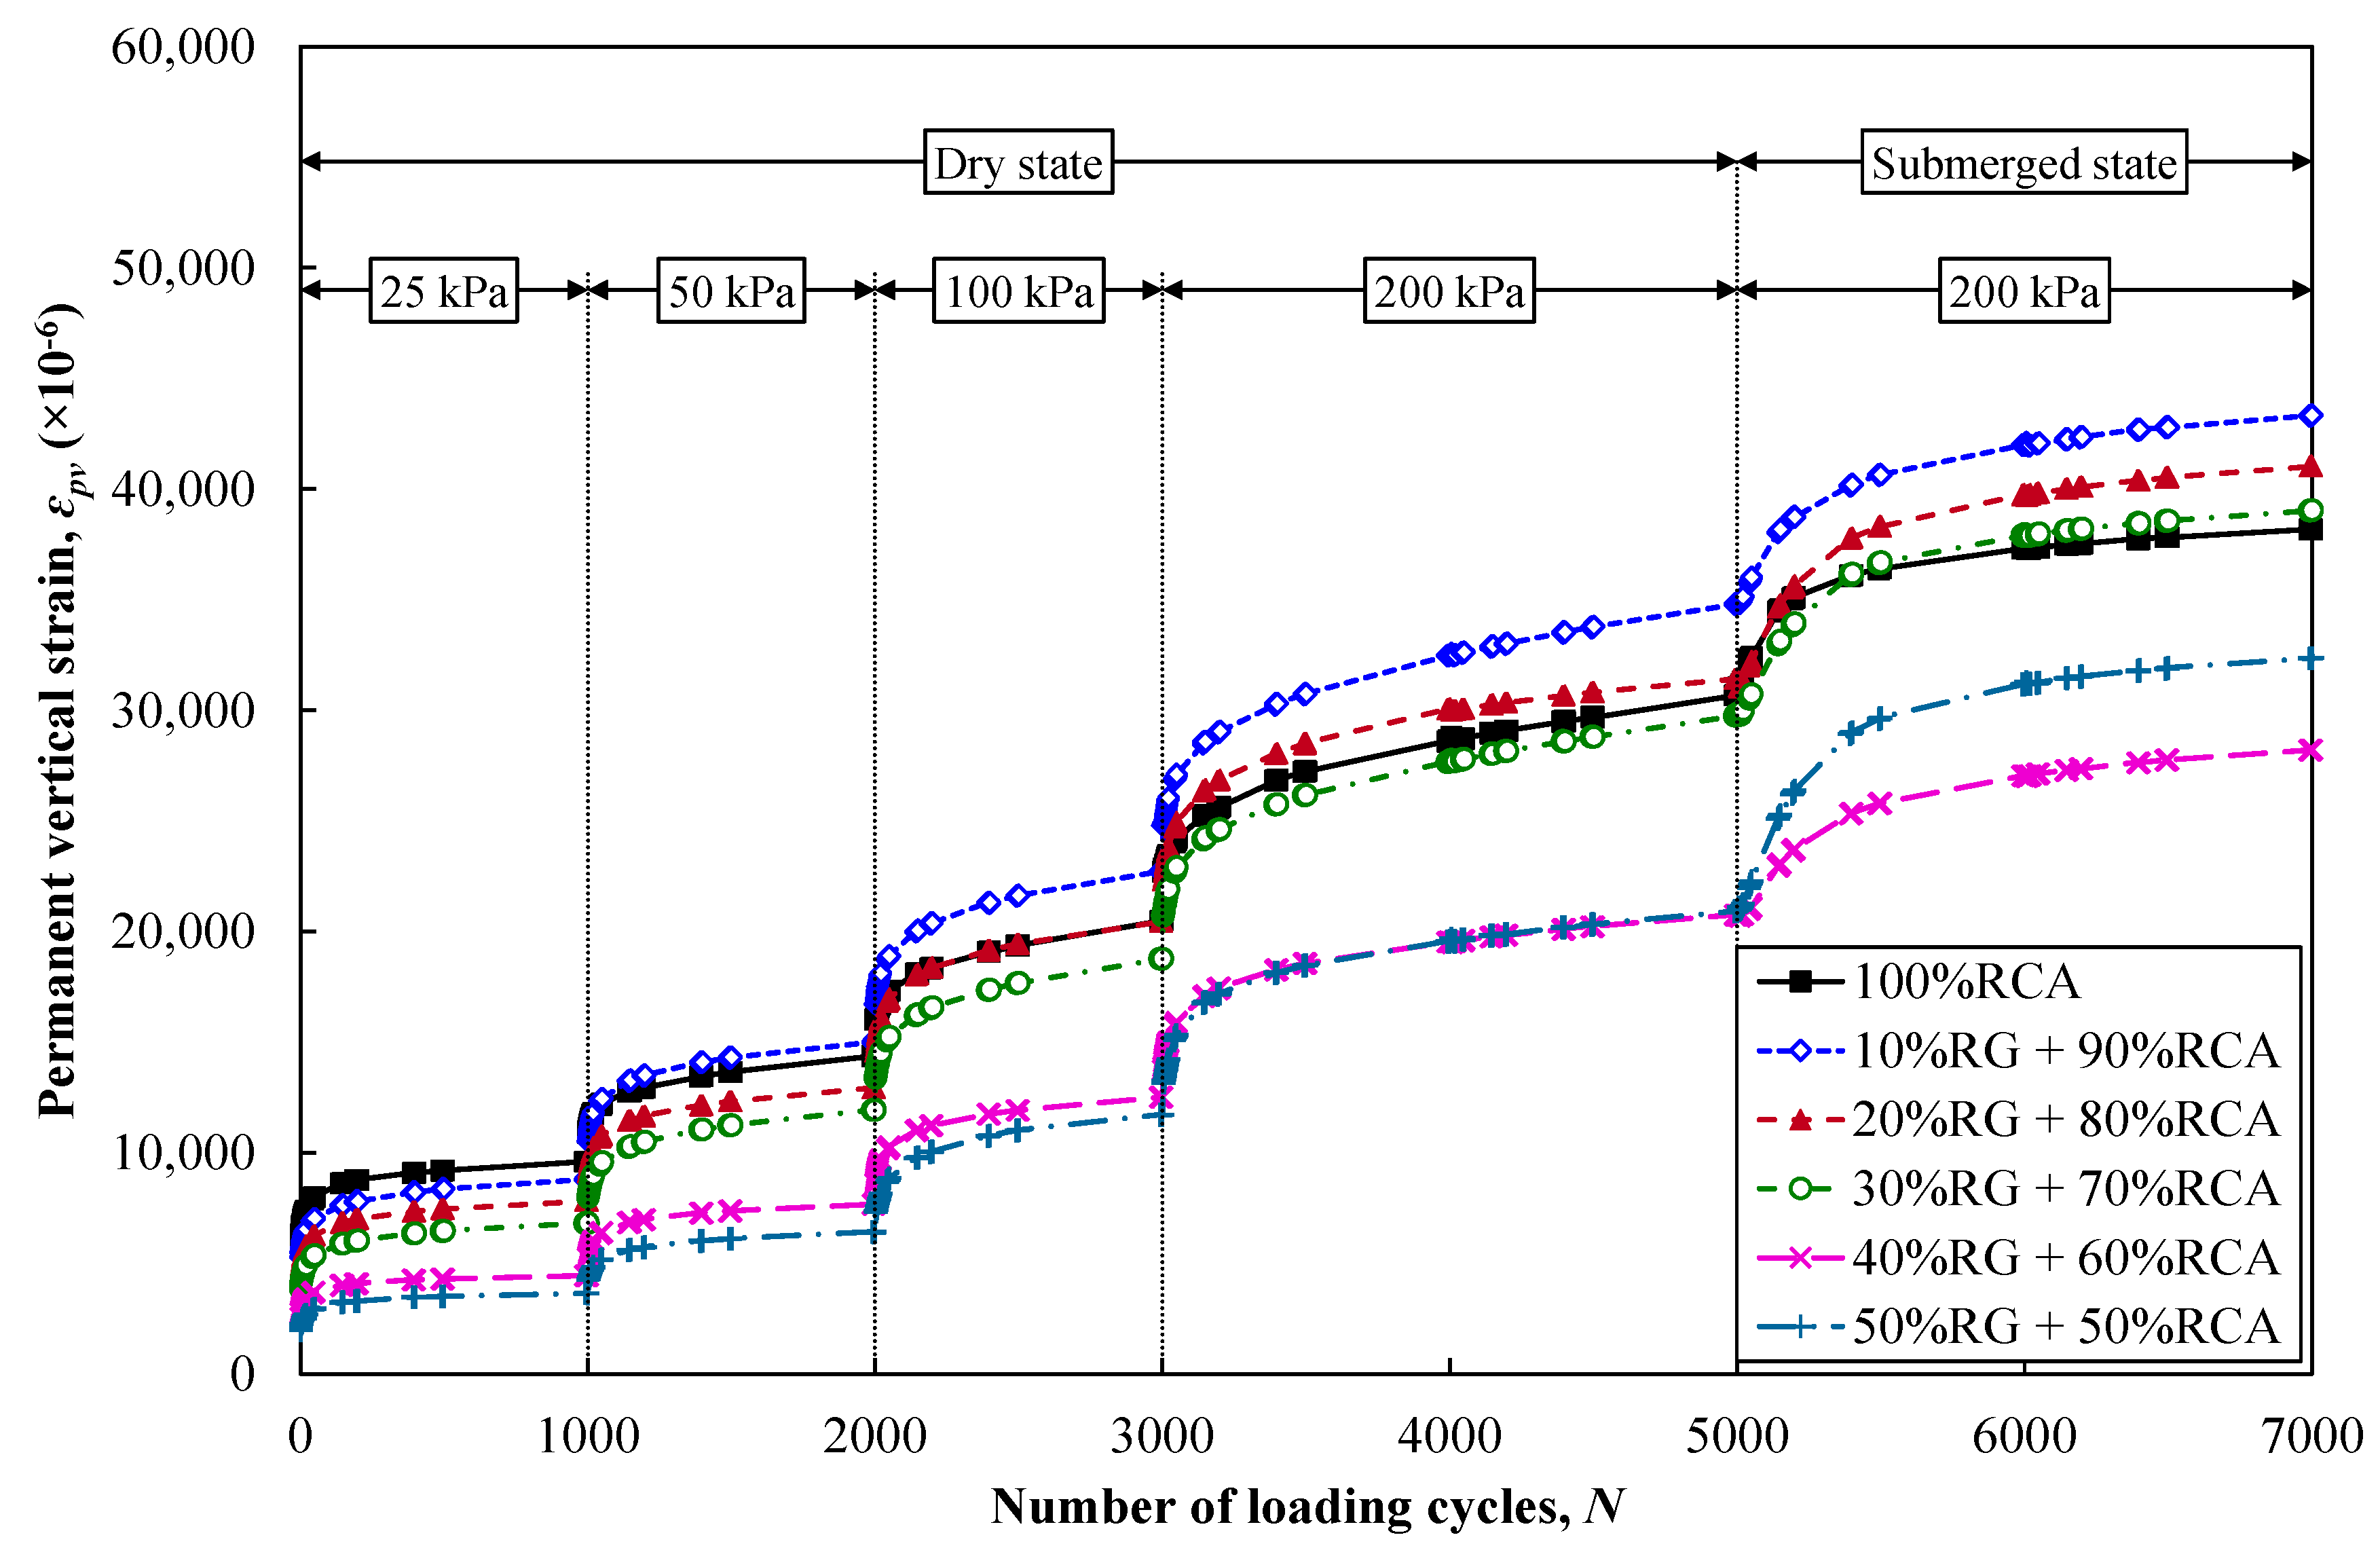
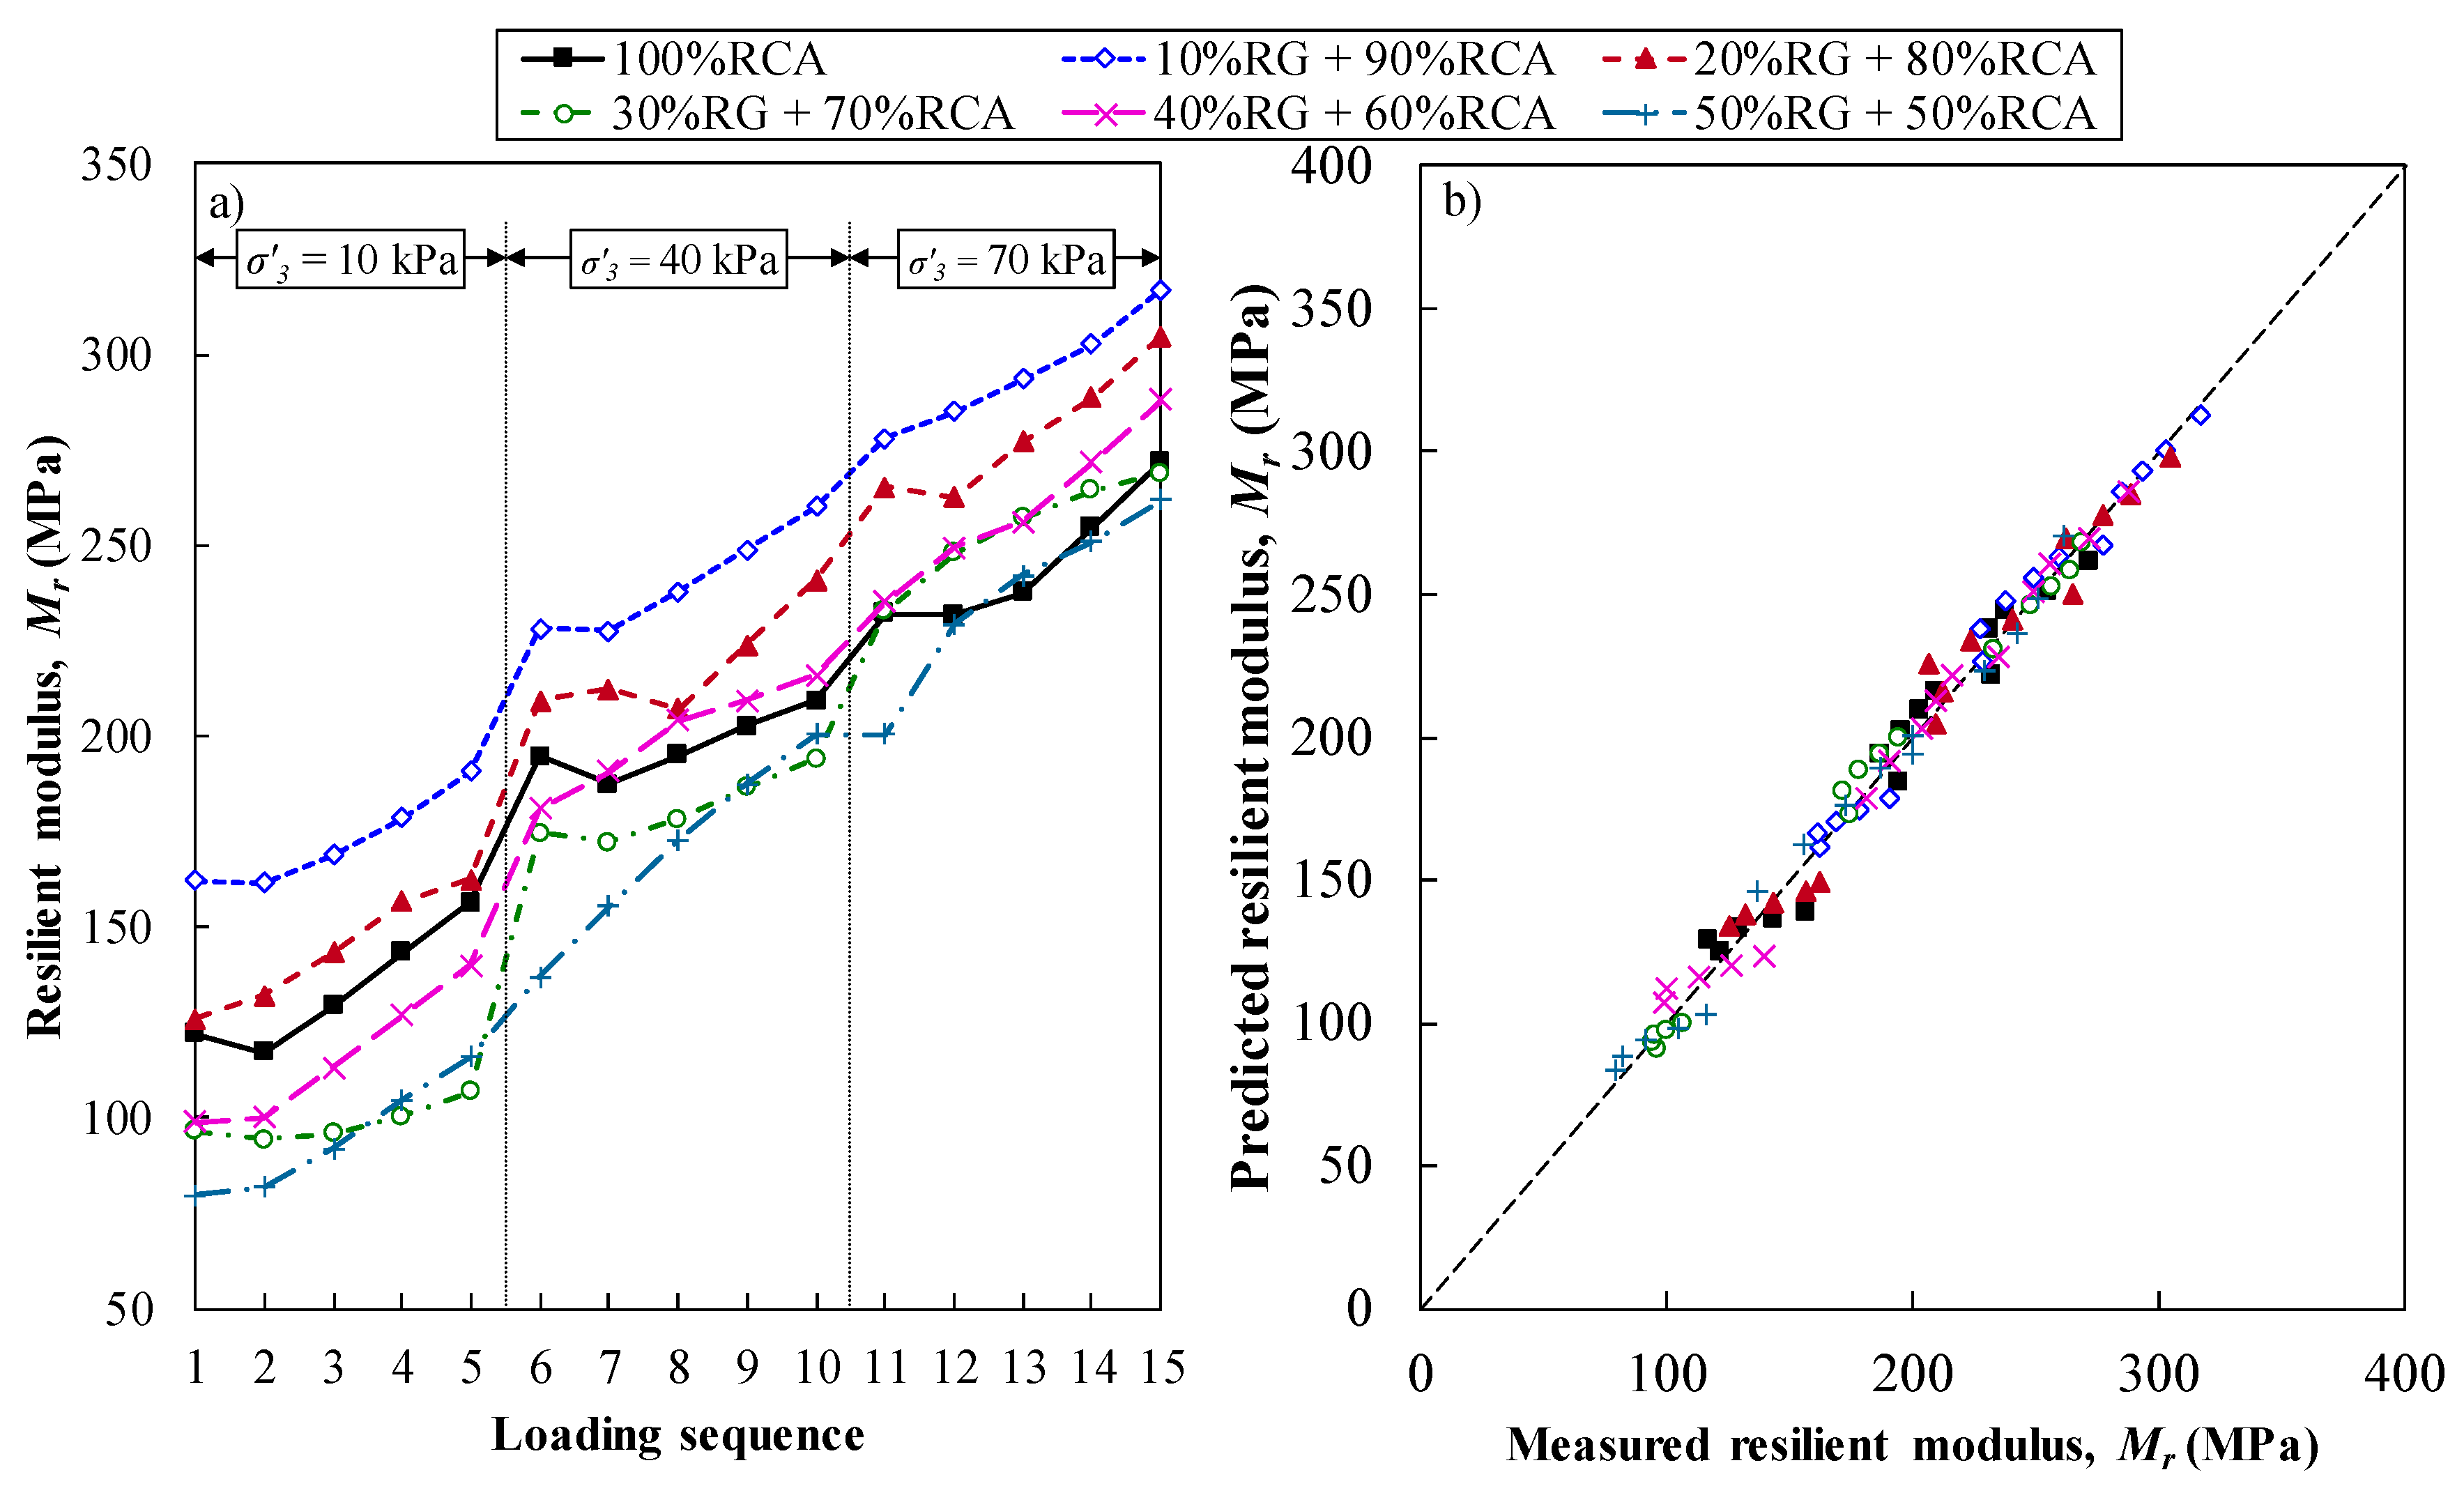
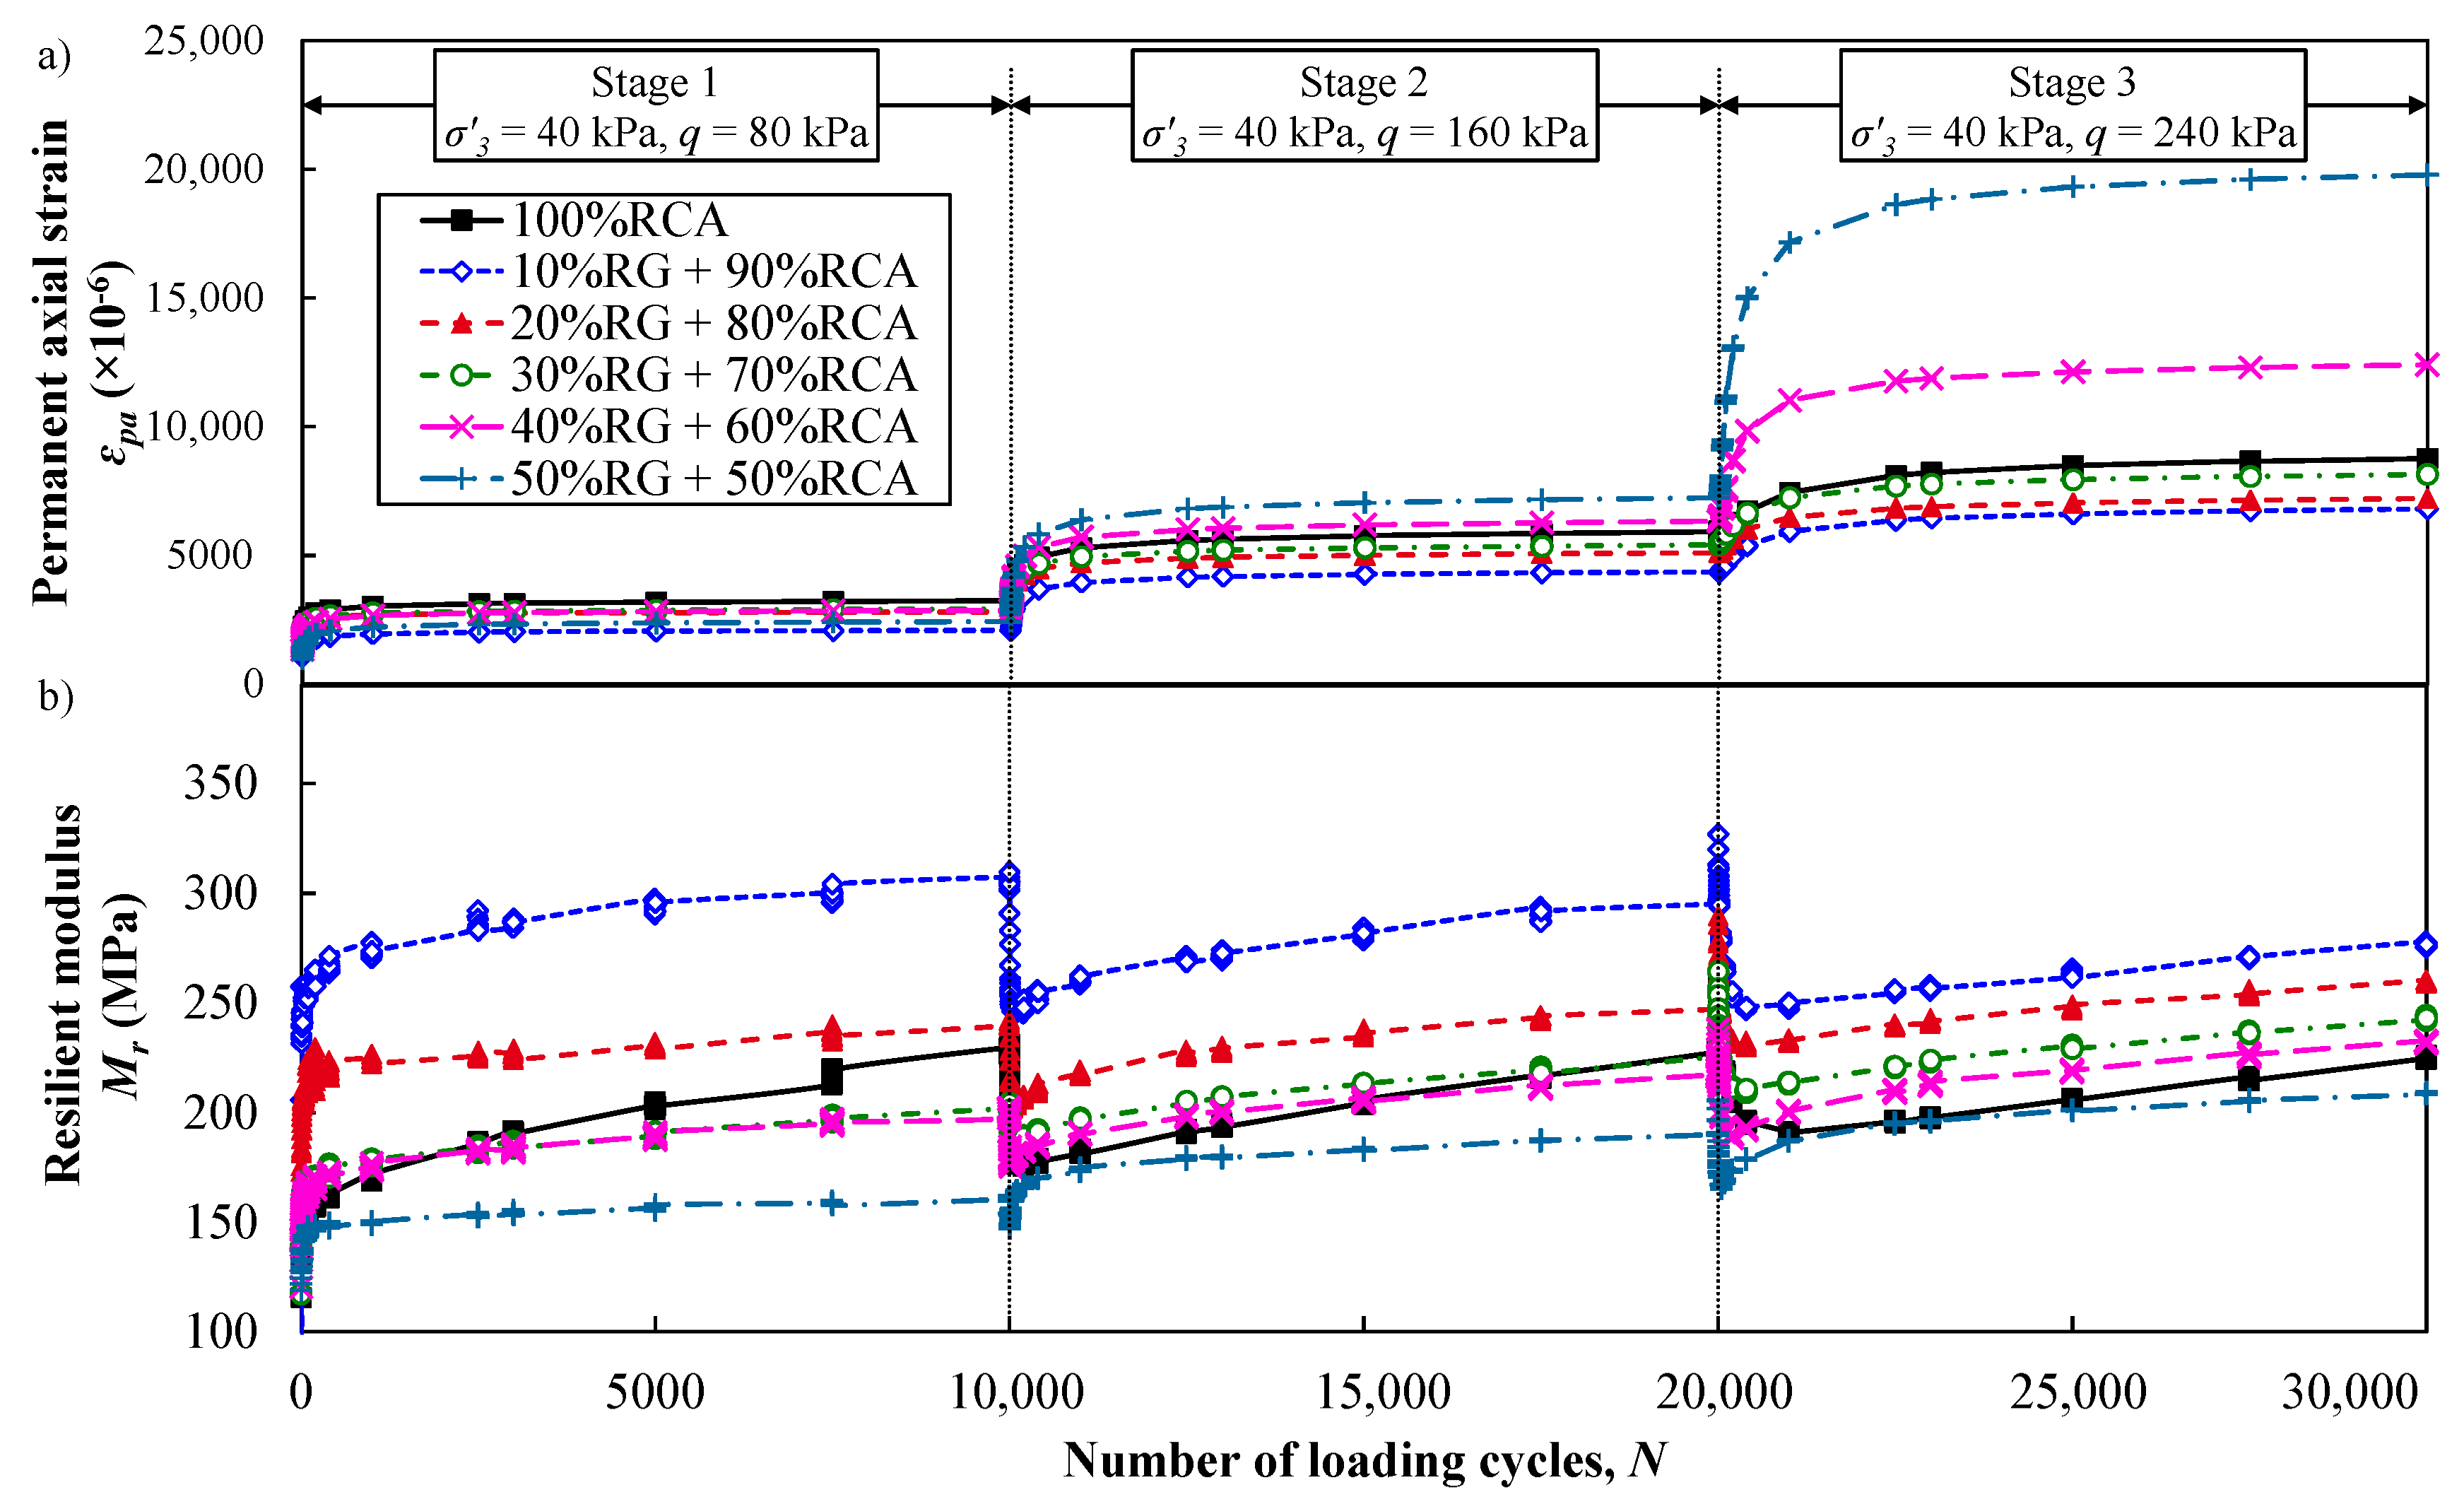
  • The highest Mr values were measured for 10% RG + 90% RCA blend from both RLT and multistage cyclic permanent deformation tests. Nonetheless, a decreasing trend in Mr values was observed from 10% to 50% RG content. Furthermore, the differences in permanent deformation responses of RG + RCA blends increased with increasing the RG content.
  • A permanent deformation model was modified to incorporate the effect of both applied cyclic stress and shear strength of the materials. The model could perform satisfactorily in predicting the results of RG + RCA samples.
  • The permanent deformation rate of RG + RCA blends and their shakedown ranking revealed that none of the samples experienced incremental collapse under the applied range of cyclic loading.

Author Contributions

Conceptualization: M.N., A.M., A.A., and S.H.; methodology: M.N.; formal analysis: M.N.; writing—original draft preparation: M.N.; writing—review and editing: A.M., A.A., and S.H.; supervision: A.M., and A.A.; funding acquisition: A.A., and S.H. All authors have read and agreed to the published version of the manuscript.

Funding

This research was conducted by the Australian Research Council Industrial Transformation Training Centre for Advanced Technologies in Rail Track Infrastructure (IC170100006), which is funded by the Australian government. The third and last authors acknowledge the support from National Science and Technology Development Agency, Thailand, under the grant no. P-19-52303.

Institutional Review Board Statement

Not applicable.

Informed Consent Statement

Not applicable.

Data Availability Statement

The data presented in this study are available on request from the corresponding author. The data are not publicly available due to privacy restrictions.

Conflicts of Interest

The authors declare no conflict of interest.

References

  1. Du, Y.; Yang, W.; Ge, Y.; Wang, S.; Liu, P. Thermal conductivity of cement paste containing waste glass powder, metakaolin and limestone filler as supplementary cementitious material. J. Clean. Prod. 2020, 287, 125018. [Google Scholar] [CrossRef]
  2. Pickin, J.; Wardle, C.; O’Farrell, K.; Nyunt, P.; Donovan, S. Australian National Waste Report 2018; Department of the Environment and Energy, Blue Environment Pty Ltd.: Melbourne, Australia, 2020; pp. 1–156. [Google Scholar]
  3. Gao, X.; Yu, Q.; Li, X.S.; Yuan, Y. Assessing the modification efficiency of waste glass powder in hydraulic construction materials. Constr. Build. Mater. 2020, 263, 120111. [Google Scholar] [CrossRef]
  4. Naeini, M.; Mohammadinia, A.; Arulrajah, A.; Horpibulsuk, S.; Leong, M. Stiffness and strength characteristics of demolition waste, glass and plastics in railway capping layers. Soils Found. 2019, 59, 2238–2253. [Google Scholar] [CrossRef]
  5. Arulrajah, A.; Naeini, M.; Mohammadinia, A.; Horpibulsuk, S.; Leong, M. Recovered plastic and demolition waste blends as railway capping materials. Transp. Geotech. 2020, 22, 100320. [Google Scholar] [CrossRef]
  6. Vieira, C.S.; Pereira, P.M. Use of recycled construction and demolition materials in geotechnical applications: A review. Resour. Conserv. Recycl. 2015, 103, 192–204. [Google Scholar] [CrossRef]
  7. Mohsenian Hadad Amlashi, S.; Vaillancourt, M.; Carter, A.; Bilodeau, J.-P. Resilient modulus of pavement unbound granular materials containing recycled glass aggregate. Mater. Struct. 2018, 51, 89. [Google Scholar] [CrossRef]
  8. Kazmi, D.; Williams, D.J.; Serati, M. Waste glass in civil engineering applications—A review. Int. J. Appl. Ceram. Technol. 2020, 17, 529–554. [Google Scholar] [CrossRef]
  9. Maduabuchukwu Nwakaire, C.; Poh Yap, S.; Chuen Onn, C.; Wah Yuen, C.; Adebayo Ibrahim, H. Utilisation of recycled concrete aggregates for sustainable highway pavement applications; a review. Constr. Build. Mater. 2020, 235, 117444. [Google Scholar] [CrossRef]
  10. Li, D.; Hyslip, J.; Sussmann, T.; Chrismer, S. Railway Geotechnics; CRC Press: Boca Raton, FL, USA, 2016. [Google Scholar]
  11. Indraratna, B.; Ngo, T. Ballast Railroad Design: Smart-Uow Approach; CRC Press: Boca Raton, FL, USA, 2018. [Google Scholar]
  12. Qi, Y.; Indraratna, B.; Heitor, A.; Vinod, J.S. Effect of Rubber Crumbs on the Cyclic Behavior of Steel Furnace Slag and Coal Wash Mixtures. J. Geotech. Geoenviron. Eng. 2018, 144, 04017107. [Google Scholar] [CrossRef] [Green Version]
  13. Sainz-Aja, J.; Carrascal, I.; Polanco, J.A.; Thomas, C.; Sosa, I.; Casado, J.; Diego, S. Self-compacting recycled aggregate concrete using out-of-service railway superstructure wastes. J. Clean. Prod. 2019, 230, 945–955. [Google Scholar] [CrossRef]
  14. Kaewunruen, S.; Meesit, R. Eco-friendly High-Strength Concrete Engineered by Micro Crumb Rubber from Recycled Tires and Plastics for Railway Components. Adv. Civ. Eng. Mater. 2020, 9, 210–226. [Google Scholar] [CrossRef]
  15. Qi, Y.; Indraratna, B. Energy-Based Approach to Assess the Performance of a Granular Matrix Consisting of Recycled Rubber, Steel-Furnace Slag, and Coal Wash. J. Mater. Civ. Eng. 2020, 32, 04020169. [Google Scholar] [CrossRef]
  16. Tasalloti, A.; Chiaro, G.; Banasiak, L.; Palermo, A. Experimental investigation of the mechanical behaviour of gravel-granulated tyre rubber mixtures. Constr. Build. Mater. 2021, 273, 121749. [Google Scholar] [CrossRef]
  17. Tawk, M.; Qi, Y.; Indraratna, B.; Rujikiatkamjorn, C.; Heitor, A. Behaviour of a Mixture of Coal Wash and Rubber Crumbs under Cyclic Loading. J. Mater. Civ. Eng. 2021, 33, 04021054. [Google Scholar] [CrossRef]
  18. Tasalloti, S.; Indraratna, B.; Rujikiatkamjorn, C.; Heitor, A.; Chiaro, G. A Laboratory Study on the Shear Behavior of Mixtures of Coal Wash and Steel Furnace Slag as Potential Structural Fill. Geotech. Test. J. 2015, 38, 361–372. [Google Scholar] [CrossRef] [Green Version]
  19. Australian Rail Track Corporation. Earthworks Materials Specification. ETC-08-03. 2017. Available online: https://extranet.artc.com.au/docs/eng/track-civil/procedures/earthworks/ETC-08-03.pdf (accessed on 5 January 2021).
  20. Nazzal, M.D.; Mohammad, L.N.; Austin, A. Evaluating Laboratory Tests for Use in Specifications for Unbound Base Course Materials. J. Mater. Civ. Eng. 2020, 32, 04020036. [Google Scholar] [CrossRef]
  21. VicRoads. Code of Practice RC 500.02—Registration of Crushed Rock Mix Designs; VicRoads: Melbourne, Australia, 2017; pp. 1–9. [Google Scholar]
  22. ASTM D2487. Standard Practice for Classification of Soils for Engineering Purposes (Unified Soil Classification System); ASTM International: West Conshohocken, PA, USA, 2017. [Google Scholar]
  23. ASTM C127. Standard Test Method for Relative Density (Specific Gravity) and Absorption of Coarse Aggregate; ASTM International: West Conshohocken, PA, USA, 2015. [Google Scholar]
  24. ASTM C128. Standard Test Method for Relative Density (Specific Gravity) and Absorption of Fine Aggregate; ASTM International: West Conshohocken, PA, USA, 2015. [Google Scholar]
  25. ASTM C131/C131M. Standard Test Method for Resistance to Degradation of Small-Size Coarse Aggregate by Abrasion and Impact in the Los Angeles Machine; ASTM International: West Conshohocken, PA, USA, 2014. [Google Scholar]
  26. ASTM D698. Standard Test Methods for Laboratory Compaction Characteristics of Soil Using Standard Effort (12 400 ft-lbf/ft3 (600 kN-m/m3)); ASTM International: West Conshohocken, PA, USA, 2012. [Google Scholar]
  27. ASTM D1883. Standard Test Method for California Bearing Ratio (CBR) of Laboratory-Compacted Soils; ASTM International: West Conshohocken, PA, USA, 2012. [Google Scholar]
  28. Tasalloti, A.; Marshall, A.M.; Heron, C.M.; Hashemi, M.A. Geocellular railway drainage systems: Physical and numerical modelling. Transp. Geotech. 2020, 22, 100299. [Google Scholar] [CrossRef]
  29. Tapias, M.; Alonso, E.E.; Gili, J. A particle model for rockfill behaviour. Géotechnique 2015, 65, 975–994. [Google Scholar] [CrossRef]
  30. Indraratna, B.; Ionescu, D.; Christie, D.; Chowdhury, R. Compression and degradation of railway ballast under one-dimensional loading. Aust. Geomech. J. 1997, 4, 48–61. [Google Scholar]
  31. AS 1289.6.4.1. Methods of Testing Soils for Engineering Purposes Soil Strength and Consolidation Tests—Determination of Compressive Strength of a Soil—Compressive strength of a Specimen Tested in Undrained Triaxial Compression without Measurement of Pore Water Pressure; Standards Australia; SAI Global: Sydney, NSW, Australia, 2016; p. 5. [Google Scholar]
  32. Naeini, M.; Mohammadinia, A.; Arulrajah, A.; Horpibulsuk, S. Cyclic behavior of semi-rigid recovered plastic blends in railway track substructure. Transp. Geotech. 2021, 28, 100514. [Google Scholar] [CrossRef]
  33. Suiker, A.S.J.; Selig, E.T.; Frenkel, R. Static and Cyclic Triaxial Testing of Ballast and Subballast. J. Geotech. Geoenviron. Eng. 2005, 131, 771–782. [Google Scholar] [CrossRef]
  34. Indraratna, B.; Nimbalkar, S.; Christie, D.; Rujikiatkamjorn, C.; Vinod, J. Field Assessment of the Performance of a Ballasted Rail Track with and without Geosynthetics. J. Geotech. Geoenviron. Eng. 2010, 136, 907–917. [Google Scholar] [CrossRef]
  35. CEN EN 13286-7. Unbound and Hydraulically Bound Mixtures-Part 7: Cyclic Load Triaxial Test for Unbound Mixtures; EN 13286-7; European Committee for Standardization: Brussels, Belgium, 2004. [Google Scholar]
  36. AASHTO T307. Standard Method of Test for Determining the Resilient Modulus of Soils and Aggregate Materials; American Association of State Highway and Transportation Officials: Washington, DC, USA, 2012; Volume 99. [Google Scholar]
  37. Naeini, M.; Akhtarpour, A. Numerical analysis of seismic stability of a high centerline tailings dam. Soil Dyn. Earthq. Eng. 2018, 107, 179–194. [Google Scholar] [CrossRef]
  38. Touqan, M.; Ahmed, A.; El Naggar, H.; Stark, T. Static and cyclic characterization of fouled railroad sub-ballast layer behaviour. Soil Dyn. Earthq. Eng. 2020, 137, 106293. [Google Scholar] [CrossRef]
  39. Mohammadinia, A.; Naeini, M.; Arulrajah, A.; Horpibulsuk, S.; Leong, M. Shakedown analysis of recycled materials as railway capping layer under cyclic loading. Soil Dyn. Earthq. Eng. 2020, 139, 106423. [Google Scholar] [CrossRef]
  40. Pereira, J.H.F.; Fredlund, D.G. Volume Change Behavior of Collapsible Compacted Gneiss Soil. J. Geotech. Geoenviron. Eng. 2000, 126, 907–916. [Google Scholar] [CrossRef]
  41. Ooi, P.S.K.; Li, M.M.W.; Sagario, M.L.Q.; Song, Y. Shear Strength Characteristics of Recycled Glass. Transp. Res. Rec. 2008, 2059, 52–62. [Google Scholar] [CrossRef]
  42. Andrei, D.; Witczak, M.W.; Schwartz, C.W.; Uzan, J. Harmonized Resilient Modulus Test Method for Unbound Pavement Materials. Transp. Res. Rec. 2004, 1874, 29–37. [Google Scholar] [CrossRef]
  43. Witczak, M.W. Simple Performance Test for Superpave Mix Design; Transportation Research Board: Washington, DC, USA, 2002; Volume 465. [Google Scholar]
  44. Chow, L.C.; Mishra, D.; Tutumluer, E. Framework for Development of an Improved Unbound Aggregate Base Rutting Model for Mechanistic–Empirical Pavement Design. Transp. Res. Rec. 2014, 2401, 11–21. [Google Scholar] [CrossRef]
  45. Byun, Y.-H.; Feng, B.; Qamhia, I.I.A.; Tutumluer, E. Aggregate Properties Affecting Shear Strength and Permanent Deformation Characteristics of Unbound–Base Course Materials. J. Mater. Civ. Eng. 2020, 32, 04019332. [Google Scholar] [CrossRef]
  46. Erlingsson, S.; Rahman, S.; Salour, F. Characteristic of unbound granular materials and subgrades based on multi stage RLT testing. Transp. Geotech. 2017, 13, 28–42. [Google Scholar] [CrossRef]
  47. Werkmeister, S.; Dawson, A.R.; Wellner, F. Pavement Design Model for Unbound Granular Materials. J. Transp. Eng. 2004, 130, 665–674. [Google Scholar] [CrossRef]
  48. Werkmeister, S. Permanent Deformation Behaviour of Unbound Granular Materials in Pavement Constructions. Ph.D. Thesis, University of Technology, Dresden, Germany, 2003. [Google Scholar]
Figure 1. Particle size distribution of recycled glass (RG) and recycled concrete aggregate (RCA) blends.
Sustainability 13 02463 g001
Figure 2. Variation in void ratio, e, and optimum moisture content (OMC) of RG + RCA blends.
Sustainability 13 02463 g002
Figure 3. Stress–strain responses of RG + RCA blends under 1D static compression loading.
Sustainability 13 02463 g003
Figure 4. Permanent vertical deformations of RG + RCA blends under 1D cyclic compression loading.
Sustainability 13 02463 g004
Figure 5. Multistage triaxial compression behavior of RG + RCA blends: (a) deviator stress versus the axial strain; (b) volumetric strain versus the axial strain; and (c) Mohr–Coulomb failure envelopes.
Sustainability 13 02463 g005
Figure 6. RLT test responses of RG + RCA blends: (a) Mr values and (b) predicted versus measured Mr values.
Sustainability 13 02463 g006
Figure 7. Multistage cyclic permanent deformation responses of RG + RCA blends versus the number of loading cycles: (a) permanent axial strain and (b) Mr values.
Sustainability 13 02463 g007
Figure 8. Comparison between predicted and measured permanent axial deformations of RG + RCA blends under multistage cyclic loading.
Sustainability 13 02463 g008
Figure 9. Permanent axial deformation rate of RG + RCA blends versus the permanent axial deformation: (a) stage 1 with qmax = 80 kPa; (b) stage 2 with qmax = 160 kPa; and (c) stage 3 with qmax = 240 kPa.
Sustainability 13 02463 g009
Figure 10. Effect of RG content on deformability, stiffness, and strength of RG + RCA blends: (a) maximum deformation and (b) collapse potential under 1D compression loading; (c) peak deviator stress and (d) shear strength parameters under multistage triaxial compression loading; (e) resilient modulus and (f) permanent axial strain under cyclic triaxial loading.
Sustainability 13 02463 g010
Table 1. Compaction properties and California bearing ratio (CBR) of RG + RCA blends.
Blend NameRG Content (%)Maximum Dry Density (Mg/m3)Optimum Moisture Content (%)CBR (%)
100% RCA01.84513.1974.24
10% RG + 90% RCA101.79713.0672.20
20% RG + 80% RCA201.79212.8562.70
30% RG + 70% RCA301.78412.3255.56
40% RG + 60% RCA401.80411.6050.91
50% RG + 50% RCA501.81811.5548
Table 2. Summary of loading condition applied in compressibility, stiffness, and strength tests on RG + RCA blends.
TestSample Dimensions (mm)CompactionLoading Condition
CBRD 1 = 152
H 1 = 116
MDD and OMC 2Loading rate = 1.27 mm/min
Surcharge weight = 9 kg
1D static compressionD = 152
H = 50
Dry tampingDry state vertical stress (kPa):
Loading = 25, 50, 100, 200
Unloading= 100, 50, 25
Reloading= 50, 100, 200
Flooding state vertical stress (kPa) = 200 kPa
Submerged state vertical stress (kPa):
Loading= 400, 800
Unloading= 400, 200, 100, 50, 25
1D cyclic compressionD = 152
H = 50
Dry tampingDry state σ v m a x 3 = 25, 50, 100, 200
Flooding σ v m a x = 200 kPa Submerged state σ v m a x = 200 kPa
σ v m i n 4 = 5 kPa
Haversine loading shape
Frequency = 5 Hz
Multistage triaxial compressionD = 100
H = 200
MDD and OMCLoading rate = 1 mm/min
Confining pressures = 10, 40, 70 kPa
Repeated load triaxial (RLT)D = 100
H = 200
MDD and OMCqmax5 = Table 3
Confining pressures = 10, 40, 70 kPa
qmin 6 = 5 kPa
Haversine loading shape
Frequency = 5 Hz
Multistage cyclic permanent deformationD = 100
H = 200
MDD and OMCqmax = 80, 160, 240 kPa
Confining pressure = 40
qmin = 5 kPa
Haversine loading shape
Frequency = 5 Hz
No. of loading cycles = 10,000
1 D = diameter and H = height; 2 Maximum dry density and optimum moisture content; 3 σ v m a x = maximum cyclic vertical stress; 4 σ v m i n = minimum vertical stress.; 5 qmax = maximum cyclic deviator stress; 6 qmin = minimum deviator stress.
Table 3. RLT test loading regime developed for RG + RCA blends as rail track capping materials.
Loading SequenceConfining Pressure, σ3 (kPa)Cyclic Deviator Stress, qcyc (kPa)Maximum Deviator Stress, qmax (kPa)No.Loading Cycles
Conditioning401551601000
1101520100
2103540100
3105560100
4107580100
51095100100
6403540100
7407580100
840115120100
940155160100
1040195200100
11706570100
1270135140100
1370170175100
1470205210100
1570275280100
Table 4. Regression parameters of Mr prediction model (Equation (1)) and permanent axial deformation model (Equation (7)).
SampleRLT TestCyclic Permanent Deformation Test
k1k2k3R2Se/SyStageabcR2Se/Sy
100% RCA2.1760.25730.20680.96670.21148500.06950.57240.99320.09
232850.07880.1011
344140.11050.4490
10% RG + 90% RCA2.6020.22360.19660.98480.14118140.04100.14720.99230.09
234430.12500.7685
334430.10020.3888
20% RG + 80% RCA2.4690.28420.21670.97540.18132150.03010.30680.99240.10
232160.06620.1488
345910.07760.6311
30% RG + 70% RCA2.4460.44720.18750.99280.10134690.04380.44530.99390.08
242900.08880.7859
346460.08670.8729
40%RG + 60% RCA2.2180.33910.28030.98830.12146250.08270.97440.99050.10
245400.11681.2580
352010.10961.6540
50% RG + 50% RCA1.7650.36040.41570.98920.12121040.06060.33930.98930.11
231170.10540.1621
364910.13362.764
Publisher’s Note: MDPI stays neutral with regard to jurisdictional claims in published maps and institutional affiliations.

