Article

Research on Dynamic Analysis and Mitigation Strategies of Supply Chains under Different Disruption Risks

1
Department of Economics and Management, North China Electric Power University, Baoding 071003, China
2
Sustainable Process Integration Laboratory—SPIL, NETME Centre, Faculty of Mechanical Engineering, Brno University of Technology—VUT Brno, Technická 2896/2, 616 69 Brno, Czech Republic
*
Author to whom correspondence should be addressed.
Sustainability 2021, 13(5), 2462; https://doi.org/10.3390/su13052462
Submission received: 27 January 2021 / Revised: 17 February 2021 / Accepted: 20 February 2021 / Published: 25 February 2021

Abstract

:
Due to the globalization of supply and production, supply chain management has tightened the connection between upstream and downstream enterprises. Although this modern strategy has significantly improved the efficiency of enterprises, the increasingly complex relationship between nodes also makes the supply chain system more vulnerable and unstable. As a result, the interruption of any node location in the supply chain will spread to other nodes via their diffusion, which could cause irreparable damage to the entire supply chain. Therefore, under this realistic background, only by quantitatively analyzing the specific impact on the supply chain of interruption events in different locations we can formulate active and effective mitigation strategies to achieve the effective recovery of node enterprises from interruption accidents. In this study, the system dynamics method was used to simulate the changes in inventory level, order accumulation, and profit level caused by disruption of supply, production, and sales of different node companies. The results show that the closer the node enterprise to the interruption source, the greater the risk of loss. Due to the conduction effect of the supply chain system, the risk spreads to other node enterprises. Based on the above results, corresponding mitigation strategies for enterprises to cope with different node interruptions are proposed to improve the overall efficiency and operational capabilities of the enterprise.

1. Introduction

The rapid development of economic globalization and internationalization of competition has enhanced the momentum of the supply chain. However, due to the uncertainty and complexity of the business environment, the supply chain faces higher risks which threaten its stability [1,2]. In the past decade, natural disasters (floods, hurricanes, earthquakes, etc.,) and social problems (worker strikes, terrorist attacks, etc.,) have continued to occur, causing inevitable disruption and loss to the supply chain [3,4]. The interruption of any link in the supply chain destroys the normal flow of goods and materials, causing delays in production or logistics processes and deviations from expected management objectives, which affect the normal operation of the entire supply chain [5,6,7]. For example, in March 2011, the earthquake in Japan caused many auto parts factories to shut down in large areas, which affected the vehicle manufacturers in Europe, North America, and Asia. As a result, their partners sought alternative parts suppliers, and finally formed a complementary product supply chain, reducing the impact of external interruption [8]. In May 2018, Huawei was listed in the entity list of the U.S. Department of Commerce. The upstream supply section was interrupted, resulting in the contraction of overseas business. In addition, enterprises that traded with Huawei also lost important revenue sources, and the global technology supply chain suffered a serious blow. Due to this harsh environment, Huawei sought a domestic spare tire supply chain. Finally, Huawei’s supply chain was able to achieve self-sufficiency [9]. In January 2020, the outbreak of COVID-19 has led many countries to face the risk of supply chain disruption. The disruption of logistics has different degrees of impact on both supply and demand, upsetting the normal stable and balanced state. This epidemic has exposed the vulnerability and instability of the existing supply chain [10,11]. Therefore, considering the unstable factors in the whole operation process of the supply chain system, such as non-cooperative information mechanisms, improper production plans, decision-making errors, lagging recovery measures, etc., interruption risk has become a popular topic in supply chain management. However, the occurrence of supply chain disruptions is inevitable. Faced with unexpected disruptions, quantifying the risks posed by disruptions and adopting positive mitigation measures when countries experience sudden outages have become major issues.
Based on the above background, it is known that the impact of the external environment and the change in the internal structure can easily result in interruptions to any node in the supply chain. The interruption of this complex scenario can directly affect the normal production and operation of upstream and downstream enterprises, thus causing losses for the whole supply chain. The coordination of the supply chain is disrupted, which is manifested by supply disruption, logistics paralysis, violent demand fluctuations, etc. Furthermore, the entire supply chain is broken, threatening the survival and development of supply chain node enterprises. Therefore, it is important to study the dynamic operation state of supply chains and quantify the loss degree of different node enterprises caused by the interruption of different locations.
The research goal of this paper is to study the evolutionary laws and structural characteristics of supply chain systems under complex interruption scenarios. It provides a decision-making basis for each node enterprise to respond to sudden interruption events, and provides an experimental platform for proposing interruption response strategies. It not only helps node companies to achieve the ability to respond quickly and repair outages, but also helps companies maintain stable and sustainable operational capabilities, which is of great significance for building flexible supply chains.
The research direction of this paper is to use the method of system dynamics to study the stability of supply chain under different node interruption scenarios. The more important point of this paper is to analyze which kind of interruption has the greatest impact on the dynamic of the supply chain according to the size of the simulation data value, so as to help enterprises shift their attention to node enterprises. This is helpful for enterprises to adopt different mitigation strategies.
This paper studies the dynamic analysis and mitigation strategy of the supply chain under different disruption risks. Before the research, we should consider the following aspects.
(1) Location of disruption in supply chain: Which two nodes in the supply chain are interrupted?
(2) Determination of interruption time: Is the interruption time of two nodes fixed or variable, and how long is the interruption time?
(3) Analysis of interrupt results: What is the impact of disruption between two nodes on upstream and downstream enterprises of the supply chain? What is the distance from the source of disruption to supply chain stability?
The remainder of this paper is structured as follows: Section 2 introduces the research review, research methods, and research content. Section 3 introduces the construction process of the model, the source of research data, and the setting of interruption scenarios. Section 4 describes the effect of three disruption scenarios on inventory, order, and profit outcomes. Section 5 mainly discusses the supply chain under different interruption times and proposes a multi-level bilateral cross-chain inventory coordination strategy. Section 6 summarizes the research content, and discusses the limitations and future suggestions.

2. Literature Review

2.1. Dynamic Research and Analysis of Supply Chain Interruption

We searched for system dynamics, supply chain disruption, risk mitigation, supply disruption, production disruption, and sales disruption in the form of topics or titles. The conjunctions of “and” and “or” were used to search in parallel. Among these papers, we searched for supply interruption, production interruption, or sales interruption in the form of subject and title, and selected the last 5 years for a limited time. Thus, we found that there were 2413 and 43 papers, respectively. Supply disruption, production disruption, and sales disruption were searched for in the form of subject and title, and 16 and 0 articles were found, respectively. We searched for supply chain disruption and mitigation strategies by topic and title, and found that there were 253 and 4 articles, respectively. We searched for supply chain disruption and system dynamics by topic and title, and found that there were 284 articles and 3 articles, respectively. Therefore, many papers exist that individually study supply interruption, production interruption, or sales interruption. However, relatively fewer articles have studied these three types of interruptions at the same time, indicting a perspective for future study. Furthermore, it is relatively rare for researchers to study supply chain interruptions by means of system dynamics, and more dynamic methods are thus needed to study supply chain interruption. In addition, a few articles have been published on both supply chain interruption and mitigation strategies, and further exploration is urgently needed.
Due to the limitation of space, we only chose the articles related to the field of this paper for analysis and collation. Xu et al. studied the relevant literature in the field of supply chain disruption, determined its main publications, and helped researchers understand the popular research areas and research directions. This kind of research can reduce the risk to the supply chain and improve the performance of the supply chain [12]. He et al. studied the simulation of supply interruption, the customer’s response to demand and inventory, and proposed dynamic or conditional procurement strategies to alleviate supply interruptions and achieve the best procurement time [13]. Olivares-Aguila introduced a system dynamics architecture to observe the behavior of the supply chain and evaluate the impact of disruptions. The study mainly analyzed the impact of interruption on the service level, cost, profit, and inventory level of the supply chain [14]. Abdullah used system dynamics to simulate supply interruption in a supply chain system composed of suppliers, manufacturers, and retailers, and backlog and inventory were used as key performance indicators [15]. Mokhtar explained in detail that the system dynamics model can simulate the relationship and feedback between parties in the supply chain. The study examined the impact of supply risk indicators on the profits of manufacturers within the scope of the plan [16]. Shao used the method of system dynamic modeling to evaluate the elasticity of the supply chain. Three enhancement measures, namely, demand shock, supply disruption, and price, were taken as the model scenario. The simulation results show that under the risk of short-term supply disruption, the elasticity of the lithium supply chain is improved, but under the risk of long-term supply disruption, the elasticity of the lithium supply chain is poor [17]. Jabbarzadeh studied the supply chain with supply and demand disruption and facility disruption, and the influence of facility strengthening strategy, conservatism of decision makers, demand fluctuation, supply capacity change, and budget constraints were discussed with respect to supply chain design decision [18]. Nasr considered a two-level system in which one supply source provides the same product to two locations. The random occurrence of a source interruption led to the shortage of two receiving locations, and a safety stock of each location to ease the interruption strategy [19]. Hou analyzed a continuous review inventory system with stochastic supply disruption and stochastic lead time. In addition, the influence of supply disruption and stochastic lead time on the average cost of an uncertain order delay was studied [20].
The popular research topics of supply chain risk management and supply chain disruption risk using system dynamics are compared in Table 1.
This article has relevance and similarity to the existing scholars’ perspectives in the study of supply chain disruption. A common element in the research is the examination of the risk of interruption between nodes in the context of the supply chain. In addition, we chose supply chain interruption from the various interruption types, such as those to the supply chain, production, sales, equipment, and demand. By comparison, this article contains a number of differences to current scholars’ research. Most scholars study supply chain disruption from the perspective of supply disruption; thus, research on the supply chain mechanism from the perspective of production disruption or sales interruption needs to be further developed. Three indicators from inventory, order accumulation, and profit have been expanded to analyze the operating status of the supply chain, and thus allow preparation for future disaster reduction strategies. In addition, the study of supply chain disruption based on the dynamic method of system dynamics needs further development.

2.2. Review of Supply Chain Disruption Management

At present, theoretical and practical research in China and globally typically focuses on supply chain disruption, covering areas such as industry and logistics. Studying supply chain stability and evolution under disruptions has mainly focused on the three aspects of identifying outage risk, evaluating disruption crisis, and mitigating interrupts strategies.
In identifying supply chain disruption crises, qualitative methods, such as the Fuzzy Analytic Hierarchy Process, has generally been used to identify disruption risks. Neiger et al. [21] pointed out that interrupt identification was a key step during supply chain disruption risk management. In order to determine the priority of risks, classifying the interruption identification into different categories was essential. Olson [22] believed that the risk of disruption was derived from the external environment and the internal environment. Aydin et al. [23] discussed the impact of extreme weather on supply chain performance. Catastrophic natural disasters such as fire, hurricanes, flooding, storms, earthquakes, and landslides can affect transportation routes and delay the normal operation of supply chain node enterprises. Samvedi et al. [24] utilized a risk index to quantify supply chain outage risk. The Fuzzy Analytic Hierarchy Process (FAHP) and Technique For Order Preference BY Similarity To Ideal Solution (TOPSIS) were applied to capture the subjectivity of the crisis causing interruption and clearly quantify the interruption context. Shareef et al. [25] studied the operational characteristics of supply chain operation in a disaster scenario in Bangladesh, and identified and analyzed the management complexity and disruption risk of using traditional supply chain infrastructure in an emergency disaster scenario. It was suggested to establish emergency supply chain infrastructure for disaster relief in Bangladesh. Through the above analysis, an interruption crisis can be comprehensively manifested as the interruption of information flow, real logistics, and capital flow in the supply chain.
In assessing the risk of supply chain disruption, most scholars have mainly focused on qualitative analysis and mathematical modeling to measure the risk of supply chain interruption. Wu et al. [26] proposed a combination of fuzzy comprehensive evaluation and hesitant fuzzy language item set to evaluate the risk of supply chain disruption. Wang et al. [27] exploited FAHP and Aggregate Risk Index (ARI) for risk assessment. Lockamy et al. [28] used a Bayesian network to model and assess the hazard degree of disaster of 15 American automobile casting suppliers. Ruiz-Torres et al. [29] adopted mathematical programming models to evaluate the possible disruption scenarios and selected appropriate suppliers. Mangla et al. [30] employed FAHP to prioritize the interruption risks in the green supply chain. Six interruption scenarios related to the green supply chain were determined and the prioritization analysis were conducted. Through the above summary and analysis, it was found that there were a few objective and feasible indicators and methods to support the measurement of interruption risk.
In mitigating the supply chain disruption strategy, supply chain management theories, such as safety stock, fuzzy demand, and dual source supply strategy, have often been used to mitigate the disruption risk. Fakhrzad et al. [31] proposed a new fuzzy multi-objective programming method for a multi-product, multi-cycle, and multi-level green closed-loop supply chain network problem, and used an improved imperialist competition algorithm to solve the problem. Aqlan and Ali [32] explored Failure Mode and Effect Analysis (FMEA) to determine the best mitigation strategy for the chemical industry in responding to an outage crisis. Ivanov [33] simulated the dynamic behavior of the supply chain and the impact of interruption on its performance using AnyLogic software. He proposed that safety inventory can effectively inhibit the occurrence of interruption. Li et al. [34] examined the retailer-focused supply chain, studying single and dual source supply strategies to effectively alleviate the degree of supply disruption. Paul and Rahman [35] introduced fuzzy demand and a safety stock plan to address supply interruption. In this paper, an interruption activation recovery model was established to balance the relationship between delayed delivery behavior and sales cost loss caused by interruption. In the research literature of supply chain disruption risk control, relatively fewer studies have been published that involve quantitative research methods and technologies.

2.3. System Dynamics Method

System dynamics (SD) was proposed by Forrester in the early 1960s as a method combining qualitative and quantitative analysis. It is a more mature approach to the study of large systems with multiple feedback sources, nonlinearity, and complexity [36]. SD was applied to the industrial supply chain by Forrester to solve the problem of demand amplification and inventory fluctuation for the first time in 1958 [37]. An inventory management analysis model was built on the basis of SD by Professor Sterman [38], mainly focusing on feedback loops, time delay, nonlinearity, and management behavior performance in beer distribution. Using simulation analysis, Liu et al. [39] proved that the bullwhip effect increases with the length of the supply chain and information sharing can weaken the bullwhip effect. Four main processes in the SD system were determined by Chaerul et al. [40], namely, determining the basic variables to solve the problem, constructing the causal loop diagram of main structural units according to the dynamic hypothesis, transforming the relationship between key variables into a quantitative stock flow model, and verifying the model with historical data. Only in this way can the rationality and effectiveness of the built model be guaranteed. This is also the basic premise of obtaining operation results for rational analysis and solving practical problems.
As a multi loop, high-order, and nonlinear feedback system, the elements in the supply chain affect and restrict each other. In terms of the whole operation process, the supply chain system is a complex and chaotic system, involving procurement, production, storage, distribution, and sales, in addition to capital flow, logistics, and information flow of various businesses [41]. Furthermore, the occurrence of an interruption aggravates the complexity of the supply chain system, which is consistent with the concept of SD. System dynamics can show the effects of different location interruptions in the same basic model, and is thus convenient for comparison of the dynamic effects of supply chain node members due to different location interruptions. Therefore, in this study, SD was selected for simulation and modeling to reflect the complexity of the supply chain subsystem structure and the interaction between nodes.
Based on the above analysis and summary, the relevant methods of research on supply chain disruption are summarized in Table 2.

2.4. Summary of Research Content

To summarize, qualitative methods have been used by most scholars to establish a static model to study the effect of interruptions on the supply chain system. This approach has limitations and a single focus. The system dynamics approach used in the current paper is a combination of qualitative and quantitative local research on the dynamic dissipation relationship between the internal factors of the supply chain system, and can clearly portray the operation mechanism of the supply chain system. In addition, current studies on supply chain stability have mainly focused on the impact on the performance of supply chain from a perspective of supply interruption, logistics interruption, or demand interruption. The research on the stability of the supply chain under different node interruptions still needs further study. Furthermore, research on supply chain disruption management has mainly focused on supply chain risk analysis and control. Additional preventive measures exist for mitigating risks, and the research on supply chain interruption recovery needs to be further developed.
Based on the above, the current study considered three interruption scenarios of supply interruption, manufacturer delivery interruption, and retailer delivery interruption. Profit level, order accumulation rate, and inventory level were selected as indicators to measure the interruption scenario. System dynamics was used to study the stability of the supply chain operation state. The results verify the general view that the closer to the source of disruption, the more serious the loss of the node from three aspects of supplier interruption, manufacturer interruption, and retailer interruption. The study results also objectively showed the changes in the three indicators of interruption for different nodes with specific numerical values. Our simulation results are regular; however, an example is presented to verify the objectivity of this conclusion, and measure the impact of disruption on each node of the supply chain. The more important outcome of this study was to analyze which kind of disruption has the greatest impact on the supply chain according to the size of the data value, so as to help enterprises to tilt the focus of attention of suppliers, manufacturers, and retailers. This can facilitate enterprises to adopt different mitigation strategies. In addition, a corresponding interrupt mitigation strategy based on the type of interruption was established to improve the ability of node enterprises to cope with crises and mitigate the impact of disruptions on the entire supply chain. The present exploration enriches the supply chain disruption system. To highlight the gap between this paper and other literature research, we undertook a comparison in terms of three aspects: interruption type, index evaluation, and research method. See Table 3 for details.

3. Research Design

3.1. Research Hypothesis

  • This study examined the supply chain composed of suppliers, manufacturers, and retailers.
  • The data in this study related to the inventory size and time setting of Zhengtai enterprises at a certain period of time, which do not change during a short interval.
  • The costs of suppliers, manufacturers, and retailers do not change in a short period of time.
  • The demand of all supply chain nodes is determined in a certain period of time.
  • The topological structure of the supply chain is a network.
  • In the supply chain, the upstream enterprise is a leader, and downstream enterprises follow the arrangement of the upstream business.
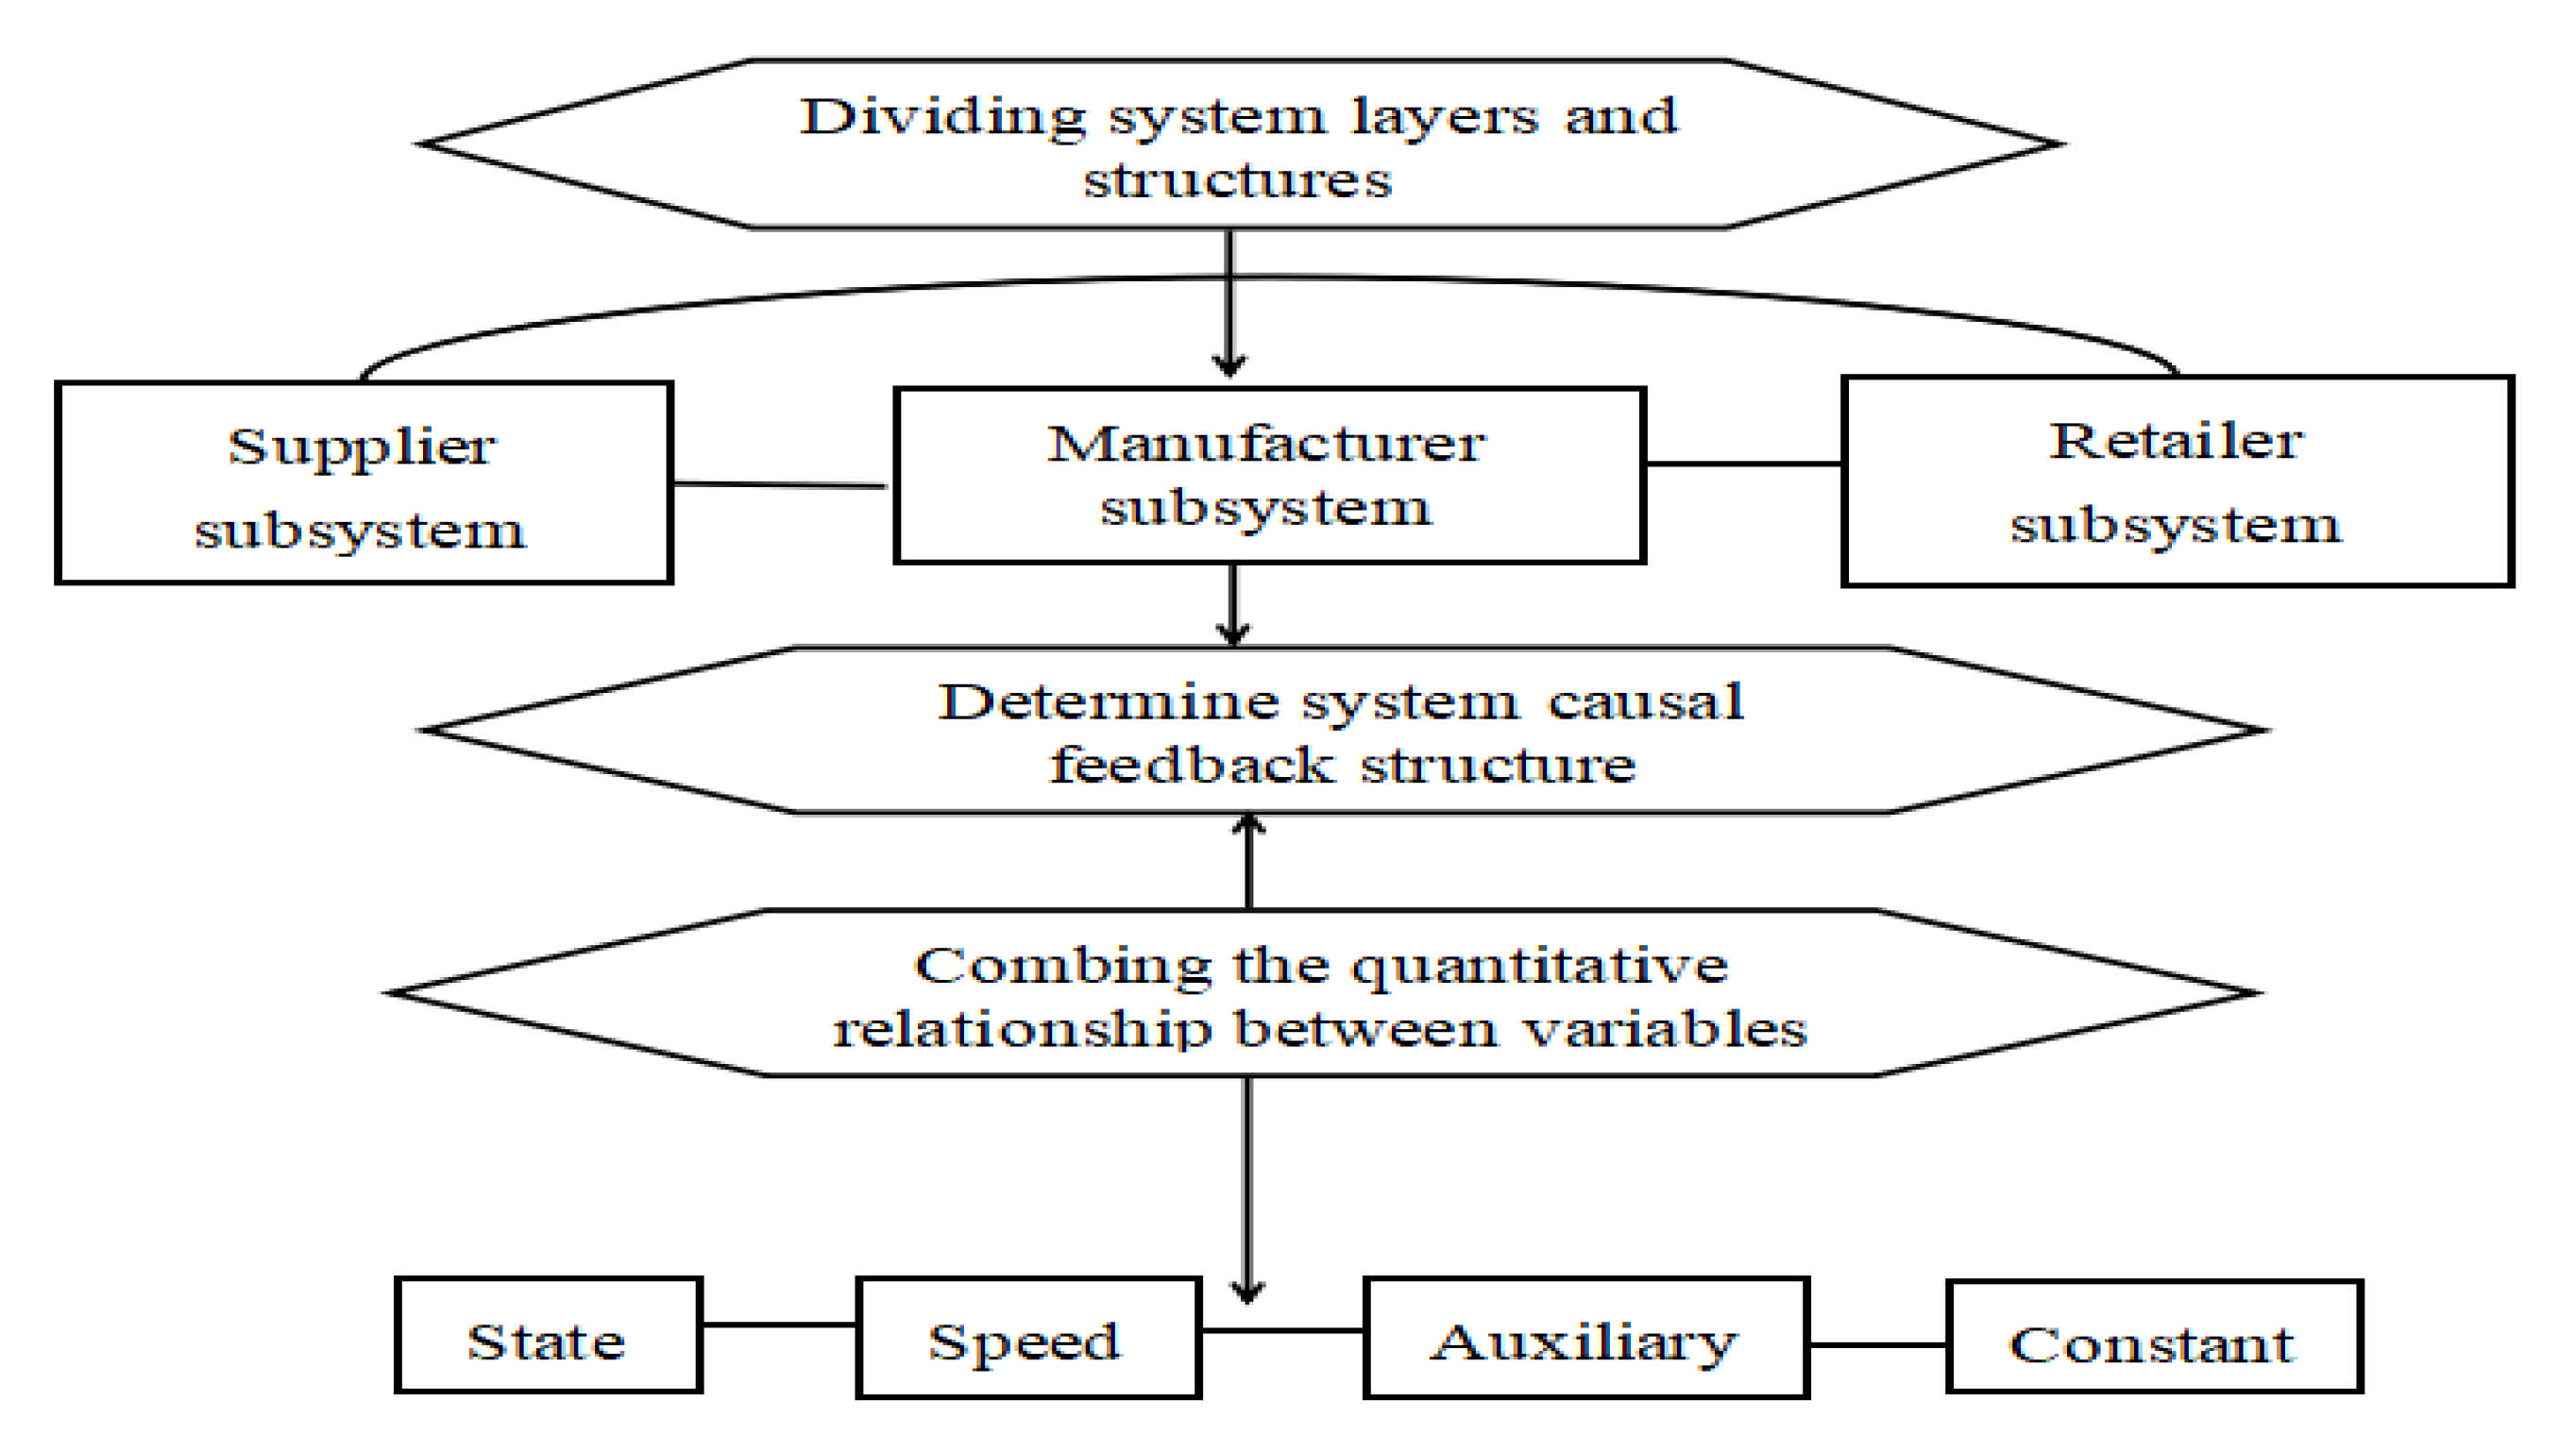
3.2. Model Building

3.2.1. Determination of Model Purpose, System Boundary, and Hypothesis

The complexity of the supply chain system is prone to disruption at any node in the supply chain. It is particularly important to use scientific and reasonable methods to understand the characteristics of supply chain disruption. Therefore, building a supply chain model to simulate the dynamic operating state of the supply chain and to quantitatively analyze the degree of loss caused by the outage to different node companies have become significant.
The supply chain system studied in this paper is a three-level supply chain composed of suppliers, manufacturers, and retailers. Suppliers provide raw materials for manufacturers, manufacturers produce products, and retailers order finished products from manufacturers and sell them to consumers. Supply chain disruption was divided into supply disruption, production disruption, and sales disruption by Tang [44]. In this study, SD was used to simulate the stock fluctuation level, order accumulation, and profit level of node enterprises. The analysis mainly examined the degree of difference between different interruption locations for the supply chain, which lays the foundation for the establishment of a universal common structure and function theory, and provides the theoretical basis for the actual supply chain to address interruption risk.
The system flow chart has a close relationship with modeling and important variables within the boundary, and the boundary is closed. A reasonable closed loop should be analyzed quantitatively on the basis of qualitative analysis, so as to determine the variables of the system. Because of the complexity of time, ability, and environment, assumptions must be made when SD is used to simulate the running state of the supply chain, in order to better ensure the rationality of the research and control the supply chain variables. Therefore, in combination with the actual situation, some assumptions were made for the simulation model, as shown in Table 4.

3.2.2. Construction of Traditional Supply Chain Management Model

The state variables of the multi-level supply chain system are composed of supplier stock, manufacturer stock, and retailer stock. From an integration perspective, the supply chain system is formed by the linkage and association of the supplier, manufacturer, and retailer subsystems. The demand of the consumer is received by the retailer. The manufacturer arranges the demand forecasting plan according to the order plan of the retailer. The supplier arranges the demand forecasting plan of the raw materials in light of manufacturer’s demand. Therefore, the upstream level of the information is transferred to the upstream node. Enterprise demand is forecast in line with the ordering needs of downstream enterprises [45]. Figure 1 reflects the operational flow of the three-tier supply chain in the traditional mode.

3.2.3. Causal Loop Diagram of Supply Chain Subsystem

Founded in 1984, Zhengtai Group has annual sales of 60 billion yuan and nearly 30,000 employees globally. The industry ranges from hardware to automation control, involving new energy, instrumentation, construction, automotive technology, and other fields. Zhengtai has produced more than 2000 patents at home and abroad, and has repeatedly led and participated in the formulation of industry standards. As the leading enterprise of the Liushi low-voltage electrical appliance industry, Zhengtai Group plays the role of industry standard to promote the common development of upstream and downstream enterprises, thus forming a “win–win” relationship. The supply chain system studied in this paper is a three-level supply chain composed of suppliers, manufacturers, and retailers of Zhengtai. Suppliers provide raw materials for manufacturers, manufacturers produce products, and retailers order finished products from manufacturers and sell them to consumers. As a multi loop, high-order, and nonlinear feedback system, the elements in the supply chain affect and restrict each other.
Within the Liushi industrial cluster, each single-chain supply chain is an industrial cluster formed by leading manufacturing companies. In the complex interruption situation, the node members send orders to the alternative cooperative enterprises for replenishment. Poor coordination causes the periodic delay of replenishment, and emergency goods cannot be supplied to the shortage enterprises in time, resulting in serious shortage losses. In addition, due to order delays and delivery delays, actual downstream needs cannot be effectively met in a timely manner. Therefore, we studied the impact value of the company’s different node interruptions on the actual data in all aspects of the supply chain, so as to provide the company with specific inventory transfer quantities and enable it to take corresponding mitigation strategies.
A causal loop diagram is used for conceptual modeling to show conceptual feedback structures, so as to better study the dynamic evolution behavior of supply chain [46]. In October 2019, we visited Zhengtai Group to investigate its internal supply chain. The internal supply chain is the operating mode of the Zhengtai Group that we discovered after investigation. The main reason is that the company obtains raw materials from suppliers, the manufacturing plant produces products based on raw materials, and the sales department distributes the company’s products to distributors or customers online or offline. This is similar to an ordinary supply chain system. The model is a general three-level supply chain model of general suppliers, manufacturers, and retailers in the traditional sense, and can thus be used as a reference by other enterprises. This model is not completely repeated, and each enterprise can modify it into a model suitable for itself according to the actual situation. After communicating and negotiating with the internal personnel, the components of inventory, order accumulation, and profit of the three subsystems, and the causal relationship among the variables, were obtained. The feedback mechanism of the supply chain system was recognized by the company. This is a real model. The model studied in this article is a general three-level supply chain of suppliers, manufacturers, and retailers; however, each of the subsystems is composed of different elements, and the relationship between the internal elements is interrelated and more complicated, including order rate, raw material delivery rate, in-transit inventory, receiving rate, inventory volume, inventory cost, and profit. In addition, our research focused on the quantitative measurement of inventory, orders, and profits of each node in the supply chain by node interruption, so that companies can take effective mitigation strategies in the future based on the inventory backlog, inventory shortage, and order accumulation of supply chain nodes.
  • Causal loop diagram of the supplier subsystem
The supplier subsystem consists of three parts: supplier order loop, inventory loop, and profit loop, as shown in Figure 2. Among these, supplier inventory, supplier order accumulation, and supplier profit are state variables, and are also important indicators to measure the operation level of the supply chain subsystem. Although the order loop, inventory loop, and profit loop appear to be three independent parts, they are interrelated and affect each other.
The supplier subsystem consists of three parts: supplier order loop, inventory loop, and profit loop. The causal feedback loop of the “supplier inventory module” is: supplier’s order rate–raw material delivery rate–Supplier’s in transit inventory–Supplier’s receiving rate–supplier’s inventory–supplier’s inventory reconciliation rate–supplier’s order rate. If the supplier has more inventory reserves, the inventory adjustment rate is smaller, and the order quantity is determined according to the existing inventory level, inventory adjustment rate, and demand forecast.
The feedback loop of the “supplier order accumulation module” is: manufacturer’s inventory adjustment rate and retailer’s demand forecast manufacturer’s order rate–supplier’s order receiving rate–supplier’s order completion rate–total order completion rate. The supplier’s order accumulation rate is the difference between the order quantity received and the order quantity completed.
The feedback loop of the “supplier profit accumulation module” is: supplier’s cost increase rate–supplier’s cost–supplier’s profit–supplier’s revenue growth rate–supplier’s revenue. The supplier’s cost consists of four parts: storage cost, shortage penalty cost, purchase cost, and transportation cost. The actual expenses are included in the model as much as possible. Supplier’s profit is formed by the difference between supplier’s revenue and cost. It is reasonable and measurable to evaluate the supply chain performance.
2.
Causal loop diagram of the manufacturer subsystem
The manufacturer subsystem also includes the three modules of supplier order loop, inventory loop, and profit loop, as shown in Figure 3. Similarly, these three modules are taken as an important indicator to measure the performance of the supply chain in the process of establishing the system simulation model. The causal loop diagram of the manufacturer subsystem is analyzed as follows:
The “manufacturer subsystem inventory module” causal loop is: supplier delivery rate–manufacturer’s inventory in transit–manufacturer’s receipt rate–manufacturer’s inventory–manufacturer’s inventory adjustment rate. A large number of supplier shipments means that the manufacturer’s receipt rate will increase accordingly, and the manufacturer’s inventory will also increase.
The causal loop of “order accumulation” in the manufacturer subsystem is: retailer demand forecast and retailer inventory adjustment rate–retailer’s order quantity–manufacturer’s order receiving rate–manufacturer’s order accumulation–manufacturer’s order completion rate–total order completion rate. The manufacturer’s order quantity is affected by the retailer’s order quantity. When the retailer’s order quantity is greater than the sum of the manufacturer’s own inventory and the inventory adjustment rate, the order accumulation is in an increasing state. On the contrary, the manufacturer’s order cumulative rate is zero. The greater the difference between the retailer’s order rate and the manufacturer’s delivery rate, the higher the order accumulation rate.
The manufacturer’s profit is the cumulative difference between the manufacturer’s revenue and cost. From the above causal structure, the causal loop is: manufacturer’s storage cost and purchase cost and stock-out penalty cost and transportation cost–manufacturer’s cost increase rate–manufacturer’s cost–manufacturer’s profit–manufacturer’s revenue increase rate–manufacturer’s revenue.
3.
Causal loop diagram of retailer subsystem
The retailer subsystem consists of three parts: supplier order loop, inventory loop, and profit loop, as shown in Figure 4. Among these, retailer inventory, retailer order accumulation, and retailer profit are state variables, and are also important indicators to measure the operation level of the supply chain subsystem. The order loop, inventory loop, and profit loop appear to be three independent parts, but are interrelated and affect each other.
The “retailer inventory loop” is the manufacturer’s shipping rate–retailer’s inventory in transit- retailer’s receipt rate–retailer’s inventory–retailer’s inventory adjustment rate. More manufacturers’ shipments means that the retailer’s order rate is corresponding reduced, that is, it is a negative feedback loop structure.
The causal loop of “retailer order accumulation” is: consumer’s order quantity–consumer’s demand forecast–retailer’s order receiving rate–retailer’s order accumulation–retailer’s order completion rate–total order completion rate. Retailer’s order accumulation is the difference between order receiving rate and the order completion rate.
The “retailer’s profit” causal loop is: retailer’s storage cost and purchase cost and stock-out penalty cost and transportation cost–retailer’s cost increase rate–retailer’s cost–retailer’s profit–retailer’s income increase rate–retailer’s revenue. Retailer’s profit is the cumulative difference between the retailer’s revenue and cost. The retailer’s cost consists of storage, stock-out penalty, purchase, and transportation costs.

3.2.4. Feedback Structure Analysis and Variable Setting of Supply Chain System

The subsystems of suppliers, manufacturers, and retailers are combined to form a complex supply chain system. The dynamic SD simulation model of traditional supply chain system was drawn using Vensim software, as shown in Figure 5, which clearly describes the dynamic evolution behavior of the supply chain and simulates the operation mechanism of the supply chain system. Vensim software was developed in the United States and is used to establish relevant models, including causal loops, and stock and flow charts, in a simple way. Provided all variable markers are connected with graphical arrow marks, and relationships between variables are written into the model in an appropriate way, the causal relationship between variables can be displayed [47]. The supply chain we studied is consistent with the software, which is able show its influence dynamically. Therefore, we chose it to simulate the impact of disruption on the supply chain.

3.3. Data Sources

The initial values of all constants and state variables were assigned by combining the literature parameter values of supply chain management with a large number of readings of system dynamics. Chen [48] proposed that the uncertainty and distortion of information from downstream to upstream enterprises were constantly increasing due to the existence of the bullwhip effect in traditional supply chains. In October 2019, we investigated Zhengtai enterprises. Through communication with senior management and inventory management personnel, we inquired about the initial inventory size, delivery delay, inventory adjustment time, and other reference data of suppliers, manufacturers, and retailers. The simulation, which was conducted with the consent and approval of the Zhengtai company, showed high accuracy and reliability. Combined with the actual operation state, the setting of node enterprise constants presents a decreasing state from upstream to downstream nodes. Consequently, the specific simulation parameters are shown in Table 5. The inventory adjustment time of retailer, manufacturer, and supplier was set to 1 week, 2 weeks, and 3 weeks, respectively [49,50,51]. Supplier initial inventory, manufacturer initial inventory, and retailer initial inventory were 200, 150, and 100. Retailer, manufacturer, and supplier’s order accumulation and profit initial value were 0. Node enterprise’s inventory coverage time was set to 3, 2, and 1.5 weeks. Affected by in-transit inventory, suppliers, manufacturers, and retailers had a delivery delay of 1.5, 1.5, and 0.5 weeks. The running time of the entire supply chain system was set to 60 weeks and the step size was 1 week.

3.4. SD Model Construction Process of Traditional Supply Chain

The structure of the supply chain system has integrity and a hierarchy, which is the theoretical basis for using decomposition and the synthesis principle to study and analyze system behavior [52]. The decomposition principle of system dynamics is applied to divide the supply chain system into interrelated subsystems. The system information of the supply chain is processed, and the causality and feedback mechanism among the variables in the system are studied. Dividing the system level and submodules, determining the feedback loop and causal relationship of the subsystem, and determining the quantitative relationship of each variable and the dynamo equation, comprise specific steps [53]. See Figure 6 for details.
The traditional supply chain model and three kinds of supply chain models of interruption scenarios were built using the SD method according to the above steps. The most critical step was to establish the cause-and-effect relationship between systems, that is, to determine the variable relationship of the supply chain system. After the model was established, the simulation parameters were input to simulate the operation status of the supply chain under different interruption scenarios. Finally, the results were displayed in the form of inventory, profit, and order accumulation.

3.5. Scenario Setting

Supply chain disruptions can occur anywhere in the supply chain system. To more objectively, effectively, and comprehensively quantify a supply chain disruption crisis, three scenarios of supply disruption, production interruption, and sales interruption were selected for simulation analysis. Among these, the emergency event of supply interruption may originate from a natural disaster at the supplier’s location, the supplier’s bankruptcy, or a fire in the factory, which may result in the failure of the timely supply of raw materials [54]; production interruption may be caused by a decision-making error, technical defects, equipment failure, illegal operations, and other factors [55]; sale disruptions may be caused by external instability factors, such as vehicle or transportation facility failures, product quality issues, and fluctuations in consumer demand, which could result in retailers failing to supply products or services to consumers in a timely manner [56]. The specific interruption position is shown in Figure 7.
A time frame was adopted by researchers of interruption risk to describe the time distribution characteristics of disruption events. The duration of the interruption crisis was generally set to 2, 5, and 8 weeks [48,57,58]. To facilitate the quantitative analysis of the damage caused by the interruption of different locations to the supply chain node enterprises, this study selected the interrupt duration of 10 weeks, namely, the interruption from 18 weeks to 27 weeks.
  • Scenario 1: when the supply interruption occurs, the delivery rate from the supplier to the manufacturer is 0 for the entire period of weeks 18–27.
  • Scenario 2: when the production is interrupted, the manufacturer’s delivery rate to the retailer is 0 for the entire period of weeks 18–27.
  • Scenario 3: when the sales interruption occurs, the retailer’s delivery rate is 0 for the entire period of weeks 18–27, and the demand has a fault.
  • Scenario 4: during the whole cycle, the interruption does not occur. This situation is taken as a basic scenario. The purpose of our simulation was to compare it with the other three scenarios, highlight the change trend of inventory, order accumulation, and profit level under the disruption scenario, and further explain the loss of the supply chain caused by interruption.

4. Result

To better quantify the impact of the outage crisis, the first step is to select a reasonable index of system operation status. Referring to the literature about supply chain system behavior in China and abroad, most scholars discussed three indicators of node enterprises: inventory, operating profit, and operating cost [59,60]. In 1996, the company of PRTM conducted a survey on integrated supply chain management, and proposed eleven indicators of supply chain performance evaluation in supply chain operations references (SCOR), including order completion rate [61]. Combined with the index system and the inventory and profit indicators proposed by other scholars, this paper proposes three index systems to evaluate the performance of the supply chain that can better show the operation results of the supply chain and have certain rationality. These indicators are not limited to quantify a node enterprise, but can objectively and reasonably reflect the overall performance level and operation status of the supply chain.
This study examined the changes in inventory level, order level, and profit level of suppliers, manufacturers, and retailers under different interruptions, so that the company can measure the risk degree of each node of the enterprise when the interruption occurs. We verified the general view that the closer to the source of disruption, the more serious the loss of the node in terms of the three aspects of supplier interruption, manufacturer interruption, and retailer interruption. We also objectively showed the changes in the three indicators due to interruption of different nodes with specific numerical values. Our simulation results are consistent with those of previous research, but we used an example to verify the objectivity of this conclusion and measure the impact of disruption on each node of the supply chain. The key outcome of this study was the determination of the kind of disruption with the greatest impact on the supply chain according to the size of the data value, so as to help enterprises to tilt the focus of attention of suppliers, manufacturers, and retailers. This can assist enterprises to adopt different mitigation strategies.

4.1. The Changes of Supply Chain Inventory Level

All aspects of procurement, production, distribution, and sales in the supply chain are closely related to inventory activities. Through the investigation of the company, it was found that the periodic inventory control strategy is adopted. That is, the inventory is replenished until the target inventory level is reached. The inventory level not only influences the cost and benefit of the node enterprise, but also restricts the flexibility of the entire supply chain. A positive inventory level indicates that the enterprise has a certain amount of inventory and does not need replenishment in a short period of time. If this value is too large, there will be a backlog of inventory, which needs to be transferred to a certain amount of inventory. A negative value of inventory shows that the enterprise has a serious shortage and needs to replenish the inventory immediately. Changes in inventory can directly affect changes in the supply chain’s benefits and costs, and it is the result of a combination of feedback effects. The results of the supplier inventory, manufacturer inventory, retailer inventory, and total inventory were analyzed by simulating different interruption scenarios. The results are shown in Figure 8.
The supplier’s supply of raw materials to the manufacturer is interrupted at the time of 18–27 weeks when the interruption of scenario 1 occurs. As can be seen from Figure 8, the occurrence of scenario 1 has an impact on suppliers, manufacturers, and retailers. The supplier is unable to provide raw materials to the manufacturer, as shown in Figure 8a, the blue line changes trend, and there is a serious inventory backlog from the 18th week. Suppliers, as the direct bearers of the supply interruption, bear the main risk of supply interruption. The blue line in Figure 8b,c shows a downward trend at 20 and 22 weeks, indicating that both manufacturers and retailers are seriously under-stocked, respectively. In particular, the manufacturer’s inventory shows a significant downward trend, with a maximum of 445 items out of stock at week 26. It can be seen that the impact of supply disruption on node enterprises has a delayed effect on the transmission from upstream to downstream. After the end of the supply interruption, i.e., from the 28th week, the inventory level of suppliers may decline. With the entry of purchased goods, the inventory will rise and reach a stable state. The inventory level of manufacturers and retailers will be gradually replenished in the 30th week, showing an upward trend.
When interruption 2 occurs, the manufacturer’s inventory increases from the 18th to the 27th week, as shown in the red line of Figure 8b. In this stage, the production interruption makes the retailer temporarily supplement their supply by acquiring from spare manufacturers. However, the retailer experiences a serious shortage because the goods are not delivered in time, as shown in the red line of Figure 8c, and the inventory level presents a continuous downward trend in this period. The manufacturer’s order quantity is decreased due to the production interruption. At this time, the supplier no longer orders to replenish the inventory, but replenishes the inventory when the inventory reaches the extreme point. Hence, the inventory level presents a trend of first decreasing and then rising, as shown in the red line change in Figure 8a. After the end of the production interruption, i.e., from the 28th week, the manufacturer’s inventory level may undergo a rapid decline. At the same time, retailers can get inventory quickly, and the curve rises. However, due to the delay of transmission time to the supplier, the inventory level of suppliers in the 30th week decreases slowly, and gradually reaches a stable trend.
When interruption 3 occurs, retailers cannot provide goods to consumers. Since the interruption in the 20th week, the retailer’s inventory rises. Retailers no longer place orders with manufacturers. The maximum inventory is 382 pieces, and the inventory remains unchanged before the interruption, as shown in the green line in Figure 8c. In addition, the sales disruption keeps retailers from placing orders with manufacturers, and manufacturers’ inventories continue to rise in the short term. Moreover, the manufacturers no longer produce as a result of the sales interruption of the retailer, so the inventory remains unchanged as shown by the green line of Figure 8b. Due to the low sensitivity, the supplier may continue to deliver goods to the next node for a short period of time, resulting in a decrease in the supplier’s inventory. Then, as shown by the green line of Figure 8a, the inventory remains unchanged because the supplier cannot receive the manufacturer’s order. When the sales interruption ends, that is, from the 28th week, the inventory of retailers is no longer overstocked and declines rapidly. The inventory of manufacturers and retailers decreases briefly in the 29th and 30th week, and then begins to replenish, before gradually stabilizing.

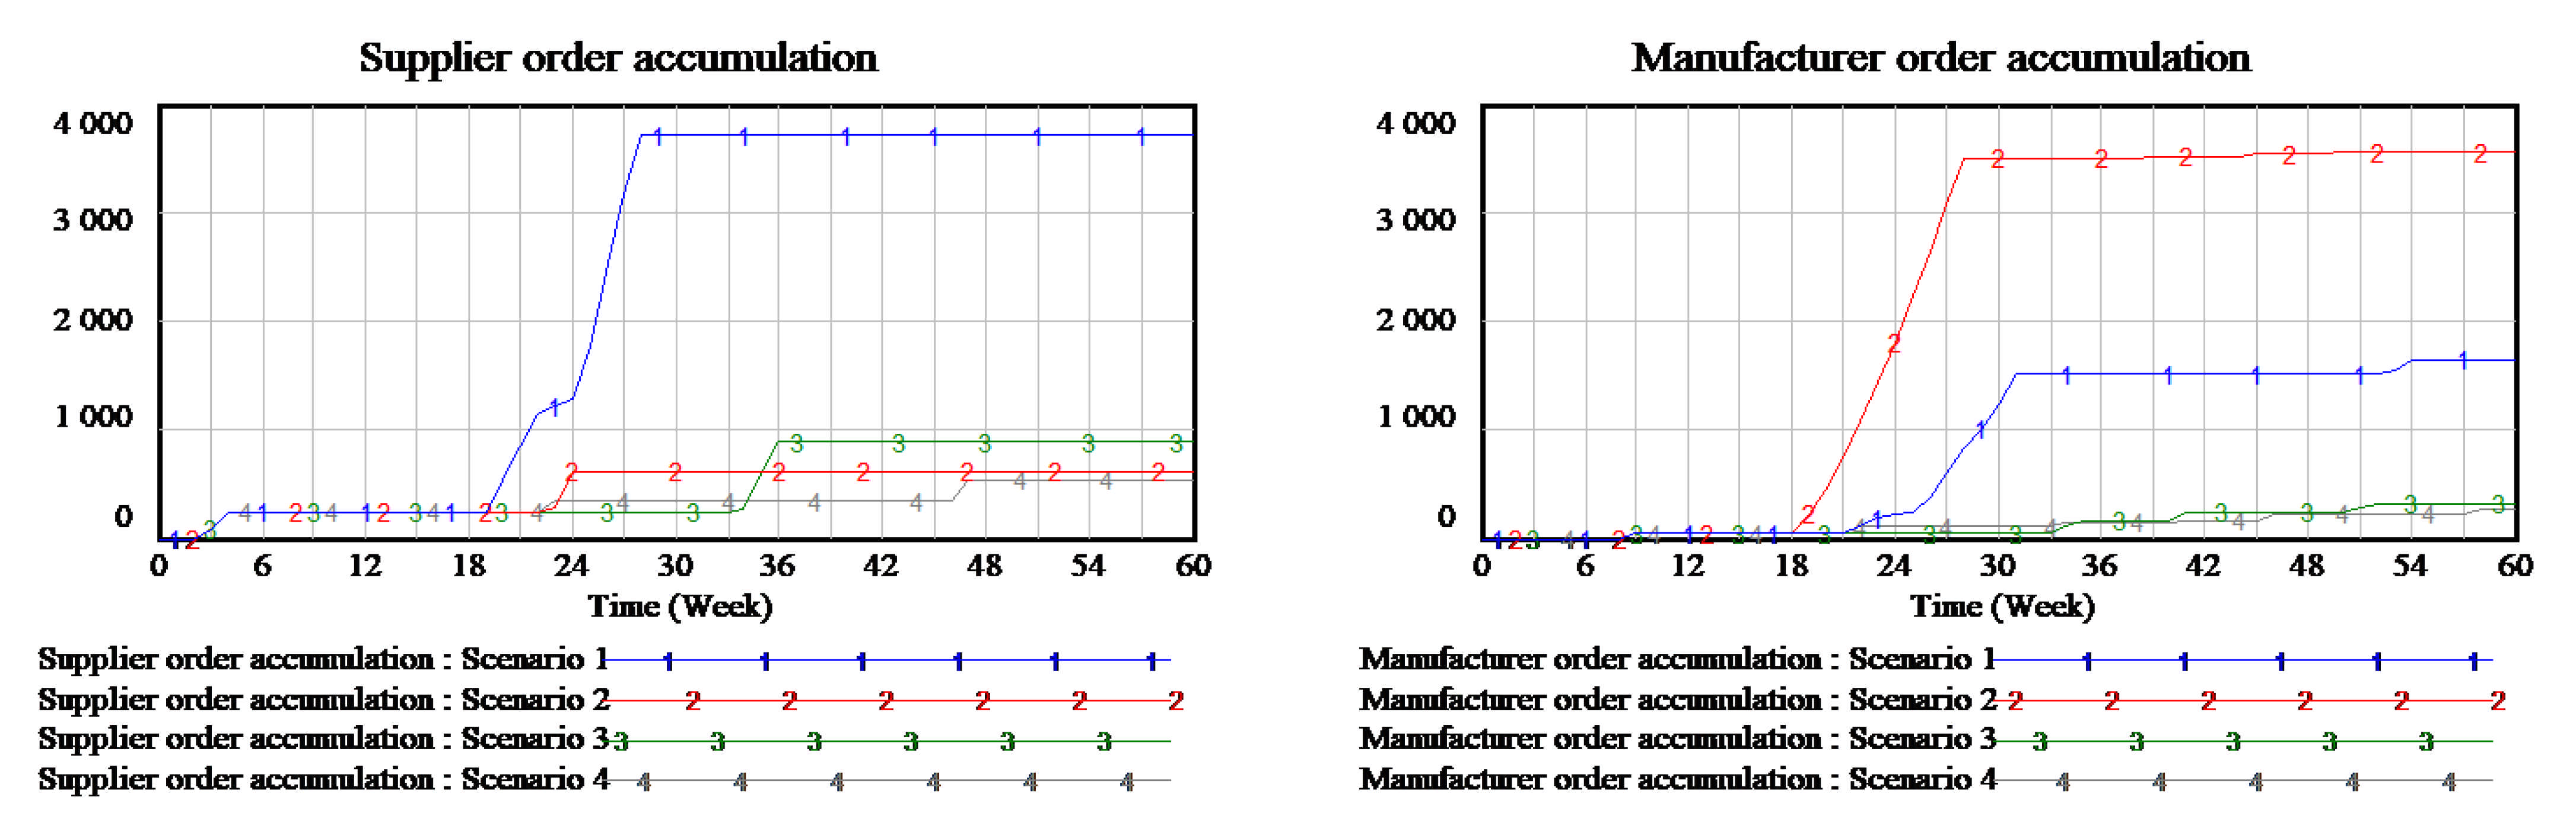
4.2. The Changes of Cumulative Order Rate of Supply Chain

The order accumulation rate is expressed as the ratio of order completion degree, and the order accumulation value is the difference between the accepted order quantity and the actual completed order quantity. The lower the order accumulation rate, the higher the order fulfillment rate, service response ability, and on-time delivery rate of the enterprise. On the contrary, a high order accumulation rate indicates poor inventory replenishment ability and production adjustment ability of the enterprise. If the waiting time of customers is too long, it leads to the loss of customers and the decline of market competitiveness. Order accumulation is not only a key indicator to measure the supply and response ability of node enterprises, it is also an important indicator to measure the operation efficiency of the supply chain.
As shown in the blue line change trend in Figure 9, supplier order accumulation has a significant increase from 20 weeks in the occurrence of scenario 1. However, the order backlog growth of manufacturers occurs in the 22nd week and the cumulative order growth of retailers starts from the 26th week, due to the delayed effect of information flow and logistics, which indicates that the supply interruption causes node enterprises to fail to meet the order demand of downstream enterprises. In addition, this trend can verify the gradual proliferation of supply disruptions from the outage node to the downstream supply network, which explains why manufacturers and retailer orders have accumulated late peaks. After the interruption, due to the delay effect, the order accumulation of suppliers, manufacturers, and retailers begins to show a stable state in the 28th, 31st, and 33rd weeks, respectively, and there is no significant increase in the trend.
The occurrence of interruption 2 causes the cumulative order rate of suppliers, manufacturers, and retailers to change. For manufacturers, in particular, the increase rate of orders of manufacturers is greater than that of retailers and suppliers compared with before the production interruption. As shown in the red line trend in Figure 9, the cumulative order rate of suppliers ascends from the 24th week, the cumulative order rate of manufacturers increases sharply from the 18th week, and the cumulative order rate of retailers rises sharply in the 20th week. The time for the significant increase in the order rate of suppliers and retailers is later than that of manufacturers, which means that there is a delay effect in the gradual diffusion of production interruption from the interruption source to other network nodes. After the interruption, the manufacturers began to accumulate orders in the 28th week, retailers in the 30th week, and suppliers in the 24th week.
The occurrence of interruption 3 has a significantly higher impact on retailers than manufacturers and suppliers. The cumulative order rate of retailers increases from the 18th week, with a peak of 1116 pieces. The manufacturer’s order cumulative rate increases from the 33rd week and the peak value is 321 pieces. The supplier’s order accumulation rate increases from the 34th week and the accumulated order peak value is 883 pieces. The retailer is unable to supply the goods to the consumers in time since the 18th week, and thus the order cumulative rate of retailer increases until the end of the 27th week. Then, the order accumulation rate remains at an extremely high level until the end of the interruption simulation. This indicates that the product is no longer purchased after the consumer satisfaction declines. Manufacturers and suppliers are also affected throughout the whole process, with suppliers and manufacturers receiving lower orders and lower revenues. After the end of the interruption, retailers begin to accumulate orders in the 28th week. Due to the delay effect, manufacturers begin to reach a stable trend in the 33rd week, and suppliers are in a stable state since the 36th week.

4.3. The Changes of Supply Chain Profit Level

The goal of the supply chain is to maximize the value of the whole chain. The profit of the supply chain should be the difference between the income and the cost. The net income of the supply chain should be measured by the income of the whole chain, not the profit of the members of a certain node. However, there are too many behavioral decisions that excessively pursue the profit of a single node enterprise and ignore the overall income in the actual operation process. To evaluate the loss of the traditional supply chain caused by interruption more intuitively, the profit index was selected to measure the degree of damage due to different interruptions to supply chain members.
Supply disruption makes the overall profit level of the supply chain decline. Among the nodes, the reduction of the net income level of suppliers is the largest, followed by that of manufacturers and retailers. As shown in the blue line of Figure 10a, the supplier’s profit maintains a downward trend throughout the 18–27 week period. The supplier’s profit is lower than that of the manufacturer and the retailer as shown in the blue line of Figure 10, indicating that the supplier is the first to be affected by the risk of supply interruption. As time passes, the effect gradually spreads to the manufacturer and the retailer. These results indicate that the supply interruption has a time lag for the manufacturer and the retailer. After the end of the supply interruption, as the inventory is no longer accumulated, a large amount of storage costs can be saved, and profit also reaches an upward trend from the 28th week. Manufacturers can produce goods with the supplement of raw materials, and their profits begin to increase and stabilize in the 30th week, whereas retailers have less influence and tend to be stable after the 30th week.
The disruption of production causes a significant drop in the profits of suppliers, manufacturers, and retailers. As shown in the red line part of the Figure 10, the manufacturer’s profit declines the most. The inventory overstock caused by transportation or production interruption increases the storage cost; furthermore, the manufacturer is unable to meet the retailer’s order demand, which results in a large penalty cost. It can be seen that the manufacturer’s response is not flexible enough in the traditional supply chain, and the low-quality service level and large quantities of unsatisfied orders reduce the satisfaction of retailers and consumers. At the end of the interruption, the manufacturer can continue to deliver goods to the retailer, and the manufacturer increases slowly from the 28th week. However, the retailer’s customers decrease, and the profits of both manufacturers and retailers show a downward trend for an extended period after the end of the interruption. Suppliers can provide raw materials for manufacturers and make more profits. As a result, the suppliers’ profit curve rises from 36 weeks.
The disruption of sales results in significant damage to retailers. As shown by the green line, the sales profit shows a downward trend. Consumers turn to reserve retailers to buy products due to the sales interruption, which results in a serious penalty cost due to a lack of stock; furthermore, the sales interruption results in a large amount of order accumulation to the supply chain node enterprises, which directly leads to the increase in storage cost. These two factors clearly reduce the retailer’s profit. In the interruption stage, the profits of suppliers and manufacturers are basically unchanged, which shows that retailers are the first to suffer from the risk of sales interruption, and the effect gradually spreads to manufacturers and retailers over time. A sale interruption has a time lag for manufacturers and suppliers. At the end of the sales interruption, retailers provide goods to customers. However, due to the loss of customers, their profits show a downward trend from 28 weeks. Manufacturers can continue to provide goods, and their profits fluctuate slightly. The suppliers’ profit curve shows an upward trend because of their long distance.
In the face of complex epidemic prevention and control, China’s supply chain enterprises are facing great challenges and opportunities. On the one hand, the outbreak of the new COVID-19 epidemic has greatly reduced the demand of the sales end points of the supply chain, and consumers have almost stopped all consumption except the necessities of life; on the other hand, factories are facing the risk of shutdown due to the spread of the epidemic and the interruption of logistics, which has greatly reduced the output. In this context, it is of great significance to study the dynamic impact of complex supply chain disruption scenario for actively expanding domestic demand, stabilizing external demand, breaking through the blocking points and connecting breakpoints, and building a new development pattern of domestic and international double cycle. The more important goal of this study was the analysis of the impact of interrupt source on upstream and downstream node enterprises through actual numerical simulation operation. Furthermore, the simulation results verified that the closer the interruption source is, the more serious the harm to the node enterprises is, and the longer the interruption duration is, the more serious the damage to the supply chain system is. In addition, three interrupt types are displayed on the same plane. According to the impact of different types of interruption on supply chain members, the operation results show that the disruption at the upstream node of the supply chain is much more destructive to the operation of the supply chain than the disruption at the downstream node, which helps enterprises shift the management focus to the upstream node. Finally, when the interruption crisis occurs, a cross chain multi-source two-way coordination model is built based on the traditional single chain mode. According to the three different types of supply disruption, production disruption and sales disruption, this paper puts forward corresponding mitigation strategies, which can significantly improve the overall revenue of the supply chain system, and provide a more sound theoretical basis for the cross chain multi-source coordination strategy in dealing with the supply chain disruption crisis.
In the context of the new COVID-19 pandemic, no matter what interruption scenario occurs, it will not only affect the single node enterprise in the supply chain. Once the interruption crisis occurs, the interests of the whole supply chain are often damaged. The fundamental reason is that the relationship between peer enterprises is competitive, and the decision-making is disordered, non-cooperative and blind. Managers should realize that any decision-making that only considers their own interests cannot reduce the losses caused by the interruption crisis. Mature, efficient and flexible supply chain design and operation should fully realize the “ripple effect.” The main body to deal with the interruption crisis should be the members of the whole supply chain, not the node enterprises directly affected. In addition, the enterprise’s supply chain layout and operation strategy should be adjusted accordingly, and the important suppliers should be arranged nearby as far as possible to reduce the transportation cost and replenishment time. Enterprises widely consider the supply chain flexibility strategy, in which the diversification of supplier base can be used to hedge the risk of supply disruption or trade policy changes, but maintaining a high level of inventory will also bring additional costs. At the same time, enterprises should not consider cost as the only factor in the design of supply chain, but also formulate some necessary risk mitigation strategies.

5. Discussion

5.1. Analysis of the Impact of Different Interruption Times on the Operating Status of the Supply Chain

Our research focused on the impact of three outage scenarios on the operation status of node enterprises and supply chain in the same outage period. It helps us better understand the movement trend of risk sources when different interruptions occur, that is, the closer the node enterprises are to the interruption sources, the stronger the harm will be. Furthermore, due to the conduction effect of the supply chain system, impacts spread to other node enterprises. To better analyze the operation status of the supply chain in the interruption scenarios and better control the risk of interruption, we discuss the different interruption times, that is, the supply chain operation status of 5 weeks [56], 8 weeks [57], and 10 weeks. The specific scenario settings are shown below.
Supply interruption: supply disruption occurs in the entire supply chain for 5 weeks (18–22), 8 weeks (18–25), and 10 weeks (18–27). At this time, the supplier’s shipment rate to the manufacturer is 0.
Production interruption: production interruption occurs in the entire supply chain for 5 weeks (18–22), 8 weeks (18–25), and 10 weeks (18–27). At this time, the manufacturer’s shipment rate to the retailer is 0.
Sales interruption: in the whole supply chain, the sales interruption occurs for 5 weeks (18–22), 8 weeks (18–25), 10 weeks (18–27). At this time, the retailer’s delivery rate to the consumer is 0, and the demand appears a fault.
In this study, Vensim PLE software was used to simulate the dynamic model of the system, and the change trends of order accumulation rate, inventory level, and profit level of the supply chain in different interruption periods are shown in Figure 11.
By simulating supply interruption, production interruption, and sales interruption for 5, 8, and 10 weeks, respectively, the operation status of the supply chain was obtained. The results show that the interruption of any node in the supply chain will increase the order accumulation rate of the supply chain. As shown in Figure 11a,d,g, the order accumulation when the interruption time is 10 weeks is much greater than that when the interruption time is 8 weeks, and the order accumulation when the interruption time is 8 weeks is greater than that when the interruption time is 5 weeks. This indicates that the longer the interruption time, the greater the cumulative rate of orders in the supply chain, and the less it can meet customer demand. In addition, the interruption of any node in the supply chain results in a significant amount of overstocking in the supply chain. As shown in Figure 11b,e,h, when the node enterprise is interrupted at 18 weeks, goods cannot be transported to the next node, and a large amount of inventory backlog will be generated. The inventory level shown by the blue line is relatively higher than that of the red and green lines, indicating that the longer the interruption time, the larger the inventory backlog of the supply chain. After the interruption, the node enterprise delivers goods normally, and then the supply chain inventory drops. As shown in Figure 11b,e,h, the blue line at the 28th week, the red line at the 27th week, and the green line at the 24th week show a significant downward trend in inventory. When the supply chain node enterprise reduces to a certain amount of inventory, the node enterprise supplements a certain amount of goods to meet its inventory, and the inventory shows an upward trend; similar repeated phenomena appear in the subsequent cycle. The interruption of any node in the supply chain will reduce its supply chain profits. For different periods of supply interruption, production interruption, and sales interruption, the overall profit of the supply chain also shows different trends. As shown in Figure 11c,f,i, when the interruption time is 10 weeks, the supply chain profit is much lower than the interruption time of 5 and 8 weeks, that is, the blue line is lower than the red line, and the red line is lower than the green line. This shows that the longer the interruption time, the lower the profit level of the supply chain. The interruption of any node in the supply chain will cause a significant profit loss. We should pay attention to the significant impact of an interruption on the supply chain, and mitigation strategies should be implemented to alleviate it.
This study examined the effects of supply disruption, production disruption, and sales disruption on the inventory, order accumulation rate, and profit level of suppliers, manufacturers, and retailers for a fixed outage time. The results show that the closer the node enterprise to the interruption source, the greater the harm, and the conduction effect of supply chain system will also spread to other node enterprises. Section 4 discusses the influence of the three nodes in the supply chain on inventory, order accumulation rate, and profit level for different time periods, that is, when the three scenarios are interrupted for 5, 8, and 10 weeks, respectively. This shows that the longer the interruption time, the larger the inventory backlog of the supply chain, the greater the cumulative rate of orders in the supply chain, and the lower the profit level of the supply chain. In previous research, it was found that scholars mostly study two- or three-level supply chains. The interruption time is divided into fixed and dynamic interruption times. In the process of supply chain interruption risk, one or two of supply interruption, production interruption, sales interruption, logistics interruption, and demand interruption are studied. In addition, most studies analyze the operation status of supply chain interruption in terms of inventory and profit, and determine the law of risk transfer; see Table 6 for details. Therefore, there is a correlation between this article and current scholars’ research. Most scholars have studied the supply chain interruption from one or two perspectives of supply interruption and logistics interruption. The current study examined the supply chain mechanism from the three perspectives of supply interruption, production interruption, and sales interruption, and further strengthened the analysis and research on the types of supply chain interruption. In addition, the current research analyzed the operation status of the supply chain from one or two aspects of inventory and profit indicators. The current study expanded the indicators to evaluate the operation status of the supply chain, that is, inventory level, order accumulation, and profit level were used to determine the operation rules of each node of the supply chain when the interruption occurs, so as to prepare for the future disaster reduction strategy.

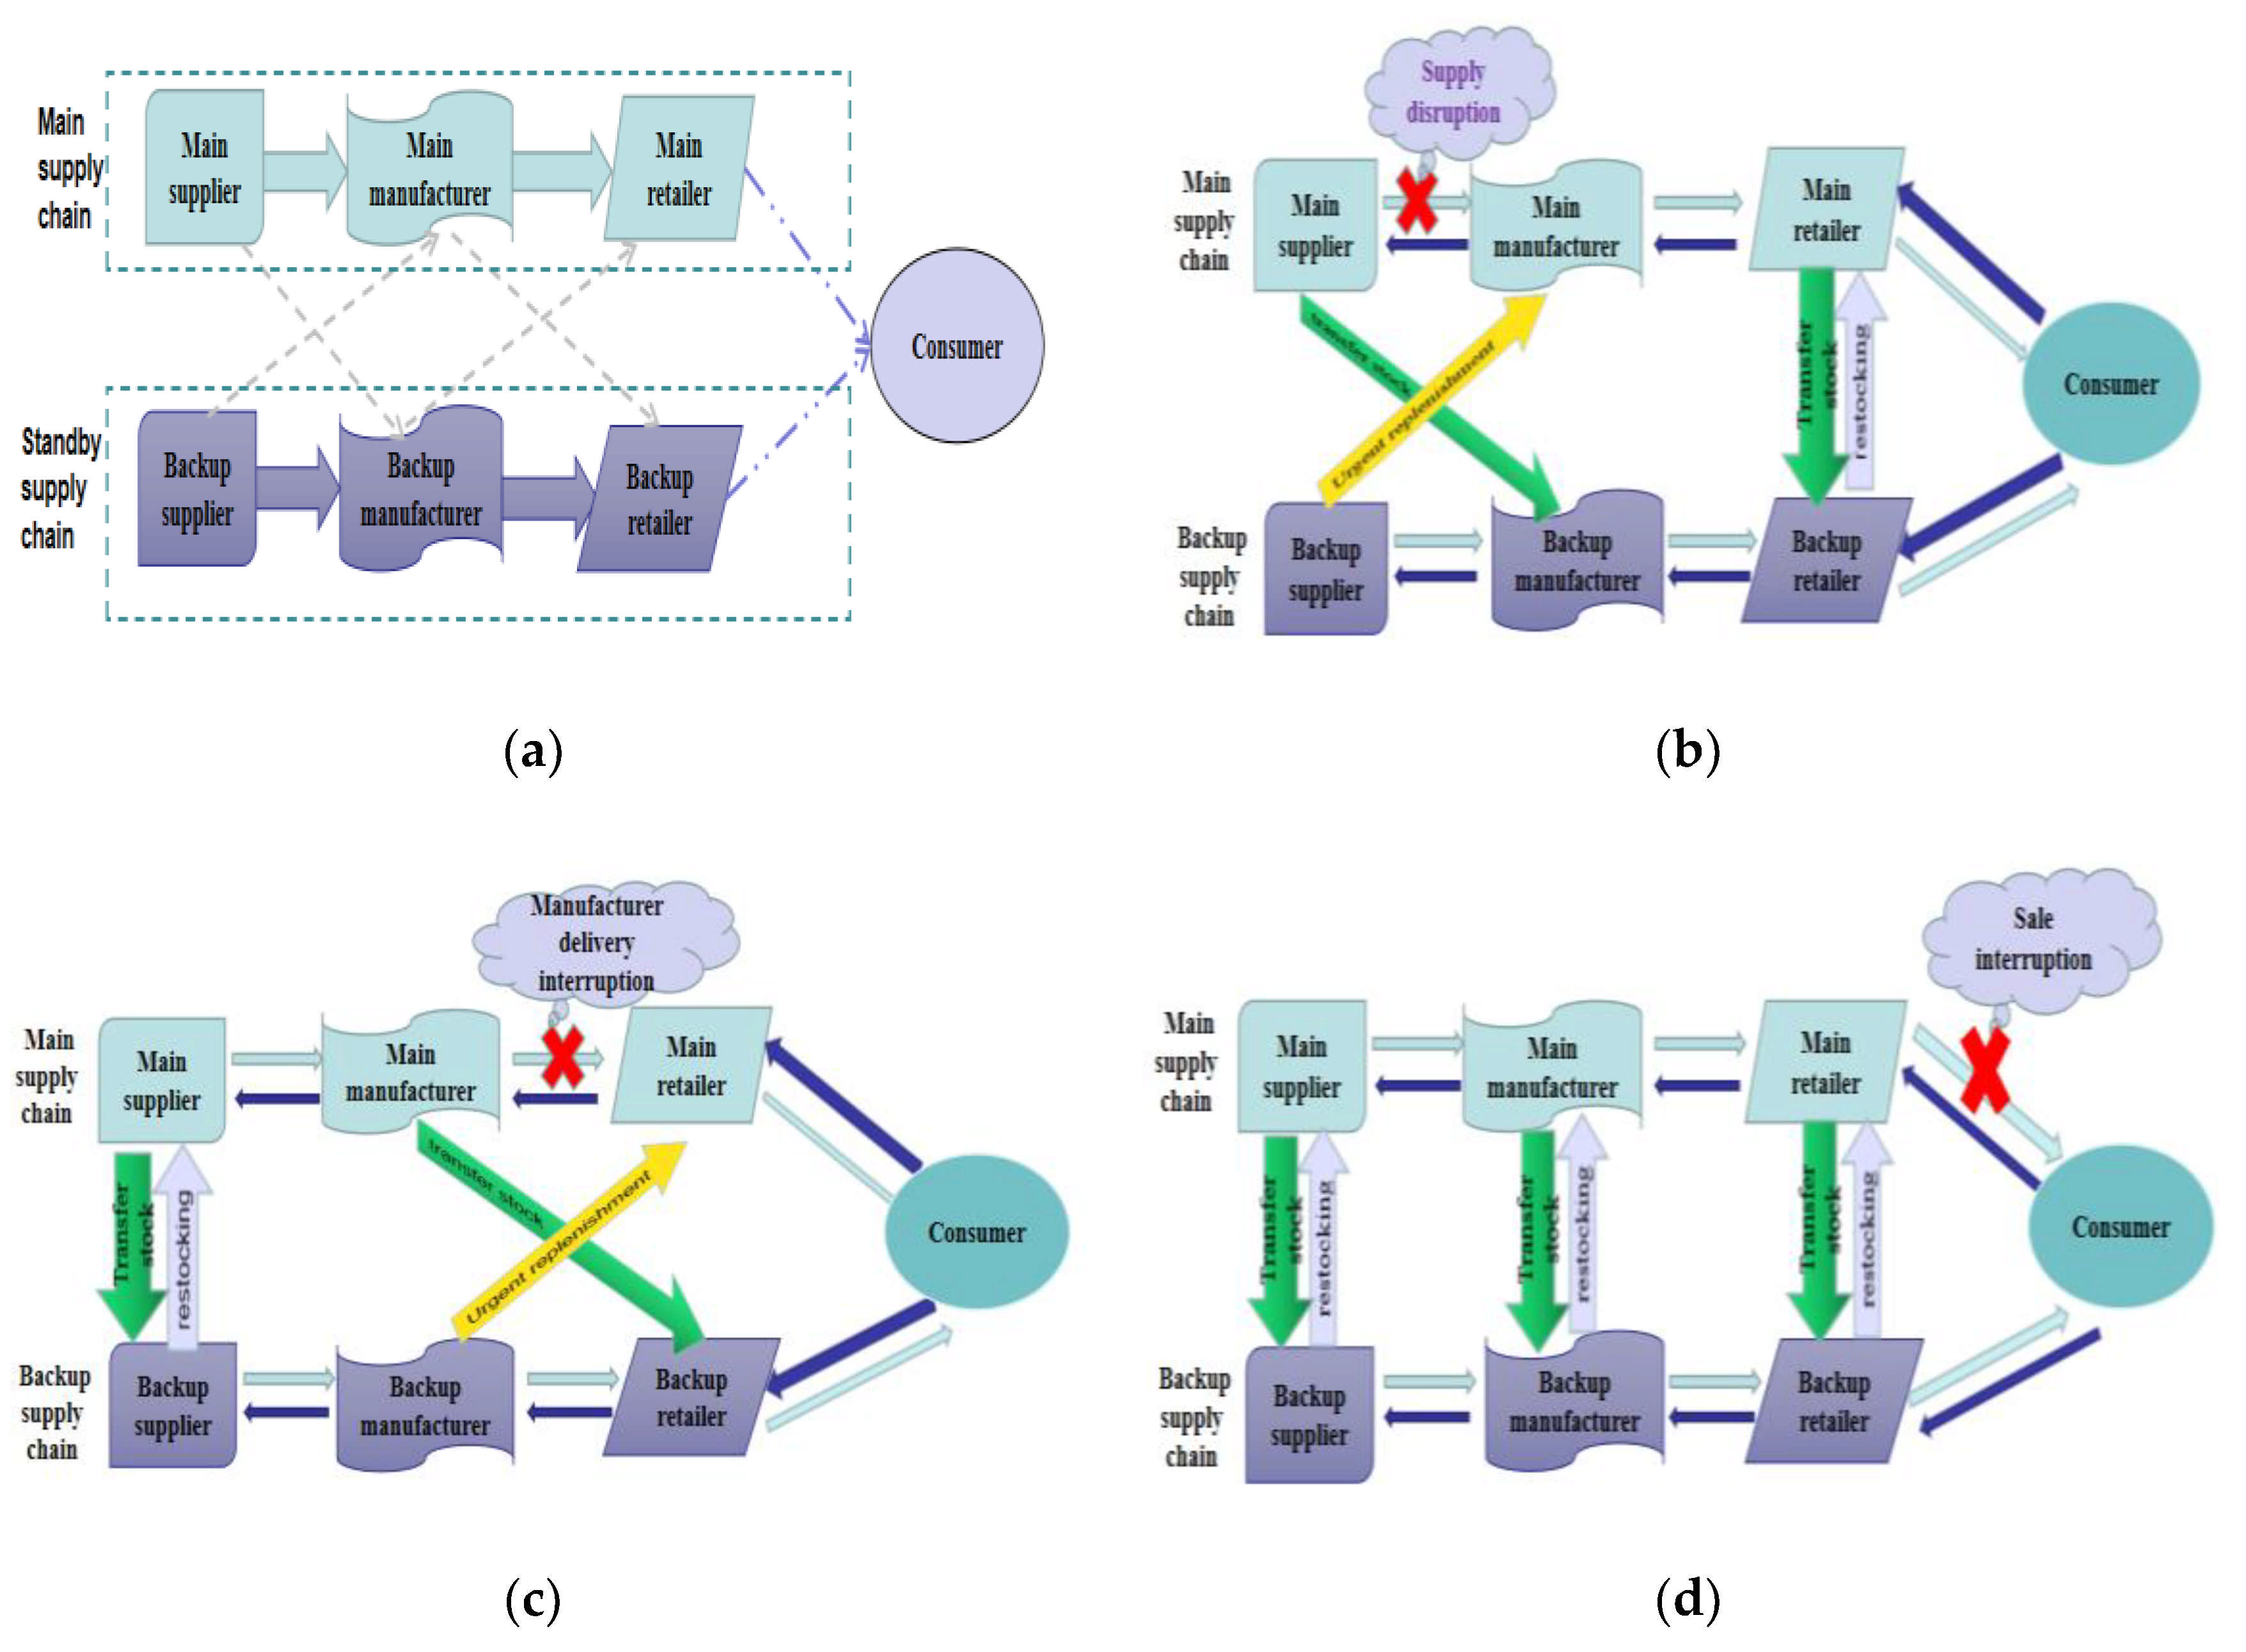
5.2. Supply Chain Disruption Mitigation Strategy

From the quantitative analysis in Section 3 and Section 4.1, it can be seen that if the complex risk is embedded in the traditional supply chain model for simulation, any node location interruption in the supply chain results in significant losses to the whole supply chain. The longer the interruption, the greater the loss to the supply chain. After the traditional single-chain supply chain node is interrupted, the node members issue the order information to the alternative cooperative enterprise for replenishment.
Regarding the relief of supply chain disruption, we adopted cluster supply chain with multiple single chain supply chains running in parallel. The inventory coordination of the cluster supply chain is that in the coordination process. Thus, not only are the retailers and other nodes in the chain considered, but also the cross-chain inventory replenishment operation. Therefore, the coordination process between supply chains should be considered. The coordination modes of the cluster supply chain are divided into the following four main types:
(1) Inventory coordination between one level, one side, same level, and cross chain.
This kind of coordination means that in the cluster supply chain, one node of one supply chain makes one-way replenishment to the corresponding peer nodes of another supply chain.
(2) Inventory coordination between one level, two sides, same level, and cross chain.
This method corresponds to the single-level unilateral cross-chain inventory coordination mode. To make up for the short duration of one-way cross chain replenishment of the same level nodes in two supply chains, a replenishment mode between the same level nodes of two supply chains is proposed, called the single-level bilateral cross-chain inventory coordination mode.
(3) Multi level, bilateral, same level, and cross-chain inventory coordination
Multi-level bilateral level cross-chain inventory coordination occurs when there are too many members involved in the supply chain and the peer members of multiple nodes, such as the supplier of chain 1 and the supplier of chain 2, the manufacturer of chain 1 and the manufacturer of chain 2, the retailer of chain 1 and the retailer of chain 2, conduct multi-node cross-chain inventory coordination activities.
(4) Inventory coordination among different levels and cross chain
In a cluster supply chain, the above three coordination modes are replenishment behaviors among peers. Different levels of enterprises, such as the manufacturer of chain 1, can also provide emergency replenishment to the suppliers in the other chain when the suppliers in the chain cannot supply in time. This phenomenon occurs when upstream enterprises in the chain are unable to replenish the upstream enterprises of the other chain. This is a multi-level and different level of cross-chain inventory coordination. On the basis of replenishment behavior between nodes [62,63], a cross-chain inventory replenishment collaboration model is proposed in this paper. Because of the flexibility and convenience of the cross-chain mitigation strategy, it can better meet the transfer and storage of goods between different nodes. Therefore, we focused on this mitigation strategy.
Figure 12 shows the double-chain supply chain and establishes two single-chain supply chains with parallel production relations. When one supply chain is short of inventory, the members of the cooperation node in the other chain provide inventory replenishment in order to cooperate to cope with the interruption of different nodes.
During the whole interruption period, the supplier’s delivery rate to the manufacturer is zero. As a result, the supplier has a large inventory backlog. In order to improve the flexibility and timeliness of emergency measures, a two-way coordinated replenishment strategy is adopted. As shown in Figure 12b, information sharing between the two supply chains supports cross-chain transactions with faster time and a lower price, which means that the backup supply chain and the main supply chain can flexibly conduct cross-chain coordination, in addition to meeting the needs of the chain. In this behavior mode, the manufacturer uses emergency replenishment strategies to back up suppliers in the collaborative supply chain [64,65,66]. The order quantity of the main supplier decreases, resulting in an inventory backlog, so the excess inventory is transferred to the backup manufacturer. The excess inventories of the retailer are transferred to the peer standby retailer. Similarly, the standby retailer can replenish the goods to the retailer at a preferential price when the retailer is out of stock. In this way, the inventory shortage or overstock of each node can be alleviated.
In the case of scenario 2, the emergency strategy adopted by the retailer in the traditional mode is to replenish the emergency inventory of the manufacturer who has not established a cooperative relationship. However, because there is no cooperative alliance between the supply chain and the backup supply chain, the unit replenishment cost to the temporary manufacturer is much higher than the order cost provided by the original manufacturer [67,68,69]. Thus, the strategy of bilateral multi-node two-way coordination replenishment is adopted to better cope with the crisis. As shown in Figure 12c, suppliers, manufacturers, and retailers cooperate to respond to the manufacturer’s delivery interruption. Retailers adopt an emergency replenishment strategy using the standby manufacturer. The main manufacturer transfers the overstocked inventory during the interruption, and the inventory of the main supplier and the standby supplier complement each other across the chain. A strategic cooperation relationship is established between the main supply chain and the standby supply chain. The standby supplier can supply the retailer of the main supply chain quickly and cooperate to deal with the interruption crisis.
In the sales interruption stage, consumers turn to homogeneous standby retailers to buy products with the aim of meeting demand. Although consumer’s demand has been met, this cannot make up for the loss due to being out of stock caused by the main retailer’s failure to meet the demand of consumers in time. At this point, the backup retailer and the main retailer are transformed from a shared market share to a backup retailer to meet consumer demand alone, and the node companies in the standby supply chain are under heavy pressure [70,71,72]. To better face the risk of sales interruption, we implemented a bilateral multi-node two-way coordinated replenishment strategy, in which the standby retailer purchases the redundant inventory products of the retailer and supplies them to the consumers in a timely manner. Considering that the downstream retailer needs to transfer excess inventory to the spare retailer and the retailer’s inventory is too large, although the acquisition cost of the standby manufacturer is lower than that of the standby retailer, the manufacturer chooses to transfer the surplus inventory to the standby manufacturer. Similarly, the supplier also implements the corresponding policy changes. As shown in Figure 12d, the main supply chain and the alternate supply chain can flexibly complement each other according to the unrealized order fulfillment rate of the downstream enterprises, and maximize the order satisfaction rate based on the control cost.

6. Conclusions and Prospect

6.1. Research Conclusion

In this paper, a supply chain simulation model of different interruption locations was built using system dynamics. Profit level, inventory level, and order accumulation rate were selected as measurement indicators to study the impact of different location interruption crises on the operation of supply chain node enterprises. Finally, the effects of different mitigation strategies implemented by node enterprises in different interruption situations were compared and analyzed. The main research conclusions are as follows:
(1)
From the perspective of the impact of different interruptions on the operation status of supply chain node enterprises, the node enterprises closer to the source of interruptions are more vulnerable. It is clear that the interruption spreads to other node enterprises due to the conduction effect of the supply chain system, and the longer the interruption, the stronger the chain effect and the more serious the damage to the supply chain system.
(2)
According to the influence degree of different types of interruptions on supply chain members, the results show that the disruption degree of supply interruption on the inventory stability and order accumulation rate of the supply chain operation is far greater than that of the downstream sales interruption. An interruption that occurs downstream has a weak impact on inventory and order accumulation. Supply chain managers should pay attention to the status of upstream nodes, and realize that suppliers are the key to ensuring the normal operation of the supply chain network. Therefore, it is necessary to strengthen the quality management system of the whole process of supply chain procurement, improve the ability to assess raw material delivery and the stability of upstream suppliers, and establish and improve the interruption prevention mechanism from the source.
(3)
The occurrence of any disruption will not only affect a single node enterprise. Once the interruption crisis occurs, the interests of the whole supply chain will be damaged, and the level of each benefit index will reach the lowest level. In essence, the design and operation of the supply chain should take full account of this ripple effect.
(4)
To better address supply, production, and sales interruptions, enterprises cooperate with other supply chain systems on the basis of the original single chain, and establish four mitigation strategies of the double chain. This study focused on the analysis of inventory coordination among different levels and across chains. This can improve the ability of node members to deal with disruption risk, and improve the response ability and flexibility of the supply chain.

6.2. Future Prospects

In this study, the actual situation and ideal assumptions were simplified when using SD to build a three-level supply chain model. Due to the limitations of research conditions and time, this paper has some shortcomings. It does not fully consider the relevant constraints when constructing the causal loop of each variable. In the future, efforts and improvements can be made in the following aspects:
(1)
Different types of interruption scenarios can be studied. Although the outages at different nodes were considered comprehensively, each outage scenario assumes that only one of the nodes is out of service. In the actual operation process, there may be several different types of interruptions at the same time. In the future, different types of interruption studies may be considered at the same time, and multiple contingency strategies shall be selected for joint implementation to maximize the cost of loss control.
(2)
For the setting of the interruption situation, factors such as probability of occurrence, duration, and recovery time can be added to study how these factors affect the interruption situation and the benefit of supply chain system, so as to help the managers of node enterprises have a clearer and more comprehensive understanding of interruption emergency management.
(3)
Regarding supply chain disruption, indicators of customer satisfaction, cost, transportation volume, and other perspectives can be considered to measure the impact of disruptions at different locations on the supply chain. The countermeasures to improve the ability of node enterprises were proposed to deal with crises and mitigate the impact of interruptions on the whole supply chain according to different types of interruptions, which helps to supplement and improve the system for supply chain interruptions. It is of great significance to build a flexible supply chain to help node enterprises achieve a rapid response ability and implement repairs following interruptions, and to maintain a stable and sustainable operation ability.
(4)
Our current research on disruption was based on the three-level supply chain of suppliers, manufacturers, and sellers. In the future, our research can be extended to a multi-level supply chain, that is, considering the risk of supply chain disruption with more than three nodes. This can better promote the sustainable development of the supply chain by studying the dynamic change law of the supply chain caused by supply, production, and sales interruptions. However, due to the limitations of time and energy, we did not conduct a detailed examination. The sustainable development of the supply chain resulting from these three kinds of interruptions needs further investigation in the future.

Author Contributions

For research articles with several authors, the following statements should be used “Conceptualization, J.L. and W.F.; methodology, W.F.; software, S.W.; validation, Q.Z., S.W. and X.W.; formal analysis, J.L.; investigation, S.W.; resources, W.F.; data curation, Q.Z.; writing—original draft preparation, Q.Z.; writing—review and editing, W.F.; visualization, X.W.; supervision, J.L.; project administration, X.W.; funding acquisition, analysis, W.F. All authors have read and agreed to the published version of the manuscript.

Funding

This research was funded by Hebei Social Science Fund (HB20GL031), the Second Tibetan Plateau Scientific Expedition and Research Program (2019QZKK0608), the Fundamental Research Funds for the Central Universities (2020MS128) and National Natural Science Foundation of China (41901259).

Institutional Review Board Statement

Not applicable.

Informed Consent Statement

Not applicable.

Data Availability Statement

The data presented in this study are available on request from the corresponding author.

Conflicts of Interest

The authors declare no conflict of interest.

References

  1. Azad, N.; Saharidis, G.K.D.; Davoudpour, H.; Malekly, H.; Yektamaram, S.A. Strategies for protecting supply chain networks against facility and transportation disruptions: An improved Benders decomposition approach. Ann. Oper. Res. 2013, 210, 125–163. [Google Scholar] [CrossRef]
  2. Hu, H.; Shi, L.; Ma, H.; Ran, B. Stability of the Supply Chain Based on Disruption Classification. Teh. Vjesn. Tech. Gaz. 2017, 24, 1187–1195. [Google Scholar]
  3. Dillon, R.L.; Mazzola, J.B. Management of disruption risk in global supply chains. IBM J. Res. Dev. 2010, 54. [Google Scholar] [CrossRef]
  4. Zhao, K.; Zuo, Z.Y.; Blackhurst, J.V. Modelling supply chain adaptation for disruptions: An empirically grounded complex adaptive systems approach. J. Oper. Manag. 2019, 65, 190–212. [Google Scholar] [CrossRef]
  5. Johnson, N.; Elliott, D.; Drake, P. Exploring the Role of Social Capital in Facilitating Supply Chain Resilience. Supply Chain Manag. Int. J. 2013, 18, 324–336. [Google Scholar] [CrossRef]
  6. Lucker, F.; Seifert, R.W.; Bicer, I. Roles of inventory and reserve capacity in mitigating supply chain disruption risk. Int. J. Prod. Res. 2019, 57, 1238–1249. [Google Scholar] [CrossRef] [Green Version]
  7. Wang, H.; Gu, T.; Jin, M.Z. The complexity measurement and evolution analysis of supply chain network under disruption risks. Chaos Solitons Fractal 2018, 116, 72–78. [Google Scholar] [CrossRef]
  8. Liu, W. An analysis of the impact of the “3.11” earthquake on Japan and the world economy. J. Hubei Second Norm. Univ. 2011, 28, 75–78. [Google Scholar]
  9. Ren, Z.K. Huawei Global Supply Chain Analysis and Risk Assessment. GuangDong Sci. Technol. 2019, 28, 58–61. [Google Scholar]
  10. Tan, Y.W.; Li, C.X.; Chen, Z.G. The impact of Xinguan pneumonia on the supply chain of agricultural products in China and ASEAN region and the countermeasures. Agric. Econ. Issues 2020, 10, 113–121. [Google Scholar]
  11. Shi, X.L. Novel coronavirus pneumonia impact on China’s logistics and global supply chain and Countermeasures. Logist. Res. 2020, 01, 11–16. [Google Scholar]
  12. Xu, S.; Zhang, X.T.; Feng, L.P.; Yang, W.T. Disruption risks in supply chain management: A literature review based on bibliometric analysis. Int. J. Prod. Res. 2020, 58, 3508–3526. [Google Scholar] [CrossRef]
  13. He, Y.; Li, S.S.; Xu, H. An In-Depth Analysis of Contingent Sourcing Strategy for Handling Supply Disruptions. IEEE Trans. Eng. Manag. 2020, 67, 201–219. [Google Scholar] [CrossRef]
  14. Olivares-Aguila, J.; ElMaraghy, W. System dynamics modelling for supply chain disruptions. Int. J. Prod. Res. 2020. [Google Scholar] [CrossRef]
  15. Abdullah, M.A.; Hishamuddin, H.; Bazin, N. A System Dynamics Approach to Investigate the Effects of Disruption on the Supply Chain with a Mitigation Strategy. Mater. Sci. Eng. 2019, 697, 27–28. [Google Scholar] [CrossRef]
  16. Mokhtar, S.; Bahri, P.A.; Moayer, S. Supplier portfolio selection based on the monitoring of supply risk indicators. Simul. Model. Pract. Theory 2020, 97. [Google Scholar] [CrossRef]
  17. Shao, L.G.; Jin, S.Z. Resilience assessment of the lithium supply chain in China under impact of new energy vehicles and supply interruption. J. Clean. Prod. 2020, 252, 119624. [Google Scholar] [CrossRef]
  18. Jabbarzadeh, A.; Fahimnia, B.; Sheu, J. Designing a supply chain resilient to major disruptions and supply/demand interruptions. Transp. Res. Part B—Methodol. 2020, 94, 121–149. [Google Scholar] [CrossRef]
  19. Nasr, W.W.; Salameh, M.K.; Moussawi-Haidar, L. Transshipment and safety stock under stochastic supply interruption in a production system. Comput. Ind. Eng. 2012, 63, 274–284. [Google Scholar] [CrossRef]
  20. Hou, Y.M.; Zhang, Q. The optimal inventory Control of a system with random lead time where random supply interruptions affect the replenishment. ASIA—Pac. J. Oper. Res. 2009, 26, 533–557. [Google Scholar] [CrossRef]
  21. Neiger, D.; Rotaru, K.; Churilov, L. Supply chain risk identification with value-focused process engineering. J. Oper. Manag. 2009, 27, 154–168. [Google Scholar] [CrossRef]
  22. Olson, D.L.; Wu, D.D. A review of enterprise risk management in supply chain. Kybernetes 2010, 39, 694–706. [Google Scholar] [CrossRef] [Green Version]
  23. Shen, G.; Aydin, S.G. Highway freight transportation disruptions under an extreme environmental event: The case of Hurricane Katrina. Int. J. Environ. Sci. Technol. 2014, 11, 2387–2402. [Google Scholar] [CrossRef] [Green Version]
  24. Samvedi, A.; Jain, V.; Chan, F.T.S. Quantifying risks in a supply chain through integration of fuzzy AHP and fuzzy TOPSIS. Int. J. Prod. Res. 2013, 51, 2433–2442. [Google Scholar] [CrossRef]
  25. Shareef, M.A.; Dwivedi, Y.K.; Kumar, V. Sustainable supply chain for disaster management: Structural dynamics and disruptive risks. Ann. Oper. Res. 2020. [Google Scholar] [CrossRef]
  26. Wu, Y.N.; Jia, W.B.; Li, L.W.Y.; Song, Z.; Xu, C.; Liu, F. Risk assessment of electric vehicle supply chain based on fuzzy synthetic evaluation. Energy 2019, 182, 397–411. [Google Scholar] [CrossRef]
  27. Wang, X.J.; Chan, H.K.; Yee, R.W.Y.; Diaz-Rainey, I. A two-stage fuzzy-AHP model for risk assessment of implementing green initiatives in the fashion supply chain. Int. J. Prod. Econ. 2012, 135, 595–606. [Google Scholar] [CrossRef]
  28. Lockamy, A. Assessing disaster risks in supply chain. Ind. Manag. Data Syst. 2014, 114, 755–777. [Google Scholar] [CrossRef]
  29. Ruiz-Torres, A.J.; Mahmoodi, F.; Zeng, A. Supplier selection model with contingency planning for supplier failures. Comput. Ind. Eng. 2013, 66, 374–382. [Google Scholar] [CrossRef]
  30. Mangla, S.K.; Kumar, P.; Barua, M.K. Risk analysis in green supply chain using fuzzy AHP approach: A case study. Resour. Conserv. Recycl. 2015, 104, 375–390. [Google Scholar] [CrossRef]
  31. Fakhrzad, M.B.; Goodarzian, F. A fuzzy multi-objective programming approach to develop a green closed-loop supply chain network design problem under uncertainty: Modifications of imperialist competitive algorithm. Rairo-Oper. Res. 2019, 53, 963–990. [Google Scholar] [CrossRef] [Green Version]
  32. Aqlan, F.; Ali, E.M. Integrating lean principles and fuzzy Bow-Tie analysis for risk assessment in chemical industry. J. Loss Prev. Process Ind. 2014, 29, 39–48. [Google Scholar] [CrossRef]
  33. Ivanov, D. Simulation–based ripple effect modelling in the supply chain. Int. J. Prod. Res. 2017, 55, 2083–2101. [Google Scholar] [CrossRef]
  34. Li, X.J.; Ji, J.H.; Da, J.H. Performance analysis of supply chain operation mode based on supply interruption. Chin. J. Manag. Sci. 2012, 20, 541–548. [Google Scholar]
  35. Paul, S.K.; Rahman, S. A quantitative and simulation model for managing sudden supply delay with fuzzy demand and safety stock. Int. J. Prod. Res. 2018, 56, 4377–4395. [Google Scholar] [CrossRef]
  36. Forrester, J.W. Industr ial Dynamics; Pegasus Communications Inc.: Waltham, MA, USA, 1961. [Google Scholar]
  37. Forrester, J.W. Industrial dynamics:a major breakthrough for decision makers. Harv. Bus. Rev. 1958, 36, 37–66. [Google Scholar]
  38. Sterman, J.D. Modeling managerial behavior: Misperceptions of feedback in a dynamic decision making experiment. Manag. Sci. 1989, 35, 321–339. [Google Scholar] [CrossRef] [Green Version]
  39. Liu, Q.S.; Jiang, G.Y. Research on bullwhip effect in Supply Chain Based on system dynamics. China Manag. Inf. 2009, 6, 72–75. [Google Scholar]
  40. Chaerul, M.; Tanaka, M.; Shekdar, A.V. A system dynamics approach for hospital waste management. Waste Manag. 2007, 28, 442–449. [Google Scholar] [CrossRef] [PubMed]
  41. Ma, S.H.; Lin, Y.; Chen, Z.X. Supply Chain Management; Machine Press: Beijing, China, 2000; pp. 175–183. [Google Scholar]
  42. Peng, M.; Peng, Y.; Chen, H. Post-seismic supply chain risk management: A system dynamics disruption analysis approach for inventory and logistics planning. Comput. Oper. Res. 2014, 42, 14–24. [Google Scholar] [CrossRef]
  43. Bashiri, M.; Tjahjono, B.; Lazell, J.; Ferreira, J.; Perdana, T. The Dynamics of Sustainability Risks in the Global Coffee Supply Chain: A Case of Indonesia-UK. Sustainability 2021, 13, 589. [Google Scholar] [CrossRef]
  44. Tang, H. Structural Analysis and Preventive Strategy of Risks and Influence Factors of Agricultural Produce Supply Chains Based on ISM. Logist. Technol. 2014, 20, 377–382. [Google Scholar]
  45. Wang, J.; Chen, X. Manufacturer’s Risk Response under Supply Chain Disruption Risk. Ind. Eng. Manag. 2019, 24, 27–34. [Google Scholar]
  46. Grossler, A.; Thun, J.H.; Milling, P.M. System dynamics as a structural theory in operations management. Prod. Oper. Manag. 2008, 17, 373–384. [Google Scholar] [CrossRef]
  47. Wang, H.H.; Wu, Z.X. Dynamic simulation of inventory control system based on Vensim. China Manag. Inf. 2014, 17, 44–46. [Google Scholar]
  48. Chen, Q.Q. Research on Inventory Management Model in Cluster Supply Chains Based on System Dynamics; South China University of Technology: Guangzhou, China, 2013. [Google Scholar]
  49. Liu, Y.L. Research on Inventory Coordination Mechanism for Dual–Channel Supply Chain; North China Electric Power University: Beijing, China, 2016. [Google Scholar]
  50. Sterman, J.D. Business Dynamics: Systems Thinking and Modeling for a Complex World; McGraw Hill: New York, NY, USA, 2000. [Google Scholar]
  51. Kochana, C.G.; Nowicki, D.R.; Sauser, B.; Randall, W.S. Impact of cloud-based information sharing on hospital supply chain performance: A system dynamics framework. Int. J. Prod. Econ. 2018, 195, 168–185. [Google Scholar] [CrossRef]
  52. Wang, Q.P.; Cai, Y.Y.; Jia, J.G. Review and comment: From system dynamics to organizational learning. Chin. J. Manag. Sci. 2000, S1, 237–247. [Google Scholar]
  53. Groene, S.; Foerster, S.; Hiete, M. Long-term impact of environmental regulations and eco–conscious customers in the chemical industry: A system dynamics approach to analyze the effect of multiple disruptions. J. Clean. Prod. 2019, 227, 825–834. [Google Scholar] [CrossRef]
  54. Shao, L.S.; Qin, Z.W. Emergency Strategy for Supply Chain under Supply Node’s Failure. Chin. J. Manag. 2013, 10, 913–918. [Google Scholar]
  55. Qin, Y.H. Quantity flexibility contract with effect and return price in perishable product’s supply chain. J. Cent. China Norm. Univ. (Nat. Sci. Ed.) 2012, 46, 477–482. [Google Scholar]
  56. Wang, Y.; Jiang, Y.Y.; Deng, Z.F. Analysis of Logistics Service Supply Chain Risk in Uncertain Environment. Bus. Res. 2011, 411, 179–183. [Google Scholar]
  57. Wilson, M.C. The impact of transportation disruptions on supply chain performance. Transp. Res. Part E Logist. Transp. Rev. 2007, 43, 295–320. [Google Scholar] [CrossRef]
  58. Deng, A.M.; Wen, X.P. Analysis of the impact of supply chain disruption on supply chain profit based on system dynamics. Logist. Technol. 2015, 34, 208–211 + 269. [Google Scholar]
  59. Wen, X.P. Research on the Impact of Supply Chain Disruption on Supply Chain Performance Based on System Dynamics; Hunan University: Changsha, China, 2015. [Google Scholar]
  60. Qian, H. Research on Supply Chain Inventory Coordination Control under Logistics Disruption; North China Electric Power University: Beijing, China, 2017. [Google Scholar]
  61. Han, M.L. Supply Chain Disruption Risk Analysis and Coordination Management Research; Donghua University: Shanghai, China, 2008. [Google Scholar]
  62. Wang, X.J.; Tiwari, P.; Chen, X. Communicating supply chain risks and mitigation strategies: A comprehensive framework. Prod. Plan. Control 2017, 28, 1023–1036. [Google Scholar] [CrossRef] [Green Version]
  63. Lee, C.W.; Ulferts, G.W. Managing Supply Chain Risks and Risk Mitigation Strategies. North Korean Rev. 2011, 7, 34–44. [Google Scholar] [CrossRef]
  64. Zhu, S.X. Analysis of dual sourcing strategies under supply disruptions. Int. J. Prod. Econ. 2015, 170, 191–203. [Google Scholar] [CrossRef]
  65. Bustamante, M.L.; Gaustad, G.; Alonso, E. Comparative Analysis of Supply Risk-Mitigation Strategies for Critical Byproduct Minerals: A Case Study of Tellurium. Environ. Sci. Technol. 2018, 52, 11–21. [Google Scholar] [CrossRef] [PubMed]
  66. Zeng, N.M.; He, Q. Dual Sourcing Strategy for High-Tech Manufacturer under Supply Risk and Capacity Constraint. IEEE Access 2019, 7, 42672–42682. [Google Scholar] [CrossRef]
  67. Li, G.; Kang, Y.C.; Liu, M.Q. Dual-source procurement strategies for manufacturers with supply disruption risks. J. Intell. Fuzzy Syst. 2017, 33, 2637–2645. [Google Scholar] [CrossRef]
  68. Li, X.; Li, Y.J. On the loss-averse dual-sourcing problem under supply disruption. Comput. Oper. Res. 2018, 100, 301–313. [Google Scholar] [CrossRef]
  69. Khojasteh-Ghamari, Z.; Irohara, T. A multi-criteria double sourcing based optimization approach to manage the supply chain risk. Int. Conf. Ind. Eng. Manag. Sci. Appl. 2017, 126–130. [Google Scholar] [CrossRef]
  70. Ahmadi-Javid, A.; Hoseinpour, P. Service system design for managing interruption risks: A backup-service risk-mitigation strategy. Eur. J. Oper. Res. 2019, 274, 417–431. [Google Scholar] [CrossRef]
  71. Zheng, Y.; Zhao, X.L. The Double-Source Purchase Decisions with Substitution under Cap and Trade Policy. Int. Conf. Appl. Math. Simul. Model. 2016, 41, 83–87. [Google Scholar]
  72. Chiang, D.M.; Guo, R.S.; Pai, F.Y. Retailer’s optimal sourcing strategy by using one major supplier and one emergent supplier. Optim. Lett. 2011, 5, 319–331. [Google Scholar] [CrossRef]
Figure 1. Operation process of the three-tier supply chain under the traditional model.
Sustainability 13 02462 g001
Figure 2. Causal loop diagram of the supplier subsystem.
Sustainability 13 02462 g002
Figure 3. Causal loop diagram of the manufacturer subsystem.
Sustainability 13 02462 g003
Figure 4. Causal loop diagram of the retailer subsystem.
Sustainability 13 02462 g004
Figure 5. Traditional supply chain system dynamics model.
Sustainability 13 02462 g005
Figure 6. System dynamics (SD) model construction process of traditional supply chain.
Sustainability 13 02462 g006
Figure 7. Traditional supply chain system dynamics model with different interruption locations.
Sustainability 13 02462 g007
Figure 8. Supply chain inventory change trend chart under different interruption scenarios. (a) Describes the inventory change trend of suppliers. (b) Describes the inventory change trend of manufacturers. (c) Describes the inventory change trends of retailers. (d) Describes the change trend of total inventory.
Sustainability 13 02462 g008
Figure 9. Cumulative change trend of supply chain orders under different interruption scenarios. (a) Describes the cumulative change trend of supplier orders. (b) Describes the cumulative change trend of manufacturer orders. (c) Describes the cumulative change trend of retailer orders. (d) Describes the cumulative change trend of total orders.
Sustainability 13 02462 g009aSustainability 13 02462 g009b
Figure 10. Change trend of supply chain profit under different interruption scenarios. (a) Describes the change trend of supplier profit. (b) Describes the change trend of manufacturer’s profit. (c) Describes the change trend of retailer’s profit. (d) Describes the change trend of total profit.
Sustainability 13 02462 g010
Figure 11. Analysis of the impact of different interruption times on the operating status of the supply chain. (ac) Describe the total order accumulation rate, inventory level, and profit level in the case of supply interruption. (df) Describe the total order accumulation rate, inventory level and profit level in case of production interruption. (gi) Describe the total order accumulation rate, inventory level and profit level in case of sales interruption.
Sustainability 13 02462 g011
Figure 12. Double-chain supply chain cross-chain coordination strategy. (a) Describes the double-chain supply chain cross-chain coordination strategy in the case of supply chain interruption. (bd) Describe separately the bilateral multi-node two-way coordinated replenishment strategy in the case of supply interruption, production interruption, and sales interruption.
Sustainability 13 02462 g012
Table 1. Research status of system dynamics and supply chain risk management.
Research DirectionInterrupt TypeEvaluation Index
Supply chain risk managementSupply disruption [13,19]Order accumulation and inventory levels
Supply disruption [16]Profit level
Supply and demand disruptions and facility disruptions [18]Supply capacity
Supply disruption and random lead time [20]Average cost of order delay
System dynamicsSupply disruption [15]Service level, cost, profit, and inventory level
Demand shocks, supply disruptions and prices [17]Supply chain flexibility
Table 2. Comparison of supply chain disruption methods.
Research DirectionResearch MethodAdvantageDisadvantage
Supply chain disruption identificationTOPSIS and FAHP [24];Less quantitative data information; easy to operate; practical.Excessive qualitative components; subjective result.
Supply chain disruption assessmentFuzzy comprehensive evaluation [26]; ARI [27]; FAHP [27,30]; Bayesian Network [28]; Mathematical programming models [29].Simple and easy to implement; less data required.Subjective and abstract result.
Supply chain disruption controlFMEA [32]; safety stock [33]; double source supply strategy [34]; fuzzy demand [35];Practical and applicable to various industries in different fields.Short term risk control; poor implementation effect.
Supply chain risk identification, assessment, and controlSystem Dynamic [42,43].Dealing with periodic problems, complex problems, and insufficient research data.Difficult operation; rely on a certain mathematical model.
Table 3. This study is compared with other literatures in interruption type, evaluation index, and research method.
Research DirectionInterrupt TypeEvaluation IndexResearch Method
The research of this paperSupply disruption, production interruption, and sales interruptionProfit level, order accumulation rate, and inventory levelSystem dynamics
Other literature studiesSupply disruption [13,15,16,19]; demand shocks, supply disruptions and prices [17]; supply and demand disruptions and facility disruptions [18]; supply disruption and random lead time [20]Order accumulation and inventory levels [13,19]; Service level, cost, profit, and inventory level [15]; Profit level [16]; Supply chain flexibility [17]; Supply capacity [18]; Average cost of order delay [20]TOPSIS and FAHP [24]; Fuzzy comprehensive evaluation [26]; ARI [27]; FAHP [27,30];
Bayesian Network [28]; Mathematical programming models [29]. FMEA [32]; safety stock [33]; double source supply strategy [34]; fuzzy demand [35]; System Dynamic [15,17,42,43].
Table 4. Model hypothesis.
NumberHypothesis
1The total inventory level of the supply chain is the sum of the inventory levels of suppliers, retailers, and manufacturers; the same is true for the total order accumulation rate and total profit level of the supply chain.
2The cumulative order rate of nodal enterprises in the supply chain is the unfulfilled order rate, that is, the difference between the order rate of downstream enterprises and the order completion rate.
3When the interruption occurs at any node, the backup supplier’s urgent supply to the out-of-stock node enterprises will be delayed.
4The cost of a supply chain node enterprise is composed of storage costs, ordering costs, out-of-stock penalty costs, and transportation costs.
Table 5. Simulation parameter settings.
ParameterValueUnitParameterValueUnit
Supplier inventory coverage time3weekSupplier unit storage cost2yuan
Supplier inventory adjustment time3weekSupplier unit transportation cost1yuan
Supplier delivery delay time1.5weekManufacturer unit purchase cost1000yuan
Supplier initial inventory200pieceManufacturer unit out of stock cost110yuan
Manufacturer inventory coverage time2weekManufacturer unit storage cost5yuan
Manufacturer inventory adjustment time2weekManufacturer unit transportation cost4yuan
Manufacturer receiving delay time1.5weekRetailer unit purchase cost1800yuan
Manufacturer initial stock150pieceRetailer unit out of stock cost400yuan
Retailer inventory coverage time1.5weekRetailer unit storage cost10yuan
Retailer inventory adjustment time1.5weekRetailer unit transportation cost8yuan
Retailer receiving delay time0.5weekRetailer cost of sales2800yuan
Retailer initial inventory100pieceRaw materials unit purchase cost400yuan
Supplier unit shortage cost20yuan
Table 6. Comparison of the results of the research and discussion.
Research ContentsInterruption TimeSupply Chain NodeInterrupt TypeEvaluating Indicator
The research content of this paperThe fixed interruption timeSuppliers, manufacturers, retailersDisruption of supply, production, and salesInventory level, order accumulation rate, and profit level
Dynamic change of interruption timesSuppliers, manufacturers, retailersDisruption of supply, production, and salesInventory level, order accumulation rate, and profit level
Existing research contentsDynamic change of interruption timesSuppliers, manufacturers, retailers [58,59,60]Disruption of supply, production, and sales; logistics disruption [60]Inventory level [58,59,60], profit level [58,59]
The fixed interruption timeSuppliers, retailers [61]Disruption of supply, demand, and logistics [61]Inventory level [61]
Publisher’s Note: MDPI stays neutral with regard to jurisdictional claims in published maps and institutional affiliations.

