Abstract
Technological convergence (TC) plays a vital role in leading the next generation of technological innovation. Research in this field has practical significance for its ongoing deployment as an innovation-driven strategy in the sustainable development of the textile industry. However, there are few relevant studies, with most of them carried out on only one level, whether from a micro or macro perspective. This study analyses the evolution of TC from both macro (industry) and micro (technical field) levels. A patented co-occurrence method is employed to measure TC and various social network indicators, including density, node strength and the Jaccard coefficient, to measure the evolution of the network and its nodes and edges. The results present that the density of the macro TC network has been increasing and that the industrial technologies that are closely associated with the textile industry include chemical engineering technology, pharmaceutical technology and material technology. Meanwhile, the micro TC network manifests high dependence on proprietary technology, whilst the convergence degree between the core technologies is relatively high. This study proposes that the government should continue to encourage textile enterprises to strengthen TC, particularly their integration with leading technologies, and should strengthen the integration of emerging industrial textiles with national defence, medicine and other related fields to improve innovation speed.
1. Introduction
Technological convergence (TC) is the fundamental source of innovation, especially in the “Industry 4.0” era, which integrates popular technologies like the Internet of Things, big data, cloud computing, artificial intelligence (AI) and augmented reality (AR). Indeed, it is the most significant feature of technology development in Industry 4.0 [1]. Generally, it is considered to comprise the combination of multiple technologies in a certain field in the creation of new technologies, as it is already becoming a new determinant for industrial development and in providing new and high-performance technologies [2]. There has been increasing research focusing on TC in recent years. The current research objects generally concern emerging industries, including information technology (IT) and biotechnology (BT) [3], robotics [4], information and communication technology (ICT) [5, 6], nutraceuticals and functional foods [7].
TC not only gives birth to emerging industries; it also brings traditional industries into the modern production system by integrating them with emerging technologies. However, existing research has ignored TC in traditional industries. For instance, as a vital civilian production industry, the textile industry is a traditional industry in China. China’s main textile products rank first in the world; this has helped the country develop into a veritable textile country, but not yet a relatively strong one. Compared to those of developed countries, China’s textile industry lacks brand advantage, core technology and independent innovation, all of which are not conducive to its sustainable development. Moreover, with the in-depth integration of new technology systems based on information and internet technologies, product innovation has increasingly become diversified, compounded and intelligent [8]. This requires textile companies to no longer merely rely on traditional development, but also broaden their scope of original knowledge and implement cross-field technology convergence. In this context, studying the evolution of TC is conducive for mastering the development law of textile technology integration and for discovering core technology fields that play a vital role in textile technology integration. This provides a technical foresight into the technological innovation of textile enterprises and indicates the government’s direction in formulating technological development strategies for the textile industry.
Since TC entails an intersection of two or more distinct technical fields [6], technology classification standards are highly significant. Geum [3] applied the United States Patent Classification system, a patent micro-classification system, to study TC characteristics in 27 IT-related and 33 BT-related patent classification numbers. Using the same system, Curran and Leker (2011) analysed the TC structure of nutraceuticals and functional foods (NFF) and IT [5]. One advantage of micro-classification is that it enables a clear observation of the TC of micro-level technical relationships; however, it cannot reveal macro-level technological connections, such as inter-industry connections. Jeong (2015) applied the standard industry classification system and Korean patent data to study the institutional characteristics and the network evolution of industrial TC in 35 fields [9]. Kwon (2020) assessed the technological relations amongst industries based on the Nomenclature of Economic Activities (NACE) macro-classification system to investigate the overall trends of technology-driven industry convergence amongst 45 fields [10]. Apparently, the benefit of simultaneously studying the TC from both macro and micro perspectives is that it allows the identification of both TC across industries and the evolution of core technology fusion within industries. However, few existing studies have revealed intra-industry and cross-industry TC from both perspectives.
In this case, existing studies pose significant limitations. From the aspect of research objects, there is inadequate TC research in the textile field, which then limits the transformation of China’s textile industry from a factor-driven industry into an innovation-driven one. From a research content perspective, existing studies are based only on one set of technology classification standards, which is not conducive toward simultaneously identifying the core TC within an industry and across industries. Therefore, it is hoped to bridge the gaps in existing research regarding both research objects and research contents.
This paper takes textile TC as its research object. First, it constructs a macroscopic and microscopic TC network based on the standard industry classification system and the International Patent Classification System. Afterwards, the evolution of the TC network pattern is determined according to the network index. In this way, this paper makes up for inadequate research on textile TC. With regard to research content, systematic research from both macro and micro levels can make up for the lack of simultaneous demonstrations of technology integration in existing research. Overall, this paper has great theoretical value and practical significance for enterprises that intend to gain insight into technological opportunities and the formulation of research and development (R&D) strategies.
This paper aims to determine the law of textile TC from both macro and micro perspectives. Three research questions are proposed. First, does TC universally exist in textile technology innovation? If so, what is the proportion of integrated innovation in all textile innovation data? Second, from a macro perspective, how has textile TC evolved over time? What other industries have the main technology integrate with? Third, what is the law of fusion of technical fields from a micro perspective? Specifically, which technical fields are relatively fused with textile technology? What are the core technologies involved in textile TC?
2. Literature Review
2.1. Concept of TC
The concept of TC can be traced from the research of American scholar Rosenberg (1963) concerning the early evolution of the American machine tool industry. Rosenberg’s reference to TC involves the process of applying similar technologies to various industries. Following his study, several studies have provided connotations of TC from different perspectives. In terms of functionality, TC entails applying the method of one technical field to another, eventually establishing a new product [7]. It is the result of integrating the knowledge of various technologies or industries to form a dominant design [11]. Regarding TC leading to the change of relations amongst industries or technology fields, it refers to the integration of various technologies, equipment or industries into a whole [12]. It is a process in which the boundaries amongst technical departments or fields have been gradually blurred [13]. In 1985, in its report on industrial structure adjustment, Japan’s Ministry of Industry and Trade emphasised that TC is the phenomenon of mutual penetration and convergence between two or more distinct technologies to form a new one. Regarding the process of TC, it comes from knowledge fusion and is a process of transforming knowledge fusion into an innovation potential. From the perspective of industry evolution, it is believed that TC allows knowledge spill-over amongst industries to realise new technology integration. Meanwhile, based on the research of Curran (2011) [5], this paper defines TC as a cross-penetration of various technology fields, including both intra-industry technologies and cross-penetration amongst technology fields.
2.2. Identification of TC
Patent data is a common material for TC identification. In this case, the International Patent Classification (IPC) provides technical boundaries; hence, it can be applied to explain interconnections amongst technologies [14]. Regarding the various methods for identifying TC, there are two possible approaches for determining the connections amongst technologies through IPC information—co-occurrence and co-citation. The former means that, if there are other IPC codes in a patent, the technology is converged; meanwhile, the latter is fused through the information display technology of references between patents. Both methods help in understanding interdependencies amongst technologies, thus emerging networks based on IPC co-occurrence or co-citation information can explain changes in their relationships [15].
However, compared to the patent citation analysis method, patent co-occurrence data are easier to obtain since they reflect cross-integration amongst technical topics and avoids insufficient post-citation patents. Therefore, co-occurrence is more suitable to assess the integration of different technical subjects. Accordingly, a co-occurrence relationship is a potential symbol of the connection between technologies and a measure of TC [16]. The technology co-occurrence analysis method helps in determining the quantitative status of the TC network and provides clear evidence of changes in the technology system. Therefore, this paper applied the said method to identify technology fusion amongst the patents.
2.3. Evolution of TC
Existing research on the evolution of TC is primarily based on the standard industry classification system (ISI-OST-INPI), IPC and the US patent classification (USPC) system to classify the technology field. Based on the granularity of the classification system, existing studies can be classified into macro and micro categories.
Literature [3] analysed the evolution of IT and BT technology integration based on the micro USPC classification system. Based on a micro perspective of IPC classification, Curran and Leker [5] examined the TC structure of nutritional health products, NFF and IT. Other studies have perused the integration of robots [4], ICT [6] and industrial safety [15] technologies based on micro-classification systems. Meanwhile, some scholars have adopted a multi-industry structure, along with systematic analysis indicators and tools of big data samples [9,17,18]. Overall, literature [9] is the most representative of all other literature, since it studies the evolution of TC based on a macro perspective, particularly by analysing TC evolution amongst 35 technical fields in Korea based on the ISI-OST-INPI classification system.
However, a recent study suggested that analysing the evolution of technology fusion from both macro and micro levels might be more systematic; this might allow us to observe the convergence of micro-technical fields amongst industries [10].
Regardless of the perspective, social network analysis indicators have been frequently adopted by existing researches to study the evolution of TC. The analysis of such evolution includes the overall network’s evolution, the nodes’ evolution, and the edges’ evolution. An overall network analysis is beneficial to describe the entire structure of the technology integration network and to determine the current status of technology integration development [17,18]. Amongst all indicators for analysing the evolution of the overall network, the number of links, density and average degree are the most typically used [6,9,12], whilst node strength is a vital indicator for measuring core convergent nodes in the network [8,12,15], and the Jaccard coefficient can be used to assess the important converged technology pair [3,6,9,10].
From this literature analysis, two conclusions can be drawn. First, current research on TC mostly focuses on emerging high-tech industries and is lacking the character of TC in traditional industries. In order to provide theoretical support and practical guidance for the transformation and upgrade of traditional industries, the evolution of textile TC is a vital topic to promote the high-quality development of China’s manufacturing industry. Second, existing research on TC is limited to either the macro or micro level, whilst there are only a few systematic studies that have combined the two levels.
Based on 40,709 granted textile patents, this paper conducts an analysis of technology co-occurrence to construct a TC research framework from both macro and micro levels. On a macro level, through the construction of the inter-industry TC network, the evolution of the cross-industry TC relationship is analysed to provide a basis for policy formulation. On a micro level, by determining key technology nodes and links in the TC network, the evolution of the cross-domain TC relationship is analysed, thus providing a theoretical basis for the selection of enterprises’ R&D investment.
3. Methodology
This study systematically analyses the evolution of textile TC in China from both macro and micro perspectives. Currently, co-citation and co-occurrence are the two most significant methods for measuring TC. Compared to those of co-citation, co-occurrence data are easier to obtain; in addition, there is no lack of back-cited patents [16]. Therefore, this article applies the IPC co-occurrence method to construct TC networks. The macro and micro networks are initially constructed based on the standards of various technical granularities. Then, the evolution of textile TC is analysed according to the changing characteristics of the overall network structure, the nodes, and the relationship amongst nodes at different stages. Indicators like the number of links, density and degree are used to assess the evolution of the overall network; the link coefficient is used to measure the evolution of key nodes; and, the Jaccard coefficient is used to determine the evolution of the relationship amongst the nodes.
3.1. Measurement Method of TC
Technology co-occurrence analysis is considered a significant method to determine TC [4]. It identifies the fusion of various technical fields based on multiple technical fields within the same patent. From the IPC classification standard, if the IPC number of a patent contains IPC classification numbers of multiple different IPC4 (the first four digits of the International Patent Classification Number) technical fields, this means that multiple IPC classifications appear in the patent, known as IPC co-occurrence [19]. Meanwhile, from the ISI-OST-INPI classification standard, if multiple IPC classification numbers in a patent belong to various technical fields, they are called technical field co-occurrence. Collectively, IPC co-occurrence and technical field co-occurrence are called technical co-occurrence. If a technical co-occurrence of a patent exists, it indicates that the technology exhibits a trend of fusion development [5]. Contrarily, if the patent belongs to a single technical field, it signifies that the technology is developing independently.
In this paper, technology co-occurrence methods are employed to construct IPC and technical field co-occurrence networks to characterise TC networks. From a macro perspective, a technical field co-occurrence network is constructed based on the ISI-OST-INPI classification standard. The network nodes represent 35 different technical fields, and their connections indicate co-occurrence and integration of such fields. From a micro perspective, based on IPC standards, the IPC co-occurrence network is constructed using the top four IPC nodes. The connections between the nodes indicate the co-occurrence of the two IPCs, implying that these IPCs have technically merged.
3.2. Evolution Analysis
This paper adopts technological field co-occurrence and IPC co-occurrence to construct a macro and a micro TC network, considering the technical field or IPC as the network node. At the same time, the co-occurrence relationship between the technical fields and IPC is regarded as a TC network. The adjacency matrix g = [gij] is used to reflect whether there is a co-occurrence relationship, as well as the weight matrix w = [wij] to reflect co-occurrence strength. wij represents the number of times that i and j appear together.
3.2.1. Overall Evolution Analysis of TC
Social network analysis indicators like the number of links, density and average degree are used to measure the overall evolution level of technology integration. Network density reflects the degree of network aggregation [18], whilst the density of co-occurring networks in the technical field denotes the degree of closeness amongst the technical fields participating in the TC. The value range is [0,1], the density of a complete network graph is 1, and the calculation formula is the actual number of connections in the co-occurrence network of the technical field and the maximum possible ratio of connections. Therefore, the number and density of links, in which n is the number of entire nodes, can be expressed as:
In the above formula, mij represents the total number of patents where patents i and j are fused, whilst lij represents fused patents i and j. If fusion occurs, the value is 1; otherwise, it is 0. n represents the patent type.
The number of links signifies the number of node connections in the network; a greater number of links entails a greater number of cross fusions between them. Network density denotes the closeness of the connections between the network nodes; the more connections between the network nodes denote a greater network density.
AverageD refers to the average of the degrees of all network nodes; it reflects the breadth of technology integration. The formula is:
Weight centrality refers to the sum of the number of times that the technical field co-occurs with the other technologies; it reflects the strength of the integration of the technical field. The average weighting degree denotes the average weight centrality of all network nodes. The formula is:
3.2.2. Evolutionary Analysis of the Core Nodes in TC
In convergence networks, there may be some nodes that actually control the networks. Due to their strategic positions and extensive relations with the other nodes, these nodes can be considered as core technology fields. Node strength is used to identify the core technology node [19,20]. Firstly, the unweighted average technical strength (UTS) and the weighted average technical strength (WTS) are computed. Using the ratio of these indicators, the patented node strength can be obtained. The formulae are as follows:
Here, mij represents the total number of patents where patents i and j are fused, whilst lij represents fused patents i and j. If fusion occurs, the value is 1; otherwise, it is 0. n represents the patent type.
3.2.3. Evolutionary Analysis of the Relationship between Important Nodes in TC
Also called the similarity coefficient, the Jaccard coefficient is used to compare similarity in sample sets. It is equal to the ratio of the sample set intersection to the sample set and is used to measure the link weight of the fusion between patents [9]. Its formula is:
The convergence network is comprised of links amongst different IPC or technology fields. The intersection of patents i and j represents the number of links between them, denoted as the number of fusions. The union of patents i and j represents the sum of the number of fusions of those patents—that is, the proportion of the number of links between those patents in the number of common links.
4. Empirical Analysis and Results
4.1. Data
Patent data are extensively used in TC research; in this paper, they are acquired from the Incopat patent database. Based on the patent and industry comparison system published by WIPO,(World Intellectual Property Organization)the IPC classification of the textile industry is shown in Table 1. From the patent classification number in Table 1, a total of 40,709 authorised patents were retrieved from 2002 to 2016. There are three types of patents: authorised patent, applied patent for invention and utility model patent. The reason for using an authorised patent in this paper is that its quality is generally high. Moreover, since there are only a few convergence patents before 2002, with most of them lacking typical significance, and because the authorisation of patents usually lags for two to three years, authorised patents after 2016 may not be complete. Thus, this paper adopts textile authorised patents from 2002 to 2016. After data processing, only one IPC number was removed, and the first four identical patents of IPC were eliminated; eventually, 20,511 convergence patents were obtained, accounting for 50.38% of the total number of patents. This signifies that more than half of the new technologies in the textile industry can be attributed to TC innovation.

Table 1.
Comparison of industry and International Patent Classification (IPC) classification (example).
4.2. Evolution on a Macro Level
To study the dynamic evolution of the TC network over time, based on the growth of the number of convergence technologies, the 2002–2016 period is divided into three consecutive stages. The first stage is from 2002 to 2006; the second is from 2007 to 2011; the third is from 2012 to 2016. According to patent and industry comparison standards, the mapping relationship amongst IPCs and technical fields has been established, and three TC networks with 35 nodes are drawn using UCinet.
Table 2 presents the attributes of the technological convergence network at each stage from a macro perspective. In terms of the number of links and cohesion, there are 28 links in the first stage, in which the density shows the sparseness of the network, with only 4.7% of all possible links. The number of links in the second stage increases by 1.5 times and the density rises to 0.073, which further strengthens network cohesion and indicates that the technological diversity of textile TC in this stage has further expanded. The number of links in the third stage is 51, and the density increases to 0.085, which enhances the cohesion network; this is possibly attributed to the specialisation beginning to be emphasised with the continuous development of industrial technology. The number of links in the third stage has basically maintained the number in the second stage, yet technological diversification has slowed down, and the position of the core technology centre has become prominent. Furthermore, the average degree (unweighted) in the first period is 0.834; in the third period, each technical field is connected to 3.785 other technical fields on average, which further depicts an increasingly complex TC.
Table 2.
Three-stage network properties.
Figure 1 illustrates the macro fusion network of the three stages. Specifically, the nodes and links in the micro-level networks indicate the relations of the technology fields, with different industries displayed in different colours. In addition, node size indicates the number of patents belonging to a corresponding technological field, whilst node label size signifies the magnitude of the centrality of the node, with the weight of the link proportional to the thickness of the link line.
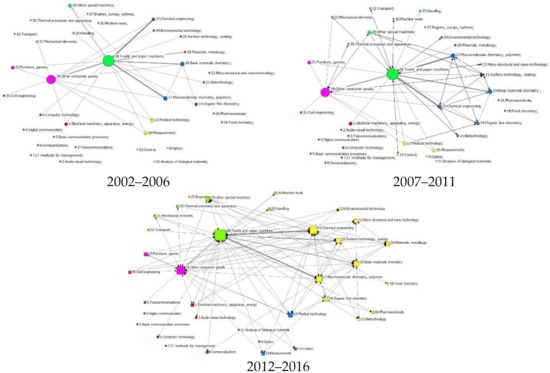
Figure 1.
Convergence network of the macro-technical field.
Table 3 shows the basic rankings of the three-stage Jaccard coefficient, depicting that the technical field integrated with textile technology is relatively stable. The top ten technical fields integrated with textile technology include chemical engineering (CE), macromolecular chemistry polymers (MCP), basic and material chemistry (BMC), other consumer products (OCP), surface technology and coating (STC), other special applications (OSA), pharmaceutical (PM), organic fine chemistry (OFC), materials and metallurgy (MM), and furniture and games (FG). Based on the table, CE has the closest relationship with textiles, with a Jaccard coefficient of 0.13; this is followed by MCP with w = 0.096, and BMC with a Jaccard coefficient of 0.061. Apparently, chemical technology is closely related to textile technology. Textile chemicals mainly refer to dyes and textile auxiliaries, which are vital to the upgrading and value enhancement of textiles.
Table 3.
Top 10 Jaccard coefficients between the technical fields.
The seventh in terms of the Jaccard coefficient is the integration of textile and pharmaceutical technology. Recently, the innovation of textile materials in the medical field has continued to break through, primarily focusing on medical auxiliary equipment like human organs. Indeed, research on human organs has been extensive, including blood vessels, artificial nerve catheters, artificial kidneys, lungs and liver. This has led to the rapid development of medical auxiliary equipment like gauzes, bandages, medical sutures and drug-loaded fabrics.
Notably, OCP ranks fourth in terms of the Jaccard coefficient. The ISI-OST-INPI standard classifies clothing technology in the technical field as “others”, which is consistent with the conclusion of the above macro-technology integration results. Integration of textiles and MM and FG is also amongst the top 10. This is related to the integration of textiles with emerging industries like national defence, medical and health, hence yielding the booming development of emerging textile equipment manufacturing in recent years.
4.3. Evolution on a Micro Level
To further observe which IPC4 are at the core of the convergent network, this paper constructs a co-occurrence network with IPC4 as the nodes, calculates the node strength and link coefficients, and analyses the core technical fields in the convergent network.
Since 2002, China’s textile technology has covered a vast range of technical fields, including raw materials, spinning, weaving, printing and dyeing process equipment, and fibre and textile physical and mechanical processing. There is a very clear trend of integration amongst obvious fields, which jointly promote the development of the textile industry towards high quality and automation.
From the network’s overall structure as depicted in Figure 2, the network in the first stage is relatively sparse, and the cross-penetration relationship between the domains is relatively small. Whilst the number of nodes in the second-stage network increases, the connections between the nodes have become more complicated. Meanwhile, the network relationship in the third stage is more complex and the IPCs involved are more abundant. Although the number of nodes has generally increased, the main fusion technology pairs are still equitable, signifying that the core technologies within the textile industry possess the characteristic of path dependence [7].
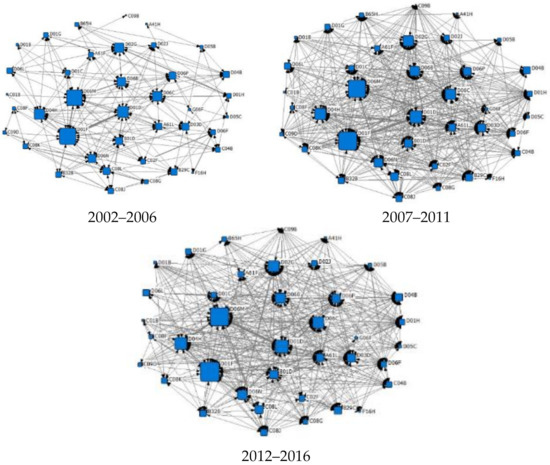
Figure 2.
Convergence network of the micro-technical field.
From the perspective of node strength, D01D (mechanical method or equipment for manufacturing artificial filaments, threads, fibres, bristles or belts) has the highest strength, followed by C09B (organic dyes or related compounds used to make dyes; mordant dyeing agent), D01H (spinning or twisting), and D01F (chemical characteristics of man-made filaments, threads, fibres, bristles or belts; equipment dedicated to the production of carbon fibres). Table 4 presents the top 10 technologies in terms of node strength in different stages. These technologies are considered to be the core technology areas of micro-technology integration.
Table 4.
Top 10 node strengths in each stage.
Table 5 provides the top 10 links in terms of the Jaccard coefficient, representing the technologies that are most closely related to textile technology. The links with the highest Jaccard coefficients for the three stages are D01F and D01D (textile machinery). D part represents the traditional textile technology category, D01D is textile machinery, and D01F includes equipment for producing carbon fibre. Nowadays, the production of various fabrics no longer entails simple spinning and weaving; instead, it involves textiles with high insulation and strength by incorporating nanotechnology, carbon fibre technology, and insulation technology. Therefore, research on carbon fibre equipment is the focus in these stages.
Table 5.
Top 10 Jaccard coefficients for each stage.
Other top-three links include D06P (dyeing or printing of textiles; dyeing of leather, fur or solid polymer materials of various shapes), C09B (organic dyes or related compounds used in dye manufacture), C08L (polymer compound composition), and C08K (inorganic or non-polymer organic materials as ingredients). C08 is an organic polymer compound. Since the beginning of the 21st century, high-performance chemical fibres have entered the field of special materials, thus becoming a significant component of material science, and strengthening R&D regarding chemical fibres.
Meanwhile, D06M (processing fibres, yarns, threads, fabrics, feathers or fibre products) and B32B (layered technology) such as CN108943892B, a kind of safety protective clothing, has five layers from outside to inside: a flame-retardant layer, an outer metal mesh layer, a damping layer, an inner metal mesh layer, and a flexible lining through the bimetal mesh layer. This structure improves impact resistance and safety protection of the protective layer, with the outer flame-retardant fire-resistant layer exhibiting a good fire protection effect.
5. Discussion
This paper contributes to a deepened understanding of TC, which has gained considerable attention from academicians and practitioners alike. Existing research objects involve several new industries and technical fields, yet there is no current research on textile technology integration. From the aspect of research content, there is inadequate literature on technology integration and evolution based on simultaneous macro- and micro-technology classification standards. Therefore, this study attempts to supplement existing research in terms of both research objects and research content, which can potentially fill in the gaps in existing research.
This study presents that TC has become prevalent in the textile field, similar to various technical fields involved in existing research [9,15,17]. Patent data analysis shows that more than half of the technologies in the textile field involve convergence technologies, signifying that measures should be undertaken to encourage R&D entities to actively partake in TC activities to lead the future technology paradigm. Moreover, to further strengthen TC and enhance independent innovation capabilities and core technological advantages of China’s textile industry, the government can advocate the transfer of labour-intensive links in the textile industry from China to Southeast Asian countries with relatively low labour costs, such as Vietnam.
This study has found that the density of the macro-technology integration network continues to increase over time. The technical fields that are closely related to the integration of textile technology include chemical engineering technology, pharmaceutical technology and material technology, implying that technology integration between the textile industry and those industries has become more frequent. Said technical integration should be further strengthened to integrate textiles with emerging industries, including national defence, medical care, transportation, energy and environmental protection. The micro-technology integration network presents the path-dependent characteristics of the textile industry technology integration in the proprietary technological field, as the integration of such technologies in the field accounts for the majority. The interaction amongst technologies can be considered as a potential industry convergence mechanism, as core technologies can help promote these interactions. The research results can provide guidance for determining the core technology and its strategic position, as well as the integration between the textile industry and other industries.
6. Conclusions
This article proposes a research framework for exploring the TC of textile from both macro and micro perspectives. Based on the standard industry classification system (ISI-OST-INPI) and the International Patent Classification System (IPC), a TC network is constructed, and the network indicators and the convergence evolution process are analysed. The conclusions are as follows:
- (1)
- TC has become a vital feature of the current textile industry technological innovation system. The evidence shows that TC began to spread at the beginning of the 21st century and has since continued to grow. In 2016, more than 50% of new technologies were attributed to technology integration, signifying that TC will become a prominently dominant trend in the future. This finding is consistent with the results of Jeong (2015) [9] based on his research of all fields, and of Kim (2014) [18] on the field of printed electronics technology.
- (2)
- The density of the macro TC network has continued to increase over time, alongside an increase in average integration depth and breadth. Industrial technologies that play a significant role in the integration of textile technology include chemical engineering technology, pharmaceutical technology and material technology. This is similar to the conclusions of previous literature in other technical fields. TC has evolved into a more complex and heterogeneous form, along with an increase of the cross-domains [9,10,11].
- (3)
- The micro network presents the path-dependent characteristics of the textile industry in the proprietary technological field. Core technologies include D01D, D01F and D01H, with the D01D–D01F relation having the strongest fusion. Technology integration with the chemical engineering department is apparent, such as C09B. This is just like what Baines has said: the role of chemical science in promoting and improving operations is at least the same as that of mechanical science in promoting and improving various operations in the manufacturing industry [21].
The above conclusions indicate that governments and enterprises should take relevant measures to promote TC, thereby encouraging R&D entities to actively participate in technology integration to lead the future technology paradigm. These findings can help in policy decisions at the national level, or strategies at the company level, in order to determine which technologies are involved in facilitating convergence. The classification structure of technologies and their convergence patterns as obtained through this analysis can provide inspiration for the research funding framework. Such results provide a policy direction for supporting technological development from a TC perspective and help research institutions, industries and academia to focus their research and funding on these integrated core technology areas.
Although this research has some pertinent contributions, it also has certain limitations that necessitate further research. First, the data analysis is limited to patent data. Although patents represent the largest and most widely used data sources, there are also other valuable data resources. For future studies, various data sources like literature data need to be integrated to obtain valuable information. Secondly, the prediction ability of the applied methods is relatively weak. These methods can present only the existing important fusion technology pairs, whilst the prediction of future trends needs to be further strengthened. For instance, link forecasting methods can help improve the effects of analysis results on future predictions. Finally, textile technology covers several fields; since only an overall analysis is conducted, a subdivision of technology fields may be necessary for further research.
Author Contributions
Conceptualisation, Q.X. and H.C.; methodology, Q.X. and H.C.; software, Q.X.; validation, Q.X. and H.C.; formal analysis, Q.X.; investigation, Q.X. and H.C.; resources, Q.X. and H.C.; data curation, Q.X.; writing—original draft preparation, Q.X.; writing—review and editing, Q.X. and H.C.; visualisation, H.C.; supervision, H.C.; project administration, H.C.; funding acquisition, H.C. All authors have read and agreed to the published version of the manuscript.
Funding
This research was funded by The Funding of National Natural Science Foundation of China, grant number 71473228.
Institutional Review Board Statement
Not applicable.
Informed Consent Statement
Not applicable.
Data Availability Statement
The data presented in this study are openly available at (https://www.incopat.com (accessed on 16 February 2020)).
Acknowledgments
The authors acknowledge all those who participated in the innovation management team of Zhejiang Sci-Tech University.
Conflicts of Interest
The authors declare no conflict of interest.
References
- Kim, J.; Lee, S. Forecasting and identifying multi-technology convergence based on patent data: The case of IT and BT industries in 2020. Scientometrics 2017, 111, 47–65. [Google Scholar] [CrossRef]
- Gauch, S.; Blind, K. Technological convergence and the absorptive capacity of standardisation. Technol. Forecast. Soc. 2015, 91, 236–249. [Google Scholar] [CrossRef]
- Geum, Y. Technological Convergence of IT and BT: Evidence from Patent Analysis. Etri J. 2012, 34, 439–449. [Google Scholar] [CrossRef]
- Kose, T.; Sakata, I. Identifying technology convergence in the field of robotics research. Technol. Forecast. Soc. 2019, 146, 751–766. [Google Scholar] [CrossRef]
- Curran, C.; Leker, J. Patent indicators for monitoring convergence—Examples from NFF and ICT. Technol. Forecast. Soc. 2011, 78, 256–273. [Google Scholar] [CrossRef]
- Han, E.J.; Sohn, S.Y. Technological convergence in standards for information and communication technologies. Technol. Forecast. Soc. 2016, 106, 1–10. [Google Scholar] [CrossRef]
- Bröring, S.; Martin Cloutier, L.; Leker, J. The front end of innovation in an era of industry convergence: Evidence from nutraceuticals and functional foods. R&D Manag. 2006, 36, 487–498. [Google Scholar]
- Kim, K.; Jung, S.; Hwang, J. Technology convergence capability and firm innovation in the manufacturing sector: An approach based on patent network analysis. R&D Manag. 2019, 49, 595–606. [Google Scholar]
- Jeong, S.; Kim, J.; Choi, J.Y. Technology convergence: What developmental stage are we in? Scientometrics 2015, 104, 841–871. [Google Scholar] [CrossRef]
- Kwon, O.; An, Y.; Kim, M.; Lee, C. Anticipating technology-driven industry convergence: Evidence from large-scale patent analysis. Technol. Anal. Strateg. 2020, 32, 363–378. [Google Scholar] [CrossRef]
- Caviggioli, F. Technology fusion: Identification and analysis of the drivers of technology convergence using patent data. Technovation 2016, 55–56, 22–32. [Google Scholar] [CrossRef]
- Karvonen, M.; Kässi, T. Patent citations as a tool for analysing the early stages of convergence. Technol. Forecast. Soc. Change 2013, 80, 1094–1107. [Google Scholar] [CrossRef]
- Athreye, S.; Keeble, D. Technological convergence, globalisation and ownership in the UK computer industry. Technovation 2000, 20, 227–245. [Google Scholar] [CrossRef]
- Harianto, F.; Pennings, J.M. Technological convergence and scope of organizational innovation. Res. Policy 1994, 23, 293–304. [Google Scholar] [CrossRef]
- Song, B.; Suh, Y. Identifying convergence fields and technologies for industrial safety: LDA-based network analysis. Technol. Forecast. Soc. 2019, 138, 115–126. [Google Scholar] [CrossRef]
- Schnaars, S.; Thomas, G.; Irmak, C. Predicting the Emergence of Innovations from Technological Convergence: Lessons from the Twentieth Century. J. Macromark. 2008, 28, 157–168. [Google Scholar] [CrossRef]
- Choi, J.; Jeong, S.; Kim, K. A Study on Diffusion Pattern of Technology Convergence: Patent Analysis for Korea. Sustainability 2015, 7, 11546. [Google Scholar] [CrossRef]
- Scott, J. Social Network Analysis—A Handbook, 2nd ed.; Sage Publications: Thousand Oaks, CA, USA, 2000. [Google Scholar]
- Kim, M.; Kim, C. On A Patent Analysis Method for Technological Convergence. Procedia—Soc. Behav. Sci. 2012, 40, 657–663. [Google Scholar] [CrossRef]
- Lee, C.; Park, G.; Kang, J. The impact of convergence between science and technology on innovation. J. Technol. Transf. 2018, 43, 522–544. [Google Scholar] [CrossRef]
- Baines, E. History of the Cotton Manufacture in Great Britain; Cambridge Books: Cambridge, UK, 1966; Volume 34, pp. 413–420. [Google Scholar]
Publisher’s Note: MDPI stays neutral with regard to jurisdictional claims in published maps and institutional affiliations. |
© 2021 by the authors. Licensee MDPI, Basel, Switzerland. This article is an open access article distributed under the terms and conditions of the Creative Commons Attribution (CC BY) license (http://creativecommons.org/licenses/by/4.0/).