Article

On the Way to Integrate Increasing Shares of Variable Renewables in China: Experience from Flexibility Modification and Deep Peak Regulation Ancillary Service Market Based on MILP-UC Programming

1
School of Economics and Management, North China Electric Power University, Beijing 102206, China
2
Beijing Key Laboratory of New Energy and Low-Carbon Development, North China Electric Power University, Beijing 102206, China
3
Research Center for Beijing Energy Development, Beijing 102206, China
*
Author to whom correspondence should be addressed.
Sustainability 2021, 13(5), 2446; https://doi.org/10.3390/su13052446
Submission received: 26 January 2021 / Revised: 18 February 2021 / Accepted: 21 February 2021 / Published: 24 February 2021
(This article belongs to the Special Issue Energy Efficiency Assessment and Resource Optimization)

Abstract

:
China has declared ambitious carbon emission reduction targets and will integrate increasing shares of variable renewables for the next decades. The implementation for flexibility modification of thermal power units and deep peak regulation ancillary service market alleviates the contradiction between rapid capacity growth and limited system flexibility. This paper establishes three flexibility modification schemes and two price rules for simulation and proposes an analysis framework for unit commitment problem based on mixed-integer linear programming to evaluate the policy mix effects. Results confirm the promoting effects of flexibility modification on integrating variable renewables and illustrate diverse scheme selections under different renewables curtailment. Particularly, there is no need for selecting expensive schemes which contain more modified units and more developed flexibility, unless the curtailment decrement is compulsorily stipulated or worth for added modification cost. Similarly, results also prove the revenue loss compensation effect of deep peak regulation ancillary service market and illustrate diverse price rule selections under different curtailment intervals. Price rule with more subdivided load intervals and bigger price differences among them is more effective, especially under the higher requirement for curtailment rate. Therefore, the government should further enlarge flexibility modification via but not limited to more targeted compensation price, while generators should further consider a demand-based investment.

1. Introduction

China has announced its carbon emission reduction targets for 2030 and 2060. There are few options for China’s power system to fulfill these targets except two alternatives. One is to integrate increasing shares of generations from variable renewable energy (VRE) [1]. The other is to make clean and effective utilization of thermal power units, which have been accounting for a significant share of China’s power supply [2]. The former inevitably produces higher demand for system flexibility, which is mainly provided by thermal power units in China [3]. The more VRE is integrated, the lower load rate these inflexible units operate at, which hinders higher operating hours, longer life cycle, and better energy efficiency for thermal power units recommended by the latter [4].
To alleviate this contradiction, the Chinese government has retrofitted thermal power units to be more flexible with lower minimum load levels, faster ramping rate, and shorter startup-shutdown time by a series of flexibility modification schemes since 2016 [5,6]. Prior researches, therefore, evaluate whether the thermal power units are modified to be flexible enough by adopting these schemes [7,8]. Flexibility modification of thermal power units has been proved to be the most feasible approach for China to add power system flexibility in the short term [9,10]. It has an advantage in lower lead times and costs compared to investing in gas-fired peak regulation power stations and pumped storages [11]. Until the end of 2019, about 57.75 MW flexibility modification of thermal power units had been completed, accounting for 25% of the total modification plan [12].
Financial incentives have been provided for coal power plants to actively go flexible, represented by the release of the deep peak regulation ancillary service market since 2017 [13]. It is a motivation schedule for reducing the power output of thermal power units with different compensation prices for several load intervals [14]. This new revenue stream has been important in offsetting revenue losses for thermal power units due to their lower operating hours [15]. In 2019, thermal power units released 18.9 billion kWh electricity for adding VRE consumption, merely driven by deep peak regulation ancillary services market [16].
However, thermal power generators are not motivated enough to participate in implementing flexibility modification and deep peak regulation themselves, not only due to insufficient compensation and uncertain long term expectations for this incentive policy but also thanks to increasing risks for safe and economical operation and decreasing energy efficiency [12]. Besides, there is still a problem of insufficient funds for renovation since these generators have been faced with tremendous operational pressure in recent years, considering their continuous declines in utilization hours.
Therefore, the market design of this financial aid needs to be further improved so that more flexibility modifications could be implemented [17]. Before that, it is crucial to determine when to start up or shut down power units and how to dispatch their power outputs to meet system power demand and spinning reserve requirements while satisfying generation constraints over a specific time series [18,19]. These problems are traditionally called unit commitment (UC).
The most popular solution technique for this large-scale, mixed-integer, combinatorial and nonlinear programming problem is mixed-integer linear programming (MILP) [20,21]. The efficient optimized commercial solvers and various toolboxes developed for this technique lead to its flexible and convenient application [22]. A typical modeling framework called MILP-UC was developed in 2006 to solve UC problems by MILP techniques [23]. Based on this research, this paper further applies this model in China’s policy scenarios, but the objective function and constraints of this MILP-UC model are remodified according to the Production Simulation of New Energy Power System developed by China Electric Power Research Institute [24].
This paper aims to seek out a pathway for future high VRE integration based on practical experience in flexibility modification of thermal power units and the deep peak regulation ancillary service market. The policy effects on timely completion for planned VRE integration, adequate motivation for thermal power units to implement flexibility modification, and activeness for modified units to participate in deep peak regulation are evaluated. The analysis framework highlighted in this study contains MILP-UC modeling, which is applied to acquire economical dispatching results. Three flexibility modification schemes and two price rules for the deep peak regulation ancillary service market are established and simulated on this basis. The comparisons among three modification schemes and sensitivity analysis indicate whether and when a scheme ought to be adopted and how flexible a modification scheme should become. The discussions towards added revenue from a single market, a dual market, or an added “cash inflow” including reduced generation cost for each scheme under typical VRE curtailment rate explain which price rule applies to what situation. Results provide compelling evidence for the promoting effect of this policy mix on integrating VRE and suggest that this analysis framework appears to be effective in selecting flexibility modification schemes and future policy optimization.
The remaining sections are outlined as follows. Section 2 introduces a brief description of the MILP-UC formulation, highlights an analysis framework based on this modeling, and establishes several policy scenarios for simulation. In Section 3, the results for flexibility modification and deep peak regulation ancillary service market are discussed in detail. Section 4 concludes.

2. Methodology

2.1. MILP-UC Formulation

2.1.1. Objective Function

To model flexibility modification and deep peak regulation, the basic power dispatching should be firstly simulated. The optimal dispatching results acquired from MILP-UC formulation contain not only startup and shutdown schedules but also continuous power output series for the set period. These results provide references for the electricity control center to order all integrated power units to operate in a systematically economical way before or right on a typical operating day. Considering that the operation cost of renewable energy generators is very low, the objective function applied in this paper is to minimize the overall operation cost of thermal power unit commitment and could be illustrated as Equation (1),
Min t = 1 T j = 1 J C j o t + S j o n t C j S U + S j o f f t C j S D ,
where C j o t is the operation cost for class j thermal power unit at time t (the explanation for j and t remains the same bellow), C j S U and C j S D are the cost for one single startup or shutdown, S j o n t and S j o f f t are the number of startup and shutdown thermal power units.
The thermal power units in China mainly consist of coal-fired power units, and their operation costs mainly consist of coal consumption cost. The coal consumption cost is usually expressed as a quadratic function of the units’ power output, illustrated as Equation (2),
C j o t = a j + b j P j t + c j P j t 2 ,
where a j , b j , and c j are coefficients of the quadratic operation cost function, and P j t is the power output of the thermal power unit, expressed as a sequence for continuous 24 h in a typical day.

2.1.2. Constraints

  • Power balance constraints
The power output of unit commitment must be involved in instantaneous power balance.
j = 1 J P j t S j t + P w t + P p v t + P o t h t + i I L i t = P l t ,
where P j t , P w t , P p v t , P o t h t is the power output of thermal power unit, wind power unit, photovoltaic (PV) power unit, and other kinds of normal units (such as nuclear power unit and hydropower unit), S j t is the number of the operating thermal power unit, L i t is the power input from transmission line i, I is the number of the transmission line, and P l t is the electricity load.
  • System spinning reserve constraints
The power system must keep a reserve capacity not only for tracking the fluctuation of electricity load and VRE power output but also for avoiding effects from power units’ accident breakdown and planned renovation.
j = 1 J P j , m a x t S j t P w t P p v t P l t P r e t j = 1 J P j , m i n t S j t + P w t + P p v t P l t N r e t ,
where P j , m a x t and P j , m i n t are the maximum and the minimum technical power outputs, and P r e t and N r e t are the positive and the negative system spinning reserves.
  • Power output and ramp rate constraints
Each thermal power unit has a minimum power output and a ramping rate due to technical limits. The former determines its adjustable range, while the latter determines its adjustable speed.
0 P j t P j , m a x t P j , m i n t S j t P j t = P j , m i n t S j t + P j t P j t + 1 P j t P j , u p P j t P j t + 1 P j , d o w n ,
where P j t is the adjustable power output ready to be optimized, and P j , u p and P j , d o w n are the adjustable speed per hour for increasing power output or decreasing power output.
  • Transmission capacity constraints
The trans-regional electricity transmission must satisfy the capacity limit of transmission lines. The transmission power inflow is usually set to be positive while power outflow is set to be negative.
L i , m i n L i t L i , m a x ,
where L i , m i n and L i , m a x are the minimum and the maximum capacity limits for the transmission line.
  • Number constraints of operating unit
The number of operating units should not exceed its total amount.
0 S j t S j , m a x ,
where S j , m a x is the total number of type j thermal power units.
  • Minimum startup and shutdown time constraints
0 Y j t + Z j t + 1 + Z j t + 2 + + Z j t + k j o n 1 0 Z j t + Y j t + 1 + Y j t + 2 + + Y j t + k j o f f 1 ,
where Y j t and Z j t are both 0–1 variable (for Y j t , “0” means no startup order, and “1” means startup order is given; for Z j t , “0” means no shutdown order and “1” means shutdown order is given, emphasizing that the unit must continuously operate for a minimum period illustrated as k j o n once it is started up and shut down for a sustaining period illustrated as k j o f f .
  • The logical constraint of units’ operating status
Z j t S j , m a x S j t S j t 1 Y j t S j , m a x ,
This constraint stipulates that the number of operating units must increase once the dispatch center gives a startup order and decrease once the dispatch center gives a shutdown order.
  • Number constraints of startup/shutdown unit
S j o n t = S j t S j t 1 S j o f f t = S j t 1 S j t ,
This constraint stipulates the relationship between the number of startup or shutdown units at a certain time and the difference in operating unit numbers at adjacent time nodes.
  • Power output constraints of wind and PV power units
The power output of wind and PV power units should not exceed their maximum technical power output, either.
0 P w t P w * t 0 P p v t P p v * t ,
where P w * t and P p v * t are the maximum technical power output of wind and PV power units.
  • Other constraints
Operating constraints for other normal units such as hydropower units and nuclear power units are summarized as a general function here but not applied in this paper. It could be further specified to pumped storage, hydropower with storage capacity, and combined heat and power (CHP) units according to the Production Simulation of New Energy Power System developed by China Electric Power Research Institute [24]. More detailed constraints should be involved once the performance of these units is further considered.
P o t h t F o t h x ,

2.1.3. Solving Method

The decision variables of this model consist of two parts. The former contains two continuous variables including power output of VRE unit and power output of thermal power unit. The latter includes an integer variable, which is the number of operating power units. This optimization model is a typical MILP model and could be solved by CPLEX or Gurobi solver in MATLAB software combined with the YALMIP toolbox [25]. In this paper, the high-performance mathematical programming solver called CPLEX is applied for speeding up mixed integer programming. The YALMIP is a toolbox for better modeling and optimization in MATLAB. Both operating status and power output of the unit are acquired from the optimization, while the optimal value of the objective function is the minimum generation cost of all unit commitments in a typical day.

2.2. Policy Simulation and Evaluation

2.2.1. Analysis Framework Based on MILP-UC Formulation

Further introduction of simulated policy scenarios based on the economical dispatching result acquired from MILP-UC formulation is highlighted in this paper. Every dispatching determines a 24 h time–series startup status and power output schedule in a typical day and a certain minimum generation cost of power unit commitment. If there is no other external constraint, each optimization result gives out the best VRE curtailment rate in the most economical way. The total generation cost of power unit commitment inevitably increases if a lower curtailment rate of VRE must be achieved. Under each stipulated utilization rate (or curtailment rate), this model can give out the most economical dispatching result with corresponding minimum generation cost. There is usually a maximum limit for utilization rate (or minimum limit for curtailment rate) due to technical and security constraints. On this basis, if important point data for operation cost and curtailment rate in different policy scenarios are collected, the inside connection of these variables leads to more interesting results. Meanwhile, comparison among the most economical dispatching results for different scenarios also contributes to evaluating policy effects.
In this paper, two policy scenarios are established. The first one is the flexibility modification of thermal power units. It is issued in China mostly because the limited flexibility of the power system hinders a high share of VRE integration. Once the inflexible thermal power unit, which accounts for more than 70% of China’s power supply structure, is retrofitted to enjoy a larger adjustment range, faster adjustment speed, and shorter startup-shutdown time, more VRE could be integrated and consumed. The second one is deep peak regulation ancillary service. It is released in China to provide thermal power plants with incentives to go flexible. The more flexible these power units become, the more compensation revenue they acquire from both the electric energy market and the deep peak regulation auxiliary service market. The former aims to break through technical limitations of power system flexibility while the latter aims to offset revenue losses of thermal power units due to lower operating hours. Both policies are quantitatively simulated and evaluated based on the economical dispatching results.

2.2.2. Basic Assumptions and Data

In this case, there are several basic assumptions. For an established power system, this case assumes that no power grid frame constraint is considered so that the power flow distribution and the power balance for buses and branches could have simple regional thinking. For power supply structure, this case does not consider hydropower units (including pumped storage), nuclear power units, CHP units, and energy storage. The unit commitment only contains VRE units and thermal power units (non-cogeneration units). Considering that the operating cost of VRE units is too low to be ignored, the total generation cost for unit commitment could be expressed as a quadratic function of fuel consumption. For electricity balance, the theoretically predicted 24 h time–series power outputs for VRE and electricity load in a selected typical day are illustrated in Table A1. For the electricity market, electricity generated by thermal power unit acquires a revenue, and its price is collectively set to be 0.28 CNY per kWh regardless of the load rate. For the deep peak regulation auxiliary service market, the thermal power unit could acquire compensation revenue when its load rate is lower than 50% of rated capacity.
Particularly, the following three assumptions and data are further illustrated.
  • Parameters of thermal power units
In this case, there are ten thermal power units, and parameters include maximum and minimum technical power output, ramping rate, minimum startup and shutdown time, three coefficients for quadratic operation cost function, and the cost for a single startup. The shutdown cost is not considered in this case. Data are collectively quoted from a previous study [23]. Parameters of thermal power units are illustrated in Table 1.
  • Flexibility modification schemes for thermal power units
This paper involves three flexibility modification schemes. Scheme 1 is to modify a single unit (Unit No.1) to cut its minimum load rate down to 16% of rated capacity, to speed up ramping rate by 67%, and to cut both startup and shutdown time to half, which represents the most flexible level a thermal power unit could achieve under present technological limits. Scheme 2 is relatively realistic to be adopted, with the minimum load rate for a single unit (Unit No.2) adjusted to 25% of its rated capacity, while the ramping rate is sped up by 16.7%, and startup or shutdown time is cut down by 25%. Scheme 3 aims to modify both inflexible thermal units (Unit No.1 and Unit No.2), where each is retrofitted as with the above two schemes. All these schemes are illustrated in Table 2.
  • Price rules for the deep peak regulation auxiliary service market
The most important part of the market design is to formulate a complete economical motivation mechanism. As for the deep peak regulation market established in this case based on practical experience from Northeast China, this mechanism is led by the compensation price. The price interval is set in parallel with different load rate intervals of thermal power units and provides an upper limit of the actual trading price. For instance, when dispatched power output for a thermal power unit in Jilin province is below 50% of its rated capacity, further in-depth peak regulation is no longer obligatory. If the load rate is below 30%, the compensation price is set to be between 0.4 and 1 (CNY/kWh), while the price interval is set to be 0 to 0.4 (CNY/kWh) if the load rate surpasses 30% but is still lower than 50%. Revenue comes from both the electricity market and the peak regulation market. For the former, it can be normally calculated by generated electricity and electricity price (0.28 CNY/kWh), but for the latter, it is calculated by absent generated electricity compared with the electricity generated when the load rate is 40% or 50% and corresponding compensation price. In contrast, there is no compensation when the load rate is higher than 50%, as corresponding generated electricity only participates in the electricity market.
In this case, two price rules for the deep peak regulation market are considered, as illustrated in Table 3. For price rule A, the compensation price is uniformly set to be 58.3 USD per MWh (exchange rate of CNY to USD is set to be 0.1458) regardless of load rate. For price rule B, the price interval for load rate between 30% and 50% is set to be 0 to 58.3 USD/MWh, while the price interval for load rate between 0 and 30% is set to be 0 to 116.6 USD/MWh.
To reveal the price motivation mechanism, this paper firstly combines curtailment rate intervals achieved by proposing three modification schemes and a no modification one and collectively choosing a common interval of curtailment rate. Five typical values for curtailment rate are picked out: 5.4%, 6.1%, 6.8%, 7.6%, 8.3%. For each exact curtailment rate, the values of the following variables are collectively calculated: the minimum generation cost and the 24 h time–series dispatching result with power output and startup status before or after three modification schemes are adopted. Then, the 24 h time–series power output is separately compared with the related one in the basic scheme (no flexibility modification). If the summation of 24 differential value between two series of power output is positive, this would certainly add benefits to the electricity market. Considering the deep peak regulation auxiliary service market, for the added or the reduced power output connected with “lower than 30%” or “between 30% and 50%”, computation progress should involve adjustments according to the load rate levels that power units operate at. In this case, both the added electricity for taking part in the electricity market and the released one for deep peak regulation auxiliary service market are calculated.

2.3. Feasibility, Rationality, and Novelty of this Methodology

This scenario-based study is a fundamental part of our ongoing research for activating VRE integration in China, aiming to provide a continuously deeper analysis including more data with a series of optimization tools, and consists of two important topics. The first one is to simulate the basic operation for the actual power system of China. The other is to introduce policy scenarios and evaluate their effects under different conditions. An important issue for the former has always been the behavioral validity, which demonstrates whether the simulation results from developed modeling reflect practical operation in the actual world [26,27]. As for the latter, researchers have concentrated on illustrating the influence brought by diverse policies ready to be or that have been implemented from a more subdivided dimension [28,29,30].
Typical analysis methods for power system simulation are represented by multi-area production simulation (MAPS), Balmorel, Energy Plan, Wilmar Planning Tool, multi-energy power system operation simulation, and renewable energy production simulation (REPS) [31,32,33,34]. These tools have more advantages in mathematical precision and powerful functions and are good at engineering-oriented long period simulation for a large-scale regional power system. In particular, the last two of these tools, separately developed by China Electric Power Planning and Engineering Institute and China Electric Power Research Institute, are especially suitable for China cases [24]. However, these methods usually have strict requirements for massive data and are not friendly to academic researchers who have difficulty in acquiring some of the boundary condition data. This circumstance is especially prominent for China researchers due to insufficient data availability. Thus, unlike engineering applications, academic studies pay more attention to basic optimization modeling and complex solving algorithms [35,36]. The randomness and the volatility of VRE power output are considered, and more recent state-of-the-art research concentrates on distributed robust optimization for real-time balanced scheduling considering future high VRE penetration [37,38,39]. Meanwhile, represented by policy evaluations for unique China cases based on dynamic computable general equilibrium model and evolutionary game theory combined with system dynamics, the internal economic logic for macro level and industry level and tradeoffs among different energy market subjects have been taken into more consideration [40,41].
Compared with these engineering and academic methods, the MILP-UC modeling applied in this paper reveals the basic solving principle for simulating and optimizing power system operation, though there is an obvious gap in methodology complexity. It could be successfully operated and run in software with less boundary condition data and occupies a core position in further methodology modification with more system complexity and data requirements. The results acquired from this modeling could simply reflect the relationship among studied objects and the evolution trend for targeted variables. Therefore, it would provide fundamental references for further modeling improvement, future policy design, policy evaluation, and optimization. Besides, the analysis framework based on optimization results from MILP-UC modeling collectively considers removing technical limitation by flexibility modification and increasing economic incentives by the deep peak regulation auxiliary service market. It also highlights generation cost and total revenue differences in detail policy scenarios under several curtailment rates, VRE integrations, modification schemes, and price rules. Thus, this analysis framework gives out a creative idea for promoting the implementation of this policy mix while ensuring its technical economy, which could be a reference for balancing the interests of government and power generators.
This paper provides a detailed illustration for adequate boundary conditions, valid logical structure, and consistent dimensions of all formulations based on typical MILP-UC modeling and REPS developed by the China Electric Power Research Institute, which has been proved to be feasible by many studies or been successfully applied for engineering cases. Each rational economical dispatching result with both startup plan and power output schedule under different policy scenarios is collected and listed in Table A2. All these operation results are acquired under strict calculation based on the official data source to guarantee their structural validity [42,43]. The policy evaluation is combined with the actual application evidence in China. The modification schemes and the price rules are selected according to different requirements for VRE integration and curtailment rate. All these analysis results are compared with other similar studies, and actual policy implementation is briefly introduced to provide a further demonstration for behavioral validity [16,24].

3. Results and Discussions

3.1. Flexibility Modification of Thermal Power Units

3.1.1. Comparison among Three Modification Schemes

The flexibility performance of a power unit is determined by its minimum load rate, ramping rate, startup time, and shutdown time. Thus, flexibility modification aims to retrofit thermal power units (especially coal-fired power units) to occupy a higher regulation depth, to be quickly started, adjusted, and stopped.
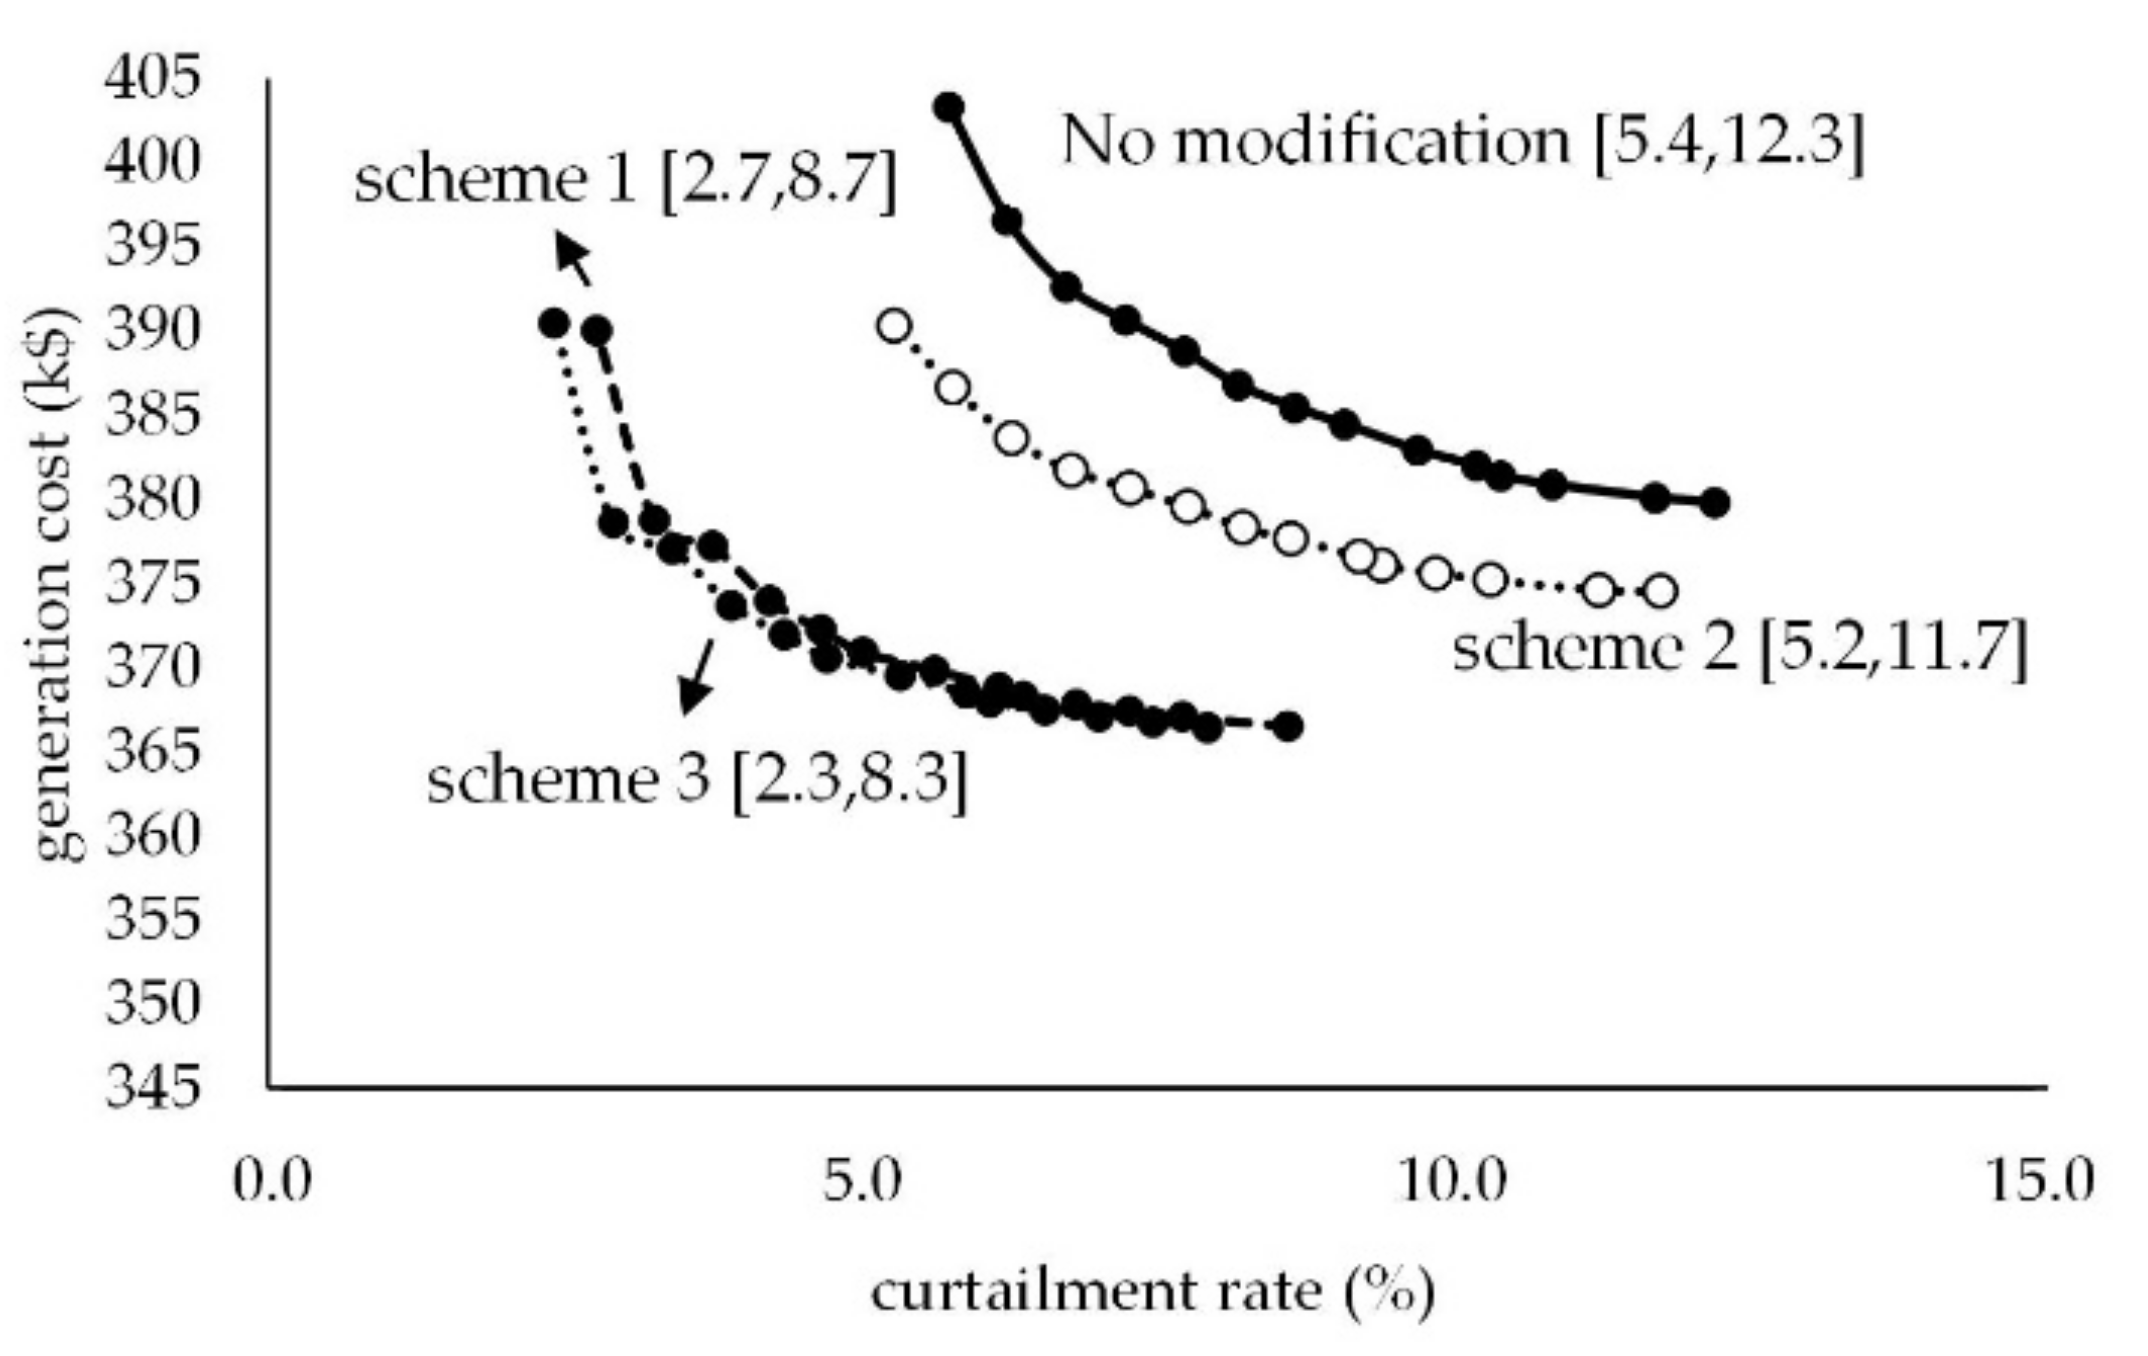
As illustrated in Figure 1, the more flexible the thermal power units become, the lower the curtailment rate is. Under the most economical dispatching, each scheme could realize the minimum generation cost under a certain curtailment rate. These certain rates for scheme 1 and scheme 3 achieve 8.7% and 7.9%, separately reduced by 3.6% and 4.4% compared with the basic scheme. In contrast, the same decrease fulfilled by scheme 2 is only 0.6%. Thus, scheme 3 and scheme 1 inevitably bring more VRE integration than scheme 2. Each scheme has a certain curtailment interval, which means curtailment rate value must be involved in this interval once the scheme is adopted. The minimum limit of interval means the lowest curtailment rate this scheme could achieve, while the maximum limit of interval means the best curtailment rate with a minimum generation cost. These intervals are marked beside corresponding curves in Figure 1. Interval length as well as maximum and minimum interval limits become lower from “no modification”, “scheme 2”, and “scheme 1” to “scheme 3”.
Under a certain curtailment rate, three modification schemes all enjoy apparent drops in generation cost compared with the basic one, as shown in Figure 1. As the curtailment rate drops down, the increased rate of generation cost for each scheme keeps going up. This is more prominent for scheme 1 and scheme 3. When the curtailment rate is below 5%, the generation cost explosively grows and reaches an extremely high floor. When it is between 5% and 10%, the generation cost drops with the increase of curtailment rate more slowly. However, the generation cost for scheme 2 and the basic scheme without modification during curtailment rate interval from 5 to 10% declines faster. For curtailment rate above 10%, scheme 2 and the basic one could achieve a minimum and stable generation cost.

3.1.2. Sensitivity Analysis

  • VRE integration
China plans to supply an increasing share of its generation from VRE. Provinces across mainland China have different electricity supply structures. For some provinces near the national load center, such as Guangdong province, the VRE integration is so low that the fluctuation of VRE power output cannot influence the dispatching result. In contrast, for some provinces near the VRE resources in Northeast and Northwest China, the instantaneous power output for VRE could achieve 80% of its consumption load, which can easily affect the dispatching results of unit commitment.
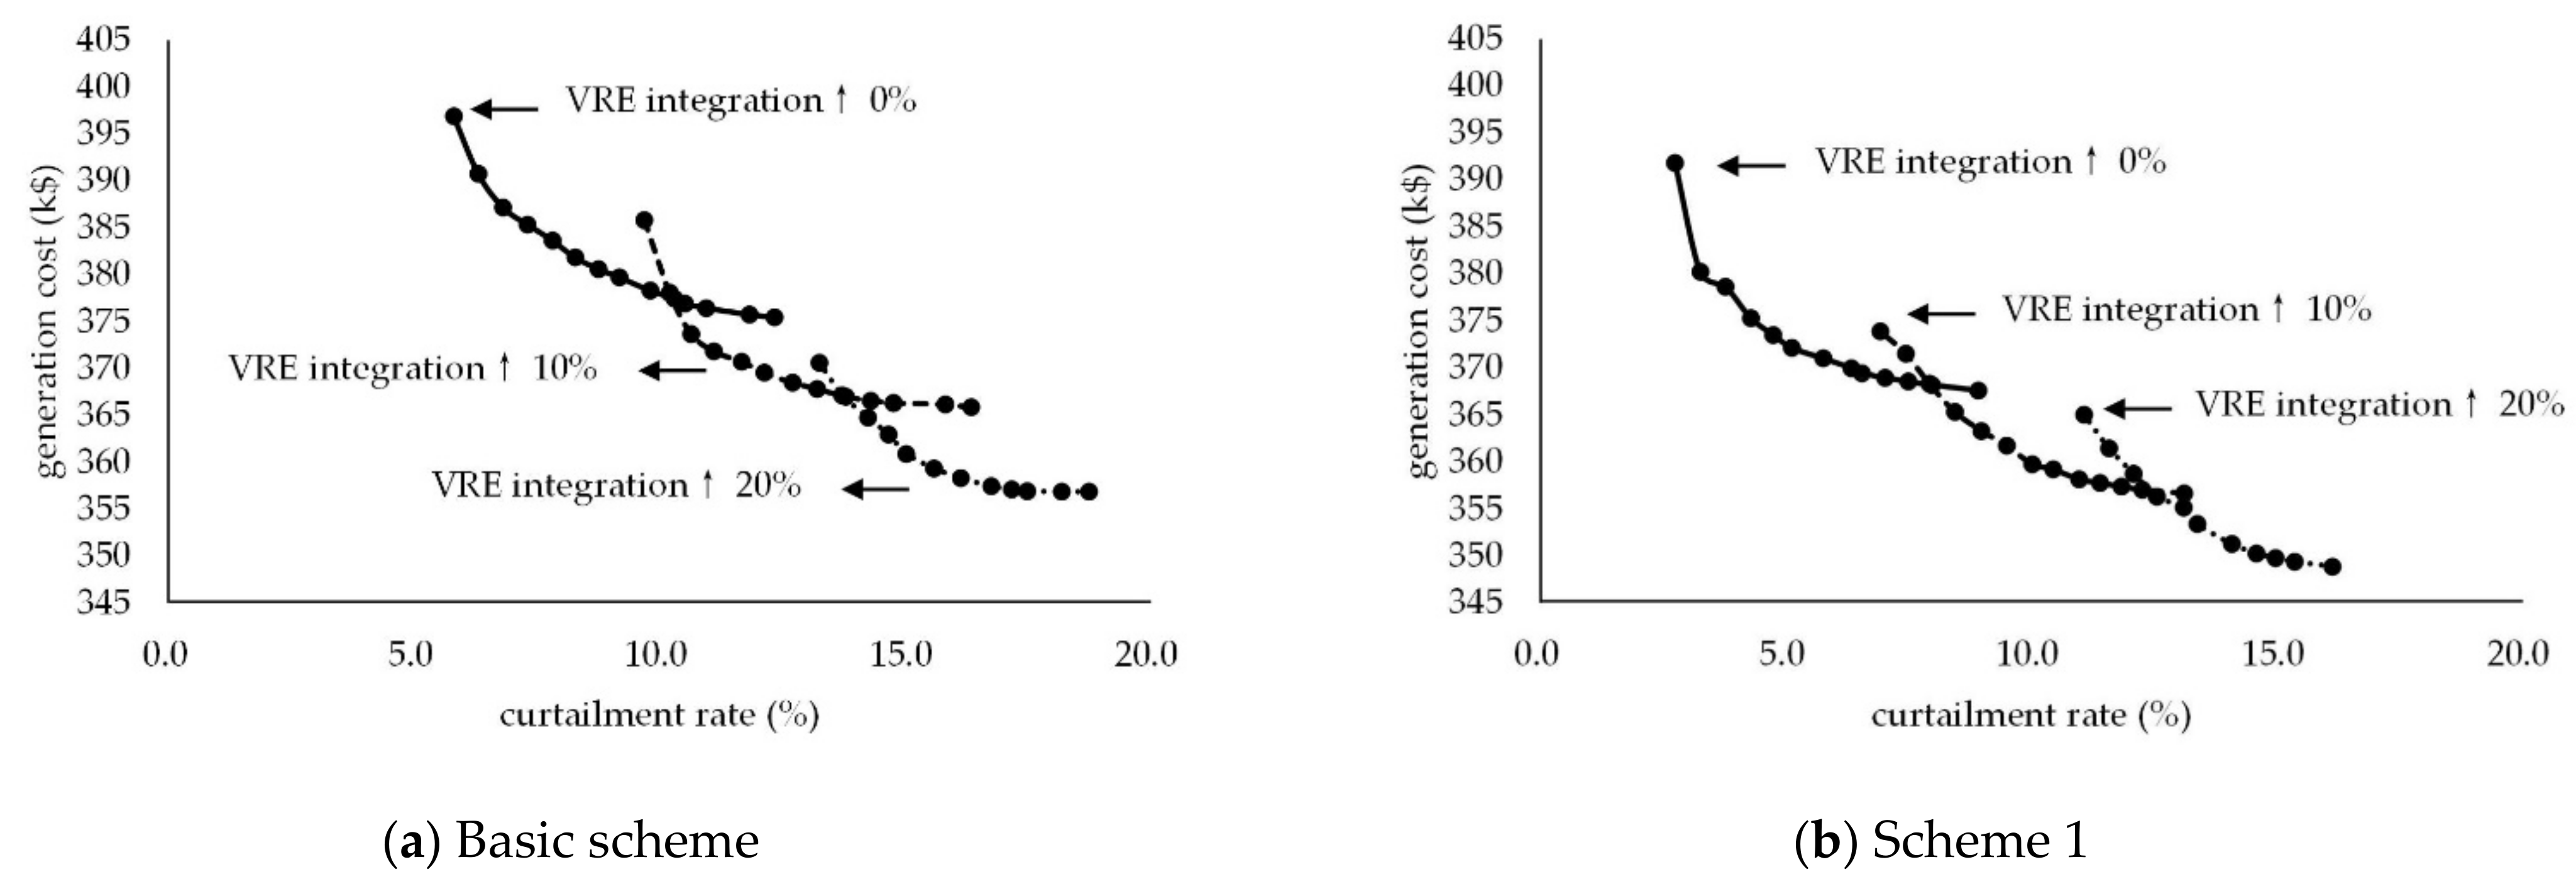
A high share of VRE integration is considered in this case. As illustrated in Figure 2, when the VRE integration level increases by 10%, the total generation cost for both schemes drops; meanwhile, the curtailment rate becomes higher. This circumstance becomes more obvious if the VRE integration level increases by 20%.
The curtailment interval varies after flexibility modification, as shown in Table 4. The minimum and the maximum interval limits and the interval length for scheme 1 become smaller. The decrease for these two limits and interval length from the basic scheme to scheme 1 tends to be lower when VRE integration keeps going high. The promotion effect for flexibility modification is more obvious under lower VRE integration.
In particular, there are two nodes for three curves in Figure 2. For the basic scheme, it is more economical to increase VRE integration by 10% due to lower total generation cost when the stipulated curtailment rate is higher than 10.4%. Similarly, it is more economical to increase VRE integration by 20% when the stipulated curtailment rate is even higher than 13.7%. As for scheme 1, these two critical points for the curtailment rate are 7.7% and 11.4%. The flexibility modification releases more possibility for integrating high shares of VRE with relatively low curtailment rate.
  • Electricity load
Electricity load determines total VRE consumption; the fluctuation of load also puts forward a higher requirement for system flexibility. In China, the present peak regulation capacity and the regulation performance of thermal power units are relatively sufficient to track the rolling electricity load alone but are not enough to further shave the variable power output.
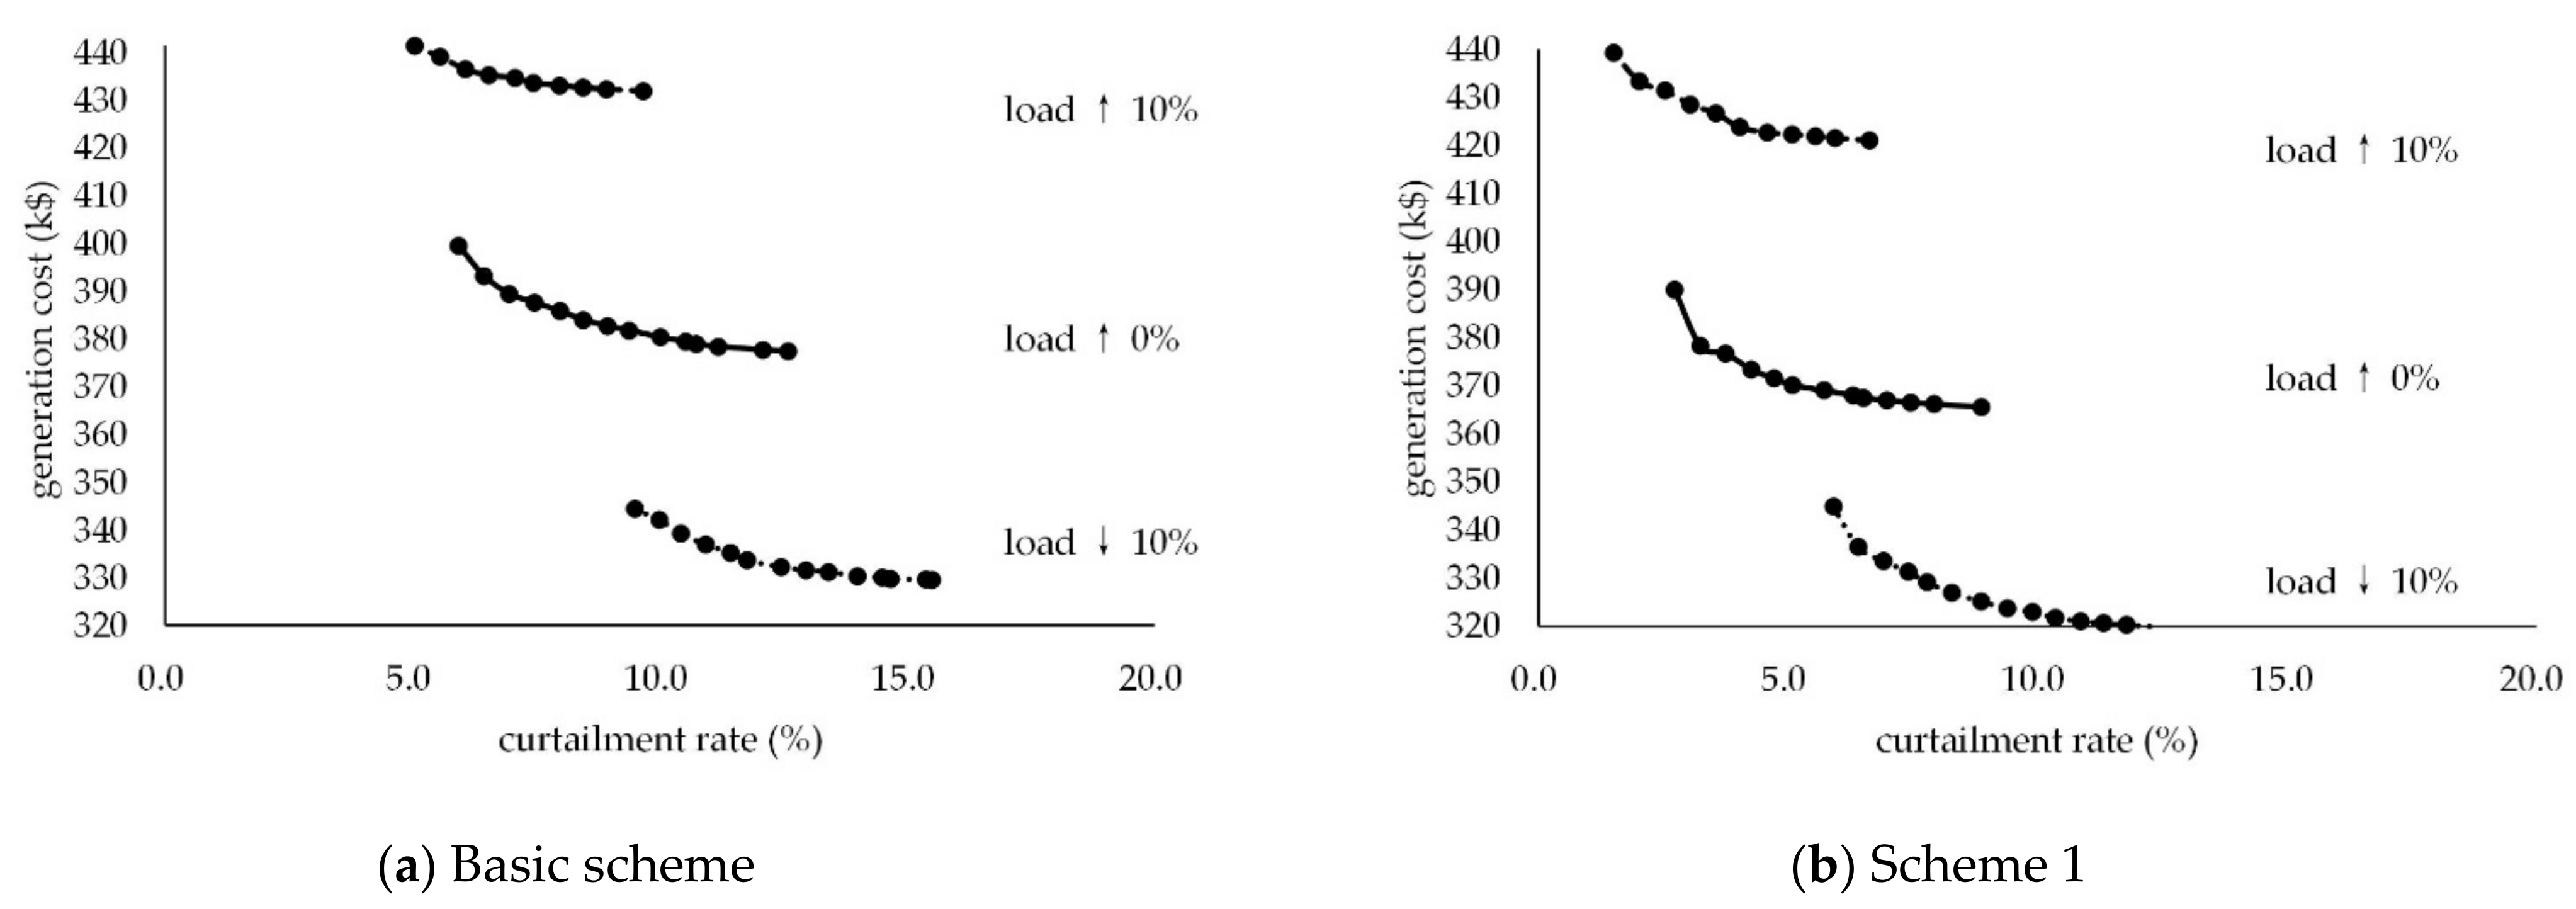
Total increase and decrease for electricity load are both considered in this case. As illustrated in Figure 3, when the load drops by 10%, VRE power output for both schemes occupies more of the electricity load, which increases the VRE curtailment rate. On the contrary, the curtailment rate declines when the electricity load increases by 10%. The generation cost keeps the same change as electricity load considering supply–demand balance.
The curtailment rate interval under different electricity loads varies after flexibility modification, as shown in Table 5. The minimum and the maximum interval limits for scheme 1 become smaller. The increase for these two limits when electricity load drops by 10% is higher than the decrease for them when load rises by 10%. This increase or decrease for scheme 1 is lower than that for the basic scheme. The change of curtailment rate interval is less sensitive to electricity load after flexibility modification.
There are no nodes for the three curves in Figure 3. The maximum or the minimum limit of curtailment rate interval become critical points. For the basic scheme, more electricity load should be added if the stipulated curtailment rate is below 5.8%, and some electricity load could be removed if it is above 12.3%. As for scheme 1, the two critical points for the curtailment rate are 2.7% and 8.7%. These critical points provide a reference for electricity substitution and demand-side response preparing for further implementation in China.

3.1.3. Discussions

Considering the comparison between different modification schemes alone, if the future targeted curtailment rate is between 5% and 10%, scheme 1 and scheme 3 have a similar and better effect on completing the administrative task of reducing curtailment rate under high VRE penetration. The generation cost is still within the controllable and acceptable range. To integrate more share of VRE with a curtailment rate lower than 5%, only these two schemes could be adopted, but inevitably high generation cost remains to be paid. If there is no severe constraint in curtailment rate, for instance, if it could be above 10%, there is no need for large-scale and in-depth flexibility modification. Scheme 2 or even no modification is enough to achieve the target.
However, if the economic effect is firstly taken into consideration, results are changed. Considering the generation cost of unit commitment only, there is no doubt to choose scheme 3 due to its lowest curtailment rate under a certain cost value. The flexibility modification decreases the total generation cost of the VRE thermal power unit commitment. If the modification cost is further considered, why should this little power system choose a more expensive scheme since scheme 1 has a similar effect to scheme 3? There is also no doubt that scheme 1 will be chosen, but whether to choose scheme 1 or scheme 2 on this basis remains a question. It mostly depends on whether or not the reduced VRE curtailment rate is worth the higher modification cost.
Therefore, to integrate an increasing share of VRE, flexibility modification of thermal power units is necessary, but more modification and more flexibility improvement do not indicate inevitability. It depends on the trade-offs between cost reduction and target completion. Since generation cost mainly consists of coal consumption cost in China, this trade-off also reflects the balance between carbon emission (produced by coal consumption) and compulsory VRE curtailment level. The increased VRE integration offsets some carbon emissions by substituting previous thermal power integration, but the lower the VRE curtailment level is, the higher the carbon emission produced by per-kWh coal-fired power generation will be. Whether the total carbon emission varies after these three schemes are adopted remains to be investigated from the perspective of the whole power system.
The sensitivity analysis further reveals a fact that flexibility modification of thermal power units is an effective approach to reduce VRE curtailment, but it will be a little less effective under future high VRE integration. More approaches should be applied for the occasion. Besides, maintaining a proper curtailment rate contributes to integrating high shares of VRE, and the best critical point for introducing higher VRE integration could be determined according to regulatory requirements for curtailment rate. Flexibility modification also contributes to improving these critical points. It is also proved that flexibility modification improves VRE integration capability to resist curtailment risks under low electricity load. Additionally, flexibility modification of thermal power units makes it easier for demand-side sources to participate in reducing VRE curtailment rate and releases pressure for integrating more VRE when electricity load growth slows down.

3.2. Deep Peak Regulation Ancillary Service Market

3.2.1. Added Electricity for Dual Market

As illustrated in Table A2, for five typical curtailment rates, 24 h time–series power outputs of modified units under scheme 1, scheme 2, scheme 3, and the basic scheme are separately given. For every modified unit, its dispatched 24 h time–series power outputs vary from the related one for the basic scheme after flexibility modification. For three modification schemes under five stipulated curtailment rates, the differential value between dispatched 24 h time–series power outputs for modified units and that for the same units under no modification is calculated. For these fifteen differential value series of 24 h time–series power outputs, the total sum for each of them separately means total electricity increase involved in electricity market (Market A) and is shown in Table 6.
Considering the load rate interval established in this case, the electricity increase involved in the deep peak regulation ancillary service market (Market B) is separately calculated under three load rate intervals, also shown in Table 6. For instance, one part of electricity involved in Market B, which is collectively generated by Unit No.1 at load rates above 30% but below 50%, decreases by 109 MWh after scheme 1 is applied when the stipulated curtailment rate is 8.3%. Meanwhile, the other part of electricity involved in Market B is generated by the same unit at load rates below 30% and increases by 120 MWh. The sum of these two parts, 11 MWh, is the total electricity increase involved in Market B with a load rate below 50%. Considering price rules for these two markets, a further economical calculation is conducted on this basis.

3.2.2. Added Revenue from Deep Peak-Regulation Ancillary Service Market

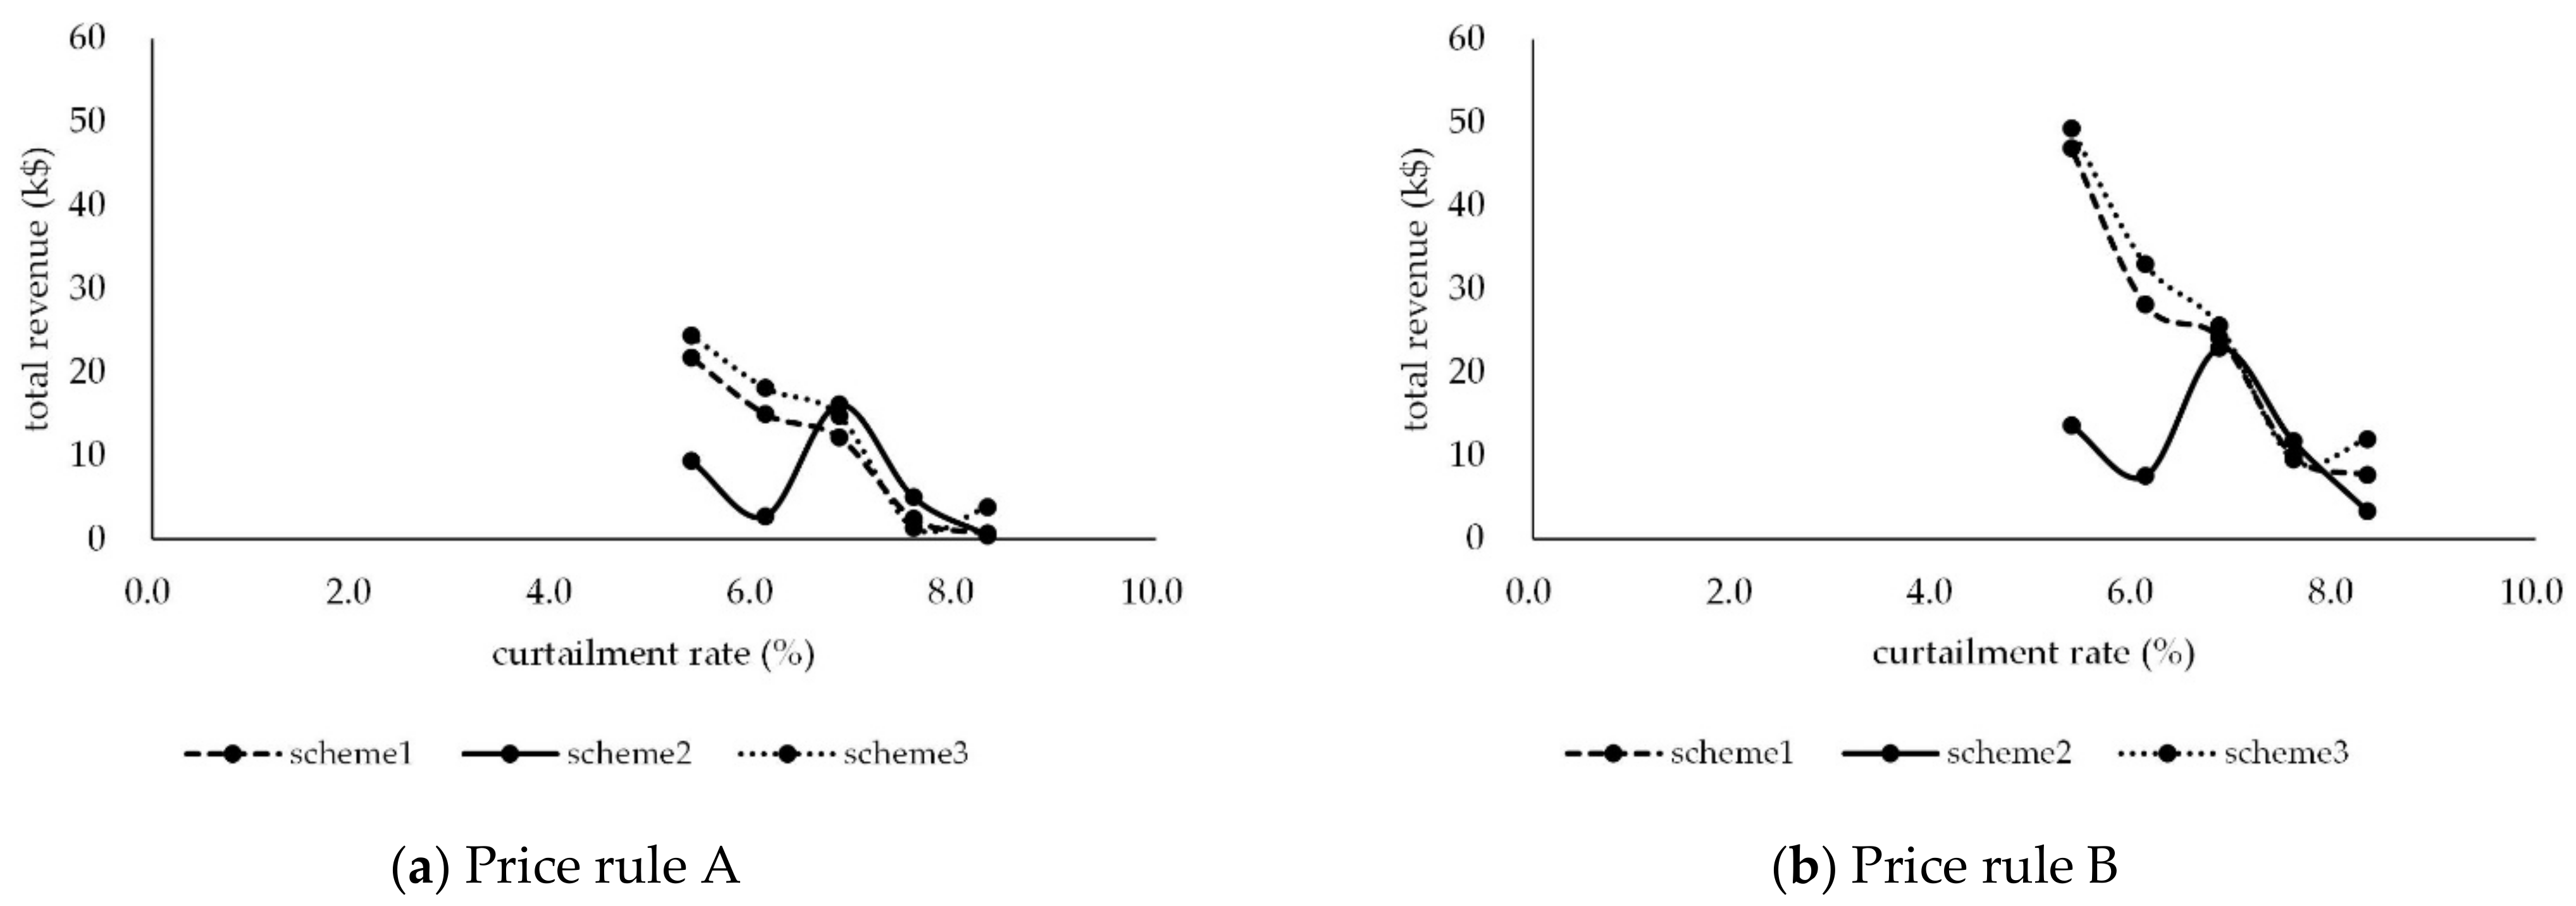
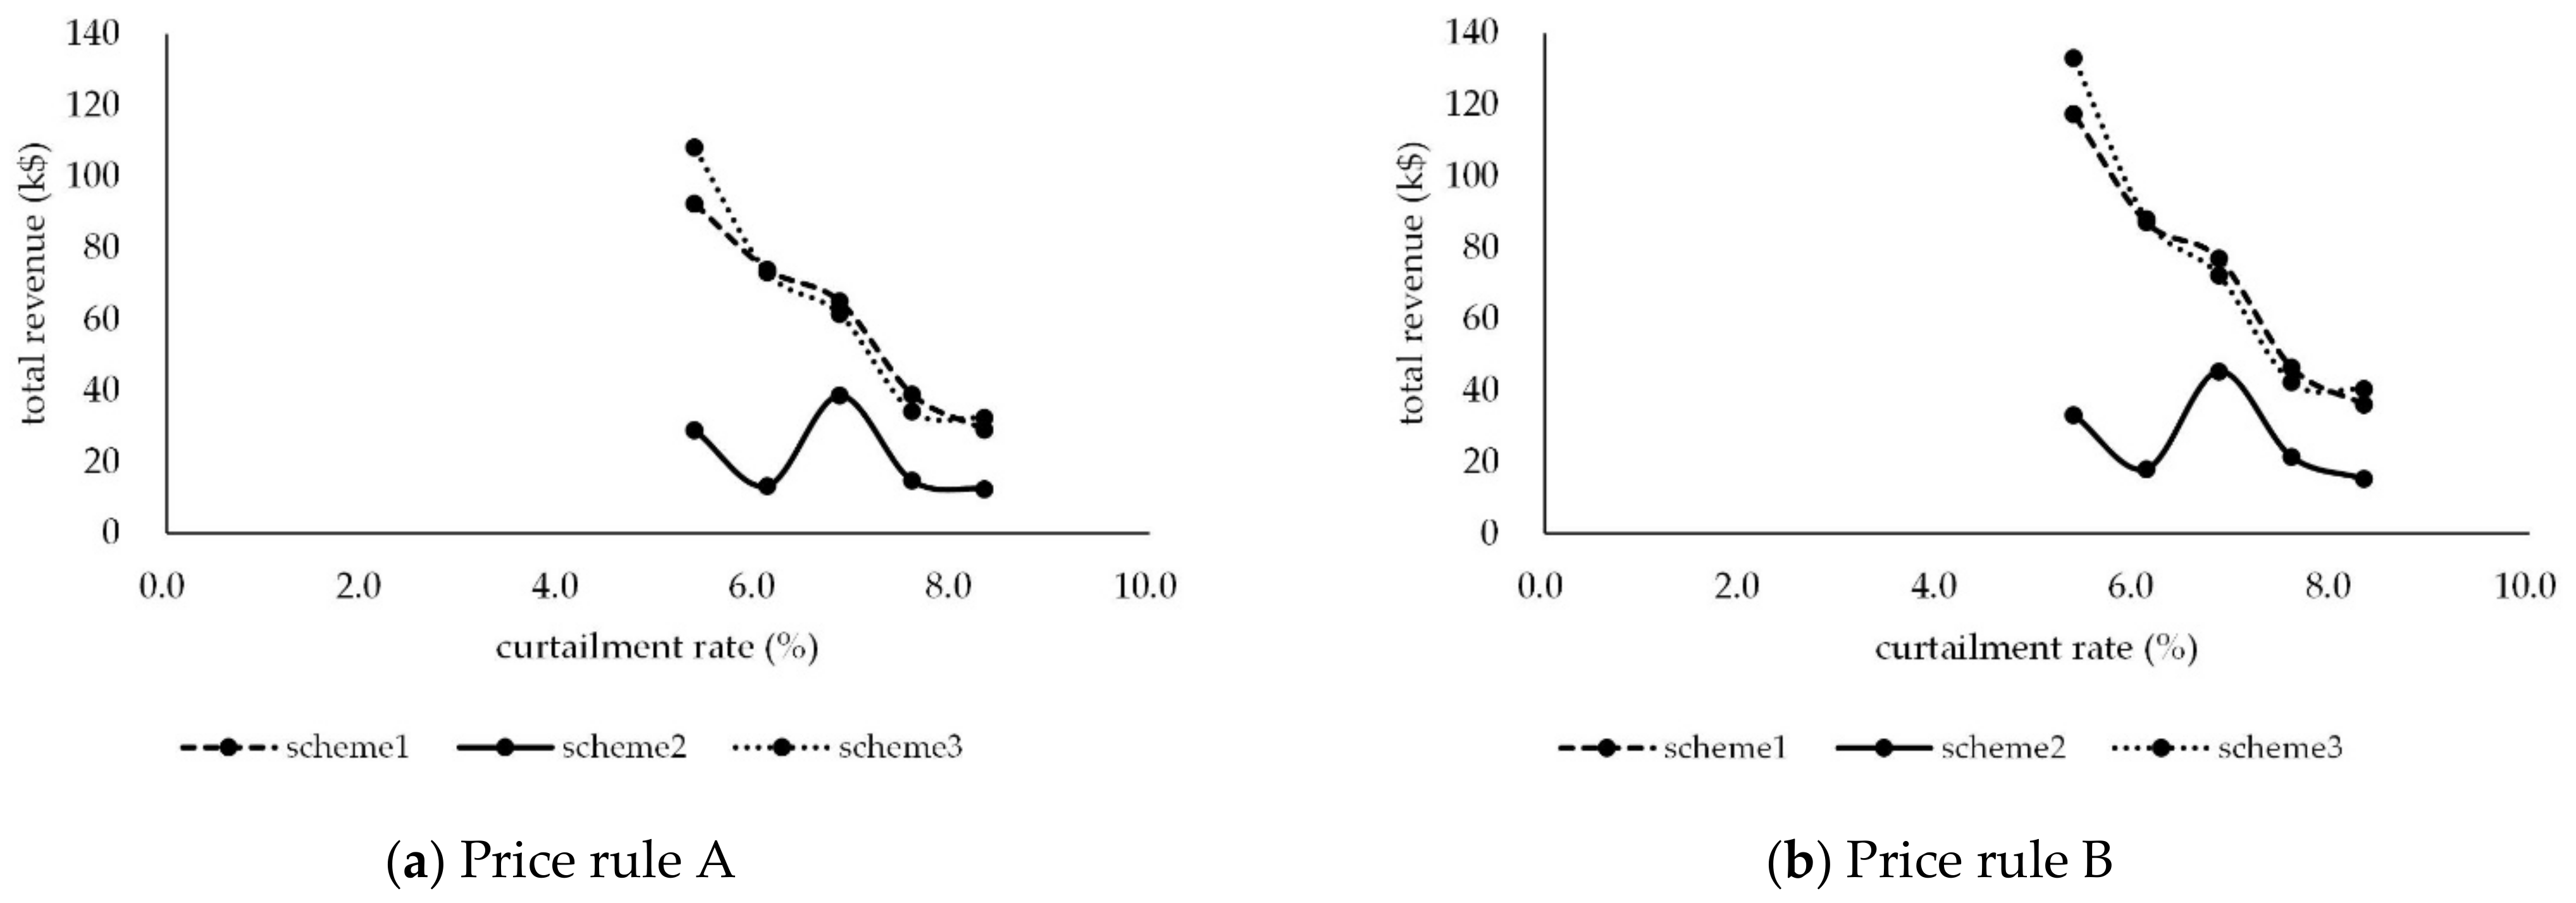
As established in this case, “Price rule A: unified price for all load rate interval” or “Price rule B: the price for load rate below 30% is twice of the price for load rate between 30% and 50%”, the revenues added from the deep peak regulation market for each modification schemes under five stipulated curtailment rates are further considered. They are calculated with added electricity involved in Market B and price interval limit for its corresponding load rate. The results under two price rules are shown in Figure 4.
The revenue for scheme 1 under both price rules keeps increasing when the curtailment rate is cut down from 8.3% to 5.4%. The revenue for scheme 3 under two price rules firstly drops when the curtailment rate turns from 8.3% to 7.6%, due to reduced electricity involved in related load interval, and then enjoys a rising curve that nearly coincides with the revenue curve for scheme 1. Scheme 1 and scheme 3 add so much flexibility that the lower the curtailment rate is, the higher total revenue becomes. This circumstance becomes more obvious when price rule B is adopted. In contrast, the revenue for scheme 2 firstly rises, then drops after curtailment rate gets close to 7%, and rises again finally. Once the realistic scheme 2 is applied, allowing a proper curtailment level (e.g., 7%) may achieve more revenue from the deep peak regulation ancillary service market.
Considering revenue from the deep peak regulation ancillary service market alone, it is not always economical to adopt scheme 1 and scheme 3 rather than scheme 2. When the stipulated curtailment rate is above 6.5% or 6.8%, the revenue for scheme 1 or scheme 3 is lower than that for scheme 2. Once price rule B is adopted, there is still no revenue advantage for scheme 1 and scheme 3 when the stipulated curtailment rate is above 6.8%. Besides, if the modification cost is further considered and the stipulated VRE curtailment rate is high, there is no need to introduce expensive flexibility modification schemes such as scheme 1 and scheme 3 since their added revenue is even less than that acquired from cheaper scheme 2.
However, when the VRE curtailment rate decreases to 6.8% or even less, the flexibility modification adds revenue indeed. The more units retrofitted to be more flexible, the more revenue brought from the deep peak regulation ancillary service market. This circumstance is more visible once price rule B is adopted. Neither price rule is motivated enough for thermal power units to retrofit themselves to be more flexibly dispatched under a high stipulated curtailment rate.

3.2.3. Added Dual-Market Revenue

Thermal power units not only acquire compensation revenue from the deep peak regulation ancillary service market but also increase their revenue from the electricity market after flexibility modification. The more flexible the power units are, the more opportunity they have to generate at a high load rate, especially in future power systems with high VRE penetration.
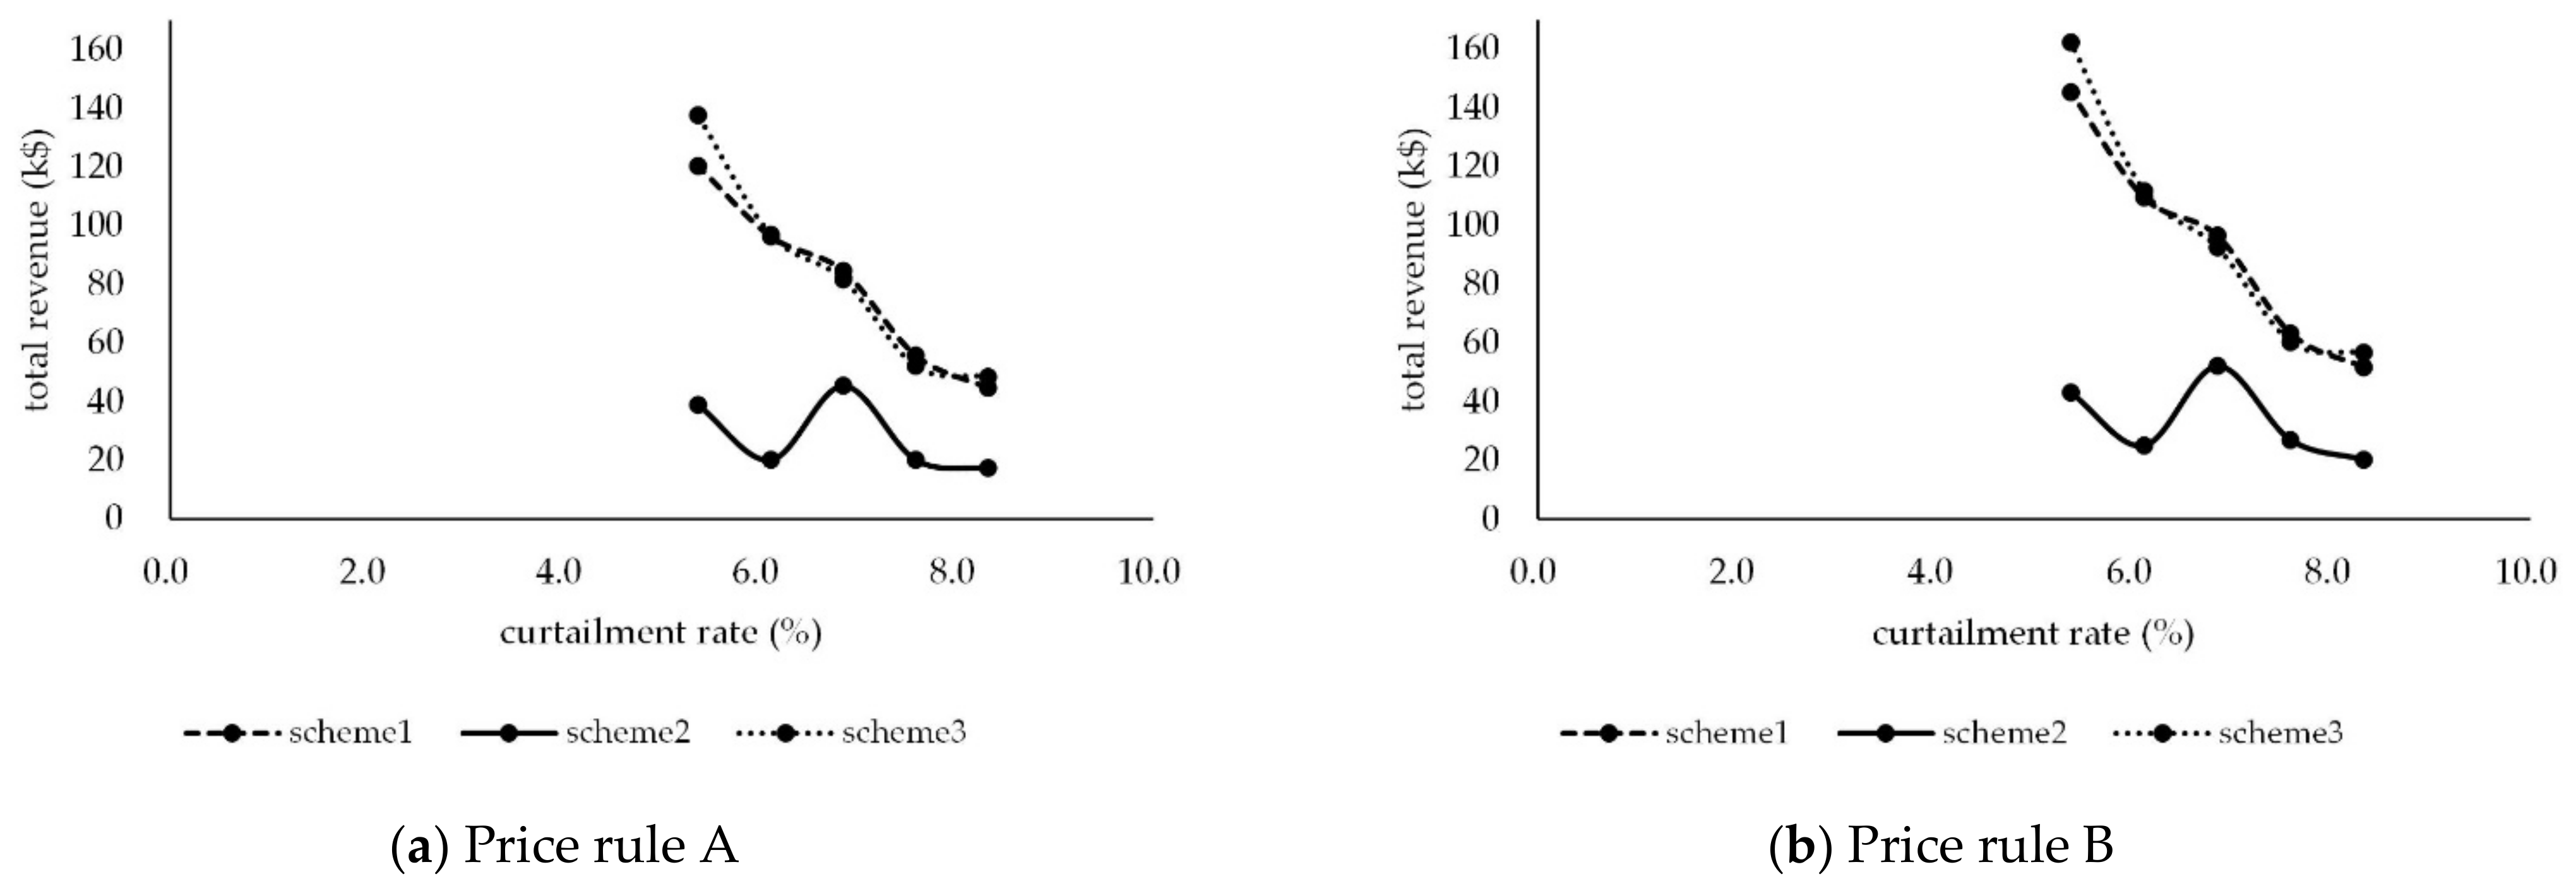
The added revenue from the electricity market is simply calculated with a unified electricity price (0.28 CNY per kWh) and related electricity increase, illustrated in Table 6. Both revenues from the electricity market and revenues from the deep peak regulation ancillary service market are added up, and the results are shown in Figure 5.
The total revenue from two markets for scheme 1 and scheme 3 under both price rules keeps increasing when the curtailment rate decreases from 8.3% to 5.4%, while the revenue curve for scheme 2 varies the same as that in Section 3.2.2. Total revenue from two markets is almost twice the amount from the deep peak regulation ancillary service market alone. Another difference is that these two revenue curves for scheme 1 and scheme 3 are closer to each other when price rule A is adopted and get even closer under rule B.
Considering revenue from two markets together, it is always economical to adopt scheme 1 and scheme 3 rather than scheme 2. However, the revenue for scheme 3 is lower than that for scheme 1 when the curtailment rate is cut down from 8.3% to 6.1%. If price rule B is adopted, this differential value is much larger. As mentioned before, the flexibility modification scale and the degree for scheme 1 are almost half of scheme 3. On this basis, there is no doubt to choose scheme 1 rather than scheme 3 under related curtailment rate interval, in consideration of trade-offs between modification cost and dual-market revenue. Once the stipulated curtailment rate is below 6.1%, the more expensive modification scheme 3 is worth adopting.

3.2.4. Added Cash Inflows from Dual-Market Revenue and Reduced Generation Cost

The stipulated price and the load rate interval not only directly influence the dual-market revenue added by flexibility modification but also cut down the total generation cost of unit commitment. Both added revenue and reduced cost could be regarded as “cash inflow” from an investment perspective, which contributes to offsetting revenue losses for thermal power units due to lower operating hours.
The added cash inflow is illustrated in Figure 6. There is no doubt that the total amount increases significantly under both price rules. Especially, the cash inflow curves for scheme 1 and scheme 3 are extremely close to each other. Modifying two inflexible units acquires almost the same cash inflow as that of modifying one when the curtailment rate is cut down from 8.3% to 6.1%. This provides further references for selecting economic flexibility modification schemes.

3.2.5. Discussions

The price rule for the deep peak regulation ancillary service market has two important concerns: load rate interval and price interval. The former defines the access standard while the latter defines the motivation effect. More subdivided intervals and bigger price differences lead to more revenues that thermal power could acquire. Flexibility modification makes units more flexible to contribute more reduced power output, which consequently brings more compensation revenue. More motivated price rule is encouraged when the stipulated curtailment rate is relatively severe, and only under this price rule do the expensive flexibility modification schemes deserve consideration. A simpler and more economical scheme could be applied if there is no rigorous constraint for curtailment rate, since there is no apparent revenue difference among schemes on this basis.
If dual-market revenue is further considered, thermal power units benefit more from flexibility modification. They have an advantage in flexibly adjusting themselves to track fluctuation of electricity load and VRE power output and consequently earn more from electricity increase for the electricity market, especially under high VRE integration and low stipulated curtailment rate. There is usually no doubt that the more flexible the units are modified to be, the more total revenue will be brought from two markets and the more modification cost remains to be paid. However, the marginal utility of flexibility modification investment decreases once the units are retrofitted to be flexible enough, especially for cases with no severe curtailment rate constraint.
If reduced generation cost is considered together with the dual-market revenue, both of these cash inflows motivate thermal power units to participate in flexibility modification. Similarly, price rule B is preferentially encouraged to attract more units to reduce their power output when there is a tough target for curtailment rate, especially under future high VRE integration.
There remains further work to be studied. If the initial modification investment is set to be cash outflow, and the revenue from the dual market together with reduced generation cost is set to be cash inflow, a cash flow table within different curtailment rates for these three modification schemes in one typical day could be acquired. More typical days could be chosen to represent a year according to load and power output characteristics. Repeating the modeling and the simulation above, the cash flow table would be enlarged. If its cash flow starts from the operation date, the net present value (NPV), the internal rate of return (IRR), and the payback period of investment could be calculated within a certain discount rate. On this basis, modification schemes could be selected from the perspective of the whole life cycle.

3.3. Comparative Analysis and Empirical Implementation Evidence in China

Similar studies have been developed by official institutes such as State Grid Energy Research Institute (SGERI) and China Electric Power Research Institute (CEPRI) [16,24]. All these studies revealed similar policy effects but are conducted based on a more complex provincial or regional power system. Besides, this paper paid more attention to detailed selection for modification schemes and price rules under different conditions rather than just evaluation for policy effects. According to the case study from SGERI in 2019, when the minimum technical power output for 8 GW of thermal power units dropped to 40% of their rated installed capacity, the VRE curtailment decreased by 1.71 TWh, while this amount achieved 2.92 TWh if the minimum technical power output rate was retrofitted to 30%. The same two amounts respectively achieved 2.94 TWh and 4.76 TWh if the modification plan covered 16 GW of thermal power units. The maximum decrease for VRE curtailment rate achieved 13.3%. It was verified that deeper regulation length and larger modification scale both contribute to reducing VRE curtailment. As reported by CEPRI at the annual conference of the Chinese Society for Electrical Engineering in 2017, reduced VRE curtailment for a provincial power system ought to be 1.1 TWh if 15.48 GW of thermal power units were retrofitted to enjoy a decrease for minimum technical power output from 60% to 40% of rated capacity. However, the actual cover scale for flexibility modification plan and reduced VRE curtailment brought by it merely achieved 2.5 GW and 0.07 TWh. Meanwhile, the actual modification for Northwest China only covered about 1% of its total capacity of the thermal power unit, and related VRE curtailment was no more than 0.2 TWh. It was also verified that the actual implementation of flexibility modification did not go as smoothly as expected when this unique policy mix was firstly adopted, and more activeness for participation remains to be activated. However, with continuous encouragement from China’s government, six provincial peak regulation ancillary service markets and six regional markets were established by the end of March 2020. This successfully makes deep peak regulation a profitable selection and indeed contributes to integrating and consuming more VRE electricity. Typically, the regional peak regulation ancillary service market for Northwest China had cumulatively increased system flexibility by 3.35 GW and reduced VRE curtailment by 10.03 TWh.
There are many experiences and patterns to promote VRE electricity consumption in a market-oriented way in areas with mature electricity markets such as Europe and the United States. However, they are not quite suitable for China’s cases because China’s electricity market is still in the initial stage of construction. Thus, the flexibility modification and the peak regulation ancillary service market provide a unique way for China to remove the congenital deficiency of peak regulation ability and the lack of a corresponding market mechanism for effective activation. As the most valid incentive among this policy mix, compensation prices for different provincial and regional markets have been introduced, but some of them are still not activated enough, while others are beyond the affordability of contributors. A more balanced price system should be introduced, and some provinces have attempted to adopt relative policies. It is also universal and especially applicable for those countries without mature electricity markets to develop incentives for releasing system flexibility. Other countries with mature electricity markets, especially electricity spot markets, can motivate market subjects by node electricity price, and there is no need for them to additionally design a new independent market for deep peak regulation.
For further discussions, the market design for the deep peak regulation ancillary service market should be further improved and, in coordination with other policy frameworks, should be issued or be prepared to be implemented in China.
  • Coordination with the new provincial renewable portfolio standard
China’s government implemented its new scheme of provincial renewable portfolio standard (RPS) in January 2020, which directly assesses the consumed VRE electricity in total electricity consumption. Under administrative order for fulfilling quotas, more system flexibility needs to be released to integrate more VRE under a low curtailment rate. It would be the most feasible option for most provinces in Northwest and Northeast China to motivate integration potential by adopting flexibility modification of thermal power units and the deep peak regulation ancillary service market. In addition, assessing subjects could complete their obligated quota by buying green certificates from VRE producers or abundant VRE electricity consumption from those who have completed their target. Both trading markets need to be further designed and meanwhile be coordinated with a deep peak regulation ancillary service market.
  • Coordination with carbon trading
The thermal power unit is usually considered to be the unit that pays the bill for carbon trading. However, this is not reasonable considering their contributions to integrating renewables through deep peak regulation. Two alternatives remain for further consideration. Thermal power units which actively participate in the deep peak regulation ancillary service market should be out of the assessment. Instead, the reduced carbon emissions should be converted into added carbon quota. On this basis, those thermal power units with relatively small capacity, high flexibility, and high carbon emissions should be encouraged to jointly join both markets to earn more rather than directly retire, while units with huge capacity, low flexibility, and green emission performance should be utilized as effectively as possible.
  • Coordination with electricity spot market
More in-depth reforms of China’s power system will inevitably lead the electricity market to a real-time electricity spot market. If the load rate intervals and the price intervals are infinitely subdivided, a price for every bus inside power grid branches will be formed. This price reflects the real balance between power supply and demand, which could spontaneously guide the dispatched 24 h time–series power outputs for all kinds of power units to achieve an economical level. There is no need for a deep peak regulation ancillary service market in that circumstance. However, the international price rules and the trading mechanism for the electricity spot market are not suitable for China, as these two markets still need further modification to cooperate in the short-term.

4. Conclusions

This policy mix for flexibility modification and deep peak regulation ancillary service market is of great importance for reducing VRE curtailment rate and will inevitably play a significant role in future high VRE integration. Prior studies have either been single-optimization ones or have not focused on the intrinsic relationship between these two policy frameworks.
This paper established a MILP-UC model and acquired different economical dispatching results under five typical stipulated VRE curtailment rates with 24 h time–series power output for all integrated power units. Three flexibility modification schemes for thermal power units and two price rules for the deep peak regulation ancillary service market were developed. Each economical dispatching result for these three schemes was separately compared with a related one that contained no modification under the same curtailment rate, and sensitivity analysis was conducted considering VRE integration and electricity load. Total electricity increases involved in the dual market were calculated. On this basis, the added revenue from the deep peak regulation ancillary service market, the added revenue from the dual market, and the added cash inflow from dual market revenue and reduced generation cost were further calculated, compared, and discussed under different price rules. The results illustrated that flexibility modification of thermal power units is an effective approach to integrate increasing shares of VRE, especially under low stipulated curtailment rate. These findings extend applications of MILP-UC modeling, confirming that the modification scheme selection is a trade-off between cost reduction and curtailment requirement. There is no need for adopting expensive schemes with more modified units and more flexible performance unless the reduced VRE curtailment rate is worth the higher modification cost. In addition, other improvements noted in this paper included a three-step compensation revenue evaluation under different rules. Results indicated that a more motivated price rule is needed when the stipulated curtailment rate is relatively severe, especially under future high VRE integration. Besides, the marginal utility of flexibility modification investment decreases once the units have been flexibly retrofitted to their critical degree, especially for circumstances with no rigorous curtailment rate constraint. It is recommended that flexibility modification should be further enlarged via but not limited to a more targeted compensation price, which is motivated enough for generators but affordable for allocation entities. Meanwhile, demand-based trade-offs for flexibility modification should be further considered by generators rather than blind investment.
Most notably, this is an extended study to collectively investigate the effectiveness of the flexibility modification and the deep peak regulation ancillary service market and their connections based on the proposed analysis framework. However, some limitations are worth noting. The case applied in this paper is not complicated enough to reflect actual policy effect in real power systems, and “cash flow” calculation is not completely developed. Future work should therefore include follow-up work to evaluate whether the scheme is economical via a long term cash flow calculation and also whether the market design for deep peak regulation ancillary service continues to be in coordination with other policy frameworks based on a more realistic case or testing system [44].

Author Contributions

Conceptualization, Y.B. and X.Z.; methodology, Y.B.; software, Y.B.; validation, Y.B.; formal analysis, Y.B.; investigation, Y.B.; resources, Y.B. and X.Z.; data curation, Y.B.; writing—original draft preparation, Y.B.; writing—review and editing, X.Z.; visualization, Y.B.; supervision, X.Z.; project administration, X.Z.; funding acquisition, X.Z. All authors have read and agreed to the published version of the manuscript.

Funding

This research was funded by the National Natural Science Fund of China, grant number 72074075.

Institutional Review Board Statement

Not applicable.

Informed Consent Statement

Not applicable.

Data Availability Statement

No new data were created or analyzed in this study. Data sharing is not applicable to this article.

Acknowledgments

The authors would like to thank the anonymous referees and the editor of this journal. The authors also gratefully acknowledge the administrative and technical support of the China Electric Power Research Institute and China Electric Power Planning & Engineering Institute.

Conflicts of Interest

The authors declare no conflict of interest. The funders had no role in the design of the study; in the collection, analyses, or interpretation of data; in the writing of the manuscript, or in the decision to publish the results.

Appendix A

Table A1. Theoretically predicted 24 h time–series power output for VRE and electricity load in a selected typical day.
Parameters24 h Time–Series Electricity Load and VRE Power Output (MW)
0 1 2 3 4 5 6 7 8 9 10 11 12 13 14 15 16 17 18 19 20 21 22 23
Electricity load700 750 850 950 1000 1100 1150 1200 1300 1400 1450 1500 1400 1300 1200 1050 1000 1100 1200 1400 1300 1100 900 800
VRE power output61 573 800 673 566 1042 488 38 21 74 303 595 299 9 1088 383 403 928 181 1297 1088 136 278 632
Table A2. A 24 h time–series power output for units in different schemes under five typical curtailment rates.
Curtailment RateModification SchemeModified Unit24 h Time–Series Power Output of Units (MW)
0 1 2 3 4 5 6 7 8 9 10 11 12 13 14 15 16 17 18 19 20 21 22 23
8.3%No ModificationNo.10 299 179 157 277 279 159 279 399 455 455 455 420 455 431 311 394 274 154 274 154 187 307 354
No.20 0 0 0 0 0 0 383 427 448 455 335 215 276 273 153 273 323 335 455 0 0 0 0
Scheme 1 No.10 379 179 77 277 434 234 336 455 455 455 455 420 455 455 255 455 334 134 334 134 247 447 400
Scheme 2 No.10 317 177 137 277 324 184 324 455 455 455 455 405 455 409 269 409 269 129 269 129 269 409 422
Scheme 3 No.10 429 229 77 277 434 234 356 455 455 455 455 447 455 455 255 455 324 124 324 124 247 447 400
No.20 0 0 0 0 0 0 307 447 448 455 317 177 264 359 219 212 274 315 455 0 0 0 0
7.6%No ModificationNo.10 299 179 157 277 270 150 270 390 455 455 455 404 455 359 239 359 270 150 270 150 187 307 354
No.20 0 0 0 0 0 0 392 436 448 455 335 215 246 270 150 270 327 335 455 0 0 0 0
Scheme 1 No.10 379 179 77 277 434 234 336 455 455 455 455 405 455 455 255 455 326 126 326 126 247 447 400
Scheme 2 No.10 317 177 114 254 281 141 281 421 455 455 455 420 455 431 291 394 254 114 254 114 242 382 400
Scheme 3 No.10 379 179 77 277 434 234 356 455 455 455 455 447 455 455 255 455 339 139 339 139 249 449 401
No.20 0 0 0 0 0 0 307 447 448 455 317 177 264 304 164 212 258 315 455 0 0 0 0
6.8%No ModificationNo.10 0 0 0 257 295 175 295 415 455 455 455 405 455 355 235 355 270 150 270 150 187 307 354
No.20 0 0 0 0 0 0 368 455 442 455 335 215 242 270 150 270 327 335 455 0 0 0 0
Scheme 1 No.10 379 179 77 277 379 179 336 455 455 455 455 420 455 434 234 434 323 123 323 123 247 447 400
Scheme 2 No.10 317 177 137 277 269 129 269 409 455 455 455 405 455 407 267 395 255 115 255 115 167 307 354
Scheme 3 No.10 379 179 77 277 379 179 356 455 455 455 455 427 455 455 255 455 333 133 333 133 247 447 400
No.20 0 0 0 0 0 0 307 447 448 455 317 177 224 279 139 212 265 315 455 0 0 0 0
6.1%No ModificationNo.10 0 0 0 257 270 150 270 390 455 455 455 381 412 292 172 292 270 150 270 150 187 307 354
No.20 0 0 0 0 0 0 392 436 448 455 335 215 263 270 150 270 327 335 455 0 0 0 0
Scheme 1 No.10 379 179 77 277 275 75 275 455 455 455 455 420 455 434 234 434 338 138 338 138 247 447 400
Scheme 2 No.10 0 0 0 250 257 117 257 397 455 455 455 405 455 409 269 405 265 125 265 125 167 307 354
Scheme 3 No.10 379 179 77 277 324 124 324 455 455 455 455 447 455 450 250 450 329 129 329 129 247 447 400
No.20 0 0 0 0 0 0 339 447 448 455 317 177 264 254 114 217 268 315 455 0 0 0 0
5.4%No ModificationNo.10 0 0 0 0 0 0 455 455 455 455 455 381 390 270 150 270 270 150 270 150 187 307 354
No.20 0 0 0 0 0 0 0 455 448 455 335 215 263 270 150 270 327 335 455 0 0 0 0
Scheme 1 No.10 379 179 77 277 298 98 298 455 455 455 455 420 455 434 234 434 275 75 275 75 214 414 422
Scheme 2 No.10 0 0 0 237 299 159 299 439 455 455 455 382 431 291 151 291 254 114 254 114 167 307 354
Scheme 3 No.10 379 179 77 277 338 138 338 455 455 455 455 447 455 450 250 450 275 75 275 75 214 414 422
No.20 0 0 0 0 0 0 324 447 448 455 317 177 264 254 114 217 322 314 454 0 0 0 0

References

  1. Wang, Z.; Sandholt, K. Thoughts on China’s energy transition outlook. Energy Trans. 2019, 3, 59–72. [Google Scholar]
  2. Shu, Y.B.; Zhang, Z.G.; Guo, J.B.; Zhang, Z.L. Study on key factors and solution of renewable energy accommodation. Proc. CSEE 2017, 37, 1–8. (In Chinese) [Google Scholar]
  3. Imprama, S.; Nese, S.K.; Oralb, B. Challenges of renewable energy penetration on power system flexibility: A survey. Energy Strategy Rev. 2020, 31, 100539. [Google Scholar] [CrossRef]
  4. Li, H.; Zhang, N.; Kang, C.Q.; Xie, G.H.; Li, Q.H. Analytics of contribution degree for renewable energy accommodation factors. Proc. CSEE 2019, 39, 1009–1018. (In Chinese) [Google Scholar]
  5. National Energy Administration. The National Energy Administration Has Officially Launched a Pilot Project to Improve the Flexibility of Thermal Power Generation. (In Chinese). Available online: http://www.nea.gov.cn/2016-06/20/c_135451050.htm (accessed on 20 June 2016).
  6. The National Development and Reform Commission. Guiding Opinions on Improving Power System Regulation Capability. (In Chinese). Available online: https://www.ndrc.gov.cn/xxgk/zcfb/tz/201803/t20180323_962694.html (accessed on 28 February 2018).
  7. Zhang, D.; You, P.Y.; Liu, F.; Zhang, Y.H.; Zhang, Y.T.; Feng, C. Regulating cost for renewable energy integration in power grids. Glob. Energy Interconnect. 2018, 1, 544–551. (In Chinese) [Google Scholar]
  8. Kopiske, J.; Spieker, S.; Tsatsaronis, G. Value of power plant flexibility in power systems with high shares of variable renewables: A scenario outlook for Germany 2035. Energy 2017, 137, 823–833. [Google Scholar] [CrossRef]
  9. Zhao, J.; Shen, B. The Strategies for Improving Energy Efficiency of Power System with Increasing Share of Wind Power in China. Energies 2019, 12, 2376. [Google Scholar] [CrossRef] [Green Version]
  10. Pilpola, S.; Lund, P.D. Different flexibility options for better system integration of wind power. Energy Strategy Rev. 2019, 26, 100368. [Google Scholar] [CrossRef]
  11. Sinsel, S.R.; Riemke, R.L.; Hoffmann, V.H. Challenges and solution technologies for the integration of variable renewable energy sources—A review. Renew. Energy 2020, 145, 2271–2285. [Google Scholar] [CrossRef]
  12. China Electric Power Planning and Engineering Institute. Report on China’s Electric Power Development 2019, 1st ed.; People’s Daily Press: Beijing, China, 2020; pp. 72–73. [Google Scholar]
  13. Lund, P.D.; Lindgren, J.; Mikkola, J.; Salpakari, J. Review of energy system flexibility measures to enable high levels of variable renewable electricity. Renew. Sustain. Energy Rev. 2015, 45, 785–807. [Google Scholar] [CrossRef] [Green Version]
  14. Li, S.T.; Zhang, S.F.; Andrews-Speed, P. Using diverse market-based approaches to integrate renewable energy: Experience from China. Energy Policy 2018, 125, 330–337. [Google Scholar] [CrossRef]
  15. Ma, H.Y.; Yan, Z.; Li, M.; Han, D.; Han, X.; Song, Y.Q.; Wei, P.; Li, G.; Liu, Y.J. Benefit evaluation of the deep peak-regulation market in the northeast China grid. CSEE J. Power Energy Syst. 2019, 5, 533–544. [Google Scholar]
  16. State Grid Energy Research Institute. Analysis Report on New Energy Power Generation 2020, 1st ed.; China Electric Power Press: Beijing, China, 2020; pp. 92–97. [Google Scholar]
  17. Tan, Z.F.; De Gejirifu; Li, M.L.; Lin, H.; Yang, S.B.; Huang, L.L.; Tan, Q.K. Combined electricity-heat-cooling-gas load forecasting model for integrated energy system based on multi-task learning and least square support vector machine. J. Clean. Prod. 2020, 248, 119252. [Google Scholar] [CrossRef]
  18. Peng, F.; Gao, Z.; Hu, S.; Zhou, W.; Sun, H.; Wang, Z. Bilateral Coordinated Dispatch of Multiple Stakeholders in Deep Peak Regulation. IEEE Access 2020, 8, 33151–33162. [Google Scholar] [CrossRef]
  19. Zhang, Y.; Liu, W.; Huan, Y.; Zhou, Q.; Wang, N. An optimal day-ahead thermal generation scheduling method to enhance total transfer capability for the sending-side system with large-scale wind power integration. Energies 2020, 13, 2375. [Google Scholar] [CrossRef]
  20. Putz, D.; Schwabeneder, D.; Auer, H.; Fina, B. A comparison between mixed-integer linear programming and dynamic programming with state prediction as novelty for solving unit commitment. Int. J. Electr. Power Energy Syst. 2021, 125, 106426. [Google Scholar] [CrossRef]
  21. Hou, W.; Wei, H. Data-driven robust day-ahead unit commitment model for hydro/thermal/wind/photovoltaic/nuclear power systems. Int. J. Electr. Power Energy Syst. 2021, 125, 106427. [Google Scholar] [CrossRef]
  22. Deng, X.; Lv, T. Power system planning with increasing variable renewable energy: A review of optimization models. J. Clean. Prod. 2020, 246, 118962. [Google Scholar] [CrossRef]
  23. Carrion, M.; Arroyo, J.M. A Computationally Efficient Mixed-Integer Linear Formulation for the Thermal Unit Commitment Problem. IEEE Trans. Power Syst. 2006, 21, 1371–1378. [Google Scholar] [CrossRef]
  24. China Electric Power Research Institute. Production Simulation of New Energy Power System, 1st ed.; China Electric Power Press: Beijing, China, 2019; pp. 96–183. [Google Scholar]
  25. Lofberg, J. YALMIP: A Toolbox for Modeling and Optimization in MATLAB. In Proceedings of the CACSD Conference, Taipei, China, 2 September 2004. [Google Scholar]
  26. Qudrat-Ullah, H. Behavior validity of a simulation model for sustainable development. Int. J. Manag. Decis. Mak. 2008, 9, 129–140. [Google Scholar]
  27. Sterman, J.D. Testing Behavioral Simulation Models by Direct Experiment. Manag. Sci. 1987, 33, 1572–1592. [Google Scholar] [CrossRef] [Green Version]
  28. Liu, W.; Zhang, X.; Bu, Y.; Feng, S. The effectiveness of China’s renewable energy policy: An empirical evaluation of wind power based on the framework of renewable energy law and its accompanying policies. Emerg. Mark. Financ. Trade 2019, 57, 757–772. [Google Scholar] [CrossRef]
  29. Liu, W.; Zhang, X.; Wu, Y.; Feng, S. Economic Analysis of Renewable Energy in the Electricity Marketization Framework: A Case Study in Guangdong, China. Front. Energy Res. 2020, 8, 98. [Google Scholar] [CrossRef]
  30. Liu, W.; Zhang, X.; Feng, S. Does renewable energy policy work? Evidence from a panel data analysis. Renew. Energy 2019, 135, 635–642. [Google Scholar] [CrossRef]
  31. Gea-Bermúdez, J.; Das, K.; Koduvere, H.; Koivisto, M.J. Day-ahead market modeling of large-scale highly-renewable multi-energy systems: Analysis of the North Sea region towards 2050. Energies 2021, 14, 88. [Google Scholar] [CrossRef]
  32. Ostergaard, P.A. Reviewing Energy PLAN simulations and performance indicator applications in Energy PLAN simulations. Appl. Energy 2015, 154, 921–933. [Google Scholar] [CrossRef]
  33. Mahmud, K.; Sahoo, A.K.; Fernandez, E.; Sanjeevikumar, P.; Holm-Nielsen, J.B. Computational tools for modeling and analysis of power generation and transmission systems of the smart grid. IEEE Syst. J. 2020, 14, 3641–3652. [Google Scholar] [CrossRef]
  34. Wei, H.U.; Shuang, W.U.; Yiting, W.; Yanhe, L.; Jietan, Z. Research on optimal operation strategy of multi-energy power system considering complementary coordination. Energy Procedia 2019, 158, 6334–6340. [Google Scholar] [CrossRef]
  35. Matteo, Z.; Marco, G.; Marco, F.; Michele, R.; Agostino, G.; Mirko, M.; Emanuele, M. K-MILP: A novel clustering approach to select typical and extreme days for multi-energy systems design optimization. Energy 2019, 181, 1051–1063. [Google Scholar]
  36. Liu, C.; Li, C.; Huang, Y.; Wang, Y. A novel stochastic modeling method of wind power time series considering the fluctuation process characteristics. J. Renew. Sustain. Energy 2016, 8, 033304. [Google Scholar] [CrossRef]
  37. Zhou, Y.; Wei, Z.; Sun, G.; Cheung, K.W.; Zang, H.; Chen, S. A robust optimization approach for integrated community energy system in energy and ancillary service markets. Energy 2018, 148, 1–15. [Google Scholar] [CrossRef]
  38. Liu, Y.; Li, Y.; Gooi, H.B.; Jian, Y.; Xin, H.; Jiang, X.; Pan, J. Distributed robust energy management of a multi-microgrid system in the real-time energy market. IEEE Trans. Sustain. Energy 2017, 10, 396–406. [Google Scholar] [CrossRef]
  39. Chen, Z.; Sim, M.; Xiong, P. Robust stochastic optimization made easy with RSOME. Manag. Sci. 2020, 66, 3329–3339. [Google Scholar] [CrossRef]
  40. Li, W.; Liu, L.G.; Zhang, S.; Zhang, H.Z. Will the tradable green certifications and renewable portfolio standard policy work well in China: A recursive CGE analysis. J. Renew. Sustain. Energy 2018, 10, 055904. [Google Scholar] [CrossRef]
  41. Zuo, Y.; Zhao, X.G.; Zhang, Y.Z.; Zhou, Y. From feed-in tariff to renewable portfolio standards: An evolutionary game theory perspective. J. Clean. Prod. 2019, 213, 1274–1289. [Google Scholar]
  42. Qudrat-Ullah, H.; Seong, B.S. How to do structural validity of a system dynamics type simulation model: The case of an energy policy model. Energy Policy 2010, 38, 2216–2224. [Google Scholar] [CrossRef]
  43. Kleindorfer, G.B.; O’Neill, L.; Ganeshan, R. Validation in simulation: Various positions in the philosophy of science. Manag. Sci. 1998, 44, 1087–1099. [Google Scholar] [CrossRef] [Green Version]
  44. Zhuo, Z.; Zhang, N.; Yang, J.; Kang, C.; Smith, C.; O’Malley, M.J.; Kroposki, B. Transmission expansion planning test system for AC/DC hybrid grid with high variable renewable energy penetration. IEEE Trans. Power Syst. 2019, 35, 2597–2608. [Google Scholar] [CrossRef]
Figure 1. Comparison among different modification schemes.
Sustainability 13 02446 g001
Figure 2. Comparison among different variable renewable energy (VRE) integration.
Sustainability 13 02446 g002
Figure 3. Comparison among different electricity load.
Sustainability 13 02446 g003
Figure 4. The added revenue from deep peak regulation ancillary service market.
Sustainability 13 02446 g004
Figure 5. The added revenue from deep peak regulation ancillary service market and electricity market.
Sustainability 13 02446 g005
Figure 6. The added cash inflows from dual-market revenue and reduced generation cost.
Sustainability 13 02446 g006
Table 1. Parameters of thermal power units.
Unit No. P j , m a x t / MW P j , m i n t / MW ( P j , u p / P j , d o w n ) / ( MW / h ) k j o n / h k j o f f / h a j b j c j C j S U / USD
145515012088100016.20.00059000
24551501208897017.30.000310000
313020305570016.60.00201100
413020305568016.50.00211120
516225406645019.70.00401800
68020403337022.30.0071340
78525403348027.70.0008520
85510351166025.90.004160
95510351166527.70.002260
105510351167027.80.001760
Table 2. Flexibility modification schemes.
Modification SchemeUnit No. P j , m i n t / MW ( P j , u p / P j , d o w n ) / ( MW / h ) k j o n / h k j o f f / h
No modificationNo.115012088
No.215012088
Scheme 1 No.17520044
Scheme 2 No.211414066
Scheme 3 No.17520044
No.211414066
Table 3. Price rules for deep peak regulation market.
Load Rate IntervalPrice Rule A: Price Interval (USD/MWh)Price Rule B: Price Interval (USD/MWh)
(50%,100%]00
(30%,50%]58.3(0,58.3]
(0,30%]58.3(0,116.6]
Table 4. Curtailment rate interval under different VRE integration.
SchemesCurtailment Rate Interval (%)
VRE Integration↑0%VRE Integration↑10%VRE Integration↑20%
Basic scheme[5.4,12.3][9.7,16.2][13.2,18.7]
Scheme 1 [2.7,8.7][6.7,12.7][10.5,15.5]
Table 5. Curtailment rate interval under different electricity load.
SchemesCurtailment Rate Interval (%)
Load↓10%Load↑0Load↑10%
Basic scheme[9.5,15.5][5.4,12.3][5.2,9.7]
Scheme 1 [5.9,12.2][2.7,8.7][1.3,6.3]
Table 6. Electricity increases in the electricity market and deep peak regulation ancillary service market 1,2.
Curtailment RateModification SchemeModified UnitTotal Electricity Increases in Market A (MWh) Total Electricity Increases in Market B (MWh)
Load Rate (0,50%]Load Rate (0,30%]Load Rate (30%,50%]
8.3% Scheme 1 No.1697 11 120 −109
Scheme 2 No.1293 7 50 −43
Scheme 3 No.1699 65 140 −75
No.2
7.6% Scheme 1 No.1895 42 129 −87
Scheme 2 No.1239 86 115 −29
Scheme 3 No.1804 23 140 −117
No.2
6.8% Scheme 1 No.11295 209 206 3
Scheme 2 No.1552 276 116 160
Scheme 3 No.11145 253 185 68
No.2
6.1% Scheme 1 No.11445 257 226 31
Scheme 2 No.1258 47 83 −36
Scheme 3 No.11349 311 255 56
No.2
5.4% Scheme 1 No.11730 373 430 −57
Scheme 2 No.1480 161 73 88
Scheme 3 No.12054 419 426 −8
No.2
1 Market A means electricity market and Market B means deep peak regulation ancillary service market. 2 Negative value means decrease.
Publisher’s Note: MDPI stays neutral with regard to jurisdictional claims in published maps and institutional affiliations.

