Abstract
Achieving the CO2 reduction targets for 2050 requires extensive measures being undertaken in all sectors. In contrast to energy generation, the transport sector has not yet been able to achieve a substantive reduction in CO2 emissions. Measures for the ever more pressing reduction in CO2 emissions from transportation include the increased use of electric vehicles powered by batteries or fuel cells. The use of fuel cells requires the production of hydrogen and the establishment of a corresponding hydrogen production system and associated infrastructure. Synthetic fuels made using carbon dioxide and sustainably-produced hydrogen can be used in the existing infrastructure and will reach the extant vehicle fleet in the medium term. All three options require a major expansion of the generation capacities for renewable electricity. Moreover, various options for road freight transport with light duty vehicles (LDVs) and heavy duty vehicles (HDVs) are analyzed and compared. In addition to efficiency throughout the entire value chain, well-to-wheel efficiency and also other aspects play an important role in this comparison. These include: (a) the possibility of large-scale energy storage in the sense of so-called ‘sector coupling’, which is offered only by hydrogen and synthetic energy sources; (b) the use of the existing fueling station infrastructure and the applicability of the new technology on the existing fleet; (c) fulfilling the power and range requirements of the long-distance road transport.
1. Introduction
1.1. General Overview of Future Power Train Options
Today’s transport solutions for long-haul road transport are mostly based on internal combustion engines that use fossil diesel. Recent projections of future transport show increasing global demand for energy for transportation [1]. In contrast to the global trend, in Europe, and especially in Germany, this demand is nearly constant. An analysis performed by the German association of mineral oil products (Mineralölwirtschaftsverband e. V, MWV) in 2011 concluded a slightly increasing demand, from 18.7 up to 19.7 million t/a of truck diesel through 2025, and a decreasing amount for light duty vehicles, from 12.1 to 10.8 million t/a, in Germany [2]. With respect to the goals of the Paris Climate Accord, the transport sector should immediately start to reduce its CO2 emissions [3]. Statistical data shows that the CO2 emissions in the German transport sector only slightly decreased, from 164.4 million t/CO2 to 160.8 million t/CO2 [4], in the time period between 1990 and 2019. In Europe, greenhouse gas emissions caused by traffic increased from 857.5 million t. CO2 equiv. in 1990 to 1024 million t. CO2 equiv. in 2015 [5].
The International Energy Agency (IEA) addresses the subject of road transport in its technology collaboration program, “Advanced Motor Fuels” and within joint activities with the Joint Research Centre of the European Commission [6,7,8,9,10]. Its proposal is to aim for a 35% CO2 reduction by 2035 against a 2015 baseline for new heavy-duty vehicles by introducing different measures, especially the implementation of new technologies. The “35 by 35” target would require an annual reduction of 2.1% for new vehicles registered between 2015 and 2019, and an annual reduction of 2.8% for new vehicles registered after 2019. Finally, this means that, for representative tractor-trailers over the World Harmonized Vehicle Cycle C (WHVC-C) cycle and 17 t payloads, fuel consumption could be reduced from 32.5 L/100 km down to 22 L/100 km. This in turn could lead to a CO2 reduction of 32% for a complete fleet without changing the fuel. Several measures have been discussed to achieve these goals, that is, better tires, improved aerodynamics, and improved engine technologies. Other items include telematics, smoother roads, and routing with low to medium barriers for implementation. These measures could achieve a maximum effect of about 10%.
Aside from these technology-oriented measures, improved logistics should also help reduce transport kilometers. Items such as vehicle load, routing and port-centric logistics are listed as measures with low to medium barriers but also an overall impact of 5% to 10% [9,11].
The introduction of high-capacity vehicles was discussed as a suitable measure, leading to a greenhouse gas reduction effect of more than 20% and exhibiting only a medium barrier with regard to technology. Concerning legal rules and permissions, a change in vehicle length is needed and mainly depends on political willingness. Such ideas must be carefully assessed. Large-capacity trucks cannot be used on narrow roads and, therefore, can only be favored in regions other than Europe, especially Australia, Canada, or the USA.
In order to achieve a large effect, measures with high implementation barriers are required. These items comprise dual fuel, hydrogen solutions, dedicated biogas, electrification, electric hybrids, the use of bio fuels, and platooning. In particular, hydrogen, electrification, and platooning were controversially evaluated [7,11].
This contribution focuses on long-term solutions showing high barriers. They are required to achieve the COP21 goals of 2050, while the “35 by 35” targets can be simultaneously realized. The “35 by 35” target already supports the more challenging measures for higher CO2 reduction in transport.
A successful CO2 reduction strategy for transportation should be based on a widely adapted switch from fossil to renewable energy-based fuels. Neither biofuels nor electro fuels are able to cover the total future demand for liquid fuels alone [12]. A complete substitution of fossil fuels by bio or electro fuels can only be considered theoretically on the basis of all available potentials. A detailed analysis and subsequent assessment of economically-realistic quantities is beyond the scope of this review article and will be conducted in a separate publication. Electrification will play a major role in future transport on different levels. The variety of different options must be aligned and directed to preferable routes for different applications. Figure 1 shows combinations of process chains for different fuels spanning fossil origin, biomass, and wind or solar with power trains based on internal combustion engines or electric motors. The conventional path—presently based with a fossil basis—is sketched in the upper left-hand corner. Diesel is burned in internal combustion engines, complimented by some gas-to-liquid (GTL) fuels from stranded gas, such as SHELL’s VPOWER and Liquefied Natural Gas (LNG) or Compressed Natural Gas (CNG). The combination of an electric drivetrain with a fossil-based fuel requires an on-board fuel-processing system for hydrogen production and gas cleaning and a fuel cell to convert hydrogen into electricity. However, research on fuel cell systems with on-board fuel processing for vehicle propulsion was halted due their high complexity [13]. The technology can still be used for power supply to mobile systems during idling [14,15,16,17,18,19,20]. Instead of fossil fuels, biofuels could be employed by Internal Combustion Engines (ICEs).
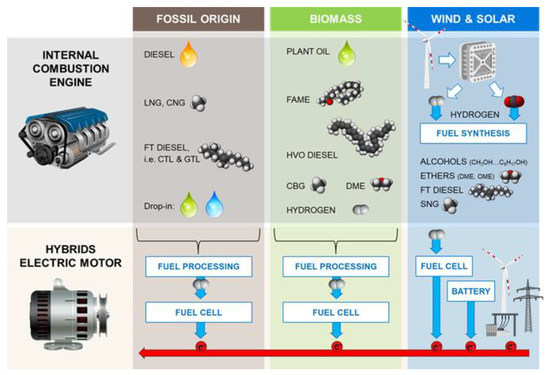
Figure 1.
Process chains for different fuels from fossil origin, biomass, wind or solar to be used in powertrains based on internal combustion engines or electric motors. Picture credits: internal combustion engine inspired by © istock.com [21], electric motor inspired by © istock.com [22].
With respect to biomass-based options, plant oil can be used for transesterification to fatty acid methyl esters (FAMEs). The blending of these fuels with fossil fuels is limited to 7%, due to the components’ chemical properties. These form partly radical molecules, leading to polymerization. Additives can suppress these chemical reactions, but the storage capability is still decreased [23]. Additionally, FAME can creep into the lubricity system and dilute the motor oil. This effect is harmful for trucks due to their extended maintenance intervals [24]. A better way to introduce plant oils is through the hydrogenation of plant oil, the output of which is termed hydrotreated vegetable oils (HVOs). These have nearly the same composition as Fischer-Tropsch fuels and consist of long chain alkanes. HVO has gained an increasing market share in recent years. Unfortunately, the share of biofuels is restricted to 7% and FAME blending must be reduced. In general, a fuel mixture with 33 bio fuels, that is, 7% FAME and 26% HVO, fulfils the fuel specification for diesel [24], but has not yet been implemented into the infrastructure. Finally, bio-methane obtained from fermentation (CBG) or bio-dimethylether (DME) from biomass gasification, and via methanol synthesis can also be used in ICEs [25,26]. For the combination of a biofuel and an electric drive train, the same core principles as for fossil fuels are valid, that is, on-board fuel processing is required to operate the fuel cell with a hydrogen rich gas. Therefore, this combination will not play a major role in the future transport system.
Finally, wind and solar energy are used to produce electricity. The easiest way would be to use these sources directly through a catenary system, like that for tramways. Battery systems store electricity and transfer electrons to the electric motor if it demands them. A further pathway that has been discussed recently is the power-to-fuel route [27]. Different alcohols, ethers and Fischer-Tropsch products are considered liquid fuels. The methanation of carbon dioxide and hydrogen yields synthetic natural gas (SNG). These fuels are preferably used for combustion in ICEs. A pathway for electric drivetrain systems again requires an on-board fuel processing system for these synthetic fuels and fuel cell. These combinations will also not be considered in the following, due to the already mentioned high complexity of such systems. In general, the stepwise analysis in Figure 1 offers pathways for hydrogen, CBG (and SNG), and DME for combustion in ICEs. Hydrogen for fuel cells is an interesting option for light duty vehicles (LDVs), heavy duty vehicles (HDVs) and passenger cars. The electric drivetrain options are complemented by batteries and catenary system for highways, exclusively for HDVs.
Table 1 summarizes the options for future drivetrains and energy carriers. In this contribution, we focus on technologies with a technology readiness level (TRL) higher than six. Goods transport is undertaken by HDVs over long distances and partly by LDVs for local distribution. Battery-driven electric drivetrains for battery-electric trucks (BET) are an excellent option for these short distances, but fail for long-range operations due to the restricted battery capacity and corresponding weight limitations. The company FIER Automotive and Mobility presented a meta-study with mission ranges for BETs of 100–300 km [28,29,30]. Although the TRL is very high at 9, this option is therefore not considered. The use of hydrogen in combustion engines is also not included in the analysis. Schwaderlapp [31] reported on the development of a 180 kW engine from Deutz but hardly any information is available about such developments. Nevertheless, information on hydrogen used in internal combustion engines is available in Appendix A.1, accompanied by a preliminary SWOT analysis (Strengths/Weaknesses/Opportunities/Threats) for the sake of completeness.

Table 1.
Suitable options for future powertrain-fuel combinations.
1.2. Scope of the Review
On the basis of the above discussion, we identified the following pathways for HDVs meriting further analysis:
- Internal combustion engines driven by CBG, SNG or LNG;
- Internal combustion engines driven by DME;
- Internal combustion engines driven by biofuels or power-to-fuel;
- Electric drivetrains utilizing hydrogen and fuel cells;
- Electric drive trains with a catenary system.
The paper is structured as follows: First, we analyze the current vehicle fleet for freight transport in Germany (Section 2) and then look into its future capacity based on existing scenarios (Section 3) in order to set the scene. In Section 4, we discuss fuel properties and storage options, which is followed by the production of renewable fuels, including well-to-tank efficiencies. It should be noted that the terminology originally considered the path from prospecting to vehicle storage. In the Life Cycle Assessment (LCA), various impact categories are accounted for, from cradle-to-grave. With respect to biofuels, the term ‘cradle’ is more appropriate than ‘borehole.’ On the other hand, the terms cradle-to-gate and cradle-to-grave prompt false expectations with regard to possible LCAs. An LCA is not a part of this work and therefore vehicle production and disposal emissions are not considered. In order to avoid misunderstandings in this context, in this work the terms well-to-tank and well-to-wheel are used for all fuels. In Section 5, we analyze the above-listed options for future heavy-duty transportation in detail. For each option, an overall motivation is given, followed by power train technology and vehicle availability, as well as greenhouse gas reduction potential, infrastructure, and economic considerations. The findings from the literature review and deeper analysis resulting from this work are implemented in a SWOT analysis discussing the strengths, weaknesses, opportunities, and threats of each option.
2. Vehicle Fleet for Freight Transport in Germany: Current and Future Capacity
The number of duty vehicles on German roads can be determined by consulting the website of the Federal Motor Transport Authority. The duty vehicle classes are divided into the ranges ≤2 t; 2.001–2.8 t; 2.801–3.5 t; 3.501–4 t; 4.001–5 t, etc.; each step 1 t up to 10 t; 10.001–12 t, etc.; each step 2 t up to 26 t and above 26.001 t. The same classification is made with towing vehicles and separately for semi-trailers. These datasets were used for a forecast study that will be discussed in the next section. For the sake of clarity, it is easier to summarize these classes into fewer, that is, <3.5 t; 3.501–7.5 t; 7.501–12 t and higher than 12.001 t, as well as semi-trailers. The analysis of detailed classes offers various shifts in vehicle numbers due to different market trends corresponding to user needs.
Figure 2 shows the share of vehicle numbers, average driven mileage, average consumption and yearly transport capacity for the five classes in 2017 in Germany. These data were released annually by the Federal Office for Motor Traffic [32]. It can be seen that nearly 75% of all duty vehicles are LDVs (≤3.5 t) and that 80% of overall transport is performed by semi-trailers. Semi-trailers account for over 40% of fuel consumption. The average annual mileage of LDVs amounts to roughly 20,000 km, whereas semi-trailers may rack up 100,000 km or more per year. Two major measures could be derived from the data in Figure 2:

Figure 2.
Distribution of the key figures: Inventory (vehicle stock), mileage (distance driven; km), fuel consumption, and transport performance (ton kilometers) of commercial vehicles by vehicle class in 2017.
- A change in drive system technology in freight disposal by LDVs affects a large number of vehicles
- More than 95% of freight transport is performed by 15% of the total vehicle inventory, that is, semi-trailers and HDVs in the >12.5 t class.
In order to describe the basic development of transport capacity over time, different assumptions for key figures outlining the developments are used. A set of these assumptions is referred to as a scenario. In general, the capacity of transport can be formulated by the means of different reference figures. The principle scheme for predicting future freight transport capacity using most relevant reference figures, namely vehicle stock, mileage, consumption, and transport capacity, is shown in Figure 3. These key figures can be converted using conversion values such as average vehicle mileage, average vehicle energy consumption, or average vehicle load.
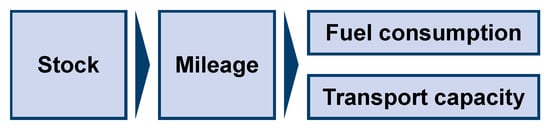
Figure 3.
Principle scheme for predicting future freight transport capacity.
The popular approach to formulating development scenarios is a top-down approach that takes transport capacity as the reference value, and is used for projections. The remaining values can then be calculated on the basis of certain conversion factors. In the following, a literature review of available studies with projections of the capacity of duty transport is given for Germany.
Various studies that analyzed the capacity of freight transport from 2010 to 2050 are drawn on and compared in this review. Figure 4 shows the results ranging from 400 to 450 billion tons per kilometer in 2010, to 300 to 870 billion tons per kilometer in 2050. In the vast majority of these studies, a steady increase in transport capacity is apparent. The low-capacity scenarios from the Forschungsvereinigung Verbrennungskraftmaschinen (FVV) [33] and eMobil studies [34] constitute exceptions to this. It should be noted that these scenarios represent a case in which the usage behavior of the means of mobility strongly change in favor of climate protection. The mean trend can be approximated within the range of 650 to 750 billion tons per kilometer, corresponding well to the studies from the BMU (Renewability—Basis), BMVI (MKS—EE im Verkehr) [35] and EWI (Prognos—Referenz/- Ziel) [36], BMU: Bundesministerium für Umwelt, Naturschutz und nukleare Sicherheit, BMVI: Bundesministerium für Verkehr und digitale Infrastruktur; EWI: Energiewirtschaftliche Institut an der Universität zu Köln.
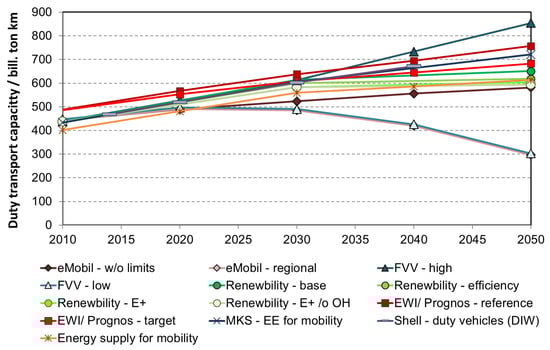
Figure 4.
Various studies predict future transport capacity in billions of tons per kilometer; see [33,34,35,36,37,38,39].
All of the development scenarios from the literature studies shown in Figure 4 follow the approach of extrapolating transport capacity as the main reference value. Concerning Figure 2, freight transport with semitrailers and HDVs will play an ongoing and important role in the transportation sector and requires environmentally-friendly solutions. Therefore, different solutions will be discussed in the following chapters that seek to foster drivetrains that are more electric or use renewable synthetic fuels. The paper will discuss the state-of-the-art of these technologies and offer an outlook on the challenges and opportunities surrounding them.
3. Fuels for Light- and Heavy-Duty Transport
Before commencing the detailed review on the options for future heavy-duty transportation, this section will discuss selected fuel properties and the production of renewable fuels.
3.1. Fuel Properties and Storage
In this sub-section, various liquid and gaseous fuels are introduced, together with their fuel properties and the effects of using storage systems for truck applications. Fuels such as FT-diesel, FAME and HVO were not discussed in detail because their properties only lead to minor changes compared to conventional fuels. They will be compared in a subsequent section, together with natural gas, DME, and hydrogen.
3.1.1. Natural Gas
Compressed natural gas (CNG) is the preferred fuel in many passenger cars and light- and medium-duty commercial vehicles, whereas only liquefied natural gas (LNG) can offer a competitive range that is similar to diesel for heavy-duty transport purposes. Other designations, such as synthetic natural gas (SNG) or renewable natural gas (RNG), describe the origin of the natural gas; any of these can be stored in gaseous (CNG) or liquefied (LNG) forms. LNG differs from CNG with an extra step of liquefaction in production, by which its volume is reduced by approximately 600 times. Cryogenic liquefaction begins with the separation of water, acidic gases and heavy hydrocarbons [40]. The purified gas is then cooled to a liquid state at −162 °C. LNG typically contains 81–99% methane, 0–13% ethane, 0–4% propane, 0–1% heavier hydrocarbons, and 0–1% nitrogen [41]. The lower heating value of liquefied methane corresponds to 50 MJ/kg (21 MJ/L), compared to 43.13 MJ/kg (35.88 MJ/L) for diesel. In light of these figures, an LNG tank must be 1.7 times larger than a diesel tank to be capable of an equal travel distance. LNG is only slightly pressurized, but is vented when gas is boiled-off as it warms. In comparison, a CNG tank is 3.7 times larger than a diesel one for an equal distance traveled. It is pressurized up to 250 bar and no venting is required [42]. Liquefied methane has a lower CO2 emission factor (tank-to-wheel) of 55 g/MJ than diesel (73.25 g/MJ) due to its higher hydrogen-to-carbon ratio [41]. This property results in it having reduced emissions, assuming that diesel and gas motors can deliver the same efficiency. A state-of-the-art LNG tank system from Westport offers more than 900 km range and 10 days’ holding time [43]. A single tank has a size of 450 L for 225 L diesel equivalent and 409 kg dry weight. Typically, two such tanks are used in heavy-duty trucks. The tank system includes an integrated cryogenic LNG pump, the storage pressure of which is about 3.5 bar.
3.1.2. Hydrogen
The principle options for onboard hydrogen storage are gaseous storage at 350 or 700 bar and liquefied (cryogenic) hydrogen storage in thermally-insulated tanks or in materials with special chemical properties, such as metal hydrides or organic compounds. At present, the main research focus is on 350 bar and 700 bar storages in Type III (metallic liner) or Type IV (plastic liner) tanks, the latter having an improved gravimetric storage performance. Cryogenic hydrogen offers even more storage capacity per volume; however, this comes at the expense of a significant lower energy efficiency of hydrogen provision due to the liquefaction process. Boil-off losses that are on the down-side of cryogenic storage in passenger cars may not be relevant for trucks due to the latter’s long operational hours, with only short non-use periods. Moreover, if future hydrogen provision relies on imports from remote locations with very high renewable energy yields, liquefied hydrogen storage could play a more prominent role, as the hydrogen would then preferably be delivered in a liquid state via ocean-going vessels.
For the packaging of the storage vessels onboard trucks, different locations may be suitable, for example, behind the cabin or behind the front wheels. An indication of the required mass and volume can be given based on the gravimetric and volumetric storage performance of systems for light-duty vehicles. The technical targets set by the US Department of Energy (DOE) are given with 5.5 weight-% for the year 2020 and 7.5 weight-% as the ultimate target [44]. Data in Gangloff et al. (2017) [45] show that the gravimetric capacity of Type IV storage vessels increases with the geometric storage volume. At high storage volumes of above 1000 L, this parameter saturates at about 9 weight-%. An exemplary storage container with inner dimensions of 2.0 m in length and a 0.5 m diameter would achieve a storage volume of roughly 400 L, resulting in an average gravimetric capacity of 6.5 weight-%, which could carry up to 35 kg of hydrogen at 700 bar storage pressure. Values that are somewhat more conservative are presented by Ahluwalia et al. (2018) [46] for hydrogen bus applications, assuming a storage capacity of 40 kg of hydrogen. In their study, compressed cryogenic storage (CcH2) is evaluated on the basis of finite element stress analyses and compared to 350 and 700 bar compressed hydrogen storage (cH2). The results indicate a better performance of up to 8.4 weight-% and 50.8 g/L for the CcH2 option compared to a 350 bar compressed hydrogen (cH2) storage with 4.4 weight-% and 18.5 g/L, respectively [46]. However, the cH2 concept is assumed with eight containers of 5 kg hydrogen storage capacity each. The benefit of using larger storage vessels was therefore not considered. Storage system costs are also presented by Ahluwalia et al. and show that, with 10 US$/kWh (350 bar) and 11 US$/kWh (500 bar), CcH2 systems could be less expensive than 350 bar cH2 storage solutions [46]. The US Department of Energy (DOE) presents the 2015 status with 12 US$/kWh, 16 US$/kWh, and 19 US$/kWh for CcH2 at 276 bar, cH2 at 350 bar, and cH2 at 700 bar, respectively [44]. The ultimate target is cited as 8 US$/kWh, regardless of the storage type [44].
3.1.3. DME
The fuel properties of DME (chemical formula: CH3-O-CH3) are listed and compared with those of various fuels in several studies [47,48,49,50]. DME is a volatile organic compound, but is described as non-carcinogenic, non-teratogenic, non-mutagenic, and non-toxic [49]. The vapor pressure graph of DME lays between propane and butane, which are the main components of Liquefied Petroleum Gas (LPG) [51]. As the physical properties of DME are similar to those of LPG, similar tank and pressure designs can be used. Moreover, the available LPG infrastructure can be used with minor modifications to pumps, seals, and gaskets [49]. Here, it should be noted that LPG is more suitable for Otto cycles, whereas DME is better suited to diesel cycles. Countries such China and Japan mix up to 30 wt.% DME in LPG for use as household cooking gases [52].
As DME contains C-O bonds, bond breaking energies are lower than hydrocarbons that only contain C-C and C-H bonds. This property results in a shorter ignition delay and lower auto-ignition temperature (DME: 235 °C vs. diesel: 250 °C), resulting in the fuel having a high cetane number (DME: 55–60 vs. diesel 40–55) [47,51]. Because of the high oxygen content (34.8%) and the absence of C-C bonds, soot formation from diffusive flames is also suppressed [50]. As less air is required for combustion, the fuel itself contains oxygen, and fuel-rich zones are avoided, even in areas with low oxygen concentrations. The lower heating value of DME (28.43 MJ/kg) is less than that of diesel (42.5 MJ/kg) but higher than methanol (19.5 MJ/kg) and ethanol (27 MJ/kg) [51]. As DME and ethanol are isomers, both have the same molecular weight. Due to the lower calorific value and density compared to diesel, its volumetric heating value is reduced and the injection system must be adapted to deliver higher flow rates. Moreover, DME’s maximum possible injection pressure is limited to 1000 bar due to its lower bulk modulus, demanding a further increase in the hydraulic flow rate. To compensate the lower calorific value, density, and the injection pressure, Zubel et al. [50] estimated the need for a higher flow rate with a factor of 2.2 compared to diesel and finally decided on a factor 2.5 to cover uncertainties as well. The lower bulk modulus than diesel, with a factor of 2.3, results in 3.2 times higher compression energy demand than dodecane in a closed system for a final compression to 250 bar and 323 K [47].
DME is the lightest ether, with a boiling point of –25 °C. Therefore, it is in a gaseous state under standard conditions. However, a slight pressurization, typically to 6 bar, brings DME to its liquid form [53]. This pressure level is substantially lower than the typical storage pressure of natural gas (250 bar) or hydrogen (350–700 bar) in gaseous form.
3.1.4. A Comparative Analysis of Fuel Properties and Storage
Figure 5 shows the results of a comparison of various fuels with regard to energy density and the effects on storage systems. Besides gaseous fuels, natural gas, hydrogen and DME fuels such as FT-diesel, FAME, and HVO were included in the analysis. Lower heating values and storage densities were drawn from Meinert and Schemme et al. [27,54]. The highest energy densities of pure liquid fuels are indicated with ~35 MJ/L by FAME as the agent for biodiesel and tetradecane for diesel, whereby fossil diesel contains aromatic compounds, which increases the density and volumetric energy density. Boiling temperatures below ambient temperatures require liquefaction if the fuel must be stored in its liquid from. DME and LPG demand moderate pressures of about 5–8 bar at ambient temperature, whereas LNG is stored at 135 K and 5 bar; see Meinert [54]. The liquid storage of hydrogen at 5 bar and 26 K demands a higher effort. Fuels such as methane, DME, methylal, and OME3–5 offer energy densities of about 20 MJ/L. Propane, as an agent for LPG and octanol, is somewhat higher, with 25 MJ/L. Hydrogen is far below these values with 7 MJ/L (5 bar, 26 K), but its advantage is the extremely high gravimetric energy density with 120 MJ/kg.
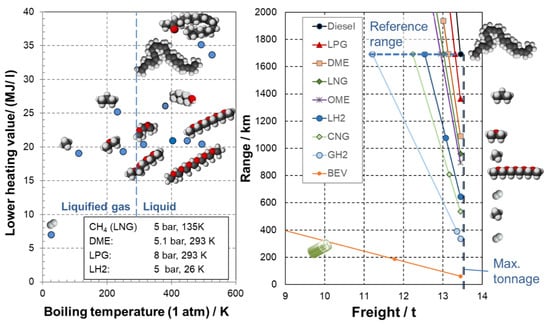
Figure 5.
Lower heating value of different fuels and their effects on storage capacity. Lower heating values and storage densities were drawn from Meinert and Schemme et al. [27,54]. Truck data calculations are based on the Mercedes Benz Actros [55]. Chemical species: see Figure A2.
In order to evaluate these numbers, a technical analysis must be performed to evaluate the effects on truck applications. Basic data were collected from the product catalogue of the Mercedes-Benz Actros long-haul truck [55]. These trucks are available as 18 ton or 26 ton semitrailers with different tank systems. Internal combustion engines of 175–460 kW can be selected. For reasons of comparability with existing development, a 26 t truck with 260 kW was chosen. The installed diesel tank volume varies between 540 L, and up to 1420 L in an extended version. For the calculations in this paper, the smallest diesel tank volume of 540 L was considered, which weighs 557 kg. Subtracting the amount of diesel, a total of 13.5 tons of freight can be transported. It should be noted that the Actros 1835, with 260 KW, is limited to a maximal weight of 32 t, enabling 13.5 tons of freight to be transported. Higher freight loads of 18–22.5 t, as discussed in the studies of Mareev et al. [56], must be carefully analyzed. It must also be taken into account that the Actros 18xx series only offers higher freight loads when combined with stronger engines to achieve a 40 t gross weight. To enable a fair comparison between different drivetrain systems, further data must be acquired. Assuming an efficiency of 42% and consumption of 31.9 L/100 km, as per the data of Schuckert [10], a range of 1693 km can be achieved when the energy consumption at the wheels is about 480 MJ/100 km. Schuckert [10] predicted further efficiency improvements being achieved by engine downsizing, waste heat recovery, and lower parasitic losses beyond 44–48%. A change in an alternative liquid fuel is fairly easy. Compared to diesel, OME3–5, with its halved energy density, leads to a halved range of about 900 km, which can be compensated for by a larger tank losing 1.5 t of freight.
For liquefied gases such as LNG, LPG, and DME only the changed storage system need be considered. The internal combustion engine must be adapted but changes in weight for these measures were not taken into account. Specific data for the complete storage system were taken from Meinert [54], that is, 18 MJ/L and 20 MJ/kg for CNG, and 18 MJ/L and 28 MJ/kg for LPG. Based on a similar storage technology as for LPG, the data for DME were corrected to 14.4 MJ/L and 22.4 MJ/kg based on the lower heating value of pure DME. Mission ranges of 960 km, 1090 km and 1360 km were calculated for LNG, DME, and LPG, assuming a 557 kg tank weight. With LNG, a range of 1693 km is achievable with a small loss in freight of 500 kg. The analysis of CNG resulted in smaller ranges and higher freight penalties of 535 km and 1300 kg. A further hurdle is the limited space of the maximum 1540 L, which was established in this analysis, finally leading to a trip range of 800 km and a loss of freight of 350 kg. This option seems to offer a good compromise.
The implementation of an electric drivetrain leads to a number of changes. The power density of an electric motor is much higher than that of an ICE. Füßel [57] reported on developments of up to 20 kW/kg, whereas ICEs for HDVs are in the range of 0.3–0.5 kW/kg [58,59]. Tank-to-wheel efficiency is also much higher, and is estimated to be 81%, as a result of the 85% battery efficiency, and 95% for the electric motor. Mareev et al. [56] cited specific values of 200 Wh/l and 125 Wh/kg for the energy density of a battery for vehicle propulsion. The technical data of a Mercedes Benz e-urban truck [60] offered a good recipe for the analysis. The e-truck has a weight of 26 t and is equipped with a 250 kW electric motor. The exchange of the drivetrain saved 2700 kg of ICE, gearbox, and tank, which will be replaced by an electric drivetrain and the electronic equipment totaling about 1900 kg. The 800 kg total for Battery Electric Vehicle (BEV) trucks is split with 557 kg for the filled diesel tank (which was already considered in all options) and 243 kg for the extra freight. Applying the maximum space of 1541 L leads to a battery weight of 2465 kg and a mission range of 186 km. The maximum freight was decreased from 13.4 t to 11.8 t, that is, by 1.6 t. This is in good agreement with the data published by Daimler, with 2500 kg of battery mass, a range of 200 km, and a freight deficit of 1.7 t [60]. Thus, it should be stated that BEV trucks are most suitable for retail delivery tasks or for transport purposes over limited distances.
Finally, hydrogen-based Fuel Cell Electric Vehicle (FCEV) trucks must be evaluated. A credit concerning weight issues cannot be given due to the exchange of ICE and gearboxes by electric drivetrains leaving only the abovementioned 243 kg for the fuel cell system. For the calculation of the achievable mission range, the following efficiencies were assumed: 60% fuel cell system, 97% power electronics, and 95% electric motor. These values resulted in a tank-to-wheel efficiency of 55%. A tank weight of 557 kg (see [55]) allowed a maximum range of 338 km for GH2 and 646 km for LH2, as shown in Figure 5. The main challenge for hydrogen storage systems is the small volumetric energy density. A tank volume of 1541 L leads to a maximum range of 393 km for GH2 and 1076 km for LH2. The loss in freight is fairly acceptable and amounts to 0.5 t for LH2. Finally, hydrogen-based FCEV trucks are an excellent option for short to medium transport ranges. With respect to long distances, a corresponding tank-filling strategy may be required.
3.2. Production of Renewable Fuels
3.2.1. Biogas
The use of residual biomass for biogas production is an frequently-utilized process in Germany. Most gas is used directly on farm sites, whereas a minority of fermentation plants feature up-grading facilities for bio-methane and a connection to the gas grid [61]. The technical potential for the present and future utilization of CO2 from biogas for fuels in Germany was analyzed by Billig et al. [62]. As reported by Peters et al. [12], 9000 fermentation plants operate in Germany, including biogas upgrading, producing around 5.2 million tons of CH4 and 11.9 million tons of CO2. In addition, a total of 4.1 Mt CH4 could be synthesized from CO2 and 2.2 Mt of hydrogen from wind via electrolysis if a corresponding technology were to be implemented.
Two concepts for biogas production from bio-waste, such as liquid manure and silage from residual biomass, are sketched in Figure 6. Concept (a) illustrates the fermentation of bio-waste and biogas upgrading to bio-methane, including CO2 separation; concept (b) combines the fermentation of bio-waste and biogas, upgrading to bio-methane with CO2 methanation on the basis of hydrogen from renewable energy produced by electrolysis.
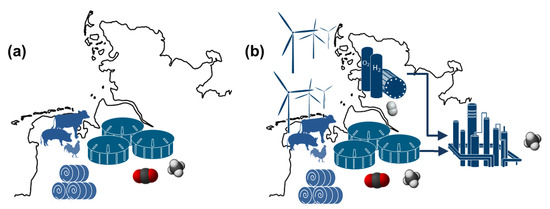
Figure 6.
Concepts for biogas production from bio-waste such as liquid manure and silage from residual biomass. Concept (a) fermentation of bio-waste and biogas upgrading to bio-methane, including CO2 separation; (b) fermentation of bio-waste and biogas, upgrading to bio-methane and CO2 methanation using hydrogen generated from renewable energy by means of electrolysis. Chemical species: see Figure A2.
Today, nearly 70% of the total volume of manure is used for fertilization, whereas only 30% is processed in fermentation. As absolute numbers, only 100 mill. m3 out of 300 mill. m3 of liquid manure is converted into biogas [63,64]. With respect to the current discussion about over-fertilization and eutrophication due to intensive manuring, a higher share of fermentation and a corresponding build-up of biogas plants may be desirable. If the amount of liquid manure used could be doubled, a maximum amount of 18 mill. tons of bio-methane could be achieved from a combination of renewable hydrogen with CH4 and CO2 from biogas. A prerequisite for an increase in biogas production is also that sufficient silage is available. Otherwise, the share between manure and silage must be altered, leading to lower yields. Unfortunately, the trend is reversed, with biogas plants in Germany becoming increasingly uneconomical due to reduced funding. Furthermore, they were originally planned for corn-silage mixtures.
Peters et al. [65] performed a techno-economic analysis of the power-to-gas route, leading to methane costs of 3.14–3.58 €/kg CH4, corresponding to 2.25–2.57 €/lDE. Leible et al. [66] reported on different perspectives on biogas from different sources. They calculated costs of between 1.10–1.36 €/kg CH4 for the use of liquid manure and silage following concept (a) in Figure 6. If wood is used in a bio-gasification plant (see Figure 7) and methane is synthesized instead of a liquid fuel, the costs are in the range 0.70–1.66 €/kg CH4. Kappler et al. [67] continued this analysis with respect to applications for heat, power, and fuel provision. In regard to concept b), the costs could be estimated to be between 2.0–2.5 €/kg CH4.
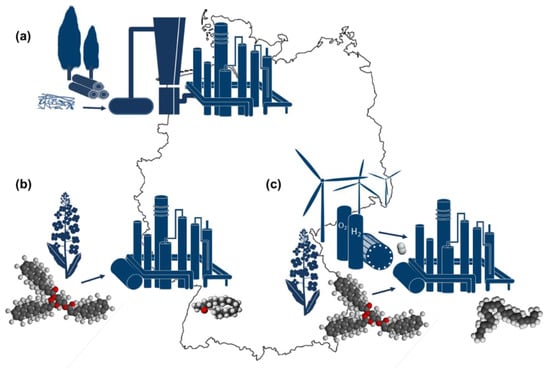
Figure 7.
Different concepts for biofuels from biomass, such as fast-growing cultivated wood, bio-oil-containing crops, residual wood, and straw. Concept (a) local pyrolysis of straw and central gasification and synthesis, such as the Bioliq process [74,75,76,77] or transport of locally-collected residual wood and cultivated wood to a central site with gasification and fuel synthesis, such as that of Choren [92]; (b) cultivation of oil-containing crops and transesterification to produce FAME [79]; (c) cultivation of oil-containing crops and hydrogenation to produce hydrotreated vegetable oil (HVO) [88,89]. Chemical species: see Figure A2.
3.2.2. Biofuels
An overview of today’s biofuels—especially for aircraft applications—is given by Peters [68]. In this review, the origin of different biomass sources, their composition and production pathways were discussed in detail. Different authors have analyzed global biomass potential [69,70,71]. Mostly bio-energy resources are based on woody residuals and must be considered locally. Kaltschmitt et al. [72] determined the potential for fuel production in Germany to be between 511–962 PJ/a, corresponding to 12–22 million tons of biofuel per annum. A large contribution arose from energy crops cultivated over 2 million ha in Germany. The potential rose from 103 to 256 PJ/a, depending on the type of crops and the conversion pathways. Short-rotation coppice such as willow and poplar, or miscanthus grass, reach a harvesting rate of up to 12 t of dry biomass per hectare. More details are provided by Peters [73].
Figure 7 shows different concepts for biofuels from biomass, such as fast-growing cultivated wood, bio-oil-containing crops, residual wood, and straw. The Bioliq process [74,75,76,77] favors the local pyrolysis of straw and a central gasification and synthesis. In accordance with a concept by the company Choren, locally-collected residual and cultivated woods were transported to a central site with gasification and fuel synthesis. Unfortunately, the activities were halted by Choren’s insolvency. In 2015, Linde Engineering overtook the activities of Choren [78]. A common, first-generation means of producing biodiesel is the cultivation of oil-containing crops and transesterification to produce FAME [79]. High expectations were placed on bio-oils from second-generation biomass, such as algae [80,81,82,83,84,85] or jatropha [86,87]. Instead of producing esters, the hydrogenation of plant oils leads to long-chain alkanes termed hydrotreated vegetable oil (HVO) [88,89]. The properties of HVO correspond to those of Fischer-Tropsch products.
According to an analysis by van Eijck et al. [90], the cost for first-generation biofuels in 2010 were in the range of 5–45 US$/GJ, and these were expected to decrease to 10–35 US$/GJ by 2020. This corresponds to approximately maximal values of 1.3 €/lDE in 2010 and 1 €/lDE in 2020. This is in good agreement with a process analysis-based cost approximation by Grube et al. [91] for combined wood gasification with subsequent Fischer-Tropsch synthesis, yielding 0.85–1.17 €/lDE. For second-generation biofuels in 2030, Eijck et al. predicted a cost range of between 14 and 26 US-$/GJ, that is, 0.4–0.75 €/lDE.
3.2.3. Power-to-Fuel
Renewable energy can generally be stored in liquid form, as described by König et al. [93]. Liquid fuels can also be synthesized from renewable hydrogen and carbon dioxide using different sources, as discussed by Schemme et al. [27]. These are termed electro-fuels or power-to-fuel. Possible fuels of this type include, for example, methanol, ethanol, higher alcohols, dimethylether (DME), oxymethylen dimethylether (OME3–5), methanol-to-gasoline (MTG) and Fischer-Tropsch products (FT). These fuels can be applied as base fuels, that is, as FT products, MTG, or drop-in components, such as methylal (OME1) and alcohols, using an existing or adapted infrastructure. DME is transported and stored in a liquefied state and can make use of adapted LPG infrastructure.
Figure 8 shows different concepts for power-to-fuel production from renewable hydrogen via electricity and carbon dioxide using different sources. Concept (a) considers the fermentation of bio-waste and biogas upgrading to bio-methane, including CO2 separation (see Decker et al. [94]), in combination with renewable hydrogen. It is designed as an off-grid system for a power-to-fuel market launch scenario based on small-scale activity at farm sites. Concept (b) foresees CO2 separation from air or industrial sources, in combination with hydrogen from water electrolysis, using electricity from wind and solar energy in the framework of a German energy system of 2050. In accordance with the design of the energy system in 2050 outlined by Stolten et al. [95] and Robinius et al. [96], renewable electricity is preferentially used by industry and end users. A curtailment of peak energy is applied to optimize the cost of hydrogen production by a limited but reasonable number of wind energy parks. A certain surplus of electricity can be used for power-to-x applications. Such an option will gain importance if the share of renewable energy continues to grow. It is important to note that a corresponding storage technology is required to buffer the fluctuations from renewable electricity production. Electrolysis is able to follow such dynamic operations, but chemical reactions are operated in mostly stationary settings. Therefore, hydrogen storage is a viable option. Concept (c) considers fuel production outside Europe in certain favored regions. With decreasing costs for hydrogen production and higher yearly average operating hours, this option will become increasingly attractive.
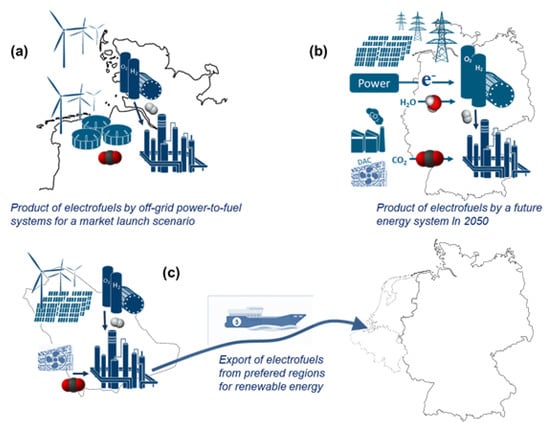
Figure 8.
Concepts for power-to-fuel production from renewable hydrogen via electricity and carbon dioxide from different sources. Concept (a) fermentation of bio−waste and biogas upgrading to bio−methane, including CO2 separation (see Decker et al. [94]), in combination with renewable hydrogen. Concept (b) foresees CO2 separation from air or from industrial sources in combination with hydrogen from water electrolysis using electricity from wind and solar energy within the framework of the German energy system in 2050 (see Stolten et al. [95] and Robinius et al. [96]). Concept (c) considers fuel production outside of Europe in certain regions. Chemical species: see Figure A2.
For light-duty transportation methane, methanol and dimethylether can be considered fuels, as reported by Bongartz et al. [97]. For freight transport by HDV, diesel-like fuels are preferred, such as FT diesel, DME, octanol, and OME3–5. In particular, OME3–5 is of much interest as a fuel or drop-in component.
The thermodynamically-oriented works on polyoxymethylen dimethylether began with Maurer [98], concerning industrial applications, and were continued by Burger et al. [99,100] for fuel applications. A number of research groups have analyzed various process routes for power-to-fuel systems. Recently, Baranowski et al. [101] and Hackbarth et al. [102] reported on progress in the production of OME3–5. Depending on the chosen process pathway, different intermediates such as formaldehyde solutions, trioxane, dimethylether, and methylal play an important role [99,100,101,102,103,104,105]. At present, the direct synthesis of formaldehyde and methanol by Oestrich [104] and the endothermic dehydrogenation of methanol as proposed by Ouda et al. [105,106] are challenging research topics. Process analysis utilizes Aspen Plus or ChemCad simulations and has been performed by various research groups [105,106,107,108,109,110,111,112,113]. An important finding of process analyses is that the high power consumption entailed by Oxymethylenether (OME) synthesis requires special heat management. A decisive factor is the choice and design of the material separation, which affects the energy balance through the heat or steam requirement. Therefore, different research groups (see the literature listed above) have proposed various innovative separation technologies, such as reactive distillation [114], adsorption by zeolites [115], pervaporation [116], thin film [110], and falling film evaporators [109].
As Haarlemmer et al. [117], Brynolf et al. [118] and Schemme et al. [119] have reported, the comparison between the results of process analysis calculations by different research groups is sometimes very difficult due to different sets of parameters. Brynolf et al. [118] compared the plant efficiencies for methane, methanol, DME, FT liquids, and MTG. Schemme et al. [119] analyzed the synthesis routes for methanol, DME, ethanol, butanol, octanol, FT diesel, and FT kerosene, as well as MTG, OME1, and OME3–5 under the same boundary conditions, that is, system efficiencies of 70% for PEM electrolysis and an energy demand of 1.2 MJ/t CO2 for CO2 separation. Such a relatively low value corresponds to separation from the flue gas of a cement plant. Important results in the context of this paper are Power−To−Fuel (PTF) efficiencies (ηPTF) of 60% (DME), 51% (FT diesel), and 42% octanol. Brynolf et al. [118] reported system plant efficiencies (ηSP) of 80% (DME, 68–92%) and 73% (FT, 63–83%), leading to 56% and 51% (ηPTF), respectively, whereas König et al. [113] published only 43.3% (ηPTF) for FT products. The decisive step for higher PTF efficiencies for FT products by Schemme et al. [119] was the integration of an autothermal reformer (ATR), leading to a product mix of 75:25 for diesel and jet fuel. Such an ATR has been developed at the Research Centre Jülich, and has been reported on by Pasel et al. [120], amongst others. The ATR converts short-chain alkanes such as LPG and crude naphtha into syngas.
Depending on the synthesis pathway, Schemme et al. [119] reported efficiencies (ηPTF) of only 27–30% for OME3–5. OME synthesis is endothermic and requires steam in the synthesis process, especially for material separation. Schemme et al. [119] have considered a three-stage steam supply, as is common in chemical production plants, leading to reliable solutions in practice. Another method can be traced back to the pinch point method of Linnhoff et al. [121] and requires optimal heat recovery, taking the second law of thermodynamics into account. Under such ideal conditions, Burre et al. [109] achieved 37% (ηPTF). Held et al. [110] in turn considered different levels of heat exchange for two synthesis pathways under the assumption of an idealized heat exchanger network, corresponding to the pinch-point method. The results vary between 29.5–36.3% for the best synthesis route and different CO2 sources, assuming that complete heat exchange takes place between all process units. Considering the fluctuating nature of renewable energy, an idealized and synchronized heat exchange is virtually impossible. In the case of an idealized heat exchanger network for all synthesis units following methanol production, the efficiencies are only 1–2% below those of a fully idealized heat exchanger network. Without any heat exchange between the single process units, 24–29% was achieved. This fits very well with the results of Schemme et al. [119] if, on the one hand, an innovative separation technique such as that of thin-film evaporators is used for trioxane-water separation (see Held et al. [19]) and, on the other, a real heat exchanger network is taken into account. Starting from methanol, Ouda et al. [105] reported a plant efficiency of 71.7% for OME3–5, which is not directly comparable to the results of Schemme et al. [119]. The process energy is partially unknown. New, homogenously catalyzed routes for OME1 and OME3–5 were published by Thenert et al. [122] and Peter et al. [123] on a laboratory scale.
The most important factors are the costs for power-to-fuel products. Techno-economic analysis methods for these were first described by König et al. [93]. The results of Brynolf et al. [118] and Schemme et al. [119] match each other very well. The values varied between 2.00–2.79 €/lDE in 2015 and 1.59–2.10 €/lDE in 2030, as published by Brynolf et al. [118] for methane, methanol, DME, FT liquids, and MTG. For these species, Schemme et al. [119] and Peters et al. [65] calculated costs of between 1.85–2.3 €/lDE. König et al. [93] published higher costs of between 3.4–5.8 €/lDE due to higher electricity costs of between 12.6–21.2 €/kWh, instead of 6 €/kWh. Improved conditions led to 1.5–2.2 €/lDE [93]. Interesting fuels such as octanol and OME3–5 lead to strongly elevated costs of about 2.85 €/lDE and 3.46–3.96 €/lDE, respectively, in relation to DME and FT diesel according to Schemme et al. [119]. Ouda et al. [105] reported costs of about 1.67 €/lDE for OME3–5, assuming methanol costs of about 0.58 €/lDE, which correspond to a fossil origin. Renewable methanol costing 1.85 €/lDE results in 5.32 €/lDE for OME3–5. On the basis of today’s unfavorable techno-economic characteristics, OME3–5 should not be recommended as a future base fuel, but it could be a blend component to decrease limited emissions.
Production facilities on an industrial scale for diesel-like fuels via the PTF route are fairly scarce. Moser et al. [124,125] reported on a demonstration plant in Niederaussem that produces DME for re-electrification purposes and as a starting substance for OME synthesis to be used as a fuel in mobile applications. The DME synthesis unit was constructed by Mitsubishi Hitachi Power Systems Europe (MHPSE). Dittmeyer et al. and Boeltken et al. [126,127] published results on the development of micro-reactors for FT synthesis at the Karlsruhe Institute of Technology (KIT), which were utilized as a kind of mini-plant by the company INERATEC.
3.2.4. Comparison of Liquid Bio- and Electrofuels
In this section, an initial comparison is drawn between bio and electro-fuels. Two aspects are of particular interest: well-to-tank efficiencies and costs for fuel provision. Cradle-to-tank efficiency determines the amount of primary energy that must be provided to fulfill a certain fuel demand. Fuel costs play an important role in determining the preferred choice of fuel, alongside infrastructure costs and those of new drivetrain systems and corresponding vehicle architectures. Figure 9 shows the cradle-to-tank efficiencies of different alternative diesel fuels based on fossil, biomass, and renewable electricity. The black-colored area of the single bars indicates an average value. A yellow range below the average indicates a minimum, whereas a dark green range the maximum. The min. and max. values are based on substantially different pathways. All efficiencies were drawn from Edwards et al. [128], representing the CONCAWE data, apart from (2), which was taken from Schemme et al. [119] and, additionally, a shaded bar for OME3–5 (see Held et al. [110]). It is obvious that syndiesel from Fischer-Tropsch synthesis, FAME, and HVO can achieve a cradle-to-tank efficiency of 50%. DME from a power-to-fuel route and bio DME based on black liquor can reach up to 60%. The use of residual bio-oils can achieve even higher values of up to 80%, whereas OME3–5 is beyond the scope, with realistic values of 30%, and optimistic ones of about 35%.
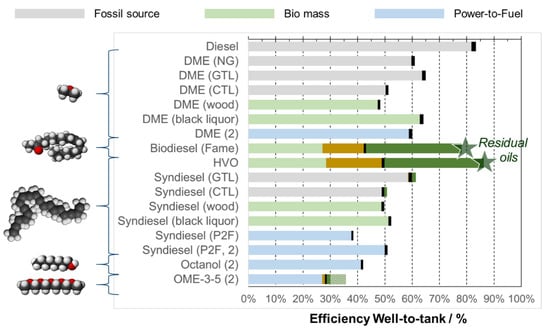
Figure 9.
Cradle-to-tank efficiencies for different alternative liquid diesel fuels based on fossil, biomass, and renewable electricity. The bars indicate an average value for a black-colored area, a yellow range down to a minimum value, and a dark green range up to a maximum. The min. and max. values are based on substantially different pathways. The efficiencies were calculated based on the database of the CONCAWE reports (see Edwards et al. [128]), (2) taken from Schemme et al. [119] and, in addition for OME3–5, a shaded bar, as with those of Held et al. [110]. Chemical species: see Figure A2.
Finally, the costs offer an advantage for bio-fuels. According to data from different sources these amount to 0.4–1.17 €/lDE [90,91], whereas the costs of electrofuels are in the range of 1.85–2.30 €/lDE. OME3–5 is out of scope, at nearly 3.5–4 €/lDE [119]. These data were derived by a techno-economic analysis based on ASPEN simulations. The most decisive parameters were the costs of hydrogen, which were 4.6 €/kg H2 here, followed by those of carbon dioxide, at 70 €/t CO2.
4. Options for Future Heavy-Duty Transportation
Within this section, the following options for heavy-duty transport were discussed:
- ICEs driven by renewable diesel-like liquid fuels or DME or natural gas (including bio methane),
- Electric drive trains using catenary systems or hydrogen-based fuel cells.
Important items to be analyzed were the motivation for the envisaged solution, the corresponding power train technology and vehicle availability, the greenhouse gas reduction potential, the emission behavior, infrastructure measures and techno-economic considerations. The review output is summarized in the form of a SWOT analysis.
4.1. Renewable Diesel-Like Liquid Fuels in Heavy-Duty Transportation
In this section, the suitability of biogenic fuels FAME and HVO and liquid e-fuels such as FT diesel and OME3–5 as a diesel substitute in heavy-duty trucks are discussed. The section is then summarized by a SWOT analysis.
4.1.1. Motivation for Using Biofuels and Electro-Fuels in Heavy Duty Transport
The use of renewable liquid fuels in internal combustion engines is being studied because the effort in terms of infrastructure and drive technology is considered to be minimal. In addition, the existing vehicle fleet can ideally be converted to run on renewable fuels in the short- to medium-term. Several aspects are not discussed in subsequent sections for different reasons: power train technology and vehicle availability, greenhouse gas reduction potential, economic considerations, and infrastructure. Alternative liquid fuels will first be tested in one-stroke cylinder engines and afterwards adapted to ICEs. The properties and production chains of different fuels have already been discussed in a previous chapter. The CO2 footprint and fuel costs were picked up to in order discuss a possible fuel switch in comparison to other solutions. The number of filling stations in Germany amounts to 14,449 [129].
4.1.2. Power Train Technology and Vehicle Availability
In case that an alternative liquid fuel fulfills the defined standard, it can be used in each ICE. Considering the German fleet data by the Federal Motor Transport Authority (KBA) [130,131] about 3.15 million trucks and 2.24 million towing trucks were registered in Germany in 2019. It is important to note that trucks with a gross vehicle weight less than 3.5 tons made up 2.62 million units in 2019 [132]. Further on, the majority of towing trucks must be accounted to the agricultural sector, that is, 1.52 million tractors etc. Most important for this analysis were the 0.22 million semi-trailer trucks, which provide 80% of the total transport capacity and demand 45% of the total fuel for road transport applications. A biofuel or an electrofuel will have a strong impact on today’s market if demand and price fulfill present and future conditions.
4.1.3. Greenhouse Gas Reduction Potential
The economic boundary conditions for alternative liquid fuels depend strongly on the origin of the input materials either biomass or carbon dioxide and hydrogen and on the various process chains for the production of selected fuels. Therefore, the greenhouse gas reduction potential has been already discussed within Section 3.2.2 and Section 3.2.3. The interaction between alternative fuel—especially for electrofuels—and combustion process is an actual task of R and D projects.
4.1.4. Emission Behavior
Unglert et al. reported on the use of biodiesel (FAME) and hydrotreated vegetable oil (HVO) in diesel engines and the corresponding emissions [24]. Following their literature review, the use of FAME led to a reduction of hydrocarbon (HC), carbon monoxide (CO), and particulate matter (PM) emissions of between 10% and 90%, depending on the set-ups and adapted model drive cycle, with average reductions amounting to 36% HC, 25% CO, and 31% particulate matter (PM) [24]. The use of HVO and HVO blends reduce emissions by between 10% and 90%, depending on the set-ups and adapted model drive cycle for HC and CO, and with a PM of up to 50%. Only NOx cannot be reduced by the use of FAME: Unglert et al. [24] reported on an average increase in NOx emissions of 13% for the use of FAME. Verbeek et al. [133] researched emissions in EURO V medium weight trucks using FAME and HVO. They concluded that B100 leads to 25% more NOx and 60% less PM emissions, while the usage of 100% HVO leads to NOx and PM reductions of 10% and 20%.
Deutz et al. [134] reported on single cylinder engine measurements using a 35% OME1-diesel blend. NOx emissions could be reduced by up to 90% in most instances during the chosen WLTP cycle. The LCA analysis also showed a reduction in CO2 equiv. from 130–100 g CO2 equiv./km (−22%), in NOx from 160 to 91 mg NOx/km (−43%), as well as a remarkable decrease in soot formation from 12 to 3 mg/km (−75%). Härtl et al. [135] measured the CO, HC, soot, and NOx emissions of two OME1-diesel blends, one with 25% OME1 and the other with 95% OME1 and drew a comparison with corresponding FAME-diesel blends for a single cylinder research engine. OME1 exhibits the highest potential for soot reduction. It can be concluded that the particulate and soot levels decreased rapidly from reference diesel to OME1-diesel mixtures (with increasing OME1 content) to pure OME1. The conflict between soot and NOx reduction can only be resolved for pure OME1. Härtl et al. [135] achieved HC and CO emissions of below Euro VI, comparable to a reference diesel following an oxidation catalyst and with high exhaust gas recycling. The calibration was performed at a medium load operating point.
Lumpp et al. [136] reported on the emissions of a single cylinder research engine for standard diesel-OME3–5 blends with 7% biodiesel and 20% OME3–5. They achieved a strong reduction in limited emissions by applying Emission Test Cycles/ European Transient Cycle (ESC/ETC), that is, particle matter (PM: −40%/−50%), soot (−60%/−50%), and particulate number (−25%/−40%). Iannuzzi et al. [137] examined diesel-OMEX mixtures (x = 1 − 7) in ratios of 90:10 and 95:15, whereby OME2–4 made up a share of about 75%. A reduction in soot emissions of up to 34% has been reported for diesel-OMEX mixtures with 10% OMEx. A slight trend for higher NOx emissions can also be inferred. Barro et al. [138] reported on an exhaust gas emission analysis of a four-stroke diesel research engine for HDV operated with a mixture of 80% OME3 and 20% OME4. They observed different effects for neat OME fuel compared to the DIN EN (German Institute for Standardization, European Standard) 590 reference diesel fuel. During near to stoichiometric operation, the OME fuel produced a large spike in CO and HC emissions. It is important to note that HC emissions contain a substantial amount of methane. The total NOx emissions were strongly affected by the exhaust gas recirculation (EGR) rate. In general, OME produces lower amounts of soot than diesel. Nevertheless, the number of soot particles in a size range mainly below 20 nm is very high compared to the corresponding reference diesel case in agglomeration mode [138]. The transmission electron microscopy (TEM) investigations by Barro et al. using an energy-dispersive X-ray system revealed that these soot particles contained a few nm-size metal inclusions. Parravicini et al. [139] optimized injector nozzles for two diesel-OME blends with 23% and 42% OME (80% OME3; 20% OME4). They [139] reported that the lower concentration of OME in diesel also improved NOx emissions and that the reduction in soot was higher than 75% for both mixtures at high EGR rates. Finally, all research groups reported that the addition of OME to diesel was beneficial for the NOx-soot tradeoff, whereby the reduction in NOx emissions itself demands further investigation.
Zhang et al. [140] published an experimental study on the use of butanol—n-iso- of up to 20%, and octanol blends of 30% for heavy-duty diesel engines. For different operating conditions, emissions such as CO decrease slightly in alcohol-diesel blends, for instance from 0.8 g/kWh to 0.55 g/kWh (octanol-diesel blend). Meanwhile, NOx and HC emissions increase slightly, for example, from 1.75 g NOx/kWh to 2 NOx/kWh, and from 0.12 g HC/kWh to 0.16 HC/kWh. Soot formation is thereby significantly reduced. Kerschgens et al. [141] performed a combustion study on n-octanol, n-octane, and di-n-buthylether (DnBE) in a single-cylinder engine. The emission behavior concerning CO and HC was found to be best for DnBE, followed by n-octane and n-octanol in the opposing sequence. NOx emissions were kept below the Euro-VI regulations by adapting the EGR rates. Their analysis showed that the ether group accelerated the ignition, whereas the alcohol group saw longer ignition times. These results explain the emission behavior of CO and HC.
Gill et al. [142] published a review of the combustion characteristics of Fischer-Tropsch diesel. They reported that limited HC, CO, NOx, and PM emissions were reduced in relation to commercial diesel. Fischer-Tropsch diesel offers a very high potential for achieving a much better NOx/PM trade-off without the often-observed decrease in fuel efficiency. They also emphasized the strong similarity of FT diesel to HVO. Verbeek et al. [133] researched emissions from buses in urban traffic with 100% GTL (Gas to Liquid), which is basically FT diesel, in EURO IV and EURO V vehicles. Based on this, they derived a 10–20% NOx and a 20% PM reduction for EURO III to EURO V vehicles. However, Verbeek et al. [133] state, that due to limited data the effect on EURO VI vehicles is not clear. They assumed a reduction in the range of 0–15% for NOx and PM in EURO VI vehicles.
4.1.5. Infrastructure
In 2019, 14,449 filling stations were registered in Germany [129] and over 105,000 in Europe [143]. This means that there exists an excellent and proven infrastructure for liquid fuels in Europe. However, the drop-in possibility of the different fuels have to be considered to ensure, that fuels can be provided in the existing infrastructure. Conventional diesel can be blended with up to 35% of FT diesel and still fulfill the European diesel standard DIN EN 590 [144] according to Kramer et al. [145]. In the U.S. conventional diesel may even be blended with up to 100% of FT diesel and still fulfils ASTM D975-20c [146]. According to Bohl et al., HVO blends up to 30% still fulfil DIN EN 590 [147]. Kuronen et al. [148] reported the utilization of 100% HVO in city buses. Anyways, caused by the similar properties discussed above, blending rates of HVO and FT diesel should be similar. FAME is blended into conventional diesel with 7% and fulfills DIN EN 590 [144]. Higher blending rates of FAME need to be approved by the vehicle manufacturers [149,150,151]. The existing infrastructure can be used without any changes for FT diesel according to Kramer et al. [33]. This should also apply for HVO and FAME. However, OME3–5 can only be blended into conventional diesel by 5–7% and still fulfill DIN EN 590 [144] according to Beidl et al. [152]. According to Kramer et al. [33], the existing infrastructure can most likely be used for OME3–5, but seals and filter might need to be replaced, resulting in about 1000€ cost per fuel pump. Experimental alcohol-diesel blends vary in the range of 10% for methanol, 10–20% for ethanol and butanol and 30% for octanol [153,154,155]. The existing infrastructure can be used for alcohols as diesel substitutes under the condition, that seals are replaced and a vapor-recovery-system is added [33]. Costs are about 2500€ per retrofitted fuel pumps for methanol according to Kramer et al. [33].
4.1.6. Economic Considerations
The economic boundary conditions for alternative liquid fuels depend strongly on the origin of the input materials either biomass or carbon dioxide and hydrogen and on the various process chains for the selected fuels. Therefore, these considerations have been already discussed within Section 3.2.4. Finally, the bio-fuel costs offer an advantage versus electrofuels, that is, 0.4–1.17 €/lDE [90,91] vs. 1.85–2.30 €/lDE.
4.1.7. SWOT Analysis
Table 2 displays a SWOT analysis for internal combustion engines fueled by bio- and electro-fuels. The advantages of using a liquid fuel with a renewable basis include the existence of an established infrastructure and the option of reaching the existing fleet of LDVs and HDVs. Such fuels can start as drop-in solutions to improve CO2 emissions and might later be switched to a base fuel. Combustion technology should be adapted to such new base fuels, because they offer options for higher efficiencies and lower limited emissions. The drawback of new investments in wind parks and electrolyzers also holds true for other drivetrain solutions as well. The production of electro fuels will be an important building block for PTX solutions and sector coupling in the future.
Table 2.
SWOT analysis of internal combustion engines fueled with bio- and electro-fuels.
4.2. Catenary Systems
4.2.1. Motivation for Using Catenary Systems in Heavy-Duty Transport
The concept of electrifying heavy goods traffic was initially pursued by Siemens in 2010–2011 as part of the ENUBA project [156,157]. Presently, Scania delivers heavy-duty trucks [158,159] for catenary systems. The goal is to use electricity directly for the propulsion of heavy-duty trucks and electrify the huge power demanded for freight transport on highways with the advantage of the high efficiencies of electric motors without being limited by the disadvantages of using batteries only. Currently, Scania is testing 15 catenary trucks on the German federal highways, A1 and A5, and on federal road B 462, together with eight haulers [160]. There exist two different hybrid concepts. In the diesel hybrid a diesel engine enables the propulsion on the roads which are not electrified. In the battery hybrid the drive train is completely electrified and the propulsion on non-electrified roads is realized by a battery.
4.2.2. Power Train Technology and Vehicle Availability
Essentially, the developed contact lines and pantographs were tested. The concept is based on a serial diesel-electric hybrid drivetrain. 2500 km diesel-electric and 1500 km electric lines were completed on a test track. Different driving scenarios, such as night driving, were simulated. The signs of wear found in the test run were moderate. In comparison to a standard diesel drivetrain, the acceleration values of up to 60 km/h are 25% better and comparable at speeds of up to 90 km/h.
Mareev and Sauer [161] analyzed the energy consumption and lifecycle costs of overhead catenary heavy duty trucks for long-haul transportation. They implemented a Matlab/Simulink-based simulation model to determine the size of the catenary system for a continuous (case a) and sectional (case b) set-up. In both cases, the mission included a driving distance without catenary contract, utilizing a battery-electric drivetrain. Case (a) assumed a distance of 680 km with a catenary capacity, and 40 km without it, whereas case (b) considered only 230 km with the catenary system, and the rest without it. Finally, more energy must be transferred to batteries in case (b), leading to a higher pantograph power of 480 kW in relation to 155 kW. The average transformer output power is also higher in case (b), corresponding to (a), that is, 34.7 MW versus 11.3 MW. In relation to a conventional diesel truck with an energy consumption of 3.84 kWh/km [161], corresponding to 38.4 L diesel/100 km, overhead catenary trucks demand 1.66–1.82 kWh/km and a battery-electric truck requires 1.74 kWh/km, corresponding to 17.4 lDE/100 km.
Another study, led by Fraunhofer ISI [5], conducted a potential analysis for different overhead line truck concepts. Various aspects were examined as part of the feasibility study: techno-economic design, vehicle technologies, the selection of routes to be expanded based on existing traffic flows, a market ramp-up, lifecycle analyses, energy-economic effects, the effects on manufacturers and logistics companies, financing models and, ultimately, questions of European integration. In the market launch phase, a share of 25% of the existing fleet, that is, 50,000–70,000 trucks, is to be converted to be compatible with overhead line technology by 2030. Wietschel et al. [162] assume a total of 250,000 trucks by the end of the market ramp-up. The study assumes that a route expansion of about 4000 km will be sufficient to convert a large part of the transport performance. The selected corridors for a ramp up of catenary trucks from Wietschel et al. [162,163] are shown in Figure 10.
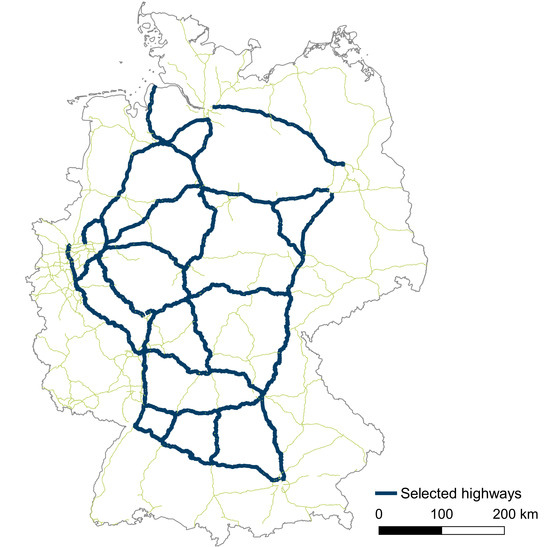
Figure 10.
Corridors for a ramp up of catenary trucks according to Wietschel et al. [162,163].
The main lines in the north-south direction on the Rhine River are along the A5 highway, from Weil am Rhein (Swiss border) via Mannheim, from the A6 to the A61 (on the left bank of the Rhine) to Nettetal and A3 (on the right bank of the Rhine) to Elten, which borders the Netherlands (corridor A). Two routes lead from Austria to Denmark via the A8 to Munich, the A9 and A7 to Rendsburg (Danish border) and via the A19 to Rostock, in route corridor B. West-east connections are in the northern part of Germany along the A4 (border to the Netherlands) near Aachen via the A1, A2 to Berlin, and A12 to Frankfurt an der Oder near the Polish border. Numerous junctions, such as the A24 from Hamburg to Berlin, complete this corridor C. In the south of Germany, the west-east corridor consists of the A5, A6, A8, and A3 with the border crossings Bad Waidhaus, A6 (Czech Republic), Neuhaus, A3, and Reichenhall A8 (both Austria), named Corridor D. There is also a fifth, Corridor E, in eastern Germany with a north-south orientation. The selected north-south routes and the west-east routes total 12.5 million km for tractor units with anticipated driving performance. Corridor B has the highest transport performance for tractor units, with 7.9 million km, followed by corridor C, with 5.6 million km and the highest transit share of 17.8%. As with Mareev and Sauer [161], the selection of highways under consideration was made on the basis of real traffic flows.
4.2.3. Greenhouse Gas Reduction Potential
When fully assembled, 10–12 million tons of CO2 will be saved according to Wietschel et al. [162]. With a consumption of approximately 20 million tons of diesel in 2025 [2], approximately 74 million tons of CO2 will be emitted on a well-to-tank basis. The saving will be between 13% and 16%.
4.2.4. Emission Behavior
Previous studies [161,162,164] have not considered the effects of introducing overhead lines for freight traffic on local emissions. Additional analyses are being carried out by the authors and in preparation for publication.
4.2.5. Infrastructure
A current research project, “StratOn,” is analyzing various future vehicle concepts for heavy goods traffic, including hybrid overhead line trucks and battery-based overhead line trucks [164]. For this, the start network, expansion network, and final expansion are being considered. The investment costs for a start network of 500 km amount to €1.7 million/km for both directions and result in a total cost of €0.85 billion. The expansion network covers 2000–4000 km in both directions and, with a more powerful configuration, the costs add up to €2.6 million/km. The final expansion will span 8000 km (both directions) and includes a power configuration with a high-performance system, and results in total investment costs of €10.2–12.2 billion. The number of vehicles will increase from 5000 to 40,000 in the expansion network, totaling 120,000 in the final phase. The connected load will increase accordingly, from 500 MW over 4 GW to 8–16 GW for the final expansion.
According to Wietschel et al. [162], the expansion of the infrastructure is estimated at €8–10 billion. Pre-financing of it could be achieved through user fees. For the market launch, traction service providers will offer to stimulate a higher utilization of the systems and minimize the acquisition costs for vehicles and the associated risk of a bad investment for the vehicle fleet. Instead of the container/train solution, the trailer of the tractor unit would be exchanged. For the haulage company in particular, there are obstacles to the purchase of overhead line trucks due to the limited transfer potential to the secondary market. Wietschel et al. [162] therefore question market acceptance among users and residents. The forwarding agencies in particular are considered reserved on the matter.
In addition to overhead line technology, induction loops for charging can also be considered. According to Wietschel et al. [162], however, these are significantly more expensive than the solution with overhead contact lines, by between 33–80%. Being laid in the ground is more than twice as expensive as installing overhead line systems, and could only be sensibly carried out as part of a complete renovation of a section of the route or a new highway.
4.2.6. Economic Considerations
First, the annual operating costs of the overhead line system and the vehicles must be considered. Kühnel et al. [164] and Wietschel et al. [163] assumed the annual operating costs of an overhead line system to be 2% of the investment cost. Annual operating costs of the overhead line system are €17 million/a, €102 million/a, and €224 million/a for the three stages start network, expansion network, and final expansion respectively, which are mentioned above. These values were calculated by Kühnel et al. [164] based on the work from Wietschel et al. [162] and include staff, external services, rent, materials, IT/communication and maintenance vehicles [164]. Due to the increasing number of vehicles, the annual specific costs for vehicles decrease from €3400/a/vehicle over €2550/a, to €1870/a for the three different stages [164]. If an annual mileage of 96,000 km is assumed, the proportional specific costs are €0.02/km.
The lifecycle costs were allocated to 71,000 trucks, ultimately leading to €90,000/truck for the continuous system, €50,000/truck for the sectional catenary, and €30,000/truck for the battery charging infrastructure. Mareev and Sauer [161] only take the main German highways into account in their analysis, namely the A1–A9. Their distance adds up to 4352 km; a share of 33% in relation to the entire German highway system of 13,000 km. On the basis of the given numbers, the total investment can be determined to be €6.39 billion for the continuous system, €3.55 billion for the sectional set-up, and €2.13 billion for the charging infrastructure. The lifecycle costs are comparable to each other, that is, leading to €0.68/km for case (b), with an improved battery lifetime at best, and to €0.705/km for a diesel truck. During a lifetime of 10 years, a distance of 939,600 km was achieved.
Wietschel et al. [162] estimate the annual TCO costs depending on the degree of catenary operation and the annual mileage. With conventional diesel, an annual mileage of 100,000 km in 2030 will lead to annual operating costs of €100,000 at 50,000 km to €65,000. With high use of the overhead line of 80% here, the costs are slightly lower, that is, €90,000 at 100,000 km and €60,000 at 50,000 km. The specific costs are between €0.9–1.2/km. The data from Kühnel et al. [164] and Wietschel et al. [162] are thus 35–75% higher than the costs according to Mareev and Sauer [161], but in contrast also suggest a disadvantage of at least 10% compared to diesel. According to Kühnel et al. [164] the possible elimination of the truck toll could counteract against this disadvantage as a regulatory measure. Nevertheless, clearer differences between the studies of Mareev and Sauer [161] and Wietschel et al. [162] could also be analyzed. The basic numbers for the battery technology used in both studies are essentially of the same order of magnitude. Mareev and Sauer [161] considered high-energy density batteries with 0.125 kWh/kg and high-power batteries with 0.9 kWh/kg at costs of about €300/kWh and €400/kWh, respectively. They implemented batteries at between 96 kWh (high power and continuous catenary installation) and 190 kWh for high-energy batteries, leading to a battery mass of 100 kg and 1500 kg, respectively. Wietschel et al. [162] assumed a battery energy density of about 0.315 kWh/kg, costs between €140/kWh and €233/kWh, and an installed battery capacity of 250 kWh, leading to a battery mass of 800 kg. Mareev and Sauer [161] observed the hybrid solution, consisting of a partial overhead line in connection with a high-performance battery with Total Costs of Ownership (TCO) costs of approximately €0.68/km up front. According to Wietschel et al. [162], the hybrid solution consisting of a battery and overhead line is less economically advantageous. In a scenario with an overhead line expansion of approximately 4000 km, a mileage of 50,000 km would need to cover an average of 130 km in battery mode—on the one hand, for the 20% share on the highway and, on the other, for access routes on the highway. The design of the battery system, according to Wietschel et al. [162], limits the purely battery-operated route to 100 km in terms of its costs. With an annual mileage of 20,000 km, a distance of 100 km can be shown, but the TCO costs in this case are €45,000, that is, €2.25/km. The reason for the significantly different assessments lies in the assumptions. Mareev and Sauer [161] assume, when operating the partially implemented overhead line, that in addition to the provision of electrical drive power, the battery will also be recharged. As a result, the charging power has to increase from 155 kW to 480 kW. With the introduction of overhead line trucks, Wietschel et al. [162] assumed an increase in electricity consumption of 7%. This raises the question of the local distribution of demand and the locally-available electrical charging power. According to Mareev and Sauer [161], an installation would again have to be carried out using the methodology of Wietschel et al. [162].
The comparison of the studies by Mareev and Sauer [161], Kühnel et al. [164], and Wietschel et al. [162] offers a relatively moderate range for the minimal costs, and the differences can be attributed to different assumptions. The freeway network considered by Mareev and Sauer [161] for the A1-A9 highways with 8700 km in both directions roughly corresponds to the length of the final extension of 8000 km in Kühnel et al. [164], but requires standard electrical engineering without a high-performance component. The comparatively low investment costs of €6.4 billion are also reflected in the low specific costs of approximately €0.75 million/km. The gradual expansion of the network means that the high investment costs can only be taken into account if the number of vehicles increase from 5000 to 120,000. The calculation assumes an operating time of the overhead line network of 20 years, while the vehicles will only be in use for five years. For instance, the €11.2 billion were divided by 20 years and 120,000 vehicles and, depending on the vehicle’s operating time, multiplied again by a factor of 5 based on the operating time. According to Kühnel et al. [164], investment costs total €8500/a/vehicle in the starting network and up to €4500/a/vehicle in the final stage. Applying the same methodology, based on the assumptions of Mareev and Sauer [161], €4500/a/vehicle can also be achieved. Kühnel et al. [164], as well as Mareev and Sauer [161], reported on user costs per vehicle for the years 2025 and 2030. These consist of the vehicle costs of around €180,000 for diesel compared to that for the hybrid overhead line truck of around €200,000; toll costs of approximately €80,000 for 5 years of operation, along with the fuel or electricity costs and the energy supply infrastructure costs. It is important to note here that the infrastructure costs in the expansion network with full capacity and 40,000 vehicles increase from €29,700/vehicle to €59,500/vehicle with half capacity (20,000 vehicles). Ultimately, compared to diesel with TCO costs of €410,000–420,000/vehicle, values of 460,000–550,000 €/vehicle result, depending on the case study. Assuming an annual mileage of 100,000 km and a five-year operating time, the costs for combustion engines are between €0.84/km and, for overhead line systems, are €0.92/km–€1.1/km. It must be remarked that the paper reflects data from literature instead performing an own TCO analysis.
4.2.7. SWOT Analysis
Table 3 shows a SWOT analysis that summarizes the results of the literature review. The strengths of the catenary solution include the high efficiency of the complete chain and the option for zero-emission long-distance transport. Weaknesses include the need for the build-up of long-distance catenary networks on highways.
Table 3.
SWOT analysis for diesel-hybrid overhead catenary trucks.
At the European level, there is a lack of political acceptance for hybrid catenary technology to shift transport services to rail. Currently, four times the freight transport capacity is accommodated by road than by rail. Rail transport can therefore not take up freight transport performance without the massive expansion of the rail network.
4.3. Natural Gas as an Alternative Fuel in Heavy-Duty Transportation
This section describes the motivation for using natural gas in heavy-duty transport. It is followed by a discussion of engine technologies. Based on these data, the possibilities for greenhouse gas reduction are discussed, followed by economic considerations.
4.3.1. Motivation for Using Natural Gas in Heavy-Duty Transport
Natural gas is considered the cleanest fossil fuel and can be mixed with up to 100% renewable methane. The overall motivation for using natural gas in heavy-duty transport is the reduced dependency on crude oil it offers and the use of different countries for energy supply [41]. The common drivers for natural gas in transport are air quality and energy security. The Deutsche Energie Agentur (DENA) study also defines regional drivers in selected countries [41]. These include climate change mitigation, national competitiveness, and job creation, and an EU directive on the development of an alternative fuels infrastructure and noise reduction in urban areas in the case of the Netherlands. For China and the U.S., high competition in logistics and, for the U.S., the natural gas boom, are listed.
4.3.2. Power Train Technology and Vehicle Availability
Among other possibilities, heavy-duty trucks that use natural gas are already available and being used in different parts of the world. In 2017, more than 230,000 LNG trucks were in operation in China [40]. Engine technologies for natural gas vehicles can be classified in three groups: spark ignition (SI) engines, dual fuel (DF) engines, and high pressure direct injection (HPDI) engines. Spark ignition engines are typically used in passenger cars but are also in in use in many trucks. These are adapted diesel engines for natural gas operation that use spark ignition mechanisms. With this technology, air is combined with fuel before being injected into the combustion chamber. The engines have a lower compression ratio than diesel engines, with modified cylinder heads to position the spark plugs and added throttle to adjust air flow and reduce the size of their turbochargers. A three-way catalyst is required for exhaust gas conditioning. In dual fuel engines, a mixture of natural gas and air is drawn into the combustion chamber, and is then ignited by diesel injection. As the name implies, not only natural gas but also diesel fuel is required for the operation of this engine type. However, a lower compression ratio of 12:1 is possible with diesel engines, as a higher ratio leads to a risk of detonation, namely an untimed combustion event and structural damage to the engine. This engine type offers advantages in cruise mode; yet, urban operation at low speed and frequent load changes demands high diesel shares and even pure diesel operation is required for the engine to achieve its maximum power. As diesel is used together with natural gas, a complete diesel emission system is required in dual fuel engines. In high-pressure direct injection engines, a small amount of diesel is injected into the combustion chamber in order to ignite the mixture. Using the same injector system, a metered amount of natural gas at high pressure (>200 bar, up to 600 bar) is injected. Using this approach, a high compression ratio (16:1) and thus the same power, torque, and fuel economy as full diesel operation can be achieved. Although a much lower amount of diesel is used than in dual fuel engines, a complete diesel emission system is required. The HPDI technology is generally combined with LNG as the fuel [42,165].
Wei and Geng [166] also list the above-mentioned advantages of HPDI technology, but point out the high cost of the special injector and control difficulties as disadvantages. Therefore, they focus on the dual fuel technology as a more practical approach to the use natural gas in a diesel engine in their review. However, they point to a trade-off between NOX and hydrocarbon emissions from a dual fuel engine and state that the hydrocarbon and CO emissions may increase by more than 100 times. In another review, Boretti [167] concludes that the key properties of an LNG injector are its high pressure, fast actuation, high atomization, and flow rate, and that these lead to a better performance than diesel with reduced emissions of PM, NOx, and CO2.
Another possibility for direct injection is low-pressure direct injection of around 16 bar. Fasching et al. [168] performed a detailed analysis of this concept and reported that further studies must be performed in order to reduce engine-out and tailpipe methane emissions.
Dual fuel engines can be operated with 60–80% natural gas, whereas the share of natural gas is increased to 90–95% in high-pressure direct injection engines [165]. Dunn et al. demonstrated a brake thermal efficiency map using a first-generation HPDI engine with 456 kW output, with values higher than 40% for the majority of the map, and a large region at or above 44% [169].
Iveco Stralis Natural Power manufactures two LNG tanks that can achieve a driving range of 1600 km [170]. A vehicle equipped with them can also be operated with CNG. According to IVECO, the 460 PS motor offers the same payload as a comparable diesel vehicle [171]. In this case, spark-ignition stoichiometric combustion is applied to natural gas [172]. Therefore, additional diesel fuel is not required and a three-way catalyst can perform the exhaust after-treatment. Based on product specifications, 40% energy efficiency is achieved within a broad operational window between the maximum torque and maximum power [171]. Volvo FM LNG has two versions, with 420 PS and 460 PS, that deliver equivalent performance with a regular Volvo FM diesel truck of the same rating. The maximum range of this LNG vehicle is estimated to be 1000 km. The technology uses 90–95% natural gas and a very small amount of diesel based on the HPDI engine principle, as explained above. According to Volvo, the CO2 reduction using LNG is estimated to be 20% [173]. Similar to Iveco Stralis Natural Power, Scania’s gas motor with 410 PS can achieve a driving range of 1600 km with two tanks. The motor operates on pure natural gas using spark ignition. According to Scania, the engine emits up to 15% less CO2 than a comparable diesel motor. In Europe, Volvo, Scania, and Iveco also offer trucks in series production with lower range CNG tanks. In addition, Mercedes Benz offers series-produced CNG trucks. In the U.S., Cummins Westport offers its ISX12N gas motor with 400 HP based on spark ignition, and for heavy-duty vehicles with CNG and LNG storage [174]. A second-generation, high-pressure direct injection engine system from Westport is also available for original equipment manufacturer (OEM) integration [175]. As the above discussion indicates, to the best of our knowledge, at present the most promising engine technology for natural gas-powered heavy-duty trucks, offering the highest efficiency and emissions saving potential and high-pressure direct injection, is only offered by Volvo.
4.3.3. Greenhouse Gas Reduction Potential
Apart from the estimations of CO2 emissions reductions from the truck OEMs above, several publications have estimated the greenhouse gas reduction potential of using natural gas in heavy-duty transport. Dunn et al. [169] performed a tank-to-wheel assessment of the first-generation HPDI engine based on their emissions analysis during transient and steady-state cycles. The authors state that they did not perform a well-to-wheel analysis due to the uncertainties surrounding upstream emissions. They assumed a global warming potential of 25 for methane. For this evaluation, they combined tailpipe emissions with dynamic venting and hydraulic pump power and found a reduction of 22.9% of CO2eq compared to baseline diesel. Tailpipe CO2 emissions predominated this number, with tailpipe CH4 contributing 3 percentage points and dynamically vented CH4 1.3%.
Rosenstiel et al. [41] point out that, although LNG emits 25% less CO2eq per MJ of fuel, the combined energy-specific advantage drops to 16% due to higher emissions during its production. In order to analyze different fuel and engine combinations, they conducted a well-to-wheel analysis composed of well-to-tank (fuel production and transport) and tank-to-wheel (combustion) components. They calculated the reference LNG case based on spark ignition, as no data were available for HPDI technology at the time. They ended up with a slight tank-to-wheel advantage of 3.6% for the LNG truck compared to its diesel version. Among the fossil routes studied, LNG imported from Norway to Germany resulted in a 2% reduction in the well-to-wheel balance. Other routes, such as imports from Qatar or regional liquefaction from pipeline gas, resulted in a respective increase in emissions of 9% and 10% using the spark ignition engines, assuming that the second-generation HPDI technology, in combination with imports from Qatar, resulted in a 10% reduction. The combination of the HPDI technology for tank-to-wheel and LNG imports from Norway to Germany (well-to-tank) as the single options leading to the highest reduction potential was not explicitly considered in this report, but overall, this combination can lead to a 21% reduction in the well-to-wheel balance. Among the renewable liquefied methane routes considered, liquefied biomethane (50% energy crops and 50% manure) resulted in a 62% reduction and liquefied synthetic methane from power-to-gas in 92% less greenhouse gas emissions than the baseline diesel. A mixture of 20% liquefied biomethane in LNG brought about a 14% reduction.
Alamia et al. [176] defined the cycle efficiency of a diesel engine as 43% and the maximum efficiency as 45% to serve as a benchmark. The spark ignition engine, which is the most common format, reaches a cycle efficiency of 35% and maximum efficiency of 39%, using 100% natural gas as fuel. The dual fuel engine with a 70% fraction of natural gas achieves a cycle efficiency of 40% and maximum efficiency of 42%. The high-pressure direct injection reached the same efficiencies as a diesel engine with a 95% natural gas fraction cited. Based on these engine performances, they analyzed the total well-to-wheel greenhouse gas emissions for different fuel and engine combinations. These fuels included bio-LNG, bio-CNG, LNG, CNG, and diesel. The routes based on biogenic fuels (bio-CNG and bio-LNG) resulted in emissions reductions of 43–47%, 60–67%, and 64% of diesel engine emissions in dual fuel, spark ignition, and high-pressure direct injection engines, respectively. The highest reduction of 67% was possible for the combination of SI and bio-CNG, followed by HPDI and bio-LNG, with 64%. These reductions were significantly higher than those from fossil fuels LNG and CNG, which were in the range of −1.4–15%. The increase in the comparison to diesel was observed for the SI and LNG routes. In this analysis, the well-to-tank emissions for the biogenic routes were higher than for fossil fuels due to the high electricity demand, depending on the electricity mix consisting of renewable, fossil fuel, and nuclear elements. The SI and HPDI engines exhibited comparable greenhouse gas emissions, as the diesel share in HPDI was compensated for by the high efficiency of the HPDI technology. The large diesel share in the DF concept resulted in the highest emissions output.
In a recent study [177], the research institution TNO tested a heavy-duty truck of the Volvo FH 420 LNG type, which was introduced in 2018 and based on the HPDI technology and LNG storage. The emissions of this vehicle were compared to older results from two natural gas vehicles based on the spark ignition technology of model year 2016, and six diesel vehicles from model year 2013. Tailpipe CO2 emissions, methane slip, and boil-off from the tank were measured for a tank-to-wheel analysis. In addition, measurements of the greenhouse gas N2O were performed. The test results showed 19% lower greenhouse gas emissions for an average long-haul trip than the diesel baseline from 2013. For highway operations, the difference was even higher (23%), and for urban operations lower (8%). These values are valid for medium and low payloads, except for the combination of a low payload and urban drive cycle, where the LNG truck had the same level of emissions as an average diesel model. The share of methane emissions in carbon dioxide equivalent were low (2–3%) overall. We expect that newer diesel trucks will emit somewhat lower percentages of CO2 emissions than the 2013 models cited here. As expected, methane emissions were higher than in diesel vehicles. They were also higher than those from both types of spark ignition engine, with most methane emitted after a cold start. The TNO study delivered important results for the analysis of the emissions of the latest technology for LNG trucks based on real driving performance. The weak parts of this study are the comparison with older diesel technology and the measurements involving only one truck.
Finally, Camuzeaux et al. [178] analyzed the climate implications of a switch from diesel to natural gas in heavy-duty transportation using the technology warming potential methodology. In this work, spark ignition and high-pressure direct injection technologies were considered in combination with CNG and LNG. The SI engines were based on the 2014 models and were 13% less efficient than similar diesel engines. The HPDI technology was based on 2012 models and was 5.5% less efficient than its diesel equivalent. The applied methodology included upstream methane emissions and those during vehicle use, including potential losses incurred during refueling. According to this analysis, a fleet conversion from diesel to natural gas using the spark ignition engines affects the climate for 72 years in the LNG case and 90 years in the CNG one. The authors state that a conversion to the HPDI technology with LNG will already be beneficial to the climate already after 51 years. This is possible thanks to the technology’s higher efficiency, although the assumed in-use methane emissions are 60% higher in HPDI engines than SI ones. The study concludes that such a fuel switch has the potential to produce environmental benefits in all periods, but requires significant reductions in methane emissions and vehicle efficiency improvements.
4.3.4. Emission Behavior
Otten et al. [179] assumed that EURO VI LNG trucks with spark ignition technology have the same NOx and PM emissions as EURO VI diesel trucks based on Verbeek et al. [133]. However, Verbeek et al. [133] researched emissions of gas buses and referenced them on a diesel EURO VI bus. They observed, that a EURO V CNG bus in lean-burn operation has 8.4 and 1.15 times higher NOx and PM emissions than a EURO VI diesel bus, while a EURO V CNG bus in stoichiometric operation has 3 and 1.15 higher and a EURO V dual-fuel LNG bus has 6.95 and 6.45 times higher NOx and PM emissions than a EURO VI diesel bus. A EURO VI CNG bus in stoichiometric operation has 50–100% of the NOx and PM emissions compared to a EURO VI diesel bus according to Verbeek et al. [133]. Anyway, Verbeek et al. [133] emphasized the uncertainty of the latter measurements. They concluded, that with the introduction of EURO VI the emissions of diesel vehicles and gas vehicles with spark ignition technology most likely will be the same. As reported by Matzer et al. [180], EURO VI LNG HPDI articulated truck emissions are assumed to be the same as the ones from EURO VI diesel trucks in the database Handbook Emission Factors for Road Transport (HBEFA) Version 4.1. Matzer et al. [180] described, that emissions in HBEFA 4.1 for gas engine CNG trucks were calculated via CO2 specific emission factors based on measurements from three EURO VI CNG heavy duty vehicles and the ratio for the CO2 emissions between diesel driven vehicles and CNG vehicles from Röck et al. [181]. As a result, the NOx emissions of EURO VI CNG heavy duty vehicles are 73% on highways, 81% in rural areas and 40% in urban areas, referenced to EURO VI diesel heavy duty vehicle emissions. The PM emissions are 14%, 43% and 30% on highways, in rural areas and in urban areas of the corresponding ones from diesel vehicles. In the study carried out by Vermeulen [177], which was already mentioned in the emission behavior part above, the local emissions of the 2018 introduced Volvo FH 420 LNG truck with HDPI technology were measured, analyzed and compared to older emission measurement from spark ignition based gas vehicles, build in 2016, as well as to results from diesel vehicles, which were introduced in 2013. An analysis of NOx emissions of the dual-fuel HPDI truck found that they were higher than the diesel baseline in the combined cycle, lower than the diesel vehicle with the highest NOx emissions and between the other two vehicles utilizing spark ignition. This is mostly due to the urban cycle and cold start. During rural and highway cycles, the NOx emissions were slightly less than those from the diesel baseline, but higher than the lowest diesel value. Vermeulen [177] has concluded in his analysis, that NOx emissions of the EURO VI dual-fuel HPDI truck are on the same level as the diesel counterparts, despite the slightly higher emissions during cold start. but also emphasized, that the NOx emissions strongly depend on the number of cold starts. The particulate number (PN) emissions of the HDPI engine were lower than the average diesel vehicle value and the ones from the spark ignition gas engines in the urban cycle. However, the tested vehicle showed the highest PN emissions during highway operation. As a result, the combined cycle PN emissions were even higher than those from the diesel baseline and between the models utilizing spark ignition. Anyway, Vermeulen [177] has concluded, that the PN emissions of the LNG dual-fuel truck are on a comparable low level like the diesel trucks, but also mentions, that the conducted test trip differ a bit from the one of the diesel vehicles.
4.3.5. Infrastructure
Only marginal infrastructure costs can be estimated with respect to the use of natural gas in internal combustion engines. There is already a network of filling stations for CNG that includes 870 filling stations in Germany [182]. Anderhofstadt et al. [170] showed that the current availability of a fuel infrastructure is the most important motivator, followed by the competitive total cost of ownership. In terms of barriers, the non-existent LNG infrastructure in Germany, high purchasing price, and lack of model branding and variety were listed.
Heavy-duty trucks using natural gas are already in use in different parts of the world. In 2017, around 3000 filling stations for CNG and LNG were in operation in China [40]. In the U.S., 115 filling stations offered LNG and 1252 offered CNG for heavy-duty vehicles (classes 6 and 8) as of April 2020 [183]. At the present time, 271 LNG stations and 3785 CNG ones in total were counted across Europe [184]. Heckler et al. [185] reported on current and planned LNG stations in Germany, that is, 30 LNG stations already exist and a further 46 are in the planning phase. They announced a target for the federal administration to build up 50 filling stations for 2500 LNG driven trucks through 2020 and 200 filling stations for 25,000 trucks through 2025. Concerning CO2 targets, a switch to biogenic LNG is important, as is stated by Thys [186].
4.3.6. Economic Considerations
As was already mentioned, economic considerations play an important role in the highly competitive logistics sector. Fuel cost savings, payback periods, and total cost of ownership analyses for heavy-duty transportation with natural gas have been performed by several groups. ACT Research [42] analyzed fuel cost savings per year after a switch from diesel to natural gas. The selected application was line haul use in the U.S. at 160,000 km per year. They assumed an overall fuel economy of 2.55 km/L with diesel fuel as the reference, and a diesel price of €0.94 per liter (assuming an exchange rate of 1.12 based on the 2019 average from Statista). The cost of natural gas fuel was assumed to be €0.59 per liter diesel equivalent. Three cases were analyzed for 10%, 15%, and 20% efficiency reductions for the natural gas engine in comparison to the reference diesel one. For the diesel reference case, they also considered the cost of diesel exhaust fluid and the cleaning costs of the diesel particulate filter. The authors stated that this cost component does not exist for the natural gas version, pointing out that spark ignition technology is assumed. Assuming these figures, they reach fuel cost savings of between €19,029 and €13,863 per year using natural gas, depending on the different efficiency reductions assumed. This study only considered the fuel cost savings and not the additional costs of purchasing a natural gas truck, which forms the input for further considerations, such as payback periods and the total cost of ownership.
In their analysis of Europe, Westport [187] assumed an incremental price of €40,000 for an LNG vehicle with HPDI technology. They assumed 120,000 km annual mileage and €1.36 per L for diesel and €0.95 per kg for LNG. Assuming a consumption of 3.3 km/L for diesel fuel and 4.8 km/kg for LNG, they ended up with a payback period of 19 months and annual fuel cost savings of €25,100 per year with natural gas. Similarly, Smajla et al. [40] showed that, for 124,000 km mileage per year, an LNG truck produces a cost saving of €14,500, assuming a diesel price of €1.5/L and an LNG price of €1.33/kg. The incremental price published by Westport is in agreement with the €35,000–50,000 estimated for Germany [170]. Here, Anderhofstadt et al. [170] refer to a 3–6 year payback time compared to diesel-powered heavy-duty trucks in another study by Lischke et al. [188]. Lischke et al. showed that, for 2015 fuel prices and a €35,000 incremental price for HPDI technology, a payback period of 4.5 years is possible for Germany. However, they also found that if the energy tax reduction for natural gas does not apply in the future and the same energy tax as diesel applies to LNG, an amortization is not possible within the assumed lifetime of the truck (nine years). Anderhofstadt et al. [170] performed a Delphi study to analyze the purchasing decision for heavy-duty trucks based on natural gas in Germany. Their survey showed that current availability was the most important motivator, followed by the competitive total cost of ownership. They also pointed out that the total cost of ownership calculation can quickly change due to changing parameters, such as tax on natural gas. As barriers, the non-existent LNG infrastructure in Germany, high purchasing price, and lack of model branding and variety were noted. In Germany, the purchase of LNG trucks will be subsidized with €12,000 until the end of 2020 [189]. An older case study from Argonne National Laboratory from 2013, in which 18 LNG trucks equipped with the first-generation HPDI technology from Westport were tested for a period of 15 months in the U.S., with a listed purchasing price of $204,802 USD, which meant a $90,000 incremental cost for that time [190]. Based on the measured fuel economies, a payback time of less than three years under these conditions was calculated. In a net present value analysis of the U.K., Langshaw et al. [191] also showed that the economic payback on higher vehicle purchasing costs was driven by the lower fuel price of natural gas relative to diesel. They stated that any changes in the fuel price gap introduced a significant source of for investors. Moreover, if LNG is taxed relative to diesel on a carbon basis, no possibilities for financial savings are possible via a fuel switch to LNG. In their comparison of alternative heavy-duty drivetrains in British Columbia, Motjaba Lajevardi et al. [192] also considered trucks with spark-ignited natural gas engines and CNG storage. Their analysis showed a 15% higher total cost of ownership on short-haul cycles and up to 8% lower on long-haul cycles compared with diesel. Moreover, the parallel hybrid CNG configuration exhibited 4–12% lower total cost of ownership than the conventional diesel, except for the short-distance drayage cycle.
Finally, in order to identify the annual fuel cost without the effect of taxes, a cost analysis was performed following the same methodology as that in the ACT Research presented above. Here, a European case was simulated assuming line haul usage with 100,000 km per year. An overall fuel consumption of 30.3 L/100 km for diesel was assumed. As engine technology, the newest HPDI technology was assumed to deliver the same efficiency as a diesel engine. Using the efficiency values from [176], the CI engine was assumed to be 8% less efficient (and the dual fuel engines 5%) than a diesel engine operating at 43% cycle efficiency. The HPDI engine was operated with 5% diesel and the DF with 20%. Assuming the use of LNG consisting of 100% methane, 1 kg of LNG has an equivalent energy content of 1.39 L of diesel. The diesel price was assumed to be €0.9013/L after excluding the value added tax (VAT) of 19%. After subtracting the valid energy tax for diesel in Germany, which corresponds to €0.4704/l, the diesel price, excluding VAT and energy tax, amounts to €0.4309/L. The diesel exhaust fluid (DEF) price was assumed to be €0.5/L without VAT, which reflects the price in Germany in April, 2020 based on a survey conducted via Aral fueling stations. DEF was used in the diesel, DF, and HPDI engines, all of which used diesel in different proportions. The DEF consumption corresponds to 5% of diesel consumption [193]. As the reference case for each motor technology, the natural gas fuel price is defined as €1.13/kg, which was the average price of CNG fuel in Germany in the year 2019. A subtraction of 19% VAT and the energy tax for CNG and LNG (€0.19/kg) results in €0.76/kg and €0.55/L diesel equivalent. In addition to the reference cases with different natural gas motors calculated at this natural gas price, three further fuel cases for the HPDI option were also considered. These constitute the renewable routes for the production of methane. Firstly, bio-methane produced from renewable sources was considered. The average purchasing price of bio-methane from renewable sources for 2018/2019 was estimated by the German Energy Agency to be €0.0706/kWh based on data from 21 biogas plants using renewable sources [194]. Secondly, synthetic methane production from hydrogen and carbon dioxide captured from power plants in Peters et al. [195] was considered for two cases. The first case (PtG) is based on an optimized process configuration to produce renewable methane using hydrogen produced from wind via water electrolysis and results in a methane cost of €3.51/kg. The second case (biomass) utilizes hydrogen from biomass and results in €1.73/kg. Based on this information, the annual total fuel cost was calculated, excluding the VAT and energy tax, and is presented in Figure 11. It must be noted here that liquefaction was not considered in these values. For instance, Lischke et al. [188] observed that the LNG price was about 15% higher than the natural gas price over a 14-year average in the U.S.
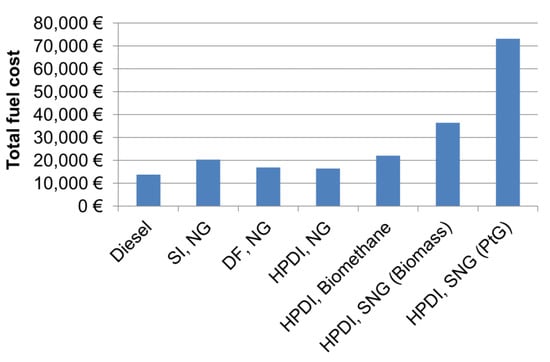
Figure 11.
Total fuel cost per year excluding VAT and energy taxes for different fuel and engine combinations compared to a diesel engine. SI: spark ignition, DF: dual fuel, HPDI: high-pressure direct injection using natural gas (CNG). The HPDI version is also calculated for bio-methane and synthetic natural gas (SNG) based on hydrogen from wind electrolysis (PtG) and biomass.
As expected, if the tax advantage for natural gas is not incorporated into the fuel cost, the diesel baseline offered the lowest fuel cost in the selected case study. From the perspective of natural gas cases (SI, DF, HPDI/NG), calculated using the average CNG price, the HPDI offers the lowest fuel cost thanks to its high level of efficiency. However, the total fuel cost is about €2500 higher than the reference diesel. For comparison, if the energy tax is not excluded from the fuel prices, the HPDI option (HPDI, NG) based on the natural gas price assumed above results in fuel cost savings of around €7000 per year in relation to the diesel case. Among the renewable routes, the bio-methane one results in the lowest fuel cost, which is 1.6 times higher than the diesel reference case. The biomass route leads to an increase by a factor of 2.6 and the PtG by a factor of 5.3. This analysis underlines the role of taxes in the switch to natural gas in heavy-duty transportation. If the tax advantage for natural gas diminishes in the future, the motivation for fuel cost savings also does. In addition, it is also apparent that the renewable methane routes, which offer the highest greenhouse gas reduction potential, result in the highest fuel costs.
4.3.7. SWOT Analysis
As in the previous sections, a SWOT analysis was performed for the natural gas option based on the findings outlined in this section, and is presented in Table 4. The identified strengths include the availability of the natural gas engines already in commercial use today, which is possible through the adaptation of diesel engines, lower fuel costs and short payback times based on present diesel and natural gas prices and, finally, the reduced dependency on crude oil by using natural gas from different sources for the huge, heavy-duty transport market. The opportunities from a switch to natural gas include the high greenhouse gas reduction potential of using methane from renewable sources based on biomass or power-to-gas routes, rapid transition possibility, and cleaner transport, as the technologies are already available and the compatible range of heavy-duty trucks is up to 1600 km using two LNG tanks.
Table 4.
SWOT analysis for natural gas-driven internal combustion engines.
The main weaknesses are the conflict between fuel costs and emission reduction potential, as well as incremental costs for purchasing the vehicle and increased emissions in practice. Today’s fossil-based options, which lead to cost advantages, result in limited CO2 savings potential, and the renewable options leading to a strong reduction in emissions result in a large price gap. The incremental costs of purchasing the vehicles make the fuel price decisive to the total cost of ownership analysis, which is of great importance for vehicle fleets. Furthermore, the results of recent on-road measurements based on the most promising engine technology show identical or even higher emissions than diesel in some of the load cycles, as discussed above. Finally, but importantly, several threats were identified by the SWOT analysis that can play a decisive role in the broad implementation of natural gas trucks for heavy-duty transport.
The risk of changes in natural gas taxation in terms of treating natural gas analogously to diesel eliminates its cost advantage and presents an important risk for fleet operators. Due to methane’s high global warming potential, methane slip, especially in upstream processes, but also during use, can lead to long-term damage to the environment instead of reduced emissions. Finally, if a widespread LNG fueling station infrastructure is not established in Europe, many long-haul fleet operators will have to adopt a conservative approach when switching to natural gas.
4.4. DME as an Alternative Fuel for Heavy-Duty Transportation
In this section, the suitability of DME as a diesel substitute for heavy-duty trucks is discussed. After outlining the overall motivation, the combustion of and emissions from DME in compression ignition engines is discussed. The section concludes with some cost aspects and a SWOT analysis.
4.4.1. Motivation for DME Use in Heavy-Duty Transport
DME is an alternative fuel for compression ignition engines. It can be produced from natural gas, coal, and biomass using first gasification and second either two-stage synthesis from methanol or a one-stage arrangement via the Haldor Topsøe process [53]. Fleisch et al. [196] note the leading role of China in DME production and use, thanks to conditions favoring the domestic production of such a clean fuel with a high value. Moreover, Schemme et al. [27] recommend DME together with OME3–5 and n-alkanes as power-to-fuel products that can replace diesel fuel for the transportation sector. This option expands the possibilities for producing DME from renewable sources and strongly reduces greenhouse gas emissions on a well-to-wheels basis, together with the biomass option. Arnold et al. [197] show that DME produced via PTF PtF processes is not only a good diesel substitute, but at the same time a key building block for producing other high-value synthetic fuels, including gasoline and OME as a promising alternative to methanol.
4.4.2. Power Train Technology and Vehicle Availability
According to the International Energy Agency − Advanced Motor Fuels (IEA’s AMF) fuel information, the use of DME as a transportation fuel is not commercially-viable today. They report on ongoing demonstrations with Volvo trucks, buses operating in China and trucks operating in Japan, and point out that no large-scale transport and supply of DME as a transport fuel is currently available [53]. Park and Lee provide an overview of vehicles that operated between 1998–2009 in their review and state that commercial vehicles that use DME enable smoke-free combustion and low NOx emissions with high thermal efficiency [47]. They conclude that most problems in the use of DME for transportation relate to fuel properties and not combustion characteristics. In their review of the combustion and emission characteristics of alternative fuels, Geng et al. [198] state that DME offers a longer injection delay, lower maximum cylinder pressure, a lower pressure increase ratio and a shorter ignition delay than diesel, which contrasts with alcohol/diesel dual fuels.
Critical properties of DME for its use as a transport fuel include its low viscosity, leading to leakage in pumps and injectors, and its low lubricity, which leads to the wear and failure of equipment [47]. Park and Lee [51] list several commercial additives as well as biodiesel and other hydrocarbon-based fuels as possible additives against leakage and surface wear. It is reported that 50% biodiesel in DME results in 22% higher viscosity than in diesel fuel [47]. Arcoumanis et al. [48] proposed sealing DME-filled vessels using inert materials such as Polytetrafluorethylen (PTFE). In accordance with this, Park and Lee [47] state that the application of Teflon and PTFE compounds in DME injection and supply systems is the most used approach, as they are inert to DME. Salomonsson [199] reports no corrosion issues when using PTFE and polyimide materials. However, it is also reported that the applied additives have a negative influence on the emissions and optimal additives are needed to improve lubrication without penalties being exacted on engine performance and emissions [47].
As DME is heavier than air, a good ventilation system is required [51]. Another issue is cavitation in the fuel injection system, which is unavoidable due to the high vapor pressures. Arcoumanis et al. [48] pointed out that when DME is pressurized to more than 5 bar, the fuel supply pressure must be between 12 and 30 bar if cavitation is to be avoided. The reason for this is the higher saturated vapor pressure at high temperatures during engine operation and the dynamic flow effects that form vapor zones in the fuel line. Together with the cavitation phenomena around the nozzle hole, high compressibility and variation according to the temperature and chemical reactions in the fuel supply systems are noted as issues for DME [47].
Based on the above-discussed fuel properties and the general properties of DME outlined in the section on Fuel properties and storage, Semelsberger et al. conclude that tanks that are twice as large and new fuel delivery systems are required for using DME in diesel engines with no need for engine modification [49]. Building on the fuel properties, the engine performance and emissions behavior can then be analyzed.
As was mentioned above, the combustion of DME is referred to as being compatible with diesel engines, and yet it is clear that different injection systems are required due to DME’s gaseous nature. The common-rail approach is often used for DME, where the fuel is injected into the combustion chamber at a pressure of at least 12–30 bar, with the pump possibly being placed in the tank, with the goal of achieving the same torque and power as diesel. In addition, dual fuel engines with diesel pilot injection are also considered [53].
In order to liquefy gaseous DME, it must be pressurized to at least 5.1 bar at room temperature. The fuel line set-up is similar to the supply system in an LPG engine, and the electronic injection system for DME fuel consists of a primary pump, a high-pressure injection pump and injector, and low- and high-pressure lines, along with a return line to the fuel tank. If high-pressure injection with electronic control is applied, the injection timing and energizing duration can be easily optimized based on the mass of injected fuel and its injection rate [47]. Given the fuel’s properties, not only the amount of fuel (1.8 times greater volume than diesel) [48] but also its energizing duration must be increased (by 37%) [47]. In addition, injection at lower pressures (200–300 bar) than a modern diesel engine already enables the superior atomization and rapid vaporization of DME in the combustion chamber due to its high vapor pressure [47,48]. Thomas et al. [52] report the maximum combustion pressure of DME to be 17.2% lower than diesel due to its shorter ignition delay, during which a less combustible mixture is formed due to DME’s high cetane number. Park and Lee also highlight the necessity of a fuel cooling or temperature control unit. As the temperature increases during engine operation, the overall temperature level rises, the fuel is also heated and its density and compressibility increase. Thus, it becomes more difficult to supply the required amount of fuel to stabilize engine operation without taking proper measures [47].
In addition to the theoretical information on the operation of diesel engines with DME, the results from laboratory and field tests deliver important findings on the analysis of engine performance using DME. Szybist et al. [200] tested a prototype Volvo FME heavy-duty truck. Considering the differences between the DME prototype and conventional diesel truck, the authors of an Oak Ridge report from 2014 conclude that both engine types achieved similar levels of efficiency. Similarly, the final report of the European BioDME project from 2013 reports on the production and use of bio-DME from black liquor [199]. Here, a common rail DME pump and injector were used and the injector design was adapted to the properties of DME, and the valves, sealings and tolerances optimized. In the field tests, ten trucks from Volvo were operated, including long haul and heavy loaded versions with payloads of up to 60 t. The local and regional haul (21 t average gross weight) truck cycle using DME fuel had lower to similar rates of consumption compared to its diesel counterpart, whereas the regional haul (51 t average) had similar ones, and the local cycle with start/stop (53 t average) had higher consumption. The total mileage of the fleet was 1,475,000 km, with one truck achieving 300,000 km. The producers and drivers had a very positive experience with DME in this field trial, given these notable achievements. Based on their analysis from 1- or 4-cylinder diesel engines modified for DME use, Park and Lee [47] conclude that DME is superior to diesel in atomization performance and that the lower heat released during combustion leads to it having lower combustion noise. In an earlier publication, from 2008, Ying et al. [201] report their results from testing DME in a 4-cylinder engine with only a slight drop in brake thermal efficiency.
4.4.3. Greenhouse Gas Reduction Potential
As the combustion process and therefore the engine performance are closely linked with the emission characteristics, focus is applied to the emissions behavior of DME operation as the next step of the analysis. Already in a 2006 review, Semelsberger et al. [49] showed that DME produced the lowest amount of well-to-wheel emissions compared to FT diesel, FT naphtha, biodiesel, bionaphtha, methanol, methane, and ethanol as alternative transportation fuels. Moreover, they found that, excluding natural gas, DME features the highest well-to-wheel efficiency of all non-petroleum-based fuels using conventional, hybrid and fuel processor-based fuel cell technologies. Recently, Zubel et al. [49] showed that DME from CNG (fossil origin) has a higher well-to-wheel emission (167.8 g CO2eq/km) than diesel (144 g CO2eq/km), but that the emissions drop strongly if they are produced from renewable sources, such as black liquor (3.6 g CO2eq/km) and PtG based on wind (4.9 g CO2eq/km). Looking only at tank-to-wheel emissions, they revealed that DME has a 15% benefit over gasoline, with octanol showing an 11% benefit, methanol 17% and methane 25%. As the benchmark technology of diesel has a 7% benefit over gasoline, all of the above-mentioned fuels show a CO2 reduction benefit considering current tank-to-wheel-based greenhouse certification.
4.4.4. Emission Behavior
Apart from the greenhouse gas reduction potential, the emission behavior of DME engines concerning NOx, PM, CO, and hydrocarbons has been widely discussed in the literature. In particular, attention has been paid to NOx emissions. The surveyed literature shows higher and lower NOx emissions than diesel, supported by IEA AMF, stating that NOx emissions are not necessarily reduced with the use of DME [53]. The faster ignition of DME increases the charge temperature in the cylinder, leading to greater NOx formation. At the same time, the lower initial heat release contributes to lower NOx emissions [47]. Similarly, the high latent heat of DME reduces NOx concentration, as the injected fuel absorbs more heat during evaporation, resulting in a large temperature drop in the combustion chamber. In addition, the low boiling point, resulting in quick evaporation, leads to a temperature drop in premixed combustion, again reducing NOx formation [51]. Furthermore, it is stated that the identical amount of fuel injected leads to less NOx formed with DME than diesel; however, in order to achieve the comparable heating value, more DME is injected than diesel, leading to a higher NOx concentration. Higher NOx emissions for the same engine load and speed conditions are also explained by the quicker ignition of DME than diesel, which results in an increased temperature in the cylinder. It is expected that, if the mixing of air and DME takes place faster, the NOx production rate can be reduced [52]. Park and Lee conclude that higher NOx emissions can easily be reduced to similar or lower values than diesel using different approaches [47]. In this regard, a widely used approach is exhaust gas recycling (EGR), which can, however, lead to lower fuel economy and higher soot emissions in conventional diesel combustion. In contrast, DME combustion results in low soot emissions. Its quick evaporation, further aided by better spray atomization, results in a very fast mixture formation, reducing the formation of soot precursors [50]. It is even considered soot-free, with the lack of C-C bonds and high oxygen content [47,51]. This is a critical advantage of DME combustion, as the typical soot/NOx trade-off does not exist for DME operation. With this, operation at higher EGR rates is possible, reducing the NOx concentration without the risk of producing higher soot emissions. At higher EGR rates, the peak combustion temperature and the amount of oxygen in the fresh charge supply are reduced [52]. Although these measures help limit NOx emissions, higher EGR rates also lead to higher CO emissions of up to 70% for 30% EGR. As mentioned above, EGR also has a negative influence on the fuel economy.
Principally, the CO and HC emissions from DME combustion are also lower than with diesel, due to the presence of the oxygenated components, the excellent volatility and fast ignition quality of the fuel [47]. Due to good evaporation, atomization and mixing characteristics, and the resulting shorter ignition delay than diesel, DME combustion results in lower HC emissions [51]. The CO emissions are usually less than those of diesel due to the high H/C ratio, lack of C-C bonds, good mixing behavior and fast oxidation of the produced intermediates. As was mentioned above, certain operating conditions can still lead to higher CO concentrations. Park and Lee suggest using oxidation catalysts and improving the combustion and emission characteristics to resolve this issue [51]. Thomas et al. [52] mention homogenous charge compression ignition (HCCI) for simultaneously reducing NOx and PM emissions. Other possibilities listed by the authors include controlled fuel injection, fuel injector configurations, injection pressures, and the use of combustion after-treatment processes such as EGR, oxidation catalysts, and particle filters. These show that a multi-stage EGR controlling the gas temperature has benefits and recommend moving to higher EGRs and controlling the CO and HC emissions through the use of oxidation catalysts based on the chemical compositions of exhaust gases and temperatures. They report up to 40% NOx reduction being observed without visible smoke and drops in engine efficiency on the basis of the higher EGR ratios. Arcoumanis et al. [48] state that ultra-low emission vehicle (ULEV) limits can be reached for NOx, but oxidation catalysts are required for HC and CO. Park and Lee [47] also conclude that multiple injection and premixed combustion leads to a very strong reduction in NOx, without a reduction in engine performance. However, they also note the presence of oxygen compound emissions and state that these can be reduced to a negligible level using an oxidation catalyst. The effect of additives and lubricants on emissions is also addressed in the literature, highlighting the demand for better additives than the existing ones [47,52]. Further possibilities listed for after-treatment in DME engines include lean NOx traps, urea-selective catalytic reduction (SCR), and hydrocarbon-selective catalytic reduction (HC-SCR) [51].
Similar to engine performance, data collected from laboratory tests and fleet trials is available for emission characteristics. In 2008, Ying et al. [202] detected 40% less NOx at 20% EGR during testing of DME in a four-cylinder engine. At the same time, they observed an increase in CO and HC emissions. The CO emissions could be decreased by mean of a commercial oxidation catalytic converter, but an obvious reduction in HC concentrations was not achieved. In a further study from 2009, they applied HCCI with direct injection to DME in a single-cylinder engine [201]. They could thereby demonstrate an extended operating range of the engine with a comparatively higher efficiency than HCCI without direct injection, and lower CO and HC emissions. The NOx emissions were higher at higher loads and were reduced by cooled EGR. However, the HC and CO emissions increased with this strategy. Fleisch et al. [196], in a review from 2012, reported that a DME truck in Japan with EGR, de-NOx, and oxidation catalysts demonstrated lower NOx, CO, HC, and PM emissions than specified in the Euro VI regulations. During the field test of various Volvo trucks for the BioDME project in 2013, the relevant emission standard at the time, Euro V, was still fulfilled after 183,000 km of operation, which was the highest accumulated mileage achieved by a single truck within the project time-frame [199]. During the testing of a prototype Volvo truck with DME by Oak Ridge National Laboratory in 2014, only a three-way catalyst was used without a particulate filter or lean NOx after-treatment [200]. Laboratory tests calibrated to meet Euro V showed that the NOx, PM, CO, and HC emissions were below the expected level and no PM after-treatment was necessary. The authors concluded that further NOx reductions are feasible using NOx after-treatment, such as urea-SCR, in order to achieve the Euro VI standard, which can also enable more efficient combustion.
Recently, Benajes et al. [203,204] and Kim et al. [205] published regarding the numerical optimization of DME combustion in a diesel engine. Kim et al. [205] sought optimal operating conditions of engine operation with DME and diesel, varying the start of injection, injection pressure, and angle, as well as the equivalence ratio, using a genetic algorithm. Meanwhile, Benajes et al. first optimized the combustion system design of a heavy-duty compression ignition engine operated on DME with another genetic algorithm optimization with the help of computational fluid dynamics [204]. Here, the scope of optimization included the piston bowl and nozzle-matching, as well as the injection schedule, to identify the system that delivered the highest efficiency given the limitations in terms of emissions and thermomechanical stress. The results showed that fuel and combustion systems must be optimized simultaneously and that an absolute efficiency improvement of 6.9% over baseline the diesel configuration can be achieved with similar emissions. Secondly, stoichiometric combustion was investigated in order to only equip the system with a three-way catalyst to control the NOx emissions [203]. It was noted that high-EGR rates for controlling the NOx led to lower efficiency and higher PM emissions. Amongst alternatives, such as the SCR or lean NOx trap, the current conversion efficiency of 90–95% is achieved today using SCR, but in order to achieve the proposed California Air Resources Board (CARB) targets, 99% efficiency will be required in the future, according to the authors. This was the motivation for investigating the stoichiometric operation, coupled with a three-way catalyst, which would be possible with DME due to its low sooting behavior. Since replacing a conventional diesel combustion system with a stoichiometric DME combustion system resulted in poor performance, an optimization study was performed that varied the geometric, injection, and air management settings. The optimized set-up revealed a slight improvement in the net indicated efficiency over diesel; however, this was with very low NOx emissions (0.0074 g/kWh), which are promising for meeting the requirements of future NOx legislation. Both simulation studies show the potential of DME as a diesel substitute in heavy-duty transport, but also the need for dedicated development efforts in order to exploit the available potential.
4.4.5. Infrastructure
The main advantage of using DME is similar physical properties to LPG. With this, the handling of DME as a new transportation fuel is not a major issue and current experience with LPG infrastructure can be drawn upon. In Germany, about 7100 LPG filling stations are installed [182].
4.4.6. Economic Considerations
The final part of this analysis deals with economic considerations. The IEA AMF anticipates similar economic characteristics for DME as for CNG and LNG in large-scale plants. It is also expected that fuel-grade DME, with small amounts of methanol and water, will be available at lower costs than chemical-grade DME, and that DME engines have lower costs than diesel engines due to their less secure structure and lower injection pressure [53]. The review by Fleisch et al. [196] revealed that the production cost analysis of DME from natural gas and coal only shows slightly higher values than the corresponding costs for methanol from these sources. The techno-economic assessment of DME synthesis by Michailos et al. [206] based on the power-to-fuel concept estimated five times higher costs of the production of DME than the average terminal gate price of diesel. In their techno-economic analysis of various hydrogen-based synthetic fuels from renewable electricity, Schemme et al. [119] calculated the highest power-to-fuel efficiency of 60% and lowest production cost of 1.85 €/lDE for DME, highlighting the potential of DME among the other potential PtF routes. They also concluded that the synthesis of DME, similar to methanol, is less complex and more technically mature than other routes that have been evaluated.
4.4.7. SWOT Analysis
Finally, based on the detailed analysis of the state-of-art, and the perspectives on DME as a fuel for heavy-duty transport, a SWOT analysis was performed and its results are presented in Table 5. Among the strengths, the first is the advantage of the similar physical properties of DME to LPG. Thereby, the handling of DME as a new transportation fuel is not a major issue and current experience with the LPG infrastructure can be drawn upon. As the combustion of DME in compression ignition engines has been successfully demonstrated in field tests, the technological risk of introducing a new fuel is also reduced. The final strength is the reduction of local emissions due to the nature of the fuel, independent of its origin. The most important opportunity for DME is its high greenhouse reduction potential if it is produced from the biomass or PtF routes. Furthermore, it offers a fast transition to cleaner transport based on renewable energy. The absence of the NOx/soot trade-off enables a wide range of opportunities to optimize the combustion performance and emissions.
Table 5.
SWOT analysis of dimethylether (DME)-driven internal combustion engines.
The weakness of DME can be seen in its viscosity and lubricity, which demand special additives. Ideal additive mixtures must not only ensure operation with no leakage and wear, but also no additional emissions. Despite the advantageous combustion properties of DME, its fuel tanks are larger and more complex than those for diesel. Finally, although DME can already be used after proper modifications are made to a diesel engine, dedicated engine development is still required to exploit the high performance and low emissions potential of DME. Among the identified threats, one of the most promising routes for producing DME, the PtF one, results in high production costs that can drive the total cost of ownership to an unacceptable level for fleet operators. The next limitation is the limited capacity of renewable DME to serve as a diesel substitute in large quantities. As there is no existing infrastructure for DME as a transportation fuel in Europe, setting this up could also be challenging. If a widespread fueling station network is not guaranteed in Europe, fleet operators might not take the risk of switching to DME.
4.5. Hydrogen-Fueled Heavy-Duty Vehicles
Current industrial activities underline that hydrogen-fueled fuel cell-electric trucks (FCETs) are viable candidates for future road-based freight transport. Hydrogen-based ICEs were recently announced by MAN Trucks and Buses SE as a bridging technology, with practical trials in collaboration with selected customers planned for 2023–2024; see [207]. In the absence of detailed information, it seems to be too early to cover this option in this review, which is considered a bridging technology on the way to fuel cell-based, long-distance truck transport. In the following section, the status and prospects of hydrogen-fueled heavy-duty trucks utilizing fuel cells are presented. More specifically, the analysis is focused on the physical and techno-economic performance of this powertrain solution. Fuel cell drive systems emit no pollutants. Therefore, the subsection concerning emissions is omitted for FCETs.
4.5.1. Motivation for Using Hydrogen in Heavy-Duty Transport
Aside from battery-electric alternative and catenary systems, hydrogen-fueled fuel cell-electric trucks enable transport with zero tailpipe emissions at high efficiency. Moreover, the fuel shift from today’s fossil- to fully renewable-based fuels can be facilitated by this powertrain-fuel combination. On an energy system level, the large-scale storage option required for balancing variable feed-in from renewables can be realized by hydrogen, for example, by sequestering it in salt caverns. As an alternative option, the use of hydrogen in ICEs is also considerable. Unfortunately, current research and development activities are not published well and must be analyzed in future. Nevertheless, all available information were compiled in a subsection in the Appendix A.
4.5.2. Fuel Cell Technology and Vehicle Availability
At present, substantial interest is apparent among truck manufacturers, such as Hyundai, Toyota [208], Volvo and Daimler [209], MAN [207], Nikola, and IVECO [210]. The alternative of using hydrogen in internal combustion engines is not considered in this study due to their reduced efficiency compared to fuel cell-electric powertrains, which negatively effects the required storage mass, volume and costs.
The configuration of the FCET powertrain is similar to the passenger car concept, comprising a hydrogen tank and fuel cell system (FCS) that delivers electric power to the high-voltage DC link and a hybrid battery for delivering or receiving electric power from the DC link. In contrast to battery-electric drives, only the tank system must be scaled to the application-specific driving range, assuming the maximum power output of the fuel cell system and the maximum weight of the vehicle being constant in both cases.
At present, hydrogen-fueled trucks have only limited commercial availability. Initial projects related to their application include the truck manufacturers of Toyota and Hyundai. The following details are presented based on information published in Forbes (2019) [211]. Jointly with Kenworth, Toyota developed semi-trucks for operation within California’s Shore-to-Store project in Los Angeles. The 36.3 t trucks are equipped with a 70 MPa (700 bar) fuel tank that provides hydrogen to an up-scaled fuel cell system derived from the passenger car model, the Toyota Mirai. The hybrid battery offers a 12 kWh storage capacity. The electric motor features a capacity of 500 kW. The refueling time is given at 20–25 min [211]. The hydrogen infrastructure comprises two fueling stations that are capable of truck refueling.
The Swiss-based company, Hydrogen Mobility AG, brings Hyundai Motor Company and H2Energy together for marketing the Xcient Fuel Cell truck, based on a pay-per-use model [212]. The truck, with a gross weight of 34 t, utilizes two 95 kW fuel cell systems and a 34.5 kg hydrogen storage tank based on 350 bar technology [212]. Additional electric power can be drawn from a 73.2 kW hybrid battery. The payload is claimed to be similar to a diesel-fueled ICE truck of the same size and the tank range is given as 400 km. It is planned to have 1600 Xcient Fuel Cell trucks on the road in Switzerland by 2025; the target for 2020 is 50.
In FCETs, electric power is typically transmitted to the electric drive by the fuel cell system and a hybrid battery. The hybrid battery can either store energy from regenerative breaking or provide peak power during acceleration or grade driving. The nominal power and energy of the fuel cell system and battery, respectively, must be optimized in terms of cost, depending on the application-specific power requirement. In Europe, vehicle registration requires the fulfilment of a powertrain rating that may not be lower than 5 hp/t of gross vehicle weight (GVW). However, in practice the power rating is significantly higher, with values as displayed in Figure 12. For instance, a heavy-duty truck (HDT) with a total mass of 40 t would require 225 kW of mechanical power in its wheels for climbing a 3% grade at a velocity of 50 km/h. The frontal area, air drag, and rolling resistance factors would be given as 8 m2, 0.5 and 0.01, respectively. This is somewhat higher compared to the power rating based on the abovementioned factor of 5 kW/t that would result in 200 kW. However, it would better comply with required driving capabilities in the real-world driving context. This and subsequent estimations of powertrain component scaling are derived from a driving resistance-based performance analysis, including air drag and rolling resistances, as well as force requirements for grade driving.
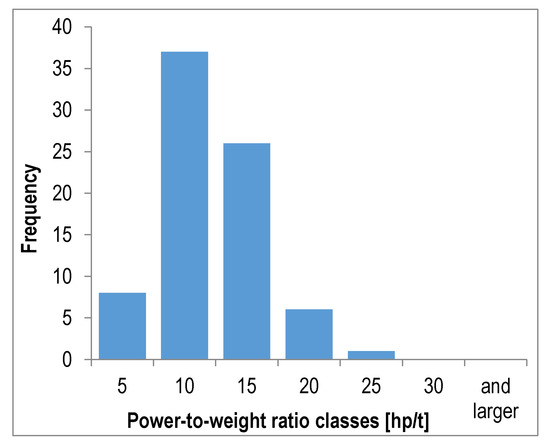
Figure 12.
Power-to-mass ratio of current heavy-duty trucks. The data are based on a 2020 survey on trucks from Mercedes Benz, Mitsubisho Fuso, Volvo, Scania, Hino, Kamaz, Peterbilt, Western Star, and MAN, which results in 78 datasets on trucks with a minimum of 12 t of gross vehicle or gross combination mass (the higher value was taken, if available).
An orientation in terms of mass and volume for an FCS for HDTs could be given on the basis of the specific power and power density of fuel cell systems, for example, those provided by the DOE (2017) [213]. The 2015 status is presented here as 659 W/L and 640 W/kg, whereas the ultimate target is 650 W/kg and 850 W/L [213]. These values apply to passenger car systems and may differ for truck applications with more stringent requirements, for example, regarding durability and robustness. Starting with the abovementioned 225 kW and also assuming estimates for powertrain component efficiencies for mechanical drives and electric motors, respectively, the power rating of the hybridized fuel cell system would be 257 kW. If the FCS alone were capable of delivering this power estimate, its mass and volume would be 395 kg and 302 L, respectively, if the Ultimate target were applied. Although additional mass and volume would be added to the powertrain by the hybrid battery, power electronics, and electric motor, these figures provide an indication that the FCS is not likely to cause greater challenges regarding the packaging of powertrain components.
4.5.3. Greenhouse Gas Reduction Potential
The preferred sources for providing hydrogen for transport applications are its production via natural gas reforming, electrolytic hydrogen using renewable power, or byproduct hydrogen from industrial processes. Each of these alternatives exhibit different signatures regarding specific greenhouse gas (GHG) emissions. As truck application-specific values are not available, hydrogen provision for passenger cars is considered here. According to Joint Research Centre (JRC) [214], hydrogen from natural gas results in GHG emissions ranging from 104–135 g CO2/MJf on a well-to-tank basis. These values vary on the basis of assumptions regarding the natural gas supply scheme for Europe and by the concrete supply pathway with different assumptions regarding central or onsite reforming and the specific mode of transportation. When produced by electrolysis, the range of values is even wider, with 7–425 g CO2/MJf. This is caused by consideration of electrolytic hydrogen production using electricity from coal. The lowest values of 7 and 13 g CO2/MJf apply for the use of nuclear power combined with onsite electrolysis and central wind power electrolysis, respectively. The Germany-based analysis by Robinius et al. (2018) concludes with 4.3 g CO2/MJf, assuming a renewable energy-dominated energy system by 2050 [215]. The values for hydrogen delivery for trucks are presumably somewhat lower, as the reduced vehicle tank pressure requires less energy for hydrogen conditioning. The greenhouse gas reduction potential will be discussed in this context alongside other options in the next section.
4.5.4. Emission Behavior
Hydrogen-based fuel cell trucks are zero emission vehicles on a tank-to-wheel base.
4.5.5. Infrastructure
Robinius et al. provide a comparative infrastructure assessment for BEVs and FCEVs based on different fleet sizes in Germany. The cost assessment included hydrogen production via electrolysis, hydrogen storage and transport, and new fueling stations. The largest vehicle fleet considered was set as 20 million passenger cars to be refueled by 7000 hydrogen refueling stations (HRS) with station capacities of up to 1000 kg/d. The cost assessment of HRS and other infrastructure components involved scaling functions in order to consider different component sizes. Different hydrogen provision pathways were analyzed, with the conclusion that for large FCV shares, the combination of pipeline transport for long distances and tube trailers for hydrogen distribution exhibited the lowest cost of all alternatives under consideration. Hydrogen costs of 7.13 €/kg were determined for this case. Infrastructure costs were determined within the range of €37–43 billion EUR for 20 million FCEV [215]. Electrolytic hydrogen production was assumed to exclusively utilize surplus electricity from the electricity grid, based on an electricity mix largely dominated by renewable power generation. Kramer et al. [33] reported a high span of costs of between €19–38 billion for infrastructure measures and €55–66 billion for local hydrogen production. They assumed a complete shift to FCEVs and FCETs. Hydrogen cost estimates were given within the range of 2.66–11.66 €/kg.
A study by Rose et al. (2020) [216] examines the HRS infrastructure that would be required by 2050, as well as the interplay of such an infrastructure design and the German power system, assuming onsite hydrogen production. Important findings in the context of this study include the number of required HRS and the levelized cost of hydrogen (LCOH). By making use of an infrastructure location planning model, the study determined that 140 HRS would be sufficient to refuel all 26–40 t HDTs in Germany. The LCOH ranged from 4.83–5.36 €/kg of hydrogen.
Air Liquide planned future hydrogen fueling stations with a capacity of 2000–4000 kg H2 per day [30,217]. Major operations were envisaged in France, Switzerland, Belgium and Germany as part of the project H2HAUL, and in the Netherlands by HyTrucks. In France, in the village of Fossur-Mer, a first fueling station for FCETs with a capacity of 1000 kg H2 per day will be installed. Later on, four fueling stations will be responsible for 16 FCETs. HyTrucks planned 20 filling stations, with an overall capacity of 40,000 kg H2 per day for semi-captive fleets of 1000 trucks until 2025.
4.5.6. Economic Considerations
Compared to fuel cell systems for passenger cars, the cost targets related to FCETs are significantly higher due to the more challenging requirements regarding the system’s lifetime and robustness. According to the DOE (2019), the current estimate is 190 US$/kW, whereas the Interim and Ultimate targets are 80 and 60 US$/kg, respectively [218]. Transferred to the example introduced above with the requirement of 225 kW of mechanical power at the wheel, the FCS cost could be estimated at $48,913, $20,595, and $14,737 USD for the current estimate, and the Intermediate and Ultimate FCET targets, respectively. This is clearly in contrast to the DOE’s former power plant cost targets of $450,000 (2016 target) and $200,000 (2020 target) [213]. Power plant costs were referred to fuel cell and battery systems and were given for fuel cell transit bus applications, which might serve here as a suitable case for comparison. On the other hand, the 2015 status was given as $60,000–120,000 for the same application; however, based on manufacturing cost projections for an annual production volume of 200–1000 units. $20,000 would account for the battery system, leaving the cost estimate for the fuel cells system at around $40,000–100,000. These values indicate that the current estimates are at the lower range of former projections. However, with respect to industrial manufacturing in general, the impact of the production volume on the unit cost has a significant impact on the unit cost. Apart from the fuel cell system cost, the hydrogen tank cost may be even more important with respect to the competitiveness of FCETs. The DOE’s current estimate for 700 bar technology is given at $15/kWh for high-volume production. The Interim and Ultimate target are $9 and $8/kWh, respectively. Related to the example presented here, this translates into hydrogen tank cost of $40,225, $24,135, and $19,808/kWh. The total system cost, including the above-mentioned $20,000 for the hybrid battery, would be $109,138, $64,730, and $54,544 for the current estimate and the Interim and Ultimate targets, respectively.
Fuel costs strongly depend on the market size and respective fuel demand, because a significant share of the fuel cost is made up of capital expenditures for production and storage facilities, meaning the hydrogen logistics and the refueling station itself. Cerniauskas et al. [219] provide a perspective on hydrogen market introduction in different markets. Related to FCET refueling and assuming fully renewable hydrogen, the cost range spans from over €50-ct/kWh (€16.7/kg) to €23-ct/kWh (€7.67/kg) for annual demands of 100,000–1,000,000 tons [219]. For passenger cars with 700 bar vehicle storage pressure, the costs are decreasing from €39.7-ct/kWh (€13.2/kg) to €21.4-ct/kWh (€7.1/kg) when market sizes of 100,000 and 20,000,000 cars are assumed [214]. Moreover, a shift from reformer and byproduct hydrogen to fully renewable hydrogen is assumed during the market ramp-up process.
4.5.7. SWOT Analysis
Finally, based on the detailed analysis of the state-of-art and the perspectives of FCET, a SWOT analysis was performed and is presented in Table 6. The strengths of the FCET option include the high well-to-wheel efficiency and zero emissions. The fuel cell option for HDV fully complies with the mid-term transition to renewably-based, zero tailpipe emissions transport and may benefit from hydrogen demand in the passenger car market and applications in industrial settings. A weakness of FCET is efficiency losses due to hydrogen production and conditioning and the high current cost of fuel storage. Among the threats is a delayed or constrained capacity build-up of renewable power and electrolysis, slower-than-expected development of other markets, and correspondingly decreased hydrogen demand, with cost development below the cost targets of fuel cells and storage systems, and a non-uniform infrastructure build-up in Europe.
Table 6.
SWOT analysis for hydrogen fuel cells for heavy-duty transportation.
5. Conclusions
This review analyzed various options for the future of freight transport. Firstly, measures with high barriers for implementation were selected as the focus of this paper in order to achieve a substantial effect for reducing emissions. Moreover, the analysis of key figures for different truck classes revealed that over 95% of freight transport is performed by 15% of the total vehicle inventory, namely semi-trailers and heavy-duty vehicles in the class >12.5 t. Therefore, the focus of the analysis is on heavy-duty trucks instead of light-duty ones. Afterwards, renewable diesel-like liquid fuels such as biofuels or electrofuels, catenary systems, natural gas, DME, and hydrogen were reviewed as various alternative options. The results of the literature review were evaluated in the corresponding SWOT analyses. In order to visualize the main arguments of this review, the evaluation results were listed in Figure 13 as pros and cons.
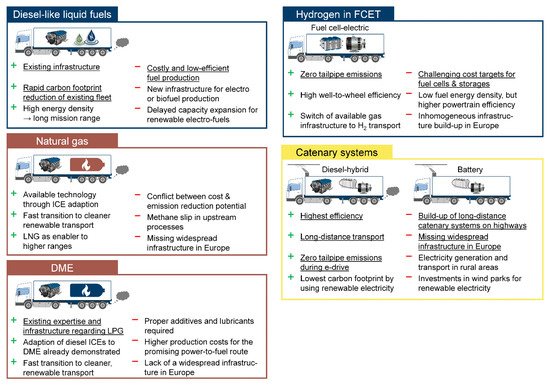
Figure 13.
Pros (+) and cons (−) for different options for future heavy duty transport compiled from SWOT analysis.
Using diesel-like renewable fuels in internal combustion engines can profit from existing infrastructure, long mission range, and improved local emissions. In particular, electrofuels offer a storage possibility for the volatile renewable electricity production and support the building up of a renewable PTX economy. However, in order to produce these fuels, an infrastructural investment for wind parks, electrolyzers, and fuel synthesis plants is required. Moreover, the production costs are high.
Catenary systems are promising for achieving highly efficient, zero-emission transport and offer the lowest carbon footprint by exclusively using renewable electricity. This option also requires large investments in the infrastructure for building up catenary systems and wind parks. Another challenge is electricity generation and transport in rural areas. A limiting factor will be the lack of a widespread infrastructure in Europe, as the use of trucks might be limited to countries like Germany where the catenary systems are installed. Therefore, this technology can be beset by a low acceptance level. Moreover, competition with railway transport could be critical.
Natural gas and DME trucks were analyzed in more depth herein for two reasons. On the one hand, these fuels can also be produced from fossil routes; on the other, the technologies are already available on a commercial scale in the case of natural gas, or can be made available with slight modifications in the case of DME.
Natural gas trucks are already available today and this technology can offer a fast transition to cleaner, renewable transport if methane is produced from renewable sources. The use of LNG leads to a higher mission range. Although fuel costs are lower than those of diesel, the cost advantage diminish switching to renewable methane and if the natural gas taxation policy changes in the future. It must also be noted that the purchasing costs of the vehicles are higher than their diesel counterpart. Despite the potential of reduced greenhouse gas emissions, even when using fossil-based natural gas, increased emissions were observed during certain drive cycles in practice. Another critical aspect is the methane slip in upstream processes due to methane’s high global warming potential.
A detailed look at DME showed a similar picture to the general consideration of renewable diesel-like liquid fuels. Thanks to its fuel properties being similar to those of LPG, existing expertise and a modified infrastructure for LPG, it can be used for an initial market introduction. An engine adaptation to DME has already been demonstrated and is possible at a low incremental cost. Using DME on a renewable basis, the greenhouse gas reduction potential is high, as it was in the case of the other electro- and biofuels. However, it must be noted that DME requires proper additives and lubricants in order to ensure reliable operation and to avoid additional emissions. A dedicated engine development can exploit the full efficiency potential. Due to its storage in light pressurized form, a larger and more complex tank than diesel is also required for DME. The higher production costs for the promising power-to-fuel route are critical for the logistics sector, together with the limited capacities for producing renewable DME and the lack of a widespread infrastructure in Europe.
Finally, hydrogen offers the second best well-to-wheel efficiency, following battery-electric drive trains, and a more compact solution for heavy-duty applications than the battery option. These are critical advantages for the logistics sector and result in lower fuel costs and only slight penalties in freight weight. It enables zero emission at the local level and improved mileage compared to battery-electric trucks. Efficiency losses during hydrogen production and processing, its moderate fuel energy density, and the high cost of storage are some important aspects to be considered. Since the first generation fuel cell electric trucks for heavy-duty application are only now being introduced to the market, this new technology might require one to two technological generations to achieve true market readiness. The capacity build-up of wind parks and electrolyzers is an important prerequisite for the broad implementation of this technology. Further treats to be considered are the ambitious cost targets for fuel cells and hydrogen storage, and the inhomogeneous infrastructure development in Europe, which may be critical to fleet operators.
Comparing the analyzed infrastructure costs for fueling stations of €20–40 bn for a complete shift to hydrogen-based drive systems for FCEVs and FCETs, and €55–66 bn for local hydrogen production, with the announced funding of €4.1 bn for a future infrastructure, including battery loading, a catenary system, and hydrogen fueling stations, and €1.3 bn for e-fuel and hydrogen production offers a fairly large gap; see also Daum [220] for the German National Organization for Hydrogen (NOW). Even the set-up of an infrastructure for catenary systems for FCETs was approximated at €8–10 bn. It is obvious that the ramp-up of new drivetrain technologies and corresponding infrastructure is a great challenge, but is of decisive importance for a successful energy transition in transportation.
6. Summary and Outlook
This review highlighted the importance of having competing solutions. The future role of catenary systems, fuel cell drivetrains, liquid electrofuels, natural gas, and DME in freight transport cannot be predicted. Political conditions may also change and, finally, the market will decide the relevance of the options considered. The identification of research gaps opens up room for further research on next-generation solutions or the optimization of selected technologies. The effects of the different options regarding local emissions is the theme of ongoing investigations. Future capacity models combined with scenario development simulations are useful tools for analyzing the market share potentials of various options. It must also be noted that sector coupling between energy production, transportation, and industry will have a decisive impact on the preferred routes. Only a holistic approach will therefore be able to advance relevant recommendations.
Author Contributions
Conceptualization, R.P., R.C.S. and M.R.; methodology, R.P. and R.C.S.; technical analysis renewable fuels—review and writing, J.L.B., M.D. and R.P.; technical analysis catenary systems—review and writing, R.P.; technical analysis DME & LNG—review and writing, R.C.S.; technical analysis hydrogen—review and writing, T.G.; writing—original draft preparation, R.P.; writing—review and editing, all authors; visualization, R.P., M.D. and R.C.S.; supervision, D.S., All authors have read and agreed to the published version of the manuscript
Funding
This research received no external funding.
Institutional Review Board Statement
Not applicable.
Informed Consent Statement
Not applicable.
Data Availability Statement
The review study did not report any data.
Acknowledgments
The authors would like to thank all members of the Institute of Techno-economic Systems Analysis (IEK-3) and the Institute of Electrochemical Process Engineering (IEK-14) for fruitful discussions on all of the technologies of the energy transition and their role in the future energy system. The core research tasks of both institutes, namely electrolysis, fuel cells, and Power-to-X systems, will surely play a decisive role in defossilization.
Conflicts of Interest
The authors declare no conflict of interest.
Appendix A. Further Options for Future Heavy-Duty Transportation
Appendix A.1. Hydrogen-Fueled ICEs for Heavy-Duty Vehicles
The use of hydrogen in combustion engines is not included in the main part of this analysis. Schwaderlapp [31] reported on the new development of a 180 kW engine from Deutz, but hardly any information is available about these developments. Research and development activities are ongoing and are foreseen in new research funding projects. As a cornerstone for a future analysis, first data are presented in this appendix.
Appendix A.1.1. Motivation for Using Hydrogen in ICEs for Heavy-Duty Transport
In addition to the fuel cell, hydrogen can also be used in combustion engines. This approach is based on the assumption that a hydrogen combustion engine is significantly cheaper to purchase than a fuel cell drive system. Many advantages and disadvantages are addressed in the same way by both systems.
Appendix A.1.2. Engine Technology and Vehicle Availability
Boretti [221] subdivides hydrogen ICE engines into pre 2009 and present engine concepts. Reviewing existing literature, Boretti [221] concludes that direct injection engines were a subject of the research at that time with the BMW Hydrogen 7 [222] being the most promising production level hydrogen car ever built. However, Boretti [221] states that positive ignition compression ignition engines, combining spark ignition with diesel combustion concept, were also investigated at that time, offering higher efficiencies. Boretti [221] claimed that, with BMW ending their research (most likely caused by a boycott of the policymakers), the car industry lost interest in hydrogen combustion vehicles. Current and latest research activities were subdivided by Boretti [221] into positive ignition (PI) premixed, compression ignition (CI) diffusion, CI/PI hybrid and dual-fuel LNG engines. Boretti [221] ends his review with the statement that hydrogen operation in a CI engine is still difficult, while dual-fuel operation with diesel is much simpler. Boretti [221] also reports that hydrogen CI engines allow peak efficiencies of about 50%. Most promising for single fuel operation are positive ignition engines based on the concepts from direct ignition and jet ignition [221], which are already used in racing. Another promising option is PI direct injection (DI) jet ignition (JI) engines, which could qualify as zero-emission vehicles, if the NOx-emissions are handled in an exhaust after-treatment system [221].
Akal et al. [223] reviewed research activities in terms of the utilization of hydrogen in gasoline, diesel and LPG combustion engines. They conclude that, based on the reviewed research studies and due to the high self-ignition temperature of hydrogen, gasoline engines, for example spark-ignition engines, are more appropriate for the combustion of hydrogen [223]. The spark-ignition also benefits in terms of fuel consumption and performance. Akal, Öztuna and Büyükakın [223] state that, due to the high ignition temperature of hydrogen, it is not suitable for direct use in diesel engines. Caused by this, many of the reviewed literature studies from Akal, Öztuna and Büyükakın [223] used different methods to introduce hydrogen in the cylinder. Akal, Öztuna and Büyükakın [223] concluded, that the majority of the studies observed a reduction of harmful emissions and fuel consumption using hydrogen in the internal combustion engine. Another concept is blending CNG with 20–30% hydrogen as hydrogen enriched compressed natural gas [224]. Wind [225] compares fuel-cell electric vehicles with H2-ICE vehicles. H2-ICE vehicles needs less technological effort to be developed, because the drive train is very similar to those of the conventional powered car. However, H2-ICE vehicles suffer from low tank-to-wheel efficiencies, which are comparable to the conventional counterparts [225]. In contrast, the drive train of a fuel-cell electric vehicle is much more complex but the tank-to-wheel efficiency is twice as much as the one from ICE-vehicles and therefore enables larger driving ranges [225].
Chintala and Subramanian [226] showed in their review that hydrogen is also used in compression ignition engines in dual-fuel operation up to 25%. Using hydrogen in dual-fuel operation will lead to no throttling losses, improved fuel economy, improved thermal efficiency and decreasing emissions [226]. Hydrogen cannot be used in a conventional CI engine caused by its low cetane number and the autoignition temperature emissions [226]. Boretti [221] states, that hydrogen combustion is only difficult in CI engines.
The KEYOU GmbH is developing a hydrogen combustion truck based on the hydrogen engine DEUTZ TCD 7.8 [227]. The DEUTZ TCD 7.8 engine is originally a diesel engine but with an additional hydrogen ignition system.
Appendix A.1.3. Greenhouse Gas Reduction Potential
See Section 4.5.3 on hydrogen based FCET.
Appendix A.1.4. Emission Behavior
In the vehicle concept of KEYOU GmbH and DEUTZ, an exhaust gas recirculation system as well as a selective catalytic reduction system are used for exhaust treatment. They state a reduction of 91% NOx, 80% PM, 94% HC and 99% for CO for a 18 t truck in comparison with a EURO VI diesel truck [227]. These reduction stick to fit to experiments from Heffel [228], who applied exhaust gas recirculation and a three-way catalytic converter to reach a strong reduction of NOx from a hydrogen engine.
Higher NOx emissions were observed in a spark ignition engine using a hydrogen-CNG blend due to higher temperatures in the flame zone and a consequent formation of thermal NOx, especially under high loads [229]. Mathai, Malhotra, Subramanian and Das [229] also reported a decreasing brake-specific fuel consumption as well as decreasing HC and CO emissions using a hydrogen-CNG blend in a spark ignition engine.
Dimitriou and Tsujimura [230] reviewed the utilization of hydrogen as CI engine fuel. Based on the reviewed literature, they conclude a reduction of HC, CO and smoke up to 50% under optimum conditions. Hydrogen combustion in the CI engine leads to higher NOx formation, caused by a higher energy content and consequently higher in-cylinder temperatures [230]. Applying exhaust gas recirculation can reduce the NOx formation, but leads to higher smoke, HC and CO emissions caused by lower oxygen content in the cylinder chambers [230].
Appendix A.1.5. Infrastructure
See Section 4.5.5 on hydrogen based FCET.
Appendix A.1.6. Economic Considerations
The techno-economic boundary conditions for the operation of a truck with hydrogen as fuel for use in an internal combustion engine depend only on the production costs of diesel and hydrogen with the same efficiency in the engine. With an assumed production cost of approx. 0.6 €/L diesel, these must reach 2 €/kg hydrogen in order to be comparable. Due to the significantly better efficiency—almost twice as high—for fuel cell drives, the threshold value is 3.5—4 €/kg H2. For both drive systems, investment in a suitable infrastructure is required additionally. The acquisition costs for a fuel cell drive system are estimated to be significantly higher.
Appendix A.1.7. SWOT Analysis
Finally, based on the detailed analysis of the state-of-art and the perspectives of hydrogen-driven ICEs, a SWOT analysis was performed and is presented in Table A1. The strengths of the ICE/H2 option include the high well-to-tank efficiency, no particle emissions and low development cost. Weaknesses of this solution are efficiency losses due to hydrogen production and conditioning and the high current cost of fuel storage. Opportunities and threats of both options—hydrogen in ICE or FCET—are nearly the same. Additionally, a visualization was also worked out in Figure A1.
Table A1.
SWOT analysis for hydrogen fueled ICEs for heavy-duty transportation.
Table A1.
SWOT analysis for hydrogen fueled ICEs for heavy-duty transportation.
| Strengths | Weaknesses |
|---|---|
| High well-to-tank efficiency | Efficiency losses from hydrogen production and processing Moderate fuel energy density |
| No particle matter emissions | Low tank-to-wheel efficiency |
| Low developing effort | High cost of fuel storage |
| Opportunities | Threats |
| Allows for very low greenhouse gas emission levels in transport | Delayed or constrained capacity build-up of renewable power and electrolysis |
| Hydrogen provision may benefit from hydrogen demand in other markets | Technology lock-in for BEVs due to the advanced state of battery technology |
| Improved operating range compared to battery-electric trucks | The development of other markets might not significantly increase hydrogen demand |
| Available gas infrastructure could be switched to hydrogen transport | Inhomogeneous infrastructure build-up in Europe |

Figure A1.
Pros and cons for hydrogen fueled ICEs for heavy-duty transportation.
Figure A1.
Pros and cons for hydrogen fueled ICEs for heavy-duty transportation.

Appendix A.2. Additional Information on Fuel Chemistry

Figure A2.
Space-filling models of molecules used in this paper.
Figure A2.
Space-filling models of molecules used in this paper.

References
- Ribeiro, S.K.; Figueroa, M.J.N.; Creutzig, F.; Dubeux, C.; Hupe, J.; Kobayashi, S.; Brettas, L.A.D.M.; Thrasher, T.; Webb, S. Energy End-Use: Transport; International Institute for Applied System Analysis: Laxenburg, Austria, 2012. [Google Scholar]
- Mineralölwirtschaftsverband. MWV-Prognose 2025 für die Bundesrepublik Deutschland; Mineralölwirtschaftsverband e. V.: Berlin, Germany, 2011; p. 13. [Google Scholar]
- Victor, D.G.; Zhou, D.; Ahmed, E.H.M.; Dadhich, P.K.; Olivier, J.G.J.; Rogner, H.-H.; Sheikho, K.; Yamaguchi, M. Introductory Chapter. In Climate Change 2014: Mitigation of Climate Change. Contribution of Working Group III to the Fifth Assessment Report of the Intergovernmental Panel on Climate Change; Edenhofer, O., Pichs-Madruga, R., Sokona, Y., Farahani, E., Kadner, S., Seyboth, K., Adler, A., Baum, I., Brunner, S., Eickemeier, P., et al., Eds.; Cambridge University Press: Cambridge, UK; New York, NY, USA, 2014. [Google Scholar]
- Umweltbundesamt. Klimagase in Deutschland 2014 Deutlich Gesunken. Available online: https://www.umweltbundesamt.de/presse/pressemitteilungen/klimagase-in-deutschland-2014-deutlich-gesunken (accessed on 15 April 2020).
- Eurostat. Greenhouse Gas Emissions, Analysis by Source Sector, EU-28, 1990 and 2015. Available online: Eurostat// http://ec.europa.eu/eurostat/statistics-explained/index.php/File:Greenhouse_gas_emissions,_analysis_by_source_sector,_EU-28,_1990_and_2015_(percentage_of_total)_new.png (accessed on 15 April 2020).
- Akermann, P. eHighway. In The Future Role of Trucks for Energy and Environment; Workshop: Brussels, Belgium, 2016. [Google Scholar]
- Cebon, D. Technology options for decarbonizing road freight. In The Future Role of Trucks for Energy and Environment; Joint Research Centre of the European Commission & International Energy Agency: Brussels, Belgium, 2016. [Google Scholar]
- Delgado, O.; Sharpe, B.; Miller, J.; Muncrief, R. Assessing near-term efficiency potential of engine and vehicle technologies. In The Future Role of Trucks for Energy and Environment; Joint Research Centre of the European Commission & International Energy Agency: Brussels, Belgium, 2016. [Google Scholar]
- Greening, P. Proven strategies to enable more efficient and low-carbon logistics. In The Future Role of Trucks for Energy and Environment; Joint Research Centre of the European Commission & International Energy Agency: Brussels, Belgium, 2016. [Google Scholar]
- Schuckert, M. Daimler‘s advances in fuel efficiency and zero emission activities. In The Future Role of Trucks for Energy and Environment; Joint Research Centre of the European Commission & International Energy Agency: Brussels, Belgium, 2016. [Google Scholar]
- Teter, J.; Cazzola, P.; Gül, T.; Mulland, E. The Future of Trucks; International Energy Agency: Paris, France, 2017; pp. 3–161. [Google Scholar]
- Peters, R.; Decker, M.; Eggemann, L.; Schemme, S.; Schorn, F.; Breuer, J.L.; Weiske, S.; Pasel, J.; Samsun, R.C.; Stolten, D. Thermodynamic and ecological preselection of synthetic fuel intermediates from biogas at farm sites. Energy Sustain. Soc. 2020, 10, 4. [Google Scholar] [CrossRef]
- Energy, D.O. On-Board Fuel Processing Go/No-Go Decision. Available online: www.eere.energy.gov/hydrogenandfuelcells/news_fuel_processor.html (accessed on 16 November 2009).
- Peters, R. Auxiliary Power Units for Light-Duty Vehicles, Trucks, Ships and Airplanes. In Hydrogen and Fuel Cells; Stolten, D., Ed.; Wiley: Weinheim, Germany, 2010; pp. 681–714. [Google Scholar]
- Peters, R.; Westenberger, A. Large auxiliary power units for vessels and airplanes. In Innovations in Fuel Cell Technologies; Steinberger-Wilckens, R., Lehnert, W., Eds.; The Royal Society of Chemistry: Cambridge, UK, 2010; pp. 76–148. [Google Scholar]
- Samsun, R.C.; Krekel, D.; Pasel, J.; Prawitz, M.; Peters, R.; Stolten, D. A diesel fuel processor for fuel-cell-based auxiliary power unit applications. J. Power Sources 2017, 355, 44–52. [Google Scholar] [CrossRef]
- Samsun, R.C.; Krupp, C.; Baltzer, S.; Gnörich, B.; Peters, R.; Stolten, D. A battery-fuel cell hybrid auxiliary power unit for trucks: Analysis of direct and indirect hybrid configurations. Energy Convers. Manag. 2016, 127, 312–323. [Google Scholar] [CrossRef]
- Samsun, R.C.; Krupp, C.; Tschauder, A.; Peters, R.; Stolten, D. Electrical start-up for diesel fuel processing in a fuel-cell-based auxiliary power unit. J. Power Sources 2016, 302, 315–323. [Google Scholar] [CrossRef]
- Samsun, R.C.; Prawitz, M.; Tschauder, A.; Pasel, J.; Peters, R.; Stolten, D. An autothermal reforming system for diesel and jet fuel with quick start-up capability. Int. J. Hydrog. Energy 2019, 44, 27749–27764. [Google Scholar] [CrossRef]
- Samsun, R.C.; Prawitz, M.; Tschauder, A.; Pasel, J.; Pfeifer, P.; Peters, R.; Stolten, D. An integrated diesel fuel processing system with thermal start-up for fuel cells. Appl. Energy 2018, 226, 145–159. [Google Scholar] [CrossRef]
- Pavlo. Spare part–Vektor Illustration; spare-part-gm164474197-20458528; Istock: Calgary, AB, Canada, 2012. [Google Scholar]
- Dashadima. Vektor Elektrisches Auto Parts Symbole; Ektor-Elektrisches-Auto-Parts-Symbole-gm530411287-54508076; Istock: Calgary, AB, Canada, 2015. [Google Scholar]
- Eskiner, M.; Bär, F.; Rossner, M.; Munack, A.; Krahl, J. Determining the aging degree of domestic heating oil blended with biodiesel by means of dielectric spectroscopy. Fuel 2015, 143, 327–333. [Google Scholar] [CrossRef]
- Unglert, M.; Bockey, D.; Bofinger, C.; Buchholz, B.; Fisch, G.; Luther, R.; Müller, M.; Schaper, K.; Schmitt, J.; Schröder, O.; et al. Action areas and the need for research in biofuels. Fuel 2020, 268, 117727. [Google Scholar] [CrossRef]
- Agarwal, A.K. Alternative fuels for internal combustion engines. Proc. Combust. Inst. 2017, 36, 3389–3413. [Google Scholar] [CrossRef]
- Bae, C.; Kim, J. Biofuels (alcohols and biodiesel) applications as fuels for internal combustion engines. Prog. Energy Combust. Sci. 2007, 33, 233–271. [Google Scholar] [CrossRef]
- Schemme, S.; Samsun, R.C.; Peters, R.; Stolten, D. Power-to-fuel as a key to sustainable transport systems–An analysis of diesel fuels produced from CO2 and renewable electricity. Fuel 2017, 205, 198–221. [Google Scholar] [CrossRef]
- Kroom, R. Electrifying freight & distribution in Europe. In Green Energy Hubs; EnergieAgentur NRW: Düsseldorf, Germany, 2020; p. 22. [Google Scholar]
- Wken, H. Electrifying freight & distribution in Europe. In Jahrestagung Mobilität; EnergieAgentur NRW: Düsseldorf, Germany, 2020. [Google Scholar]
- Mineaud, F. HyTrucks. In Green Energy Hubs; EnergieAgentur NRW: Düsseldorf, Germany, 2020; p. 16. [Google Scholar]
- Schwaderlapp, M. Sustainable Powertrains for Off Highway Mobile Machinery; ZERO CO2 MOBILITY: Aachen, Germany, 2020. [Google Scholar]
- Nour, M.; Kosaka, H.; Bady, M.; Sato, S.; Abdel-Rahman, A.K. Combustion and emission characteristics of DI diesel engine fuelled by ethanol injected into the exhaust manifold. Fuel Process. Technol. 2017, 164, 33–50. [Google Scholar] [CrossRef]
- Kramer, U.; Ortloff, F.; Stollenwerk, S.; Thee, R. Defossilisierung des Transportsektors; FVV-Forschungsvereinigung Verbrennungskraftmaschinen e.V.: Frankfurt am Main, Germany, 2018. [Google Scholar]
- Hacker, F.; Blanck, R.; Hülsmann, F.; Kasten, P.; Loreck, C.; Ludig, S.; Mottschall, M.; Zimmer, W. eMobil 2050-Szenarien zum Möglichen Beitrag Des Elektrischen Verkehrs Zum Langfristigen Klimaschutz; Öko-Institut e.V.: Breisgau, Germany, 2014. [Google Scholar]
- Zimmer, W.; Blanck, R.; Bergmann, T.; Mottschall, M.; von Waldenfels, R.; Förster, H. Endbericht Renewbility III-Optionen Einer Dekarbonisierung des Verkehrssektors; Öko-Institut e.V.: Breisgau, Germany, 2017. [Google Scholar]
- Schlesinger, D.M.; Hofer, P.; Kemmler, D.A.; Kirchner, D.A.; Strassburg, S. Energieszenarien für ein Energiekonzept der Bundesregierung; Prognos AG, EWI-Energiewirtschaftliches Institut an der Universität zu Köln, Gesellschaft für Wirtschaftliche Strukturforschung mbH (GWS): Osnabrück, Germany, 2010. [Google Scholar]
- Kasten, P.; Mottschall, M.; Köppel, W.; Degünther, C.; Schmied, M.; Wüthrich, P. Erarbeitung einer Fachlichen Strategie zur Energieversorgung des Verkehrs bis zum Jahr 2050. Available online: https://www.umweltbundesamt.de/sites/default/files/medien/377/publikationen/2016-11-10_endbericht_energieversorgung_des_verkehrs_2050_final.pdf (accessed on 2 July 2016).
- Adolf, J.; Balzer, C.; Haase, F.; Lenz, B.; Lischke, A.; Knitschky, G. Shell Nutzfahrzeug-Studie-Diesel oder Alternative Antriebe-Womit Fahren Lkw und Bus Morgen? Shell Deutschland, Deutsches Zentrum für Luft- und Raumfahrt (DLR): Bonn, Germany, 2016. [Google Scholar]
- Die Mobilitäts- und Kraftstoffstrategie der Bundesregierung (MKS); Bundesministerium für Verkehr, Bau und Stadtentwicklung: Berlin, Germany, 2013; p. 92.
- Smajla, I.; Karasalihović Sedlar, D.; Drljača, B.; Jukić, L. Fuel Switch to LNG in Heavy Truck Traffic. Energies 2019, 12, 515. [Google Scholar] [CrossRef]
- Rosenstiel, D.P.; Siegemund, S.; Bünger, U.; Schmidt, P.R.; Weindorf, W.; Wurster, R.; Zerhusen, J.; Usmani, O.A.; de Wilde, H.P.J. LNG in Germany: Liquefied Natural Gas and Renewable Methane in Heavy-Duty Road Freight Transport; Dena: Berlin, Germany, 2014. [Google Scholar]
- The Future of Natural Gas Engines in Heavy Duty Trucks: The Diesel of Tomorrow? Americas Commercial Transportation Research: Columbus, IN, USA, 2012.
- Westport™ iCE PACK LNG Tank System. Available online: https://www.westport.com/about/fuel-storage-and-delivery/ice-pack-lng-tank-system/brochures/westport-ice-pack-lng-tank-system-brochure.pdf (accessed on 16 April 2020).
- Multi-Year Research, Development and Demonstration Plan, Hydrogen, Fuel Cells & Infrastructure Technologies Program-Hydrogen Storage; Department of Energy, USA: Beaver, WA, USA, 2015.
- Gangloff, J.J., Jr.; Kast, J.; Morrison, G.; Marcinkoski, J. Design Space Assessment of Hydrogen Storage Onboard Medium and Heavy Duty Fuel Cell Electric Trucks. J. Electrochem. Energy Convers. Storage 2017, 14, 021001. [Google Scholar] [CrossRef]
- Ahluwalia, R.K.; Peng, J.K.; Roh, H.S.; Hua, T.Q.; Houchins, C.; James, B.D. Supercritical cryo-compressed hydrogen storage for fuel cell electric buses. Int. J. Hydrog. Energy 2018, 43, 10215–10231. [Google Scholar] [CrossRef]
- Park, S.H.; Lee, C.S. Combustion performance and emission reduction characteristics of automotive DME engine system. Prog. Energy Combust. Sci. 2013, 39, 147–168. [Google Scholar] [CrossRef]
- Arcoumanis, C.; Bae, C.; Crookes, R.; Kinoshita, E. The potential of di-methyl ether (DME) as an alternative fuel for compression-ignition engines: A review. Fuel 2008, 87, 1014–1030. [Google Scholar] [CrossRef]
- Semelsberger, T.A.; Borup, R.L.; Greene, H.L. Dimethyl ether (DME) as an alternative fuel. J. Power Sources 2006, 156, 497–511. [Google Scholar] [CrossRef]
- Zubel, M.; Ottenwälder, T.; Heuser, B.; Herudek, C.; Maas, H.; Willems, W. DME–A Sustainable Fuel Solution for Clean and Closed CO2-Cycle-Mobility for CI Powertrain. In Zukünftige Kraftstoffe; ATZ/MTZ-Fachbuch, Springer-GmbH: Wiesbaden, Deutschland, 2019; pp. 783–798. [Google Scholar]
- Park, S.H.; Lee, C.S. Applicability of dimethyl ether (DME) in a compression ignition engine as an alternative fuel. Energy Convers. Manag. 2014, 86, 848–863. [Google Scholar] [CrossRef]
- Thomas, G.; Feng, B.; Veeraragavan, A.; Cleary, M.J.; Drinnan, N. Emissions from DME combustion in diesel engines and their implications on meeting future emission norms: A review. Fuel Process. Technol. 2014, 119, 286–304. [Google Scholar] [CrossRef]
- Fuel information: Dimethyl Ether (DME). Available online: https://www.iea-amf.org/content/fuel_information/dme (accessed on 28 April 2020).
- Meinert, M. Wasserstoff Speichertechnologien für Fahrzeuge. Wasserstoff und Brennstoffzellen im Automobil; Haus der Technik: Essen, Germany, 2007; Volume 15, p. 402. [Google Scholar]
- Der Neue Actros; Mercedes Benz: Stuttgart, Germany, 2013; p. 78.
- Mareev, I.; Becker, J.; Sauer, D. Battery Dimensioning and Life Cycle Costs Analysis for a Heavy-Duty Truck Considering the Requirements of Long-Haul Transportation. Energies 2017, 11, 55. [Google Scholar] [CrossRef]
- Füßel, A. Entwicklungspotenzial technischer Kriterien der BEV-Technologie. In Technische Potenzialanalyse der Elektromobilität: Stand der Technik, Forschungsausblick und Projektion auf das Jahr 2025; Springer Fachmedien Wiesbaden: Wiesbaden, Germany, 2017; pp. 35–82. [Google Scholar] [CrossRef]
- Schaffelhofer, F. MAN Engines Präsentiert 16,2-Liter-Motor D4276 für Spitzenleistungen in der Landtechnik; MAN Engines: Nürnber, Germany, 2019. [Google Scholar]
- Zeitzen, F.; Wolf, A. Neuer Mercedes Actros Kraftvoller Motor. Available online: https://www.eurotransport.de/artikel/neuer-mercedes-actros-kraftvoller-motor-445142.html (accessed on 21 June 2011).
- Elfasakhany, A. Engine performance evaluation and pollutant emissions analysis using ternary bio-ethanol–iso-butanol–gasoline blends in gasoline engines. J. Clean. Prod. 2016, 139, 1057–1067. [Google Scholar] [CrossRef]
- Biogas, F. Branchenzahlen. Available online: https://www.biogas.org/edcom/webfvb.nsf/id/de_branchenzahlen (accessed on 29 June 2018).
- Billig, E.; Decker, M.; Benzinger, W.; Ketelsen, F.; Pfeifer, P.; Peters, R.; Stolten, D.; Thrän, D. Non-fossil CO2 recycling—The technical potential for the present and future utilization for fuels in Germany. J. Co2 Util. 2019, 30, 130–141. [Google Scholar] [CrossRef]
- Baumgarten, C.; Bilharz, M.; Döring, U.; Eisold, A.; Friedrich, B.; Frische, T.; Gather, C.; Günther, D.; Große Wichtrup, W.; Hofmeier, K.; et al. Umwelt und Landwirtschaft; Umweltbundesamt: Dessau-Roßlau, Germany, 2018; p. 158. [Google Scholar]
- Umweltbundesamt. Biogasproduktion aus Gülle und Bioabfall ausbauen. Available online: https://www.umweltbundesamt.de/themen/biogasproduktion-aus-guelle-bioabfall-ausbauen (accessed on 6 December 2019).
- Peters, R.; Baltruweit, M.; Grube, T.; Samsun, R.C.; Stolten, D. Techno Economic Analysis of Power to Gas Route; Forschungszentrum Jülich GmbH, Insitute for Energy and Climate Research, Electrochemical Process Engineering: Jülich, Germany, 2019. [Google Scholar]
- Leible, L.; Kälber, S.; Kappler, G.; Eltrop, L.; Stenull, M.; Lansche, J.; Poboss, N.; Stürmer, B.; Kelm, T.; Köppel, W. Perspektiven für Bio-Erdgas. Teil I: Bereitstellung aus nasser und trockener Biomasse. BWK 2012, 5, 21–27. [Google Scholar]
- Kappler, G.; Hurtig, O.; Kälber, S.; Leible, L. Perspektiven für Bio-Erdgas. Teil II: Perspektiven für Erdgas. BWK 2012, 5, 28–34. [Google Scholar]
- Peters, R. Heutige und zukünftige Kraftstoffe in der Luftfahrt. In Brennstoffzellensysteme in der Luftfahrt; Peters, R., Ed.; Springer: Berlin, Germany, 2015; pp. 7–100. [Google Scholar]
- Berndes, G.; Hoogwijk, M.; van den Broek, R. The contribution of biomass in the future global energy supply: A review of 17 studies. Biomass Bioenergy 2003, 25, 1–28. [Google Scholar] [CrossRef]
- Offermann, R.; Seidenberger, T.; Thrän, D.; Kaltschmitt, M.; Zinoviev, S.; Miertus, S. Assessment of global bioenergy potentials. Mitig. Adapt. Strateg. Glob. Chang. 2010, 16, 103–115. [Google Scholar] [CrossRef]
- Parikka, M. Global biomass fuel resources. Biomass Bioenergy 2004, 27, 613–620. [Google Scholar] [CrossRef]
- Kaltschmitt, M.; Lenz, V.; Thrän, D. Zur Energetischen Nutzung von Biomasse in Deutschland-Potenziale, Stand und Perspektiven; Leibnitz Institut für interdisiplinäre Studien: Berlin, Germany, 2008; p. 12. [Google Scholar]
- Peters, R. Brennstoffzellen in der Luftfahrt; Springer: Berlin, Germany, 2015. [Google Scholar]
- Dahmen, N.; Dinjus, E. Synthetische Chemieprodukte und Kraftstoffe aus Biomasse. Chem. Ing. Tech. 2010, 82, 1147–1152. [Google Scholar] [CrossRef]
- Dahmen, N.; Sauer, J. Das Bioliq -Konzept-Hintergrund und Aktueller Stand. Available online: http://www.fornebik.bayern.de/allgemein/a_veranstaltungen/box_rechts_auf_VAseite/130604_05/Vortraege/Dahmen.pdf (accessed on 3 December 2015).
- Dinjus, E.; Dahmen, N. Das BIOLIQ-Verfahren-Konzept, Technologie und Stand der Entwicklung. Mot. Z. 2010, 12, 7. [Google Scholar] [CrossRef]
- Dahmen, N.; Dinjus, E.; Kolb, T.; Arnold, U.; Leibold, H.; Stahl, R. State of the art of the bioliq® process for synthetic biofuels production. Environ. Prog. Sustain. Energy 2012, 31, 176–181. [Google Scholar] [CrossRef]
- Presse-Agentur, D. Linde Engineering Dresden kauft Choren-Technologie für Synthesegas. In Der Insolvenzverwalter der Choren Industries GmbH (Freiberg) hat Eine Technologie zur Herstellung von Synthesegas an das Unternehmen Linde Engineering Dresden GmbH Verkauft; Redaktionsnetzwerk Deutschland: Berlin, Germany, 2015. [Google Scholar]
- Vollhardt, K.P.C.; Schore, N.E. Organische Chemie, 5th ed.; Wiley-VCH: Weinheim, Germany, 2011. [Google Scholar]
- Brennan, L.; Owende, P. Biofuels from microalgae—A review of technologies for production, processing, and extractions of biofuels and co-products. Renew. Sustain. Energy Rev. 2010, 14, 557–577. [Google Scholar] [CrossRef]
- Chisti, Y.; Yan, J. Energy from algae: Current status and future trends. Algal biofuels–A status report. Appl. Energy 2011, 88, 3277–3279. [Google Scholar] [CrossRef]
- Hu, Q.; Sommerfeld, M.; Jarvis, E.; Ghirardi, M.; Posewitz, M.; Seibert, M.; Darzins, A. Microalgal triacylglycerols as feedstocks for biofuel production: Perspectives and advances. Plant J. 2008, 54, 621–639. [Google Scholar] [CrossRef] [PubMed]
- Roncarati, A.; Meluzzi, A.; Acciarri, S.; Tallarico, N.; Eloti, P. Fatty acid composition of different microalgae strains (Nannochloropsis sp., Nannochloropsis oculata (Droop) Hibberd, Nannochloris atomus Butcher and Isochrysis sp.) according to the culture phase and the carbon dioxide concentration. J. World Aquac. Soc. 2004, 35, 401–411. [Google Scholar] [CrossRef]
- Weyer, K.M.; Bush, D.R.; Darzins, A.; Willson, B.D. Theoretical maximum algal oil production. Bioenergy Res. 2009, 3, 204–213. [Google Scholar] [CrossRef]
- Willson, B. Large scale production of microalgae for biofuels. In Automotive Biofuels; IQPC: Berlin, Germany, 2009; p. 68. [Google Scholar]
- Berchmans, H.J.; Hirata, S. Biodiesel production from crude Jatropha curcas L. seed oil with a high content of free fatty acids. Bioresour. Technol. 2008, 99, 1716–1721. [Google Scholar] [CrossRef] [PubMed]
- Banerji, R.; Chowdhury, A.R.; Misra, G.; Sudarsanan, G.; Verma, S.C.; Srivastava, G.S. Jatropha seed oils for energy. Biomass 1985, 8, 277–282. [Google Scholar] [CrossRef]
- Aatola, H.; Larmi, M.; Sarjovaara, T.; Mikkonen, S. Hydrotreated Vegetable oil (HVO) as a Renewable Diesel Fuel: Trade-off between NOx, Particulate Emission, and Fuel Consumption of a Heavy Duty Engine. SAE Int. J. Engines 2008, 1, 1251–1262. [Google Scholar] [CrossRef]
- Dörr, S. NExBTL General Presentation; Neste Oil: Espoo, Finland, 2012. [Google Scholar]
- van Eijck, J.; Batidzirai, B.; Faaij, A. Current and future economic performance of first and second generation biofuels in developing countries. Appl. Energy 2014, 135, 115–141. [Google Scholar] [CrossRef]
- Grube, T.; Menzer, R.; Peters, R.; Arnold, K.; Ramesohl, S. Verfahrensanalyse der Herstellung Flüssiger Synthetischer Kraftstoffe auf Biomassebasis; VDI: Düsseldorf, Germany, 2006; pp. 379–403. [Google Scholar]
- Althapp, A. Kraftstoffe aus Biomasse mit dem Carbo-V®- Vergasungsverfahren. Forschungsverbund Sonnenenergie. In FVEE Jahrestagung; University of Stuttgart: Stuttgart, Germany, 2003. [Google Scholar]
- König, D.H.; Freiberg, M.; Dietrich, R.-U.; Wörner, A. Techno-economic study of the storage of fluctuating renewable energy in liquid hydrocarbons. Fuel 2015, 159, 289–297. [Google Scholar] [CrossRef]
- Decker, M.; Schorn, F.; Samsun, R.C.; Peters, R.; Stolten, D. Off-grid power-to-fuel systems for a market launch scenario–A techno-economic assessment. Appl. Energy 2019, 250, 1099–1109. [Google Scholar] [CrossRef]
- Stolten, D. Status and Potential of PEM Technology for Transportation and the Related Hydrogen Infrastructure. In Proceedings of the mESC-IS 2015, International Symposium on Materials for Energy Storage and Conversion, Ankara, Turkey, 7–9 September 2015; p. 40. [Google Scholar]
- Robinius, M.; Otto, A.; Heuser, P.; Welder, L.; Syranidis, K.; Ryberg, D.; Grube, T.; Markewitz, P.; Peters, R.; Stolten, D. Linking the Power and Transport Sectors—Part 1: The Principle of Sector Coupling. Energies 2017, 10, 956. [Google Scholar] [CrossRef]
- Bongartz, D.; Doré, L.; Eichler, K.; Grube, T.; Heuser, B.; Hombach, L.E.; Robinius, M.; Pischinger, S.; Stolten, D.; Walther, G.; et al. Comparison of light-duty transportation fuels produced from renewable hydrogen and green carbon dioxide. Appl. Energy 2018, 231, 757–767. [Google Scholar] [CrossRef]
- Maurer, G. Vapor-Liquid Equilibrium of Formaldehyde- and Water-Containing Multicomponent Mixtures. Aiche J. 1986, 32, 932–948. [Google Scholar] [CrossRef]
- Burger, J. A Novel Process for The Production of Diesel Fuel Additives by Hierarchical Design. Ph.D. Thesis, TechnicalUniversity Kaiserslautern, Kaiserslautern, Germany, 2012. [Google Scholar]
- Burger, J.; Siegert, M.; Ströfer, E.; Hasse, H. Poly(oxymethylene) dimethyl ethers as components of tailored diesel fuel: Properties, synthesis and purification concepts. Fuel 2010, 89, 3315–3319. [Google Scholar] [CrossRef]
- Baranowski, C.J.; Bahmanpour, A.M.; Kröcher, O. Catalytic synthesis of polyoxymethylene dimethyl ethers (OME): A review. Appl. Catal. B Environ. 2017, 217, 407–420. [Google Scholar] [CrossRef]
- Hackbarth, K.; Haltenort, P.; Arnold, U.; Sauer, J. Recent Progress in the Production, Application and Evaluation of Oxymethylene Ethers. Chem. Ing. Tech. 2018, 90, 1520–1528. [Google Scholar] [CrossRef]
- Bhatelia, T.; Lee, W.J.; Samanta, C.; Patel, J.; Bordoloi, A. Processes for the production of oxymethylene ethers: Promising synthetic diesel additives. Asia-Pac. J. Chem. Eng. 2017, 12, 827–837. [Google Scholar] [CrossRef]
- Oestreich, D. Prozessentwicklung zur Gewinnung von Oxymethylenethern (OME) aus Methanol und Formaldehyd; Karlsruher Institut für Technology: Karlsruhe, Germany, 2017. [Google Scholar]
- Ouda, M.; Mantei, F.; Hesterwerth, K.; Bargiacchi, E.; Klein, H.; White, R.J. A hybrid description and evaluation of oxymethylene dimethyl ethers synthesis based on the endothermic dehydrogenation of methanol. React. Chem. Eng. 2018, 3, 676–695. [Google Scholar] [CrossRef]
- Ouda, M.; Yarce, G.; White, R.J.; Hadrich, M.; Himmel, D.; Schaadt, A.; Klein, H.; Jacob, E.; Krossing, I. Poly(oxymethylene) dimethyl ether synthesis–a combined chemical equilibrium investigation towards an increasingly efficient and potentially sustainable synthetic route. React. Chem. Eng. 2017, 2, 50–59. [Google Scholar] [CrossRef]
- Bongartz, D.; Burre, J.; Mitsos, A. Production of Oxymethylene Dimethyl Ethers from Hydrogen and Carbon Dioxide—Part I: Modeling and Analysis for OME1. Ind. Eng. Chem. Res. 2019, 58, 4881–4889. [Google Scholar] [CrossRef]
- Breitkreuz, C.F.; Schmitz, N.; Ströfer, E.; Burger, J.; Hasse, H. Design of a Production Process for Poly(oxymethylene) Dimethyl Ethers from Dimethyl Ether and Trioxane. Chem. Ing. Tech. 2018, 90, 1489–1496. [Google Scholar] [CrossRef]
- Burre, J.; Bongartz, D.; Mitsos, A. Production of Oxymethylene Dimethyl Ethers from Hydrogen and Carbon Dioxide—Part II: Modeling and Analysis for OME3–5. Ind. Eng. Chem. Res. 2019, 58, 5567–5578. [Google Scholar] [CrossRef]
- Held, M.; Tönges, Y.; Pélerin, D.; Härtl, M.; Wachtmeister, G.; Burger, J. On the energetic efficiency of producing polyoxymethylene dimethyl ethers from CO2 using electrical energy. Energy Environ. Sci. 2019, 12, 1019–1034. [Google Scholar] [CrossRef]
- Schemme, S.; Breuer, J.L.; Köller, M.; Meschede, S.; Walman, F.; Samsun, R.C.; Peters, R.; Stolten, D. H2-based synthetic fuels: A techno-economic comparison of alcohol, ether and hydrocarbon production. Int. J. Hydrog. Energy 2020, 45, 5395–5414. [Google Scholar] [CrossRef]
- Schmitz, N.; Burger, J.; Ströfer, E.; Hasse, H. From methanol to the oxygenated diesel fuel poly(oxymethylene) dimethyl ether: An assessment of the production costs. Fuel 2016, 185, 67–72. [Google Scholar] [CrossRef]
- König, D.H.; Baucks, N.; Dietrich, R.-U.; Wörner, A. Simulation and evaluation of a process concept for the generation of synthetic fuel from CO2 and H2. Energy 2015, 91, 833–841. [Google Scholar] [CrossRef]
- Weidert, J.-O.; Burger, J.; Renner, M.; Blagov, S.; Hasse, H. Development of an Integrated Reaction–Distillation Process for the Production of Methylal. Ind. Eng. Chem. Res. 2017, 56, 575–582. [Google Scholar] [CrossRef]
- Schmitz, N.; Strofer, E.; Burger, J.; Hasse, H. Conceptual Design of a Novel Process for the Production of Poly(oxymethylene) Dimethyl Ethers from Formaldehyde and Methanol. Ind. Eng. Chem. Res. 2017, 56, 11519–11530. [Google Scholar] [CrossRef]
- Schmitz, N.; Breitkreuz, C.F.; Ströfer, E.; Burger, J.; Hasse, H. Vapor–liquid equilibrium and distillation of mixtures containing formaldehdye and poly(oxymethylene) dimethyl ethers. Chem. Eng. Process.-Process Intensif. 2018, 131, 116–124. [Google Scholar] [CrossRef]
- Haarlemmer, G.; Boissonnet, G.; Peduzzi, E.; Setier, P.-A. Investment and production costs of synthetic fuels–A literature survey. Energy 2014, 66, 667–676. [Google Scholar] [CrossRef]
- Brynolf, S.; Taljegard, M.; Grahn, M.; Hansson, J. Electrofuels for the transport sector: A review of production costs. Renew. Sustain. Energy Rev. 2018, 81, 1887–1905. [Google Scholar] [CrossRef]
- Schemme, S. Techno-Economic Assessment of Processes for the Production of Fuels from H2 and CO2. Ph.D. Thesis, RWTH Aachen University, Jülich, Germany, 2020. [Google Scholar]
- Pasel, J.; Samsun, R.C.; Meißner, J.; Tschauder, A.; Peters, R. Recent advances in diesel autothermal reformer design. Int. J. Hydrog. Energy 2020, 45, 2279–2288. [Google Scholar] [CrossRef]
- Linnhoff, B. Pinch Technology for Synthesis of Optimal Heat and Power Systems. J. Energy Ressour. Technol. 1989, 113, 137–147. [Google Scholar] [CrossRef]
- Thenert, K.; Beydoun, K.; Wiesenthal, J.; Leitner, W.; Klankermayer, J. Ruthenium-Catalyzed Synthesis of Dialkoxymethane Ethers Utilizing Carbon Dioxide and Molecular Hydrogen. Angew. Chem. Int. Ed. Engl. 2016, 55, 12266–12269. [Google Scholar] [CrossRef]
- Peter, A.; Fehr, S.M.; Dybbert, V.; Himmel, D.; Lindner, I.; Jacob, E.; Ouda, M.; Schaadt, A.; White, R.J.; Scherer, H.; et al. Towards a Sustainable Synthesis of Oxymethylene Dimethyl Ether by Homogeneous Catalysis and Uptake of Molecular Formaldehyde. Angew. Chem. Int. Ed. Engl. 2018, 57, 9461–9464. [Google Scholar] [CrossRef]
- Moser, P.; Schmidt, S.; Stahl, K.; Wiechers, G.; Heberle, A.; Kuhr, C.; Schroer, K.; Kakihara, H.; Peters, R.; Weiske, S.; et al. Das Projekt ALIGN-CCUS-Ein Beitrag zum evolutiven Transformationsprozess der Energie- und Rohstoffversorgung durch Rycycling von Kohlenstofff. Vgb Power Tech. 2020, 1, 43–49. [Google Scholar]
- Moser, P.; Wiechers, G.; Schmidt, S.; Stahl, K.; Maijd, M.; Bosser, S.; Heberle, A.; Kakihara, H.; Maruyama, M.; Peters, R.; et al. Demonstrating the CCU-chain and sector coupling as part of ALIGN-CCUS–Dimethyl ether from CO2 as chemical energy storage, fuel and feedstock for industries. In Proceedings of the 14th International Conference on Greenhouse Gas Control Technologies, GHGT-14, Melbourne, Australia, 21–25 October 2018; p. 14. [Google Scholar]
- Boeltken, T.; Selinsek, M.; Pfeifer, P. Chemische Energiekonversion: Aus Wasser und Wind. Nachr. Aus Der Chem. 2017, 65, 1112–1114. [Google Scholar] [CrossRef]
- Dittmeyer, R.; Boeltken, T.; Piermartini, P.; Selinsek, M.; Loewert, M.; Dallmann, F.; Kreuder, H.; Cholewa, M.; Wunsch, A.; Belimov, M.; et al. Micro and micro membrane reactors for advanced applications in chemical energy conversion. Curr. Opin. Chem. Eng. 2017, 17, 108–125. [Google Scholar] [CrossRef]
- Edwards, R.; Larivé, J.-F.; Rickeard, D.; Weindorf, W. Well-to-tank Appendix 2-Version 4 a; Joint Research Centre, Institute for Energy and Transport: Ispra, Italy, 2014; p. 32. [Google Scholar]
- Entwicklung des Tankstellenbestandes ab 1950 in Deutschland Jeweils zu Jahresbeginn. Available online: https://www.mwv.de/statistiken/tankstellenbestand/ (accessed on 1 July 2020).
- Fahrzeugzulassungen (FZ) Bestand an Nutzfahrzeugen, Kraftfahrzeugen Insgesamt und Kraftfahrzeuganhängern Nach Technischen Daten (Größenklassen, Motorisierung, Fahrzeugklassen und Aufbauarten); Kraftfahrt-Bundesamt: Flensburg, Germany, 2020; p. 112.
- Fahrzeugbestand. Available online: https://www.bmvi.de/SharedDocs/DE/Artikel/G/fahrzeugbestand.html (accessed on 27 December 2020).
- Nutzfahrzeug-Bestand in Deutschland Nach Gewichtsklassen im Jahr 2019. Available online: https://de.statista.com/statistik/daten/studie/687713/umfrage/bestand-an-nutzfahrzeugen-in-deutschland-nach-gewichtsklassen/ (accessed on 27 December 2020).
- Verbeek, R.; van Zyl, S.; van Grinsven, A.; van Essen, H. Brandstoffen Voor Het Wegverkeer: Kenmerken en Perspectief; TNO & CE Delft: Delft, The Netherlands, 2014. [Google Scholar]
- Deutz, S.; Bongartz, D.; Heuser, B.; Kätelhön, A.; Schulze Langenhorst, L.; Omari, A.; Walters, M.; Klankermayer, J.; Leitner, W.; Mitsos, A.; et al. Cleaner production of cleaner fuels: Wind-to-wheel–environmental assessment of CO2-based oxymethylene ether as a drop-in fuel. Energy Environ. Sci. 2018, 11, 331–343. [Google Scholar] [CrossRef]
- Härtl, M.; Seidenspinner, P.; Jacob, E.; Wachtmeister, G. Oxygenate screening on a heavy-duty diesel engine and emission characteristics of highly oxygenated oxymethylene ether fuel OME1. Fuel 2015, 153, 328–335. [Google Scholar] [CrossRef]
- Lumpp, B.; Rothe, D.; Pastötter, C.; Lämmermann, R.; Jacob, E. Oxymethylene Ethers as Diesel Fuel Additives of the Future. Mtz Worldw. Emag. 2011, 72, 34–38. [Google Scholar] [CrossRef]
- Iannuzzi, S.E.; Barro, C.; Boulouchos, K.; Burger, J. POMDME-diesel blends: Evaluation of performance and exhaust emissions in a single cylinder heavy-duty diesel engine. Fuel 2017, 203, 57–67. [Google Scholar] [CrossRef]
- Barro, C.; Parravicini, M.; Boulouchos, K. Neat polyoxymethylene dimethyl ether in a diesel engine; part 1: Detailed combustion analysis. Fuel 2019, 256, 115892. [Google Scholar] [CrossRef]
- Parravicini, M.; Barro, C.; Boulouchos, K. Compensation for the differences in LHV of diesel-OME blends by using injector nozzles with different number of holes: Emissions and combustion. Fuel 2020, 259, 116166. [Google Scholar] [CrossRef]
- Zhang, T.; Munch, K.; Denbratt, I. An Experimental Study on the Use of Butanol or Octanol Blends in a Heavy Duty Diesel Engine. Sae Int. J. Fuels Lubr. 2015, 8, 610–621. [Google Scholar] [CrossRef]
- Kerschgens, B.; Cai, L.; Pitsch, H.; Heuser, B.; Pischinger, S. Di-n-buthlyether, n-octanol, and n-octane as fuel candidates for diesel engine combustion. Combust. Flame 2016, 613, 166–178. [Google Scholar]
- Gill, S.S.; Tsolakis, A.; Dearn, K.D.; Rodríguez-Fernández, J. Combustion characteristics and emissions of Fischer–Tropsch diesel fuels in IC engines. Prog. Energy Combust. Sci. 2011, 37, 503–523. [Google Scholar] [CrossRef]
- Bestand an Tankstellen in europäischen Ländern im Jahr 2019. Available online: https://de.statista.com/statistik/daten/studie/388155/umfrage/anzahl-der-tankstellen-in-europa/ (accessed on 27 December 2020).
- DIN EN 590, Automotive Fuels-Diesel-Requirements and Test Methods; German Version (EN 590:2013+AC:2014). Deutsches Institut für Normung e.V.: Berlin, Germany, 2014.
- Kramer, U.; Stollenwerk, S.; Ortloff, F.; Sava, X.; Janssen, A.; Eppler, S.; Schule, H.; Dohler, A.; Otten, R.; Lohrmann, M.; et al. Klimaneutrales Fahren in 2050: Optionen zur vollständigen Defossilisierung des Transportsektors. Betrachtungen auf Basis der “FW-Kraftstoffstudie 2018”/Climate-Neutral Driving in 2050: Options for th. In 40. Internationales Wiener Motorensymposium 15.–17. Mai 2019: Band 1: Erster Tag; Band 2: Zweiter Tag/40th International Vienna Motor Symposium 15–17 May 2019 in Two Volumes. Volume 1: First, Day; Volume 2: Second Day, 1st ed.; Geringer, B., Lenz, H.-P., Eds.; VDI Verlag: Düsseldorf, Germany, 2019; pp. II-143–II-175. [Google Scholar]
- ASTM D975-20c. Standard Specification for Diesel Fuel; International, A., Ed.; ASTM: West Conshohocken, PA, USA, 2020. [Google Scholar] [CrossRef]
- Bohl, T.; Smallbone, A.; Tian, G.; Roskilly, A.P. Particulate number and NO trade-off comparisons between HVO and mineral diesel in HD applications. Fuel 2018, 215, 90–101. [Google Scholar] [CrossRef]
- Kuronen, M.; Mikkonen, S.; Aakko, P.; Murtonen, T. Hydrotreated Vegetable Oil as Fuel for Heavy Duty Diesel Engines; SAE Technical Paper; SAE: Warrendale, PA, USA, 2007. [Google Scholar] [CrossRef]
- DIN EN 16734. Automotive Fuels-Automotive B10 Diesel fuel-Requirements and Test Methods; German Version EN 16734:2016. Deutsches Institut für Normung e.V.; DIN: Berlin, Germany, 2016. [Google Scholar]
- DIN EN 16709. Automotive Fuels-High FAME Diesel Fuel (B20 and B30)-Requirements and Test Methods; German Version EN 16709:2015+A1:2018. Deutsches Institut für Normung e.V.; DIN: Berlin, Germany, 2019. [Google Scholar]
- DIN EN 14214. Liquid Petroleum Products-Fatty acid Methyl Esters (FAME) for Use in Diesel Engines and Heating Applications-Requirements and Test Methods; German Version EN 14214:2012+A2:2019. Deutsches Institut für Normung e.V.; DIN: Berlin, Germany, 2019. [Google Scholar]
- Beidl, C.; Münz, M.; Mokros, A. Anwendung von Oxymethylenether (OME) am Dieselmotor. In Zukünftige Kraftstoffe; Springer: Berlin/Heidelberg, Germany, 2019; pp. 814–849. [Google Scholar] [CrossRef]
- Damyanov, A. Alcoholic Fuels in Diesel Engines. Methanol, Ethanol and Butanol. In Zukünftige Kraftstoffe; Springer: Berlin/Heidelberg, Germany, 2019. [Google Scholar] [CrossRef]
- Sayin, C. Engine performance and exhaust gas emissions of methanol and ethanol–diesel blends. Fuel 2010, 89, 3410–3415. [Google Scholar] [CrossRef]
- Rajesh Kumar, B.; Saravanan, S.; Rana, D.; Anish, V.; Nagendran, A. Effect of a sustainable biofuel–n-octanol–on the combustion, performance and emissions of a DI diesel engine under naturally aspirated and exhaust gas recirculation (EGR) modes. Energy Convers. Manag. 2016, 118, 275–286. [Google Scholar] [CrossRef]
- SIEMENS AG. Mit eHighway in die Zukunft. In Innovative Lösungen für den Straßengüterverkehr; SIEMENS AG: München, Germany, 2012. [Google Scholar]
- SIEMENS AG. ENUBA-Elektromobilität bei Schweren Nutzfahrzeugen zur Umweltentlastung von Ballungsräumen; f-Cell; SIEMENS AG: München, Germany, 2012; p. 64. [Google Scholar]
- Von Helmolt, R. Fuel Cell or Battery Vehicles? Similar Technology, Different Infrastructure; Holtzbrinck Publishing: Stuttgart, Germany, 2009. [Google Scholar]
- Daniels, A. LKW Mit Oberleitung Auf Dem eHighway-so Funktioniert es. Available online: https://nextdrive.de/lkw-mit-oberleitung-auf-dem-ehighway-so-funktioniert-es (accessed on 4 September 2020).
- Ziegert, S. Scania Deutschland Nachhaltiger Transport. In Jahrestagung Mobilität; Energieagentur NRW: Düsseldorf, Germany, 2020; p. 20. [Google Scholar]
- Mareev, I.; Sauer, D. Energy Consumption and Life Cycle Costs of Overhead Catenary Heavy-Duty Trucks for Long-Haul Transportation. Energies 2018, 11, 2446. [Google Scholar] [CrossRef]
- Wietschel, M.; Gnann, T.; Kühn, A.; Plötz, P.; Moll, C.; Speth, D.; Buch, J.; Boßmann, T.; Stütz, S.; Schellert, M.; et al. Machbarkeitsstudie zur Ermittlung der Potentiale des Hybrid-Oberleitungs-Lkw; Fraunhofer Institut für System und Innovationsforschung (ISI): Karlsruhe, Germany, 2017. [Google Scholar]
- Gnann, T.; Wietschel, M.; Plötz, P.; Kühn, A. Potenziale und Finanzierungsbedarf von Hybrid-Oberleitungs−LKW; Fraunhofer: Berlin, Germany, 2017. [Google Scholar]
- Kühnel, S.; Hacker, F.; Görz, W. Oberleitungs-Lkw im Kontext Weiterer Antriebs- und Energieversorgungsoptionen für den Straßengüterfernverkehr; Öko-Institut e.V.: Berlin, Germany, 2018; p. 151. [Google Scholar]
- Advancing Technology for America’s Transportation Future, Chapter 14–Natural Gas; National Petroleum Council: Washington, DC, USA, 2012.
- Wei, L.; Geng, P. A review on natural gas/diesel dual fuel combustion, emissions and performance. Fuel Process. Technol. 2016, 142, 264–278. [Google Scholar] [CrossRef]
- Boretti, A. Advances in diesel-LNG internal combustion engines. Appl. Sci. 2020, 10, 1296. [Google Scholar] [CrossRef]
- Fasching, P.; Sprenger, F.; Granitz, C. A holistic investigation of natural gas–diesel dual fuel combustion with dual direct injection for passenger car applications. Automot. Engine Technol. 2017, 2, 79–95. [Google Scholar] [CrossRef]
- Dunn, M.E.; McTaggart-Cowan, G.P.; Saunders, J. High efficiency and low emission natural gas engines for heavy duty vehicles. In Internal Combustion Engines: Performance, Fuel Economy and Emissions: IMechE, London, 27–28 November 2013; Elsevier: Amsterdam, The Netherlands, 2013; pp. 123–136. [Google Scholar] [CrossRef]
- Anderhofstadt, B.; Spinler, S. Factors affecting the purchasing decision and operation of alternative fuel-powered heavy-duty trucks in Germany–A Delphi study. Transp. Res. Part D Transp. Environ. 2019, 73, 87–107. [Google Scholar] [CrossRef]
- Der neue Stralis NP Pure Power. Available online: https://www.iveco.com/austria/Neufahrzeuge/Documents/stralis/StralisNP_brochure_AT.pdf (accessed on 16 April 2020).
- New Stralis NP 460: A Complete Range of Natural Gas Trucks for All Missions That Hits the Sweet Spot of the Market with its 460 hp of Pure Power. 2017. Available online: https://www.iveco.com/en-us/press-room/release/Documents/2017/NewStralisNP460.pdf (accessed on 17 February 2021).
- Volvo FM LNG. Available online: https://www.volvotrucks.com/en-en/trucks/trucks/volvo-fm/volvo-fm-lng.html (accessed on 16 April 2020).
- Cummins Wesport Engines: ISX12N. Available online: https://www.cumminswestport.com/models/isx12n (accessed on 16 April 2020).
- Westport™ HPDI 2.0. A New Generation Natural Gas Fuel System Optimal for Heavy-Duty Vehicles. Available online: https://www.westport.com/is/core-technologies/hpdi-2 (accessed on 16 April 2020).
- Alamia, A.; Magnusson, I.; Johnsson, F.; Thunman, H. Well-to-wheel analysis of bio-methane via gasification, in heavy duty engines within the transport sector of the European Union. Appl. Energy 2016, 170, 445–454. [Google Scholar] [CrossRef]
- Vermeulen, R.J. TNO Report: TNO 2019 R10193. Emissions Testing of a Euro VI LNG-Diesel Dual Fuel Truck in the Netherlands; TNO 2019 R10193; TNO: The Hague, The Netherlands, 2019; p. 36. [Google Scholar]
- Camuzeaux, J.R.; Alvarez, R.A.; Brooks, S.A.; Browne, J.B.; Sterner, T. Influence of methane emissions and vehicle efficiency on the climate implications of heavy-duty natural gas trucks. Environ. Sci. Technol. 2015, 49, 6402–6410. [Google Scholar] [CrossRef]
- Otten, M.; Hoen, M.; den Boer, E. STREAM Freight Transport 2016: Emissions of Freight Transport Modes; CE Delft: Delft, The Netherlands, 2017. [Google Scholar]
- Matzer, C.; Weller, K.; Dippold, M.; Lipp, S.; Röck, M.; Rexeis, M.; Hausberger, S. Update of Emission Factors for HBEFA Version 4.1; Final Report, I-05/19/CM EM-I-16/26/679; TU Graz: Graz, Austria, 2019. [Google Scholar]
- Röck, M.; Rexeis, M.; Hausberger, S. JEC Well -to-Wheels Analyses of Future Automotive Fuels and Powertrains in the European Context; Graz University of Technology: Graz, Austria, 2018. [Google Scholar]
- Erdgas-Tankstellen in Ihrer Nähe oder auf Ihrer Route, Zukunft Gas e.V., Berlin, Germany. Available online: https://www.erdgas.info/erdgas-mobil/erdgas-tankstellen/tankstellenfinder/ (accessed on 29 April 2020).
- U.S. Department of Energy-Energy Efficiency and Renewable Energy, Alternative Fuels Data Center, Natural Gas Fueling Station Locations. Available online: https://afdc.energy.gov/fuels/natural_gas_locations.html#/analyze?country=US&fuel&access=public&access=private&cng_vehicle_class=HD&lng_vehicle_class=HD (accessed on 16 April 2020).
- NGVA Europe, Stations Map. Available online: https://www.ngva.eu/stations-map/ (accessed on 16 April 2020).
- Heckler, D. LNG-Tankstellen Infrastruktur. In Green Energy Hubs; EnergieAgentur.NRW: Nordrhein-Westfalen, Germany, 2020. [Google Scholar]
- Thys, M. Grünes CNG/LNG: Erneuerbares Gas für Nutzfahrzeuge. In Jahrestagung Mobilität; EnergieAgentur: Nordrhein-Westfalen, Germany, 2020. [Google Scholar]
- Westport Fuel Systems, Corporate Overview, November 2019. Available online: https://wfsinc.com/investors/corporate-overview (accessed on 22 April 2020).
- Lischke, A.; Windmüller, D.; Wurster, R.; Weindorf, W.; Heidt, C.; Naumann, K. Identifizierung von Hemmnissen der Nutzung von LNG und CNG im Schweren Lkw-Verkehr Sowie Möglichkeiten zu Deren Überwindung; Deutsches Zentrum für Luft- und Raumfahrt e.V.: Köln, Germany, 2015. [Google Scholar]
- Bundesministerium für Verkehr und Digitale Infrastruktur. Richtlinie über die Förderung von energieeffizienten und/oder CO2-armen schweren Nutzfahrzeugen in Unternehmen des Güterkraftverkehrs; Bundesministerium für Verkehr und Digitale Infrastruktur: Berlin, Germany, 2018. [Google Scholar]
- Burnham, A. Case Study-Liquefied Natural Gas; eere_es_cleancities-082813lb; Argonne National Laboratory: Argonne, IL, USA, 2013; p. 6. [Google Scholar]
- Langshaw, L.; Ainalis, D.; Acha, S.; Shah, N.; Stettler, M.E.J. Environmental and economic analysis of liquefied natural gas (LNG) for heavy goods vehicles in the UK: A Well-to-Wheel and total cost of ownership evaluation. Energy Policy 2020, 137, 111161. [Google Scholar] [CrossRef]
- Mojtaba Lajevardi, S.; Axsen, J.; Crawford, C. Comparing alternative heavy-duty drivetrains based on GHG emissions, ownership and abatement costs: Simulations of freight routes in British Columbia. Transp. Res. Part D Transp. Environ. 2019, 76, 19–55. [Google Scholar] [CrossRef]
- Aral. FAQ AdBlue®. Available online: https://www.aral.de/de/global/forschung/faq/faq-adblue.html#accordion_5 (accessed on 22 April 2020).
- dena-Analyse: Branchenbarometer Biomethan 2019; Deutsche Energie-Agentur GmbH (dena): Berlin, Germany, 2019; p. 14.
- Peters, R.; Baltruweit, M.; Grube, T.; Samsun, R.C.; Stolten, D. A techno economic analysis of the power to gas route. J. Co2 Util. 2019, 34, 616–634. [Google Scholar] [CrossRef]
- Fleisch, T.H.; Basu, A.; Sills, R.A. Introduction and advancement of a new clean global fuel: The status of DME developments in China and beyond. J. Nat. Gas Sci. Eng. 2012, 9, 94–107. [Google Scholar] [CrossRef]
- Arnold, U.; Haltenort, P.; Herrera Delgado, K.; Niethammer, B.; Sauer, J. Die Rolle von Dimethylether (DME) als Schlüsselbaustein synthetischer Kraftstoffe aus erneuerbaren Rohstoffen. In Zukünftige Kraftstoffe; ATZ/MTZ-Fachbuch, Springer-GmbH: Wiesbaden, Deutschland, 2019. [Google Scholar] [CrossRef]
- Geng, P.; Cao, E.; Tan, Q.; Wei, L. Effects of alternative fuels on the combustion characteristics and emission products from diesel engines: A review. Renew. Sustain. Energy Rev. 2017, 71, 523–534. [Google Scholar] [CrossRef]
- Salomonsson, P. Final Report of the European BioDME Project. In Proceedings of the 5th International DME Conference, Ann Arbor, MI, USA, 18 April 2013. [Google Scholar]
- Szybist, J.P.; McLaughlin, S.; Iyer, S. Emissions and Performance Benchmarking of a Prototype Dimethyl Ether-Fueled Heavy-Duty Truck; ORNL/TM-2014/59; Oak Ridge National Laboratory: Springfield, VA, USA, 2014; p. 56. [Google Scholar]
- Ying, W.; Li, H.; Jie, Z.; Longbao, Z. Study of HCCI-DI combustion and emissions in a DME engine. Fuel 2009, 88, 2255–2261. [Google Scholar] [CrossRef]
- Ying, W.; Longbao, Z. Experimental study on exhaust emissions from a multi-cylinder DME engine operating with EGR and oxidation catalyst. Appl. Therm. Eng. 2008, 28, 1589–1595. [Google Scholar] [CrossRef]
- Benajes, J.; Novella, R.; Pastor, J.M.; Hernández-López, A.; Kokjohn, S. Computational optimization of a combustion system for a stoichiometric DME fueled compression ignition engine. Fuel 2018, 223, 20–31. [Google Scholar] [CrossRef]
- Benajes, J.; Novella, R.; Pastor, J.M.; Hernández-López, A.; Kokjohn, S.L. Computational optimization of the combustion system of a heavy duty direct injection diesel engine operating with dimethyl-ether. Fuel 2018, 218, 127–139. [Google Scholar] [CrossRef]
- Kim, H.J.; Park, S.H. Optimization study on exhaust emissions and fuel consumption in a dimethyl ether (DME) fueled diesel engine. Fuel 2016, 182, 541–549. [Google Scholar] [CrossRef]
- Michailos, S.; McCord, S.; Sick, V.; Stokes, G.; Styring, P. Dimethyl ether synthesis via captured CO2 hydrogenation within the power to liquids concept: A techno-economic assessment. Energy Convers. Manag. 2019, 184, 262–276. [Google Scholar] [CrossRef]
- MAN Presents Zero-Emission Roadmap. Available online: https://press.mantruckandbus.com/man-presents-zero-emission-roadmap (accessed on 24 November 2020).
- Toyota and Hino to Jointly Develop Heavy-Duty Fuel Cell Truck. Available online: https://global.toyota/en/newsroom/corporate/32024083.html (accessed on 23 March 2020).
- The Volvo Group and Daimler Truck AG to Lead the Development of Sustainable Transportation by Forming Joint Venture for Large-Scale Production of Fuel Cells; AB Volvo: Gothenburg, Sweden, 2020.
- IVECO. FPT Industrial and Nikola Corporation Launch Their Partnership to Achieve Zero-Emissions Transport; Nikola Motor Corporation: Salt Lake City, UT, USA, 2020. [Google Scholar]
- Blanco, S. Toyota, Kenworth Expand Hydrogen Semi-Truck Push At Los Angeles Ports. Available online: https://www.forbes.com/sites/sebastianblanco/2019/04/23/toyota-kenworth-expand-hydrogen-semi-truck-push-at-los-angeles-ports/?sh=1cbc0519d762 (accessed on 10 May 2020).
- The Future of Emission Free Logistics Starts Here. Available online: http://trucknbus.hyundai.com/global/en/eco/hyundai-hydrogen-mobility (accessed on 5 May 2020).
- Multi-Year Research, Development and Demonstration Plan, Hydrogen, Fuel Cells & Infrastructure Technologies Program-Fuel Cells; Department of Energy: Washington, DC, USA, 2017.
- Edwards, R.; Hass, H.; Larivé, J.-F.; Lonza, L.; Maas, H.; Rickeard, D. WELL-TO-WHEELS Report Version 4.a; Report EUR 26236 EN; Publications Office of the European Union: Luxembourg, 2014. [Google Scholar]
- Robinius, M.; Linßen, J.; Grube, T.; Reuß, M.; Stenzel, P.; Syranidis, K.; Kuckertz, P.; Stolten, D. Comparative Analysis of Infrastructures: Hydrogen Fueling and Electric Charging of Vehicles; Forschungszentrum Jülich GmbH: Jülich, Germany, 2018; Volume 408. [Google Scholar]
- Rose, P.K.; Neumann, F. Hydrogen refueling station networks for heavy-duty vehicles in future power systems. Transp. Res. Part D Transp. Environ. 2020, 83, 102358. [Google Scholar] [CrossRef]
- Coiffier, B. Technische Herausforderungen bei der H2-Betankung von Heavy Duty-Anwendungen. In Jahrestagung Mobilität; EnergieAgentur: Nordrhein-Westfalen, Germany, 2020. [Google Scholar]
- Marcinkoski, J. DOE Advanced Truck Technologies. In 19006; Department of Energy, U.S.A., Ed.; Department of Energy: Washington, DC, USA, 2019. [Google Scholar]
- Cerniauskas, S.; Grube, T.; Praktiknjo, A.; Stolten, D.; Robinius, M. Future Hydrogen Markets for Transportation and Industry: The Impact of CO2 Taxes. Energies 2019, 12, 4707. [Google Scholar] [CrossRef]
- Daum, J. Nutzfahrzeuge mit alternativen Antrieben und dafür nötige Tank- und Ladeinfrastrukur. In Green Energy Hubs; EnergieAgentur: Nordrhein-Westfalen, Germany, 2020. [Google Scholar]
- Boretti, A. Hydrogen internal combustion engines to 2030. Int. J. Hydrog. Energy 2020, 45, 23692–23703. [Google Scholar] [CrossRef]
- BMW Hydrogen 7. Available online: https://www.wired.com/images_blogs/autopia/files/bmw_hydrogen_7.pdf (accessed on 23 January 2021).
- Akal, D.; Öztuna, S.; Büyükakın, M.K. A review of hydrogen usage in internal combustion engines (gasoline-Lpg-diesel) from combustion performance aspect. Int. J. Hydrog. Energy 2020, 45, 35257–35268. [Google Scholar] [CrossRef]
- Mehra, R.K.; Duan, H.; Juknelevičius, R.; Ma, F.; Li, J. Progress in hydrogen enriched compressed natural gas (HCNG) internal combustion engines-A comprehensive review. Renew. Sustain. Energy Rev. 2017, 80, 1458–1498. [Google Scholar] [CrossRef]
- Wind, J. Hydrogen-fueled road automobiles–Passenger cars and buses. In Compendium of Hydrogen Energy; Elsevier: Frankfurt, Germany, 2016; pp. 3–21. [Google Scholar] [CrossRef]
- Chintala, V.; Subramanian, K.A. A comprehensive review on utilization of hydrogen in a compression ignition engine under dual fuel mode. Renew. Sustain. Energy Rev. 2017, 70, 472–491. [Google Scholar] [CrossRef]
- KEYOU-inside for Hydrogen Engines and Vehicle. Available online: https://www.keyou.de/wp-content/uploads/2018/10/181025_IAA_Broschu%CC%88re_2018_Lkw_EN_210x297.pdf (accessed on 27 December 2020).
- Heffel, J. NOx emission and performance data for a hydrogen fueled internal combustion engine at 1500 rpm using exhaust gas recirculation. Int. J. Hydrog. Energy 2003, 28, 901–908. [Google Scholar] [CrossRef]
- Mathai, R.; Malhotra, R.K.; Subramanian, K.A.; Das, L.M. Comparative evaluation of performance, emission, lubricant and deposit characteristics of spark ignition engine fueled with CNG and 18% hydrogen-CNG. Int. J. Hydrog. Energy 2012, 37, 6893–6900. [Google Scholar] [CrossRef]
- Dimitriou, P.; Tsujimura, T. A review of hydrogen as a compression ignition engine fuel. Int. J. Hydrog. Energy 2017, 42, 24470–24486. [Google Scholar] [CrossRef]


Publisher’s Note: MDPI stays neutral with regard to jurisdictional claims in published maps and institutional affiliations. |
© 2021 by the authors. Licensee MDPI, Basel, Switzerland. This article is an open access article distributed under the terms and conditions of the Creative Commons Attribution (CC BY) license (http://creativecommons.org/licenses/by/4.0/).