1. Introduction
The emergence of electrified and distributed propulsion for aerial vehicles might spur the proliferation of urban air passenger transport. Manufacturers of such novel vehicles that are capable of electric-powered vertical take-off and landing (eVTOL) promise reduced noise and emission footprints as well as cheaper and safer operation when compared to conventional helicopters. These developments might facilitate the spread and use of urban air mobility (UAM), which—in the context of this study—is understood as an on-demand aerial passenger transport via short-range eVTOL flights from, to, and/or within urban areas operating from dedicated eVTOL stations which passengers are required to access and egress from.
Occasionally, helicopter passenger transport services did exist with, for example, New York Airways operating between 1949 and 1979 in New York and Airbus’ Voom offering on-demand helicopter transport in São Paulo, San Francisco Bay Area, and Mexico City from 2016 until recently ceasing operations in March 2020. Commercial helicopter services constitute a highly costly and situational—thus, a very niche—mode of transportation. Currently, the main benefit of helicopter transport services seems to be their relatively short travel times that—generally—seem unaffected by conventional ground-based traffic congestion.
This study aims at exploring the potential travel time savings that various UAM implementations might allow. The main objectives of this study are to provide answers to the following three key research questions:
What motorized trip shares could be achieved with what travel time savings?
How much does ground-based congestion impact UAM travel times?
On average, beyond which trip distances can UAM provide time savings?
2. Literature Review
2.1. Potential Demand
To understand demand drivers of UAM, Fu et al. [
1] and Al Haddad et al. [
2] conducted preliminary studies to gain insights into the potential user’s choice behavior regarding currently available urban transportation modes and autonomous transportation services. Their results were integrated within the microscopic travel demand model, MITO [
3], and applied to the Munich Metropolitan Region, resulting in UAM market share estimations ranging from 0.16% to 0.38% [
4]. Similarly, Plötner et al. [
5] concluded a potential modal split of 0.5% for UAM, trying to employ UAM in order to complement public transport. Both studies [
4,
5] conclude that UAM is expected to have a negligible impact on existing traffic patterns. A study by Wang and Ross [
6], however, found that the majority of on-demand trips (taxi in their case) were transit-competing rather than transit-complementing or -extending. Since UAM is a similarly-functioning on-demand mode like taxi, the findings from Wang and Ross [
6] might also be applicable to UAM. A study of Zurich, Switzerland, showed fewer than 2000 (0.34%) potential UAM trips [
7], with a follow-up study—which introduced UAM process times and take-off and landing procedures—yielding a UAM trip share of 0.05% [
8]. One of the main demand drivers for UAM service usage are potential travel time reductions.
Similar to this study, Postorino and Sarné [
9] applied an agent-based simulation to analyze the impact of UAM usage on urban mobility. However, the authors focused on flying cars rather than UAM being a separate mode of transportation from a car that merits station access and egress. Within their simulation of grid-like transport networks, they conclude that “(i) [individual flying cars in urban contexts] are not necessarily more convenient and sustainable than current ground mobility when the demand level is increasing; (ii) the potential advantage is linked to the O/D pair distance [...]” ([
9], p. 13). If one assumed UAM to be station-based, the placement of stations becomes highly relevant for the accessibility of the service, as early studies have shown [
10].
2.2. Station Placement
The availability of ground infrastructure is one of the most important near-term limitations for UAM according to, e.g., Vascik and Hansman [
11] and Liu et al. [
12]. Similar to the minimum ground infrastructure requirements for helicopters, Vascik and Hansman [
11] and Holden and Goel [
13] defined several different UAM ground infrastructure concepts and designs. Focusing on UAM station placement, different methods and provided rationales for identifying UAM locations have been proposed (see, e.g., [
5,
14,
15,
16]). On the basis of two case studies for Los Angeles and Munich, Fadhil [
15] conducted a geographic information system (GIS)-based analysis to identify areas of high suitability for UAM station locations. In another study based on the Upper Bavaria region of Germany, Plötner et al. [
5] manually placed 130 UAM stations by conducting workshops with local experts, considering various trip purposes such as commuting, business, tourism, and leisure. Using the same study area, Arellano [
16] developed a semi-automated procedure for allocating UAM station locations, following a GIS multi-criteria decision analysis framework similar to Fadhil [
15], yet with the introduction of applying impedance minimization algorithms to derive specific station locations.
Other studies propose demand-driven implementations. Just like within the Uber Elevate white paper [
13], Lim and Hwang [
17] employed a
k-means clustering algorithm which they applied on commute data from the Seoul Capital Area to identify centroids for trip origins and proposed those as suitable UAM station locations. The study set up 18 network schematics with the number of UAM stations ranging up to 36 stations. Notably, though, Lim and Hwang [
17] suggest that location was more important than the number of UAM stations. Syed et al. [
18] also used a
k-means clustering algorithm to allocate stations in Northern California and the Baltimore–Washington metropolitan area. Aiming to minimize travel times to and from stations, their
k-means implementation favored census tracts with high population and income. Based on four different scenarios with 200, 300, 400, and 1000 stations, the authors found that 20%, 25%, 30%, and 55% of potential demand was within 5 min of a UAM station for each scenario, respectively. Extending the study of German et al. [
19] who attempt to place UAM stations for cargo delivery, Daskilewicz et al. [
20] took the spatial distribution of jobs, in addition to population and income data, into account for the San Francisco Bay Area and Los Angeles region for allocating 10 to 40 UAM stations, with one of the studies’ results being that the majority of UAM trips had lengths of less than 30 miles (48 km).
2.3. Environmental Impact
Another significant aspect to evaluate UAM is the environmental effect—that includes noise—of UAM vehicle operation (see, e.g., [
21,
22,
23]). To understand the traffic-related emissions of eVTOL, Pukhova [
21] conducted UAM simulations for the Munich Metropolitan Region and estimated the emissions of UAM operation with regard to CO
and NO
levels. Based on comparing different scenarios with and without UAM, both with and without assumptions on various technological improvements, Pukhova [
21] found that UAM can only be of environmental benefit if the electricity used by eVTOL vehicles originates from renewable sources. Still, electric ground-based vehicles may be more energy efficient than UAM, given the same electricity mix. Nevertheless, Kasliwal et al. [
22] recently depicted an opposing view on the environmental impact of UAM. Their study found that, when comparing eVTOL vehicles at maximum occupancy (i.e., with three passengers) to cars with an average occupancy (i.e., 1.54 passengers), greenhouse gas emissions per passenger-kilometer of eVTOL flight are 50% lower than those from combustion engine cars and 6% lower than those of electric cars.
2.4. Modelling and Simulation
The multi-agent transportation simulation framework, MATSim [
24], allows for the modeling and simulation of novel transportation concepts such as ride-sharing [
25], car-sharing [
26], and shared autonomous vehicles [
27,
28,
29]. Likewise, UAM—another novel and autonomous mode—is also being modeled and studied using MATSim. The first such analysis of potential UAM demand was conducted for the city of Zurich, Switzerland by Balać et al. [
8]. The study performed sensitivity analyses of various operational UAM parameters and proposed a mixed-integer linear program to optimize fleet size and minimize vehicle-kilometers traveled by UAM vehicles. However, the authors point out several limitations of the study, including a very specific modeling of the UAM service without dedicated UAM infrastructure. This was overcome with the development of the MATSim UAM-extension, first presented by Rothfeld et al. [
30], which is developed based on the dynamic vehicle routing problem (DVRP) extension for MATSim by Maciejewski [
31]. Rothfeld et al. [
10] provided an initial analysis regarding the operational performance of a potential UAM implementation, considering eVTOL vehicle properties, dedicated eVTOL infrastructure placement, and the usage of urban airspace and aerial networks. For this, Rothfeld et al. [
10] used the extended Sioux Falls MATSim scenario by Hörl [
32] to do parameter–variation scenarios.
This initial sensitivity analysis for the MATSim UAM-extension prototype provides the first indications concerning the influence of UAM parameters, such as vehicle speed, ground-based process time, and network structure, on UAM transport performance and potential adoption (see [
5,
10]). Further studies (cf. [
7,
33,
34]) also made use of the UAM-extension for MATSim. Their key results suggest that UAM adoption is strongly influenced by the potential for travel time reduction perceived by passenger, UAM infrastructure placement, and duration of ground-based UAM processes. More than UAM vehicle speed and capacity, UAM accessibility and short process times seem to be highly significant for UAM to provide short travel times. However, most existent analyses either used prototyping study areas or focused on the impact of UAM service pricing while using assumptions on travel time savings that UAM can achieve. This study, however, intends to provide an insight into those—previously assumed—travel time savings.
3. Methodology
3.1. Simulation Framework and Base Scenarios
3.1.1. MATSim and Its Application
This study makes use of the aforementioned agent-based transport simulation, MATSim [
24]. MATSim itself is an agent-based transportation simulation framework that models complex interactions of individuals and vehicles on transport networks. For that, each agent’s daily activity plan—consisting of one or more trips—is iteratively modified, simulated, and scored, with agents generally seeking to minimize travel time and maximize time spent performing activities. This so-called MATSim loop is repeated until an equilibrium state is reached. MATSim has been designed to be easily extendable (see [
24], Part II: Extending MATSim) and thus facilitates the development of numerous extensions and analysis interfaces. For modeling UAM transportation, an updated version of the open-source UAM-extension [
35] as first presented by Rothfeld et al. [
10], is utilized.
In order to obtain realistic trips and congestion levels, which are vital for this study, well-calibrated base scenarios are required. So-called MATSim scenarios contain all information about the respective study areas’ synthetic population, each person’s activities, and the region’s transportation supply for an average day. For this study, the following three pre-existent scenarios are used: Munich Metropolitan Region (hereinafter abbreviated as MUC), Île-de-France (PAR), and San Francisco Bay Area (SFO), as listed in
Table 1. While the MUC scenario has been authored by Moeckel et al. [
36], PAR and SFO originate from Hörl and Balać [
37], Balać and Hörl [
38], with both sets of authors using different methods for generating and calibrating their respective scenarios.
3.1.2. Munich Metropolitan Region Scenario
The MUC scenario was created by using the open-source microscopic transport orchestrator (MITO) [
3] and OpenStreetMap data. MITO is an agent-based and trip-based travel demand model that follows the four-step transport modeling structure with (1) trip generation, (2) trip distribution, (3) modal split, and (4) traffic assignment. As an input, MITO requires a synthetic population that has been created using the land-use model SILO [
39] and represents an anonymized replication of census data [
40]. Trips, generated by the synthetic population’s activities, are assigned a transportation mode using a nested logit mode choice model (see [
3],
Figure 1a for an illustration) which was estimated using the household travel survey Mobilität in Deutschland [
41]. MITO itself also uses an iterative approach where MATSim’s traffic volumes affect the next iteration’s mode choice decisions until an equilibrium state is achieved. The calibrated MUC scenario includes trips towards five activity types home (42%), shop (9%), work (8%), education (3%), and other (38%); using four modes of transportation car (57%), walk (23%), bicycle (15%), and public transport (PT) (5%). For comparability with the remaining scenarios, which use a different set of modes, the listed modes have been mapped to a reduced set of modes (i.e., car, PT, walk, and bike) that is coherent over all three scenarios. A down-sampled share of a synthetic population is used for analysis to reduce computation load. Thus, a 25% population sample was used for MUC which includes 3.8 million trips.
3.1.3. Île-de-France Scenario
Hörl and Balać [
37] developed and calibrated an agent-based scenario for Île-de-France. Their scenario was built using only publicly-accessible data from sources such as population census, national and local household travel surveys, and tax registries to form a synthetic population with activity plans; and general transit feed specification (GTFS) schedules and OpenStreetMap to generate a multi-modal transport network. By using their self-developed framework eqasim [
42,
43], which builds on MATSim’s functionality, but replaces plan scoring with discrete mode-choice models [
44,
45], Hörl and Balać [
37] obtained each agent’s mobility choices by applying a multinomial logit model. The calibrated PAR scenario includes trips towards six activity types’ home (41%), leisure (13%), work (13%), errand (13%), shop (11%), and education (8%), using four distinct modes of transportation walk (43%), car (33%), PT (22%), and bike (1%). For PAR, a 10% population sample was used which includes 4.0 million trips with departure times, as using a 25% sample–as with MUC–exceeded available computational resources. Despite the lower sample size when compared to MUC, the sampled population of PAR provides more trips due to the scenario’s high population density (cf.
Table 1).
3.1.4. San Francisco Bay Area Scenario
Reapplying the methodology used for the Île-de-France scenario, Balać and Hörl [
38] also created an agent-based scenario for the nine-county San Francisco Bay Area. As with the previous scenario, the SFO scenario was created using openly-available data sets like the USA census estimates for 2017, the California household travel survey (CHTS) from 2012, GTFS schedules of public transport operators, and OpenStreetMap data. A multinomial logit mode-choice model was estimated based on the CHTS and paired with the mobility simulation of MATSim, in the same way as for Île-de-France. The calibrated SFO scenario includes trips towards six activity types home (35%), leisure (18%), work (13%), shop (10%), education (4%), and other (20%), using three distinct modes of transportation car (74%), walk (19%), and PT (7%). As with PAR and for the same reasons, a 10% population sample was used for SFO which includes 2.5 million trips. To be used with the UAM-extension though, each scenario requires some preparation, such as providing UAM station locations, UAM vehicle properties, and UAM flight routes.
3.2. Scenario Preparation
3.2.1. Zoning
MATSim itself uses each trip’s precise origin and departure coordinates for calculating travel times without the need for subdividing the study area into smaller zones. However, such a reduction in spatial complexity greatly facilitates visualising and analysing study areas and aides in placing UAM stations. Thus, rasterized layers have been created for each of the three study areas, using a population-based incremental segmentation approach inspired by Moeckel and Donnelly [
46].
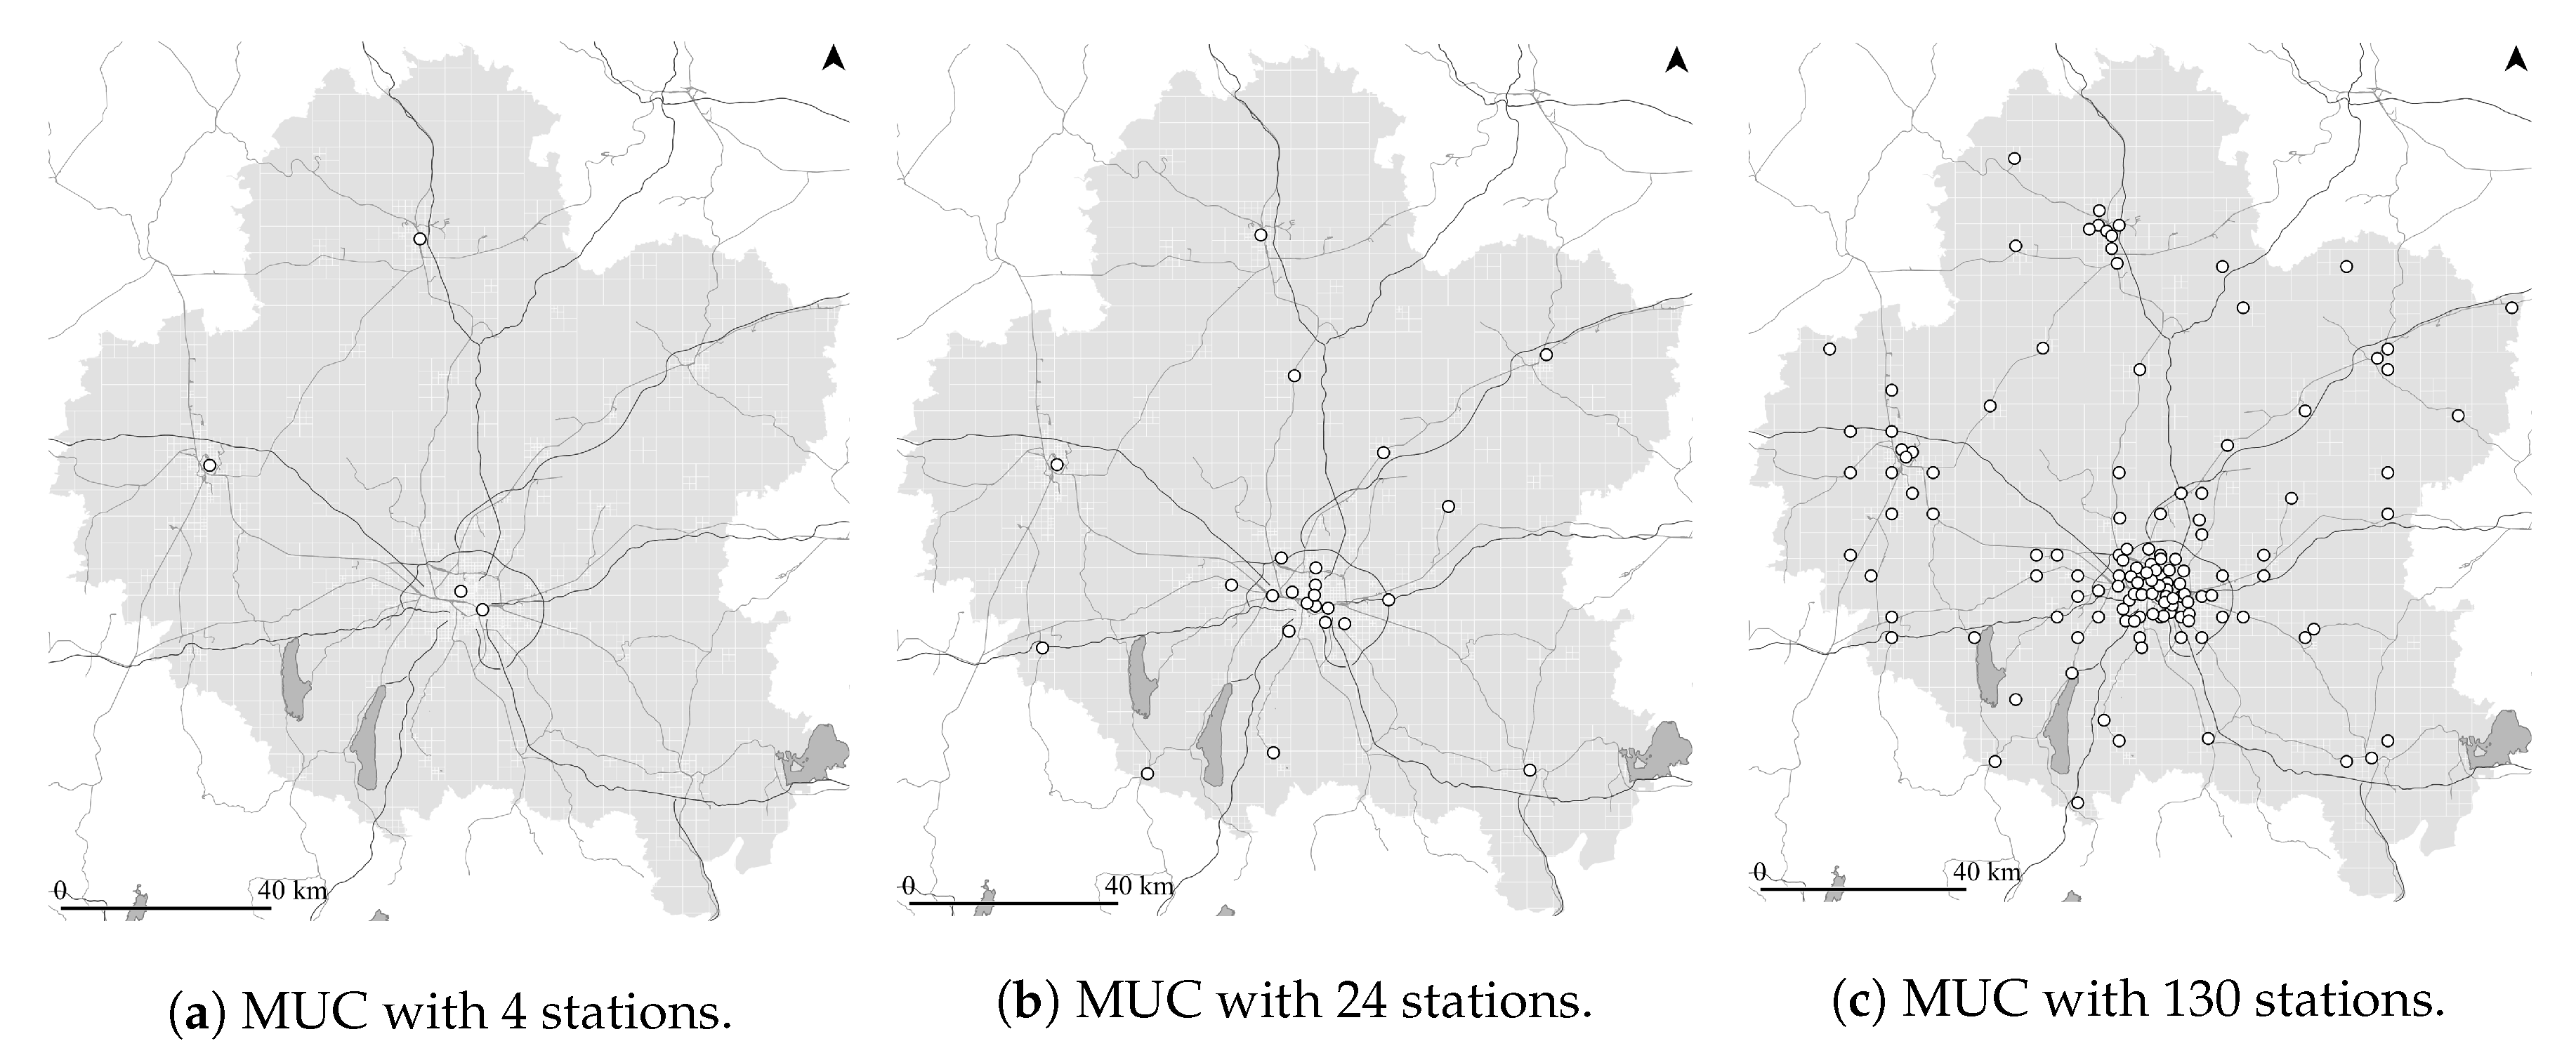
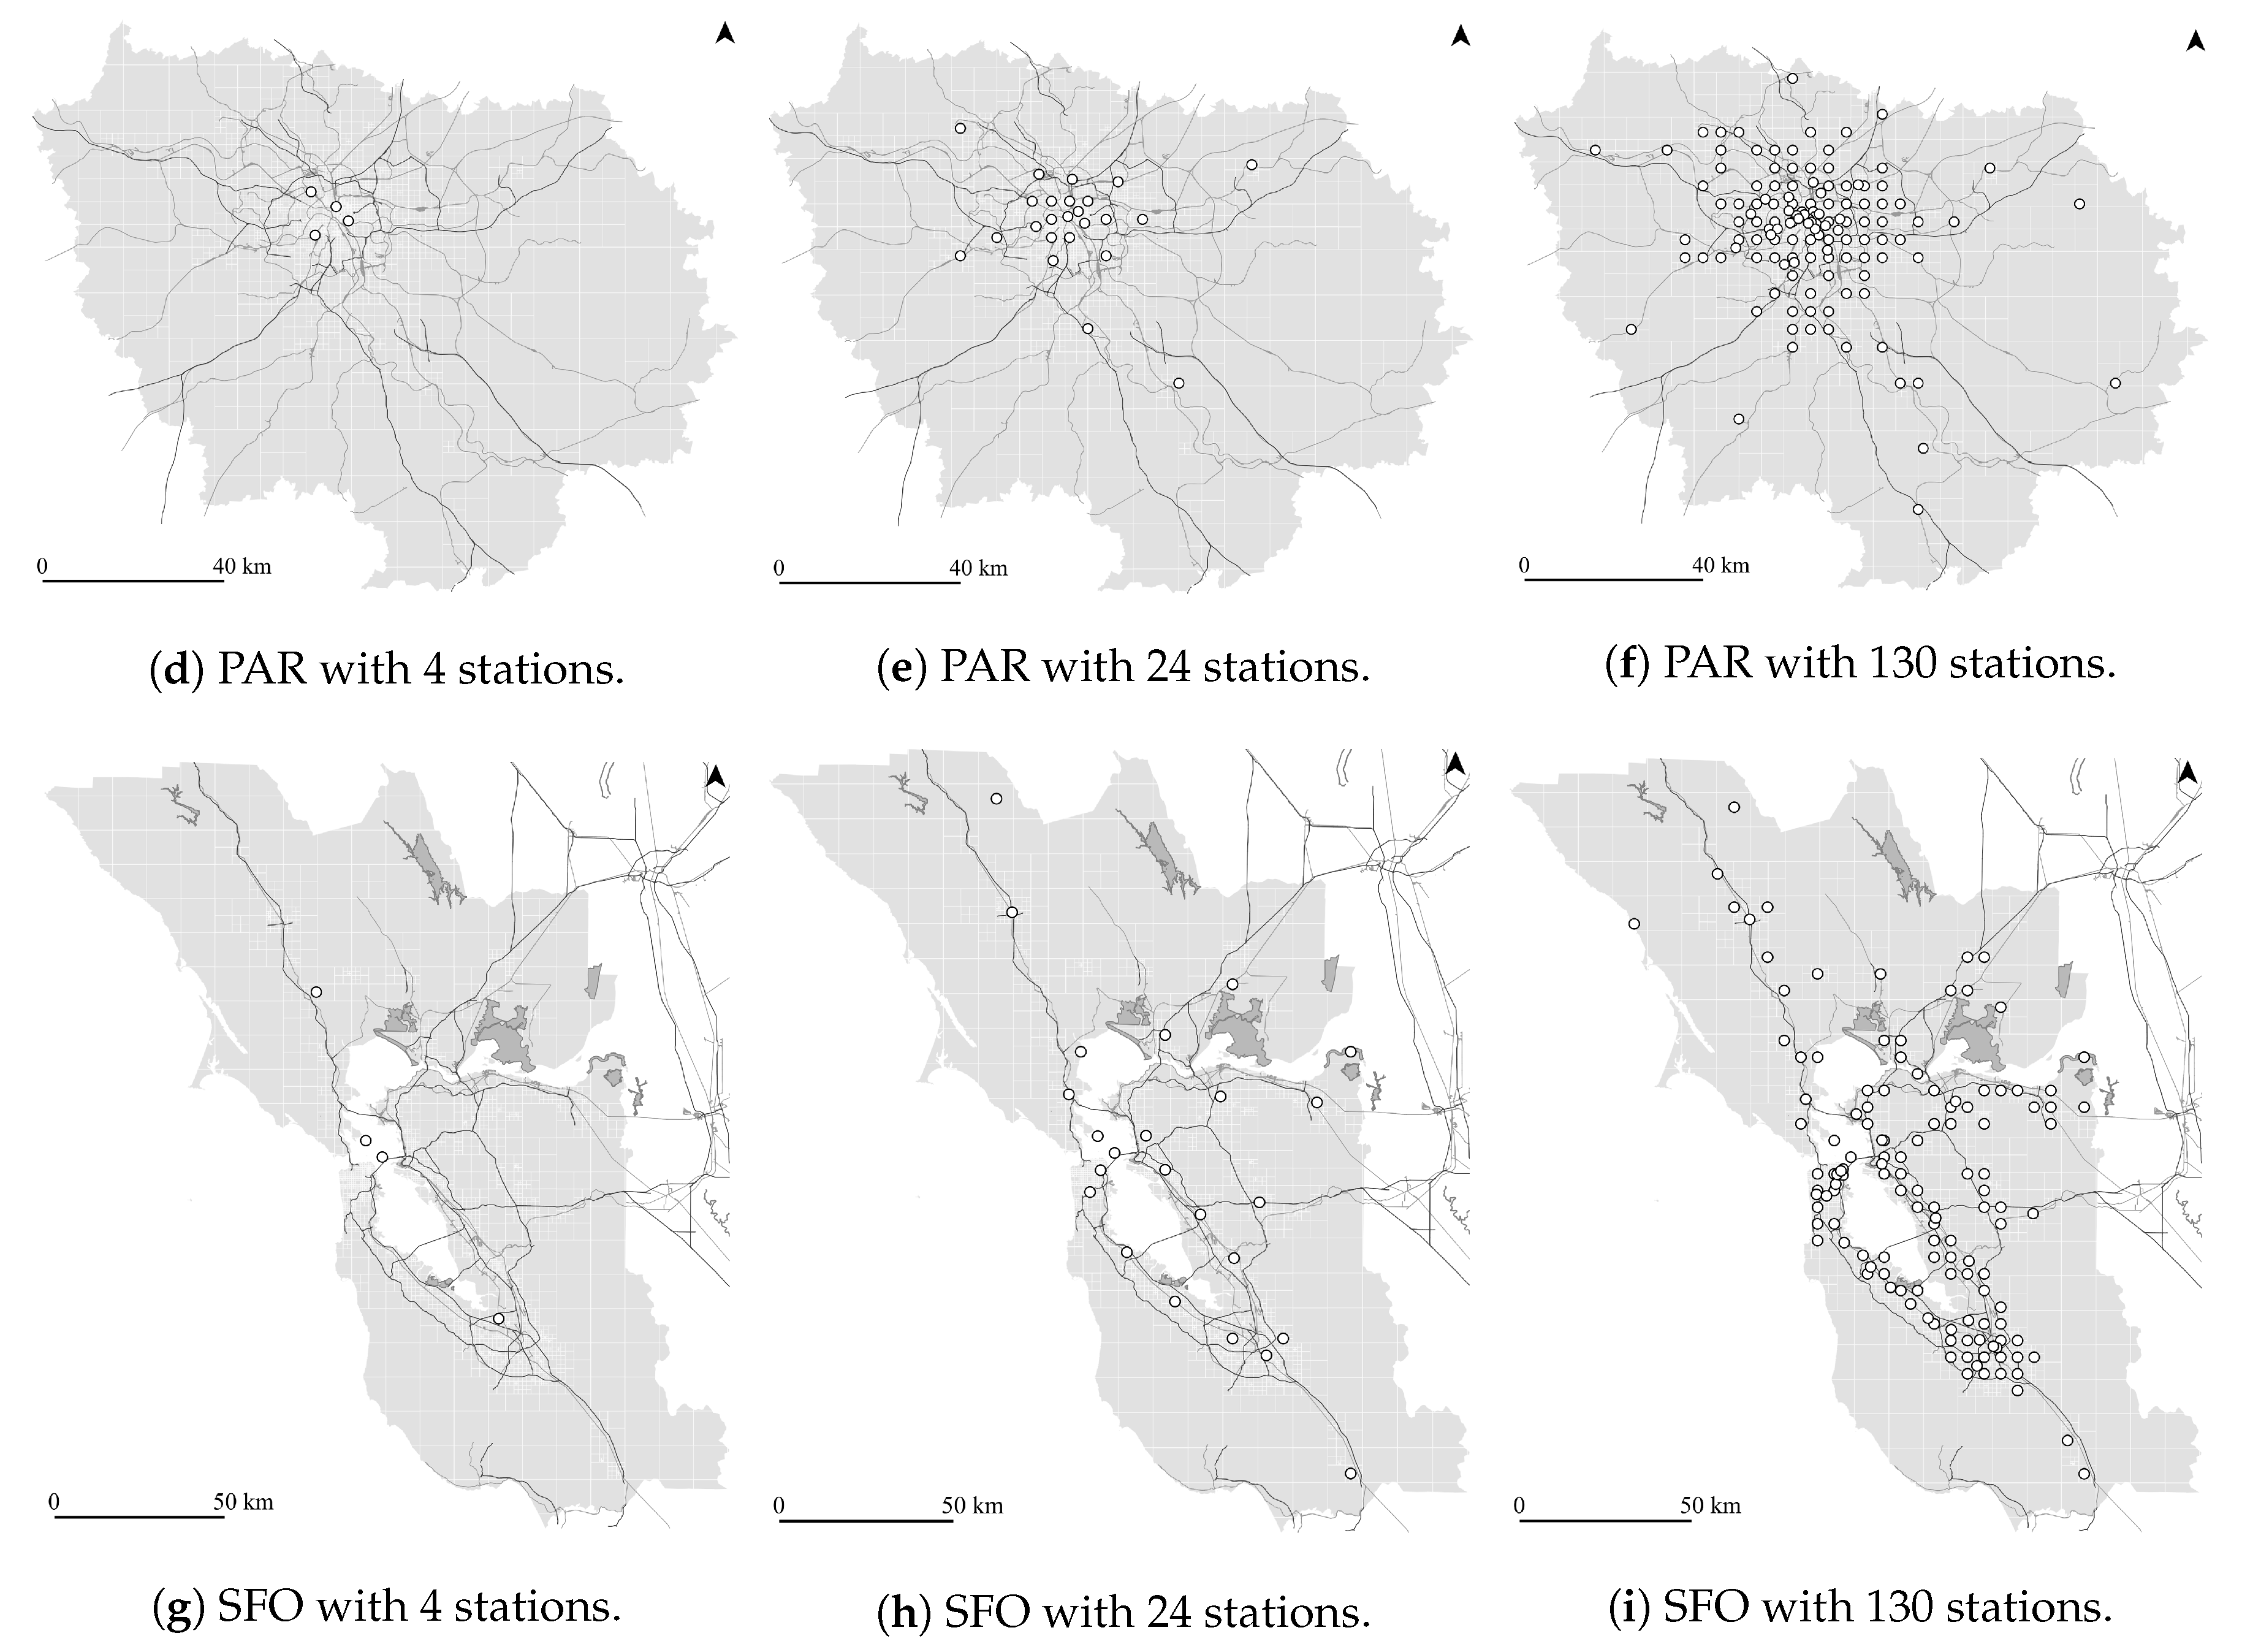
3.2.2. Station Placement
Arellano [
16] presented the application of an impedance minimization location–allocation algorithm for the automated placement of UAM stations for a given study area, which has been adapted and applied for this study. Similar to that approach, the location-allocation algorithm was used in iterations with an increasing number of desired UAM stations, defined to be 4, 8, 24, 76, and 130. These UAM station numbers were chosen to ensure comparability of this study with existing literature that assumed a relatively low number of UAM stations (e.g., [
17,
19]) as well as studies with more numerous UAM stations (e.g., [
5,
16]). In contrast to Arellano [
16], who gathered expert judgement within a Delphi process to create an artificial location suitability weight, this study uses each zone’s aggregated, normalised, and densified number of motorized trip origins and destinations as the single demand weight for station allocation.
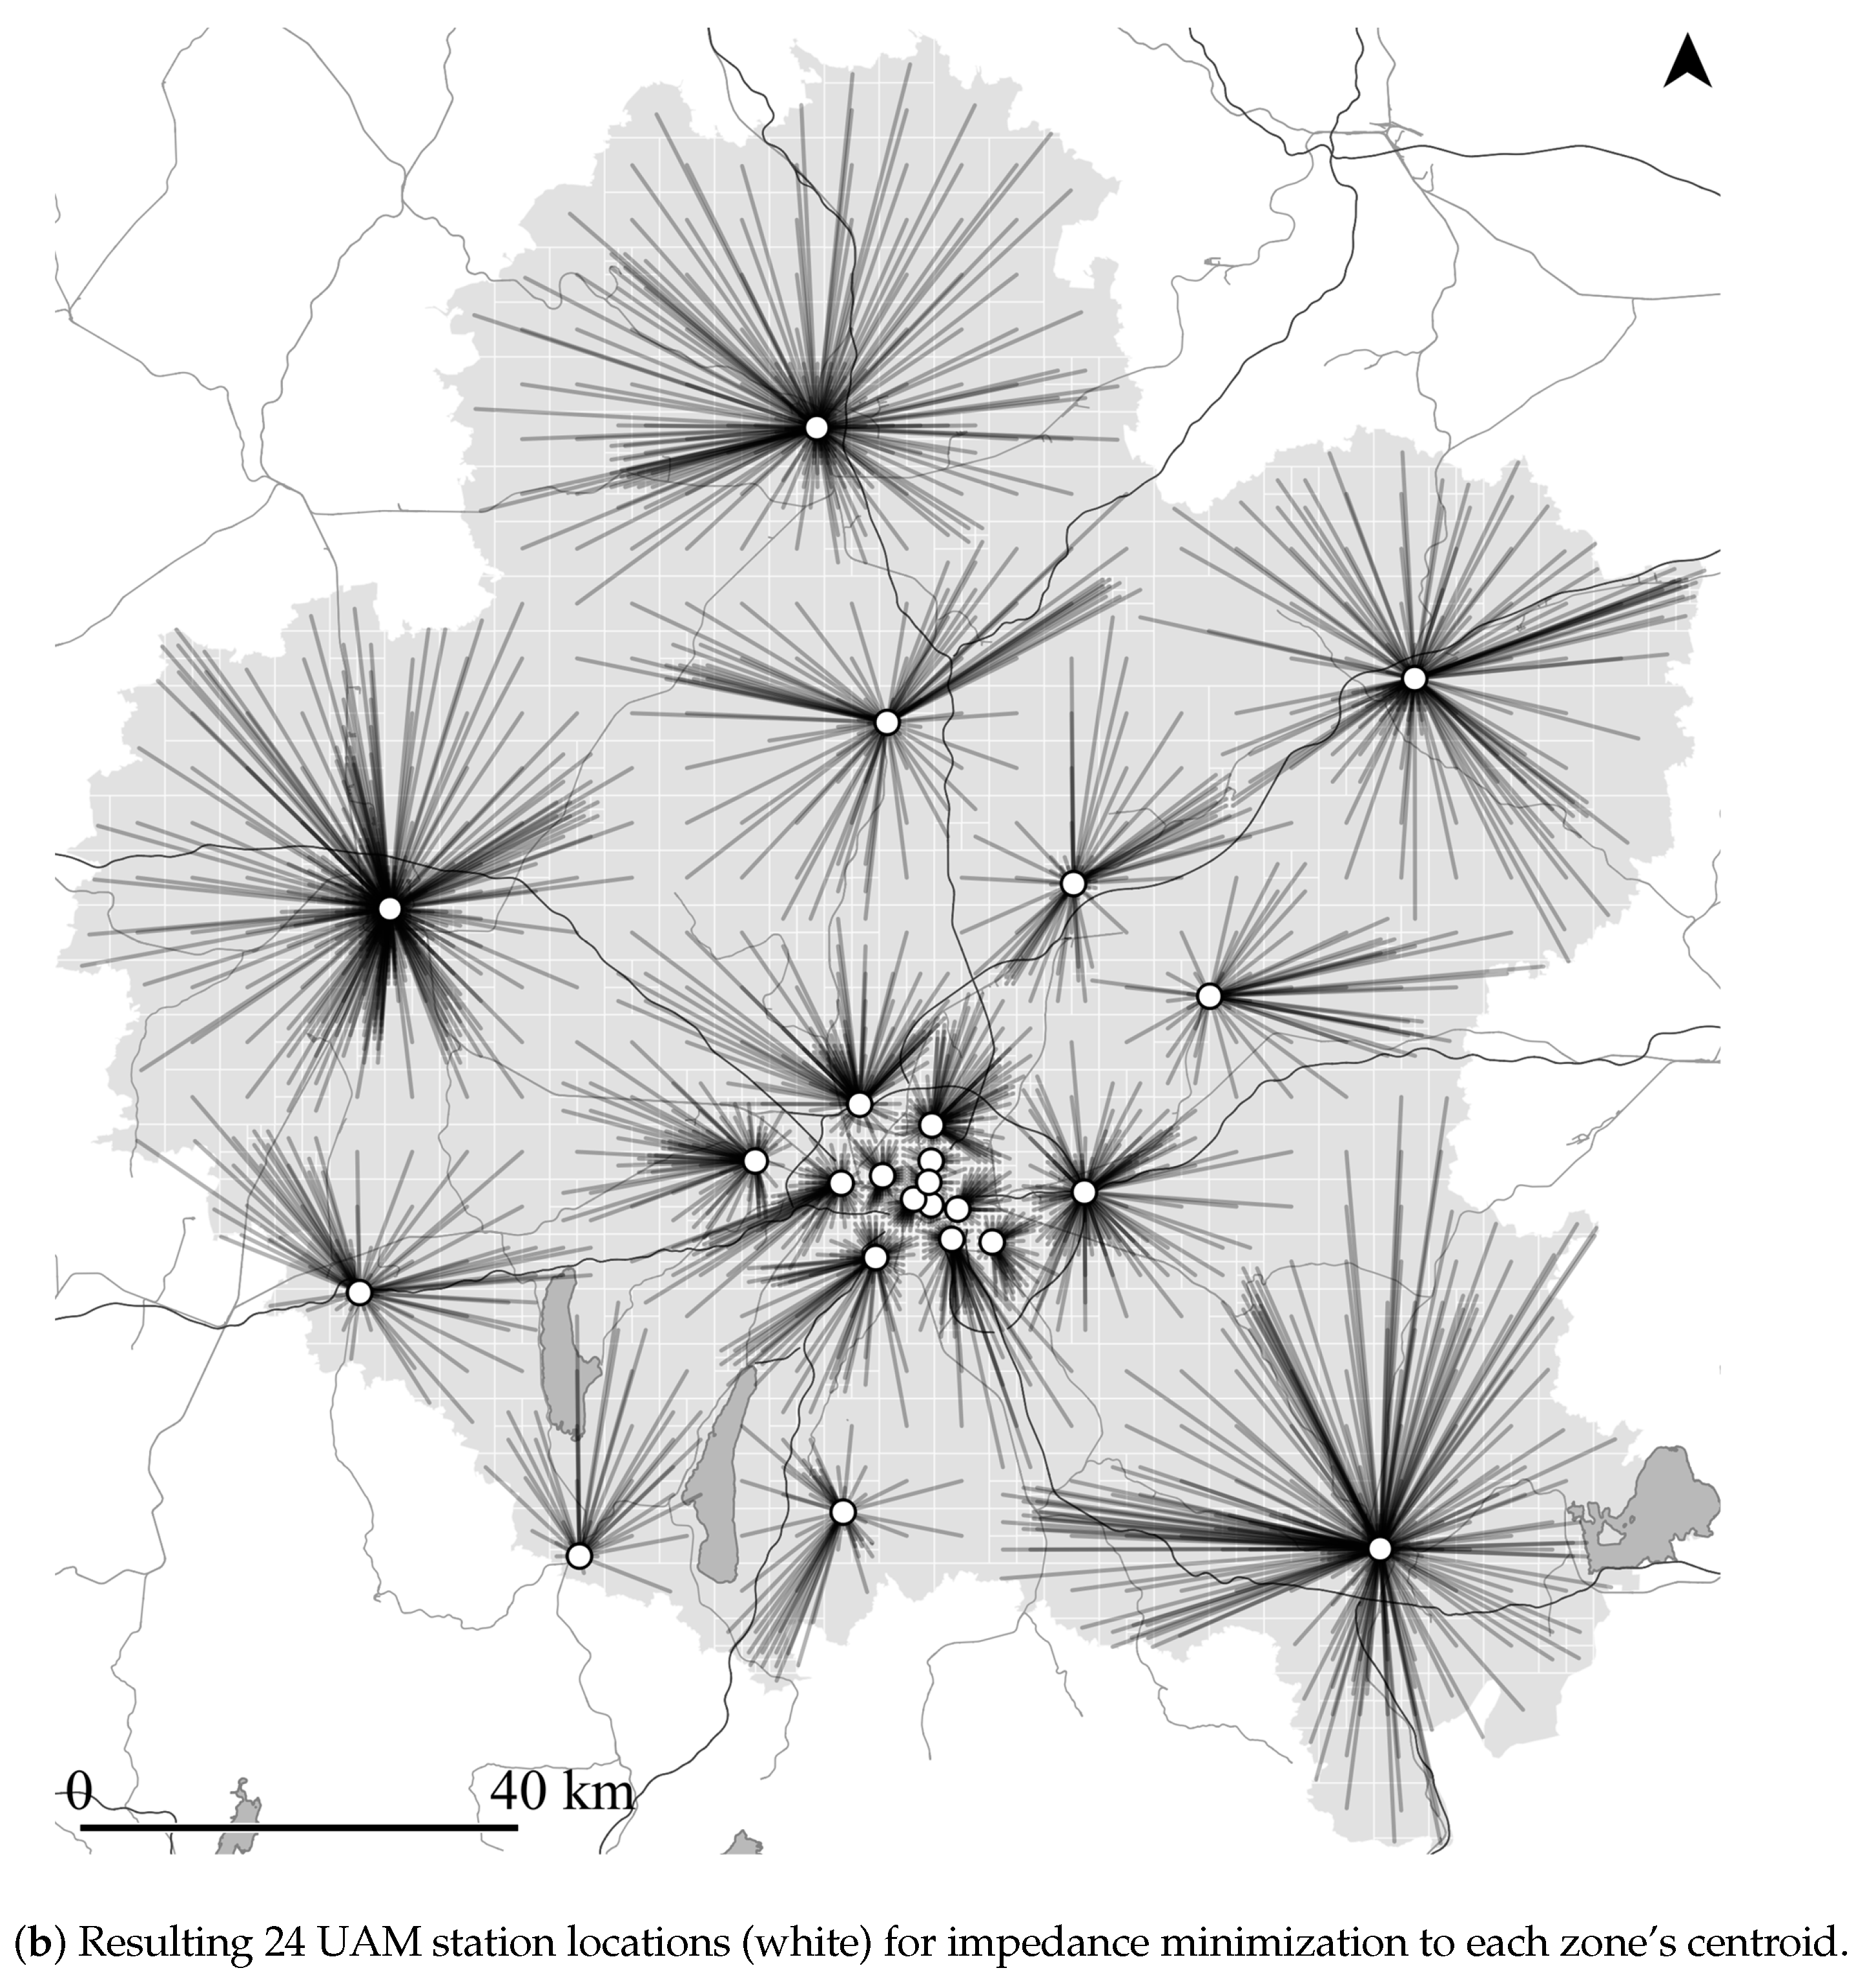
As potential UAM station locations, out of which the algorithm derives the pre-defined number of stations that—in total—minimizes travel time impedance, evenly-spaced grid points (see [
16]) and manually-placed potential locations by local experts (see, e.g., [
5,
10]) have been combined, as illustrated by
Figure 2a. These combined points serve as the input for the station placement algorithm. For each study area, a local expert has been asked to manually place between 50 and 150 potential UAM station locations based on their knowledge of the area with regard to major transportation hubs (e.g., airports and train stations), major points of interest (e.g., tourist attractions), and major commuter destinations (e.g., company headquarters). The grid point spacings have then been set so that the total number of potential station locations per study area does not exceed a given software limit of 1000 points, resulting in a grid point spacing of 4 km for MUC and PAR, and 5 km for SFO.
Figure 2b shows one result of the impedance minimizing location–allocation algorithm for MUC with 24 stations. The translucent black lines connect all zones’ centroids (i.e., weighted demand points) to the algorithmically-selected, impedance-minimizing UAM station locations (white). See
Appendix A for illustrations of each scenario’s potential input and selected output locations for 4, 24, and 130 UAM stations.
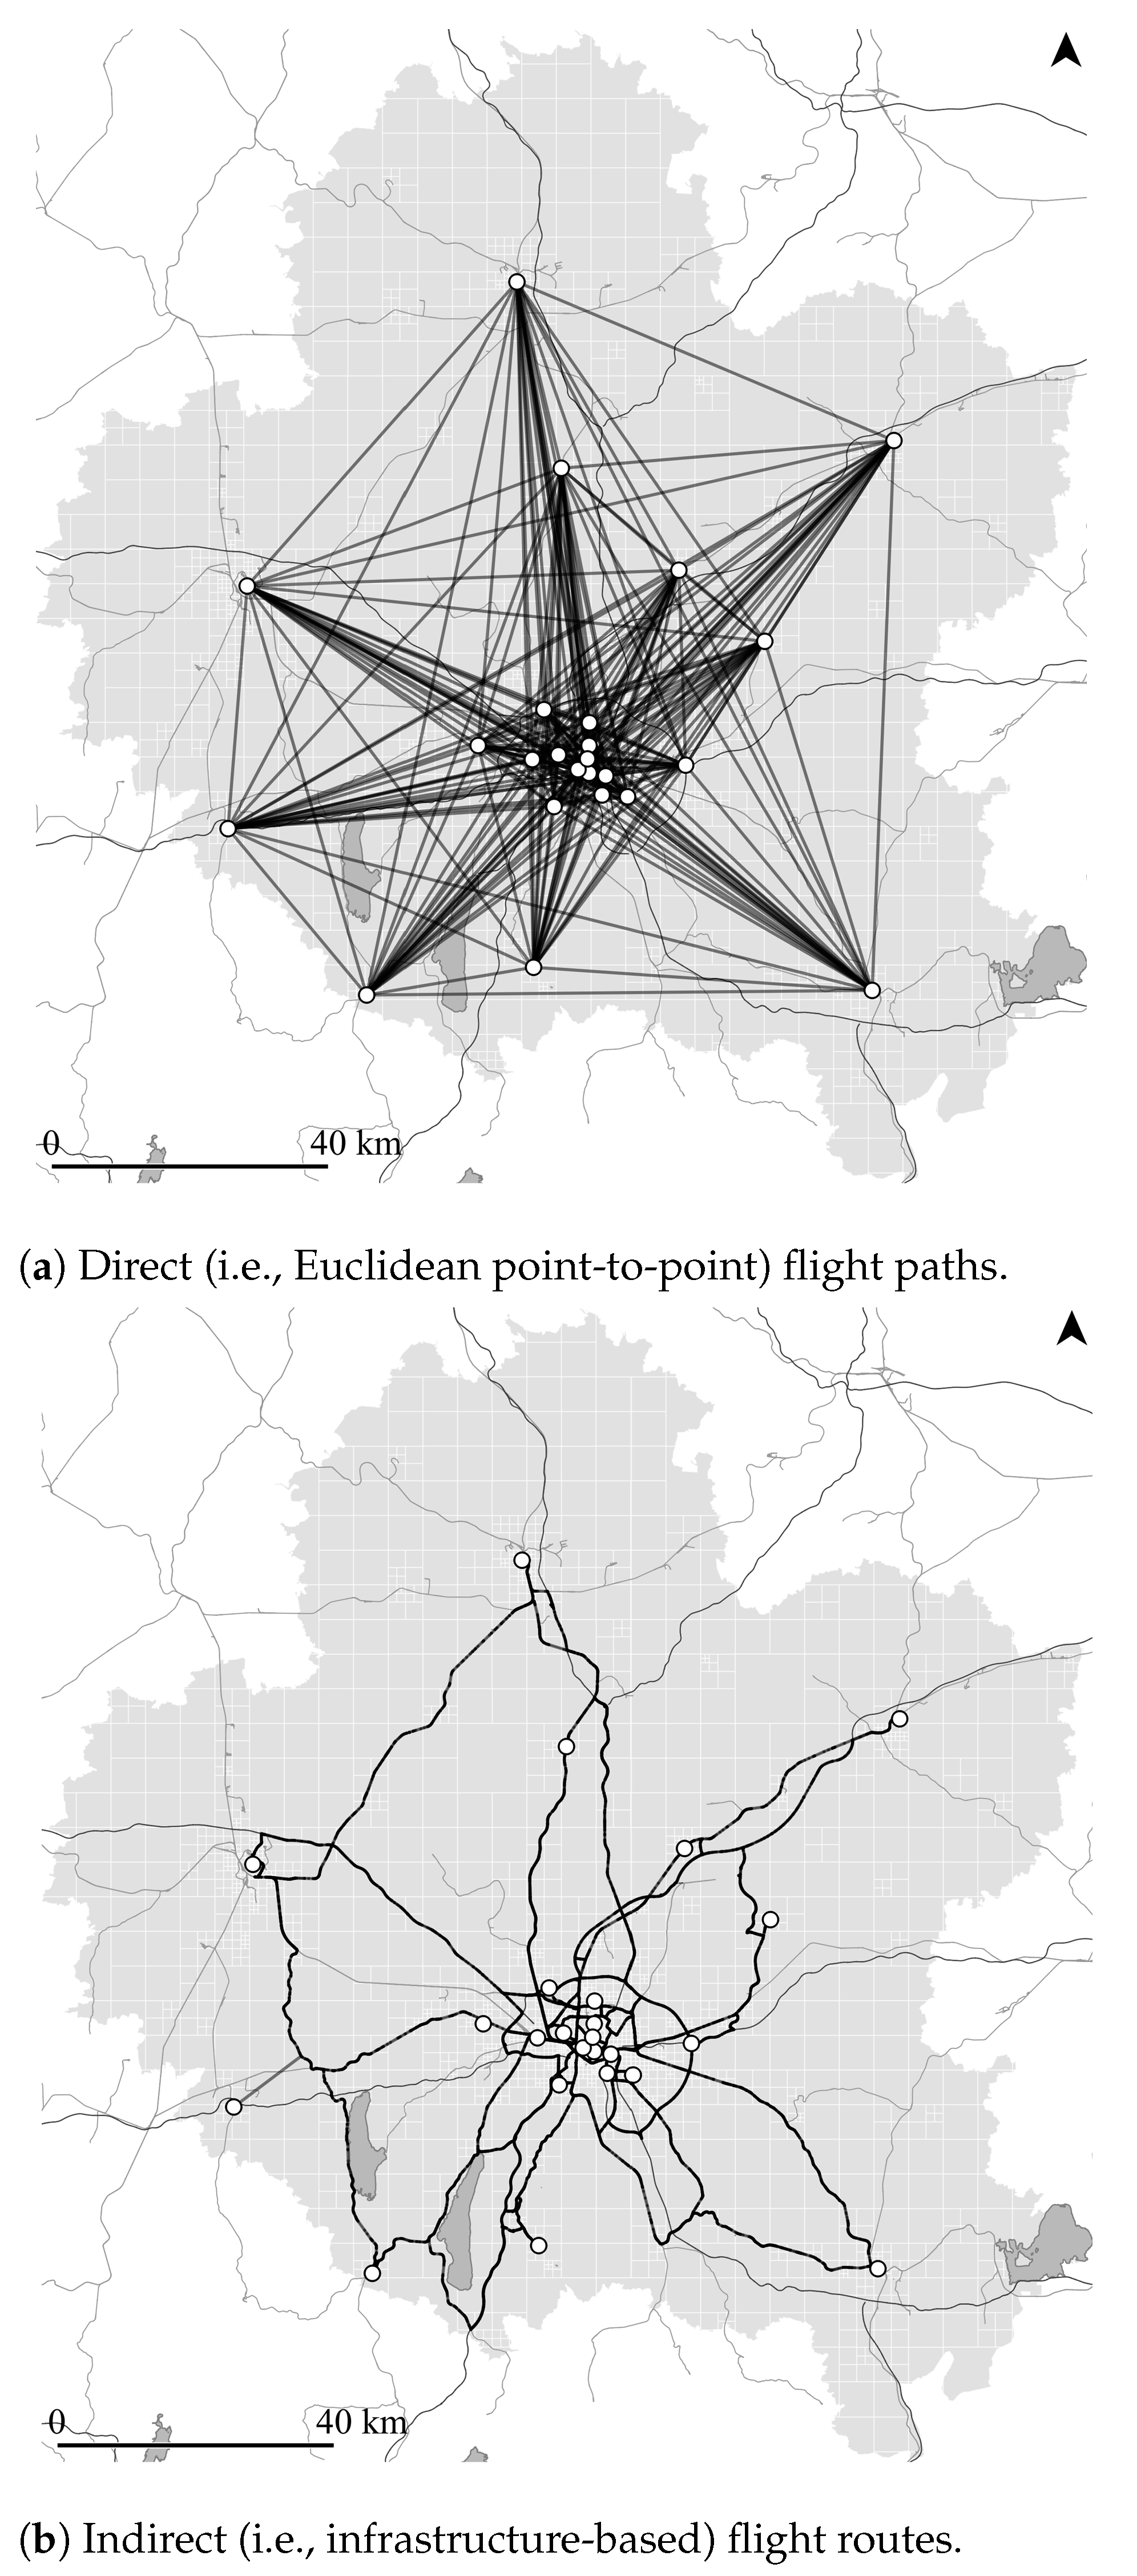
3.2.3. Flight Path Routing
Numerous UAM studies (e.g., [
8,
10,
16]) assume Euclidean, i.e., straight-line, flight distances in their analyses. To compensate for in-flight route deviation and for real-life navigation of helicopters along existing ground infrastructure (cf. [
11,
47]), a few studies have started to include static detour factors to all Euclidean flight distances (see, e.g., [
5]). However, using Euclidean connections (as exemplarily illustrated in
Figure 1a) led to “straight station-to-station routes that often traversed over population” ([
16], p. 92). Vascik and Hansman [
11,
48] examined possible UAM flight constraints for Los Angeles, CA, USA, and identified overflight rules that UAM operation will probably have to adhere to.
In order to identify the impact of flight path routing and mimic urban, real-life, low-altitude overflight—comparable to today’s helicopter operation—an exploratory ground-infrastructure-based approach for flight route definition is proposed. Instead of connecting all UAM stations via Euclidean flight paths, ground-based transport infrastructure is used as a proxy for overflight, where larger infrastructure with high noise emissions and traffic capacity is preferred for UAM overflight. For that, road and rail infrastructure data from OpenStreetMap have been combined and categorized into three groups from high to low capacity: (1) regional and high-speed rail, motorways, and primary roads, (2) secondary and tertiary roads, and (3) all remaining road and rail infrastructure.
The combined ground-transport infrastructure layer was then used as the network for automated path finding between all UAM station locations for each scenario and all numbers of stations. The categorisation was the basis for defining an artificial path finding cost parameter which replaces path length. Thus, instead of the shortest paths, the results are paths that predominately follow high-capacity road and rail infrastructure, as illustrated in
Figure 1b for MUC with 24 station locations. After initial tests with various category weights (see [
49]), a weight (i.e., cost) factor of three has been applied for this study.
3.3. Travel Time Calculation
3.3.1. Eligibility Criteria
Two subsequent conditions have been used to define whether or not a base scenario trip is eligible for UAM usage. First, only motorized trips are considered as potentially UAM-eligible. For non-motorized trips, i.e., walk or bike, UAM as a mode of transportation is not assumed to be a viable substitution. This leaves 67% of trips in MUC, 59% in PAR, and 86% in SFO potentially eligible for UAM usage given this first condition of motorization. However, the vast majority of those motorized trips are rather short. The median and 3rd quartile of each scenario’s Euclidean motorized trip distances are 6 km and 10 km for MUC, 5 km and 10 km for PAR, and 6 km and 14 km for SFO—showing that only a few motorized trips are long-range.
The second subsequent condition is based on the availability of UAM stations within a dynamic search radius around a trip’s origin and destination. This dynamic search radius for UAM stations has been derived from a study by (Pukhova [
21], pp. 34–35) where “the sum of the [Euclidean] distances to and from UAM stations should not be longer than one third of the total trip length”, with the total trip length denoting the trip’s Euclidean distance. This condition limits UAM use to trips where a significant part of the trip would be served by UAM vehicles, i.e., flying. However, an initial analysis showed that the constraint as presented by Pukhova [
21] seems too restrictive. Thus, an alternative implementation has been used in which the maximum-allowed access and egress distances—each individually—may constitute up to one third of the total trip length. Combined, the summed distance of a UAM trips’ access and egress legs can make up two-thirds of the overall trip length within this study.
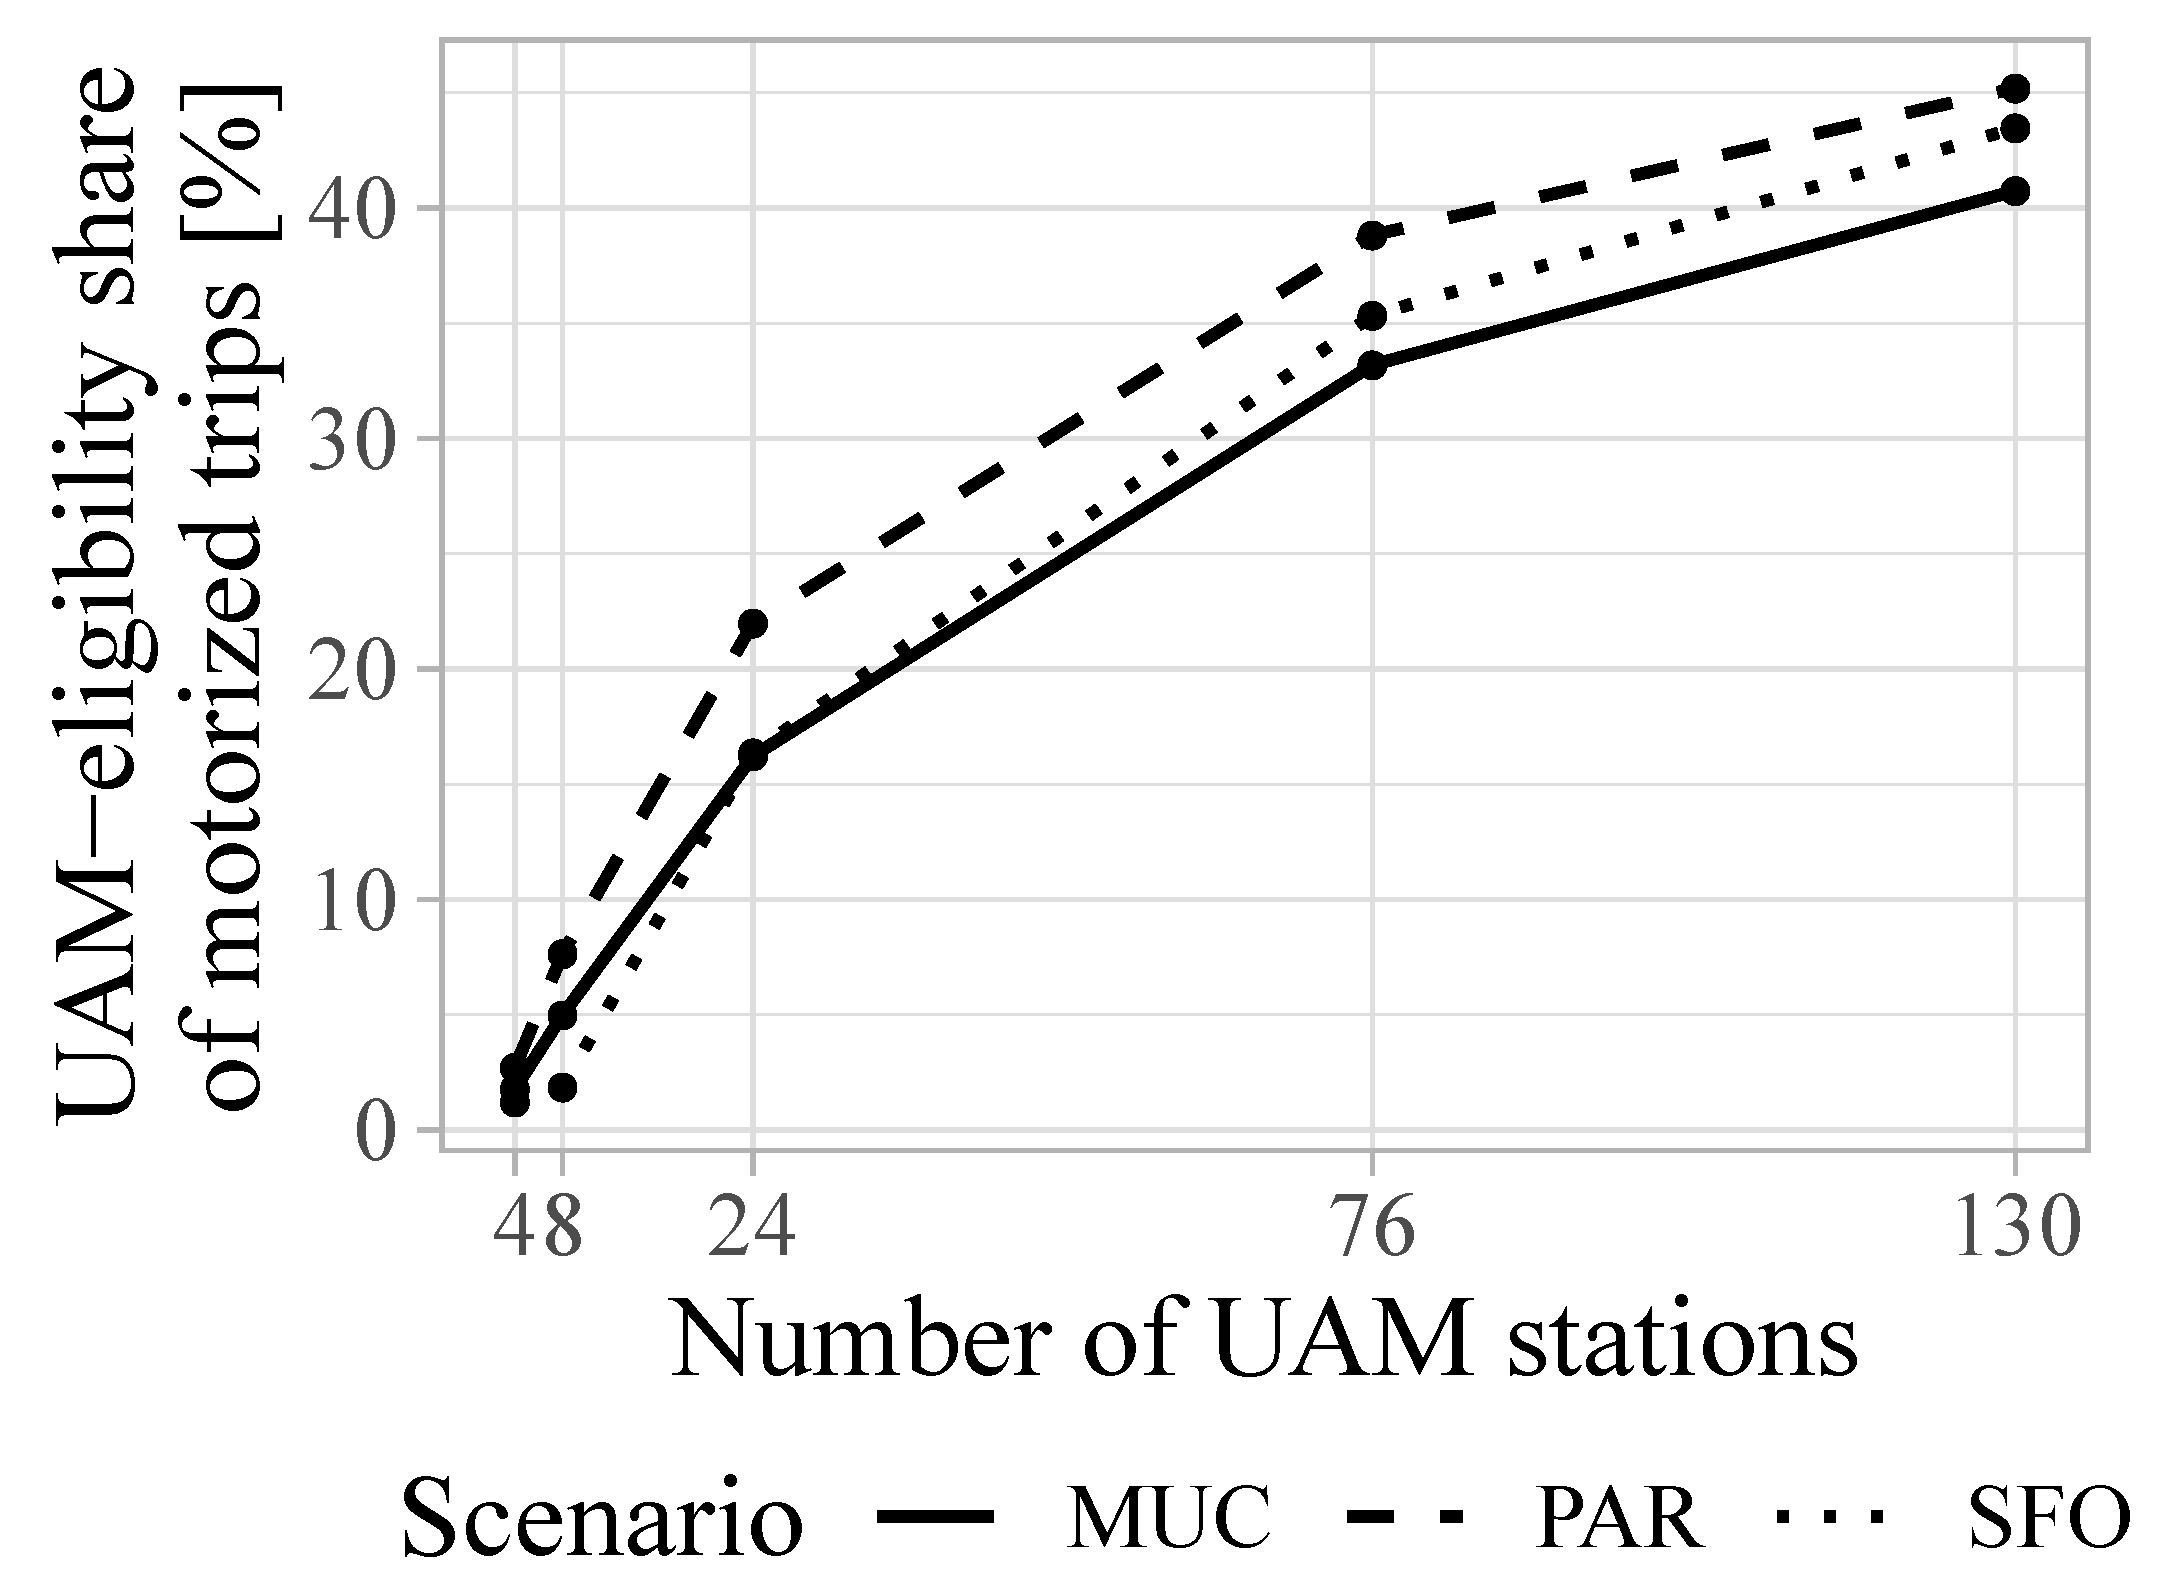
Figure 3 illustrates the shares of UAM-eligibility for motorized trips per scenario based on the station accessibility conditions for various UAM station numbers. It is evident that the share of UAM-eligible motorized trips heavily relies on the number and distribution of UAM stations within the study area, with higher station numbers providing larger UAM-eligibility shares. An additional analysis of the share of motorized trips that are UAM-eligible over Euclidean distance showed another trend: longer trips (i.e., trips with Euclidean distance of more than 50 km) experience higher shares of UAM-eligibility. Thus, even though the overall shares of motorized trips that are UAM-eligible remain below 50% for all scenarios, longer trips are generally included, which is important, since those trips are expected to benefit most from the introduction of UAM.
3.3.2. Traffic Congestion
For this study, traffic congestion affects each mode (i.e., car, PT, and UAM) in different ways. For car travel times, previously-run MATSim simulations of each scenario provided the base traffic- and congestion-levels, which were then taken into account for calculating car travel times. Furthermore, MATSim’s car travel times do not include access/egress or parking search times. Travel times using PT do include public transport station access and egress walks, potential waiting times for transfers (e.g., when changing from bus to train), and are primarily schedule-based. Travel times for UAM combine the workings of car and PT, as both modes—as well as walking—are available for UAM station access/egress. Total UAM trip times include access, flight, and egress legs, as well as static waiting, check-in, boarding, and deboarding times. These passenger process times are summarized under the terms pre- and post-flight processes. For each trip, the combination of two UAM stations and access and egress modes that result in the shortest overall UAM trip time was calculated as each trip’s potential UAM option.
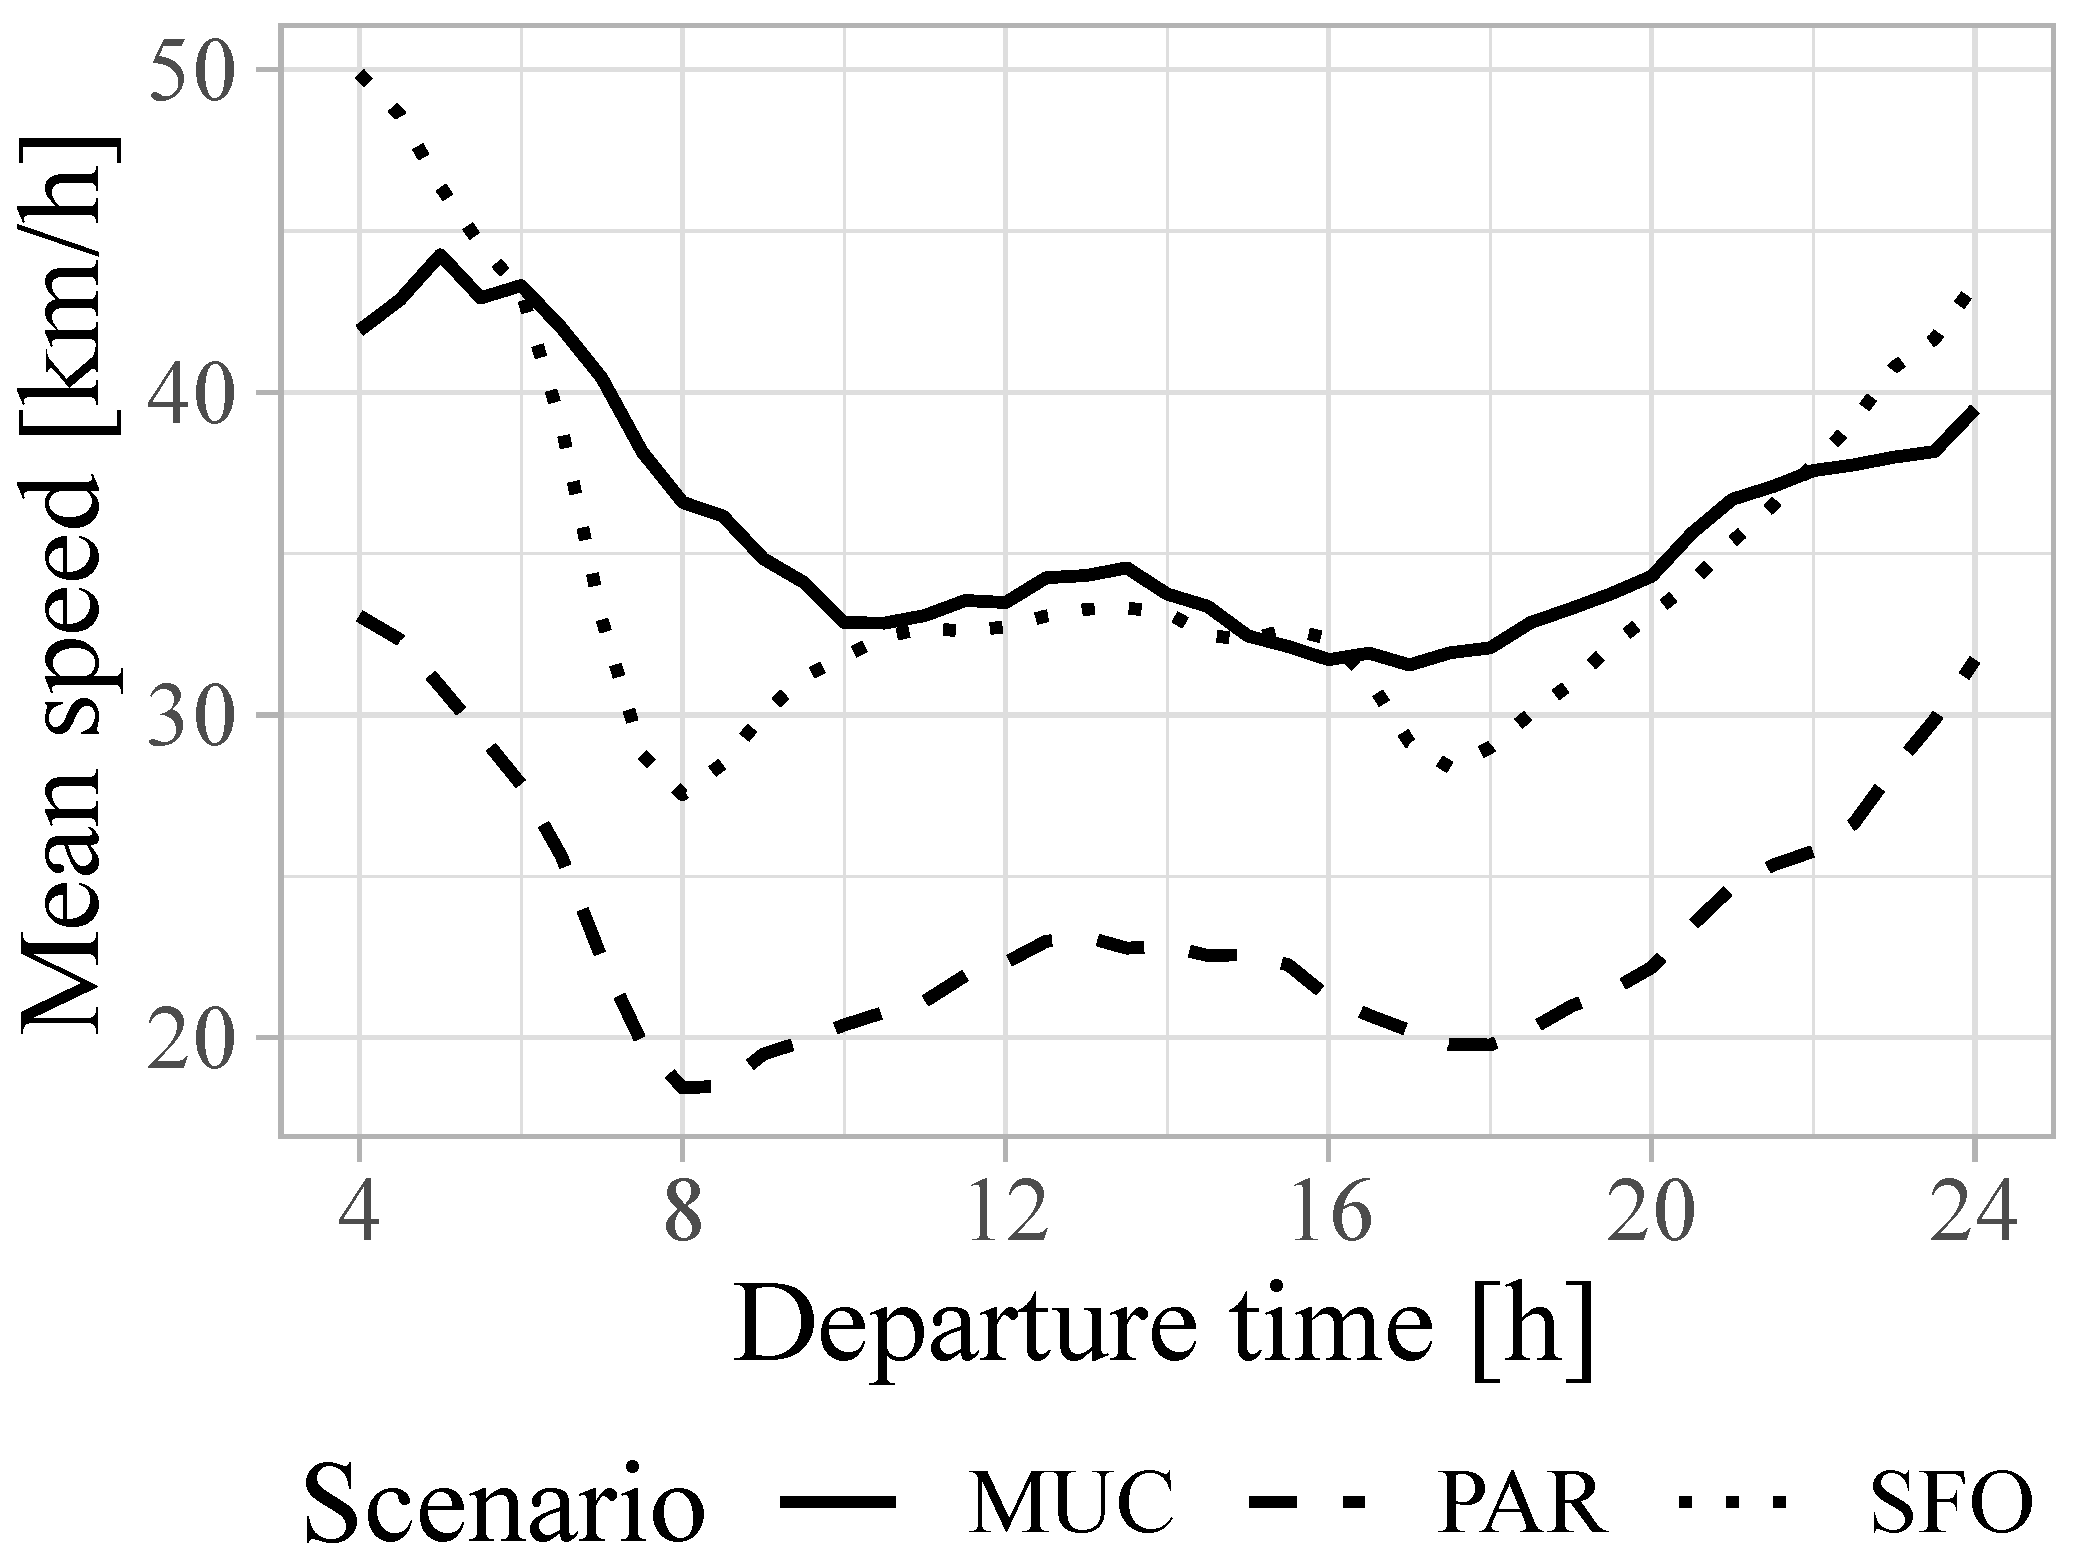
Figure 4 illustrates the mean door-to-door car speed developments during the simulated day per scenario. Those speeds are derived by dividing the door-to-door trip Euclidean distance by the trip’s total travel time and averaging them based on a 30 min time window with regard to the trip’s departure time. The illustrated mean speeds for car show distinct traffic peak times. For latter categorization of peak and off-peak trips, the 75th percentile of car mean speeds was used as a threshold per scenario, resulting in peak times of 10:00 a.m.–11:30 a.m. and 3:00 p.m.–6:30 p.m. for MUC, 7:30 a.m.–9:30 a.m. and 4:30 p.m.–7:30 p.m. for PAR, and 7:30 a.m.–10:00 a.m. and 4:30 p.m.–7:00 p.m. for SFO.
3.3.3. UAM Parameters and Base Case
Variations of four different UAM system parameters have been applied: (1) number of UAM stations, (2) UAM vehicle cruise speed, (3) total processing time, and (4) type of flight routes. As previously mentioned, the numbers of UAM stations were 4, 8, 24, 76, and 130 stations, distributed within each study area. Flight speeds have been varied between 60 and 300 km/h in steps of 20 km/h based on a VTOL vehicle overview by (Shamiyeh et al. [
50], Table 1, p. 3). Per trip, a total of 120 s has been added to account for take-off and landing of the UAM vehicle. In addition to the duration for VTOL operations, total passenger process time variations were included with 0, 15, and 30 min. In order to facilitate understanding, a distinct UAM base case has been defined. The base case aims at representing a realistic—albeit optimistic—case for potential future on-demand UAM operations with the following parameters:
UAM station count: 24 stations
UAM vehicle cruise speed: 180 km/h
UAM total process time: 15 min
UAM VTOL duration: 120 s in total
UAM flight routes: direct (i.e., Euclidean) flight paths
4. Results
4.1. Travel Time Savings Ratio
For comparing travel times between UAM and the trip’s respective original, ground-based, motorized mode (i.e., car or PT), the following ratio of change in trip travel time is being utilized (Equation (
1)):
where the ratio of travel time savings (
) is the relative difference between a trip’s respective ground-based travel time (
) and that trip’s potential UAM travel time (
)—which comprises access, egress, flight, and process times. Positive travel time savings ratios (
) do, thus, denote that the calculated UAM trip time is shorter than the original trip’s travel time, whereas a negative ratio indicates that UAM would offer no travel time savings.
4.1.1. Motorized Trip Shares
Assuming UAM-usage given at least a minimal travel time savings (i.e., for
), UAM motorized trip shares for MUC, PAR, and SFO are 3%, 13%, and 7% under base-case parameters. There is indication that these UAM’s motorized trip shares are largely drawn from trips that originally were using public transport. For MUC, 49% of UAM trips were originally PT trips (while PT makes up only 9% of motorized trips), 74% for PAR (PT has a motorized trip share of 40%), and 40% for SFO (PT has a motorized trip share of 8%). UAM’s motorized trip share, given
, however, varies greatly with changes in UAM parameters.
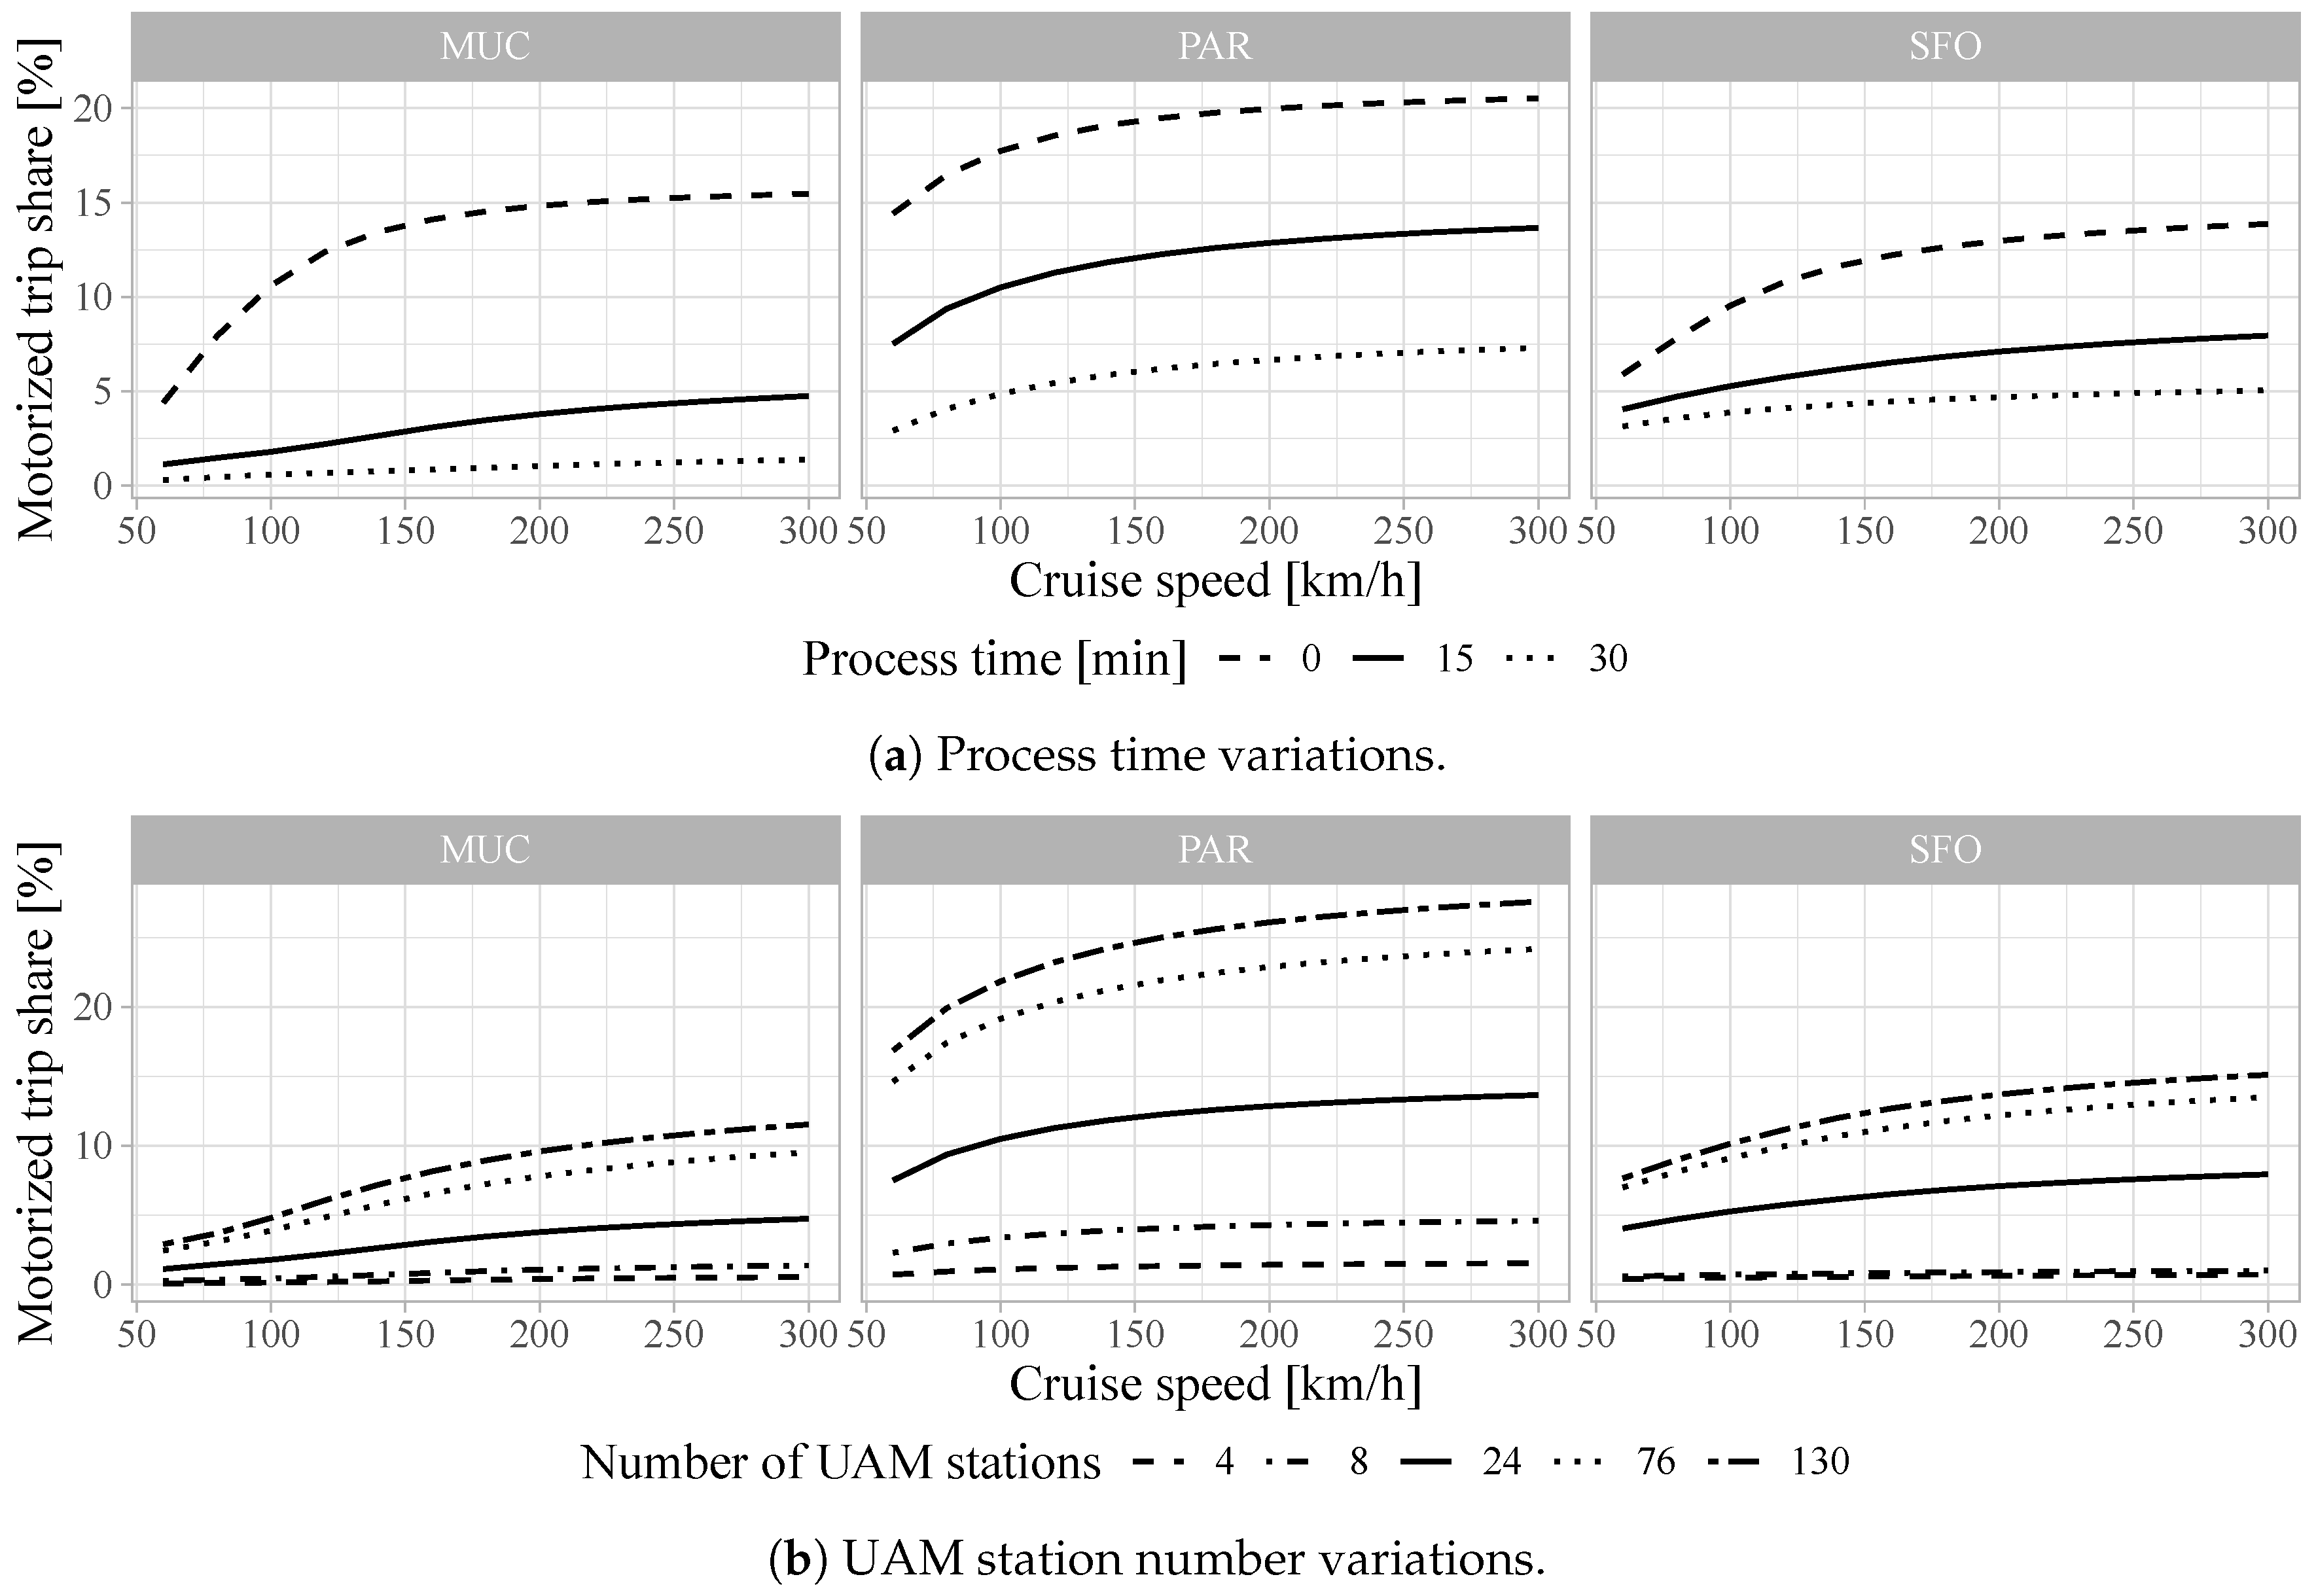
Figure 5a illustrates the motorized trip share development depending on UAM’s assumed cruise flight speed and process time for 24 UAM stations. At the base-case cruise flight speed of 180 km/h, a motorized trip share increase of 3 percentage points (pp) for a decrease in process time from 30 to 15 min and, from there, an additional 11 pp increase for no process times can be observed for MUC. The same reductions in process time lead to share increases of 6 pp and 11 pp for PAR and 2 pp and 6 pp for SFO at base-case cruise speed.
Figure 5b, on the other hand, illustrates the motorized trip share development depending on UAM’s assumed cruise flight speed and number of UAM stations. Again, at base-case cruise flight speed, the respective motorized trip shares of UAM are 0.4%, 1%, 3%, 7%, and 9% for 4, 8, 24, 76, and 130 stations for MUC; 1%, 4%, 13%, 22%, and 26% for PAR; and 0.6%, 1%, 7%, 12%, and 13% for SFO. Evidently, the share increase is largest when increasing the number of stations from 8 to 24 and again from 24 to 76—an increase from 76 to 130 stations only leads to a marginal increase in motorized trip share.
Figure 5a,b also illustrate the impact of UAM cruise flight speed on trip shares. With 24 stations and 15 min process time (base case), UAM’s motorized trip share increases from 1% at 60 km/h to 5% at 300 km/h for MUC, 8% and 14% for PAR, and 4% and 8% for SFO. The marginal motorized trip shares for flight speed increases between 60 to 180 km/h are 1.8, 4.8, and 2.5 times higher than those from flight speed increases from 180 to 300 km/h for MUC, PAR, and SFO, respectively.
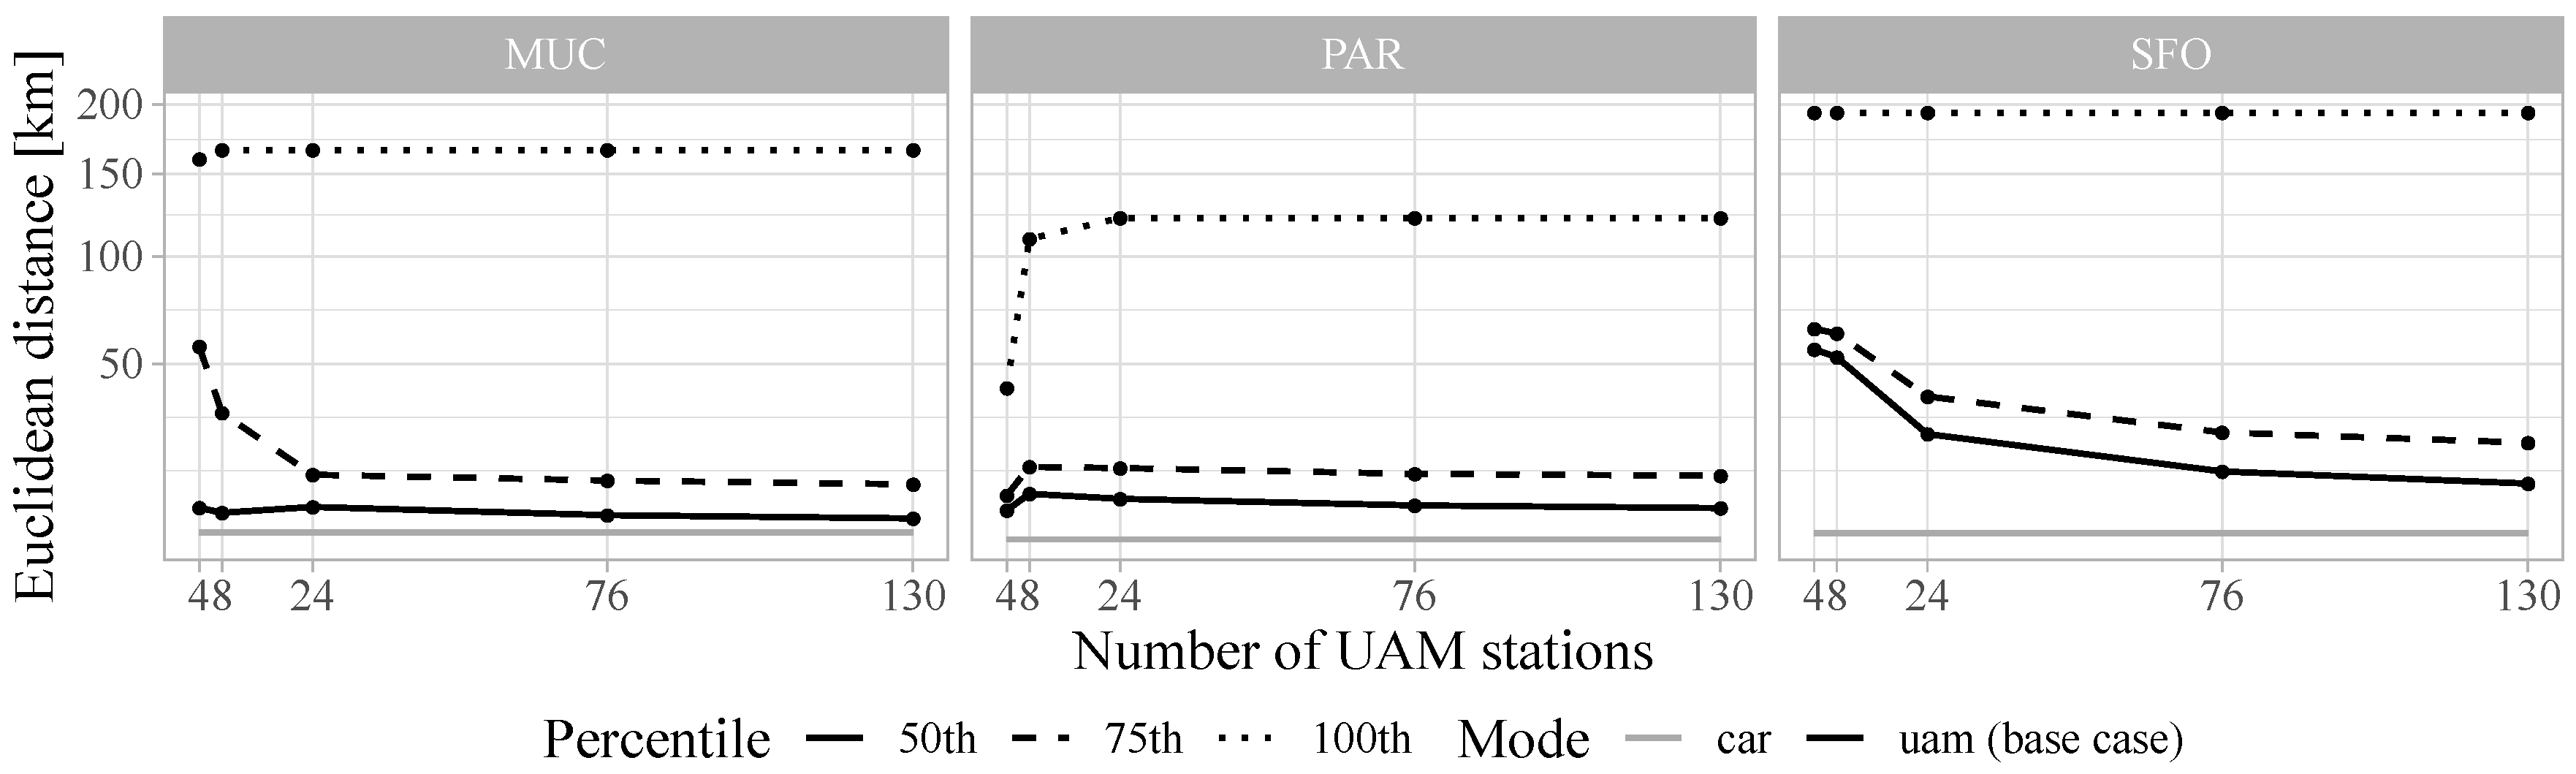
A slight impact on flight distances can also be observed from the number of stations.
Figure 6 illustrates the median (50th), upper quartile (75th), and maximum (100th percentile) Euclidean trip distances over station number for UAM (base case) usage given
. In general, for all three scenarios, the distributions of Euclidean trip distances per mode are heavily skewed towards very short trips. The median trip distances for car and PT are 5–6 km, except for PT in SFO, which has a median trip distance of 10 km. Similarly, the upper quartiles are between 9 and 13 km, which SFO’s upper PT quartile being 23 km. The vast majority of motorized trips are, thus, relatively short. UAM’s median trip distances are consistently higher, i.e., longer, than cars with 10, 11, and 27 km with 24 stations for MUC, PAR, and SFO, respectively.
An increase in number of stations leads to a slight decrease of median trip distance for MUC and PAR with a 19% and 14% drop when increasing the number of stations from 24 to 130. For SFO, a more substantial decrease of 46% can be observed. Most importantly, however, is that even the upper quartile is comparatively short with 16, 18, and 38 km for MUC, PAR, and SFO for 24 stations—indicating that the vast majority of potential UAM trips would be far below 50 km.
4.1.2. Sensitivity Analysis
As was already indicated by the change in motorized trip shares, the travel time savings ratios themselves are highly dependent on and vary greatly with the underlying UAM assumptions, such as the number of UAM stations or process time.
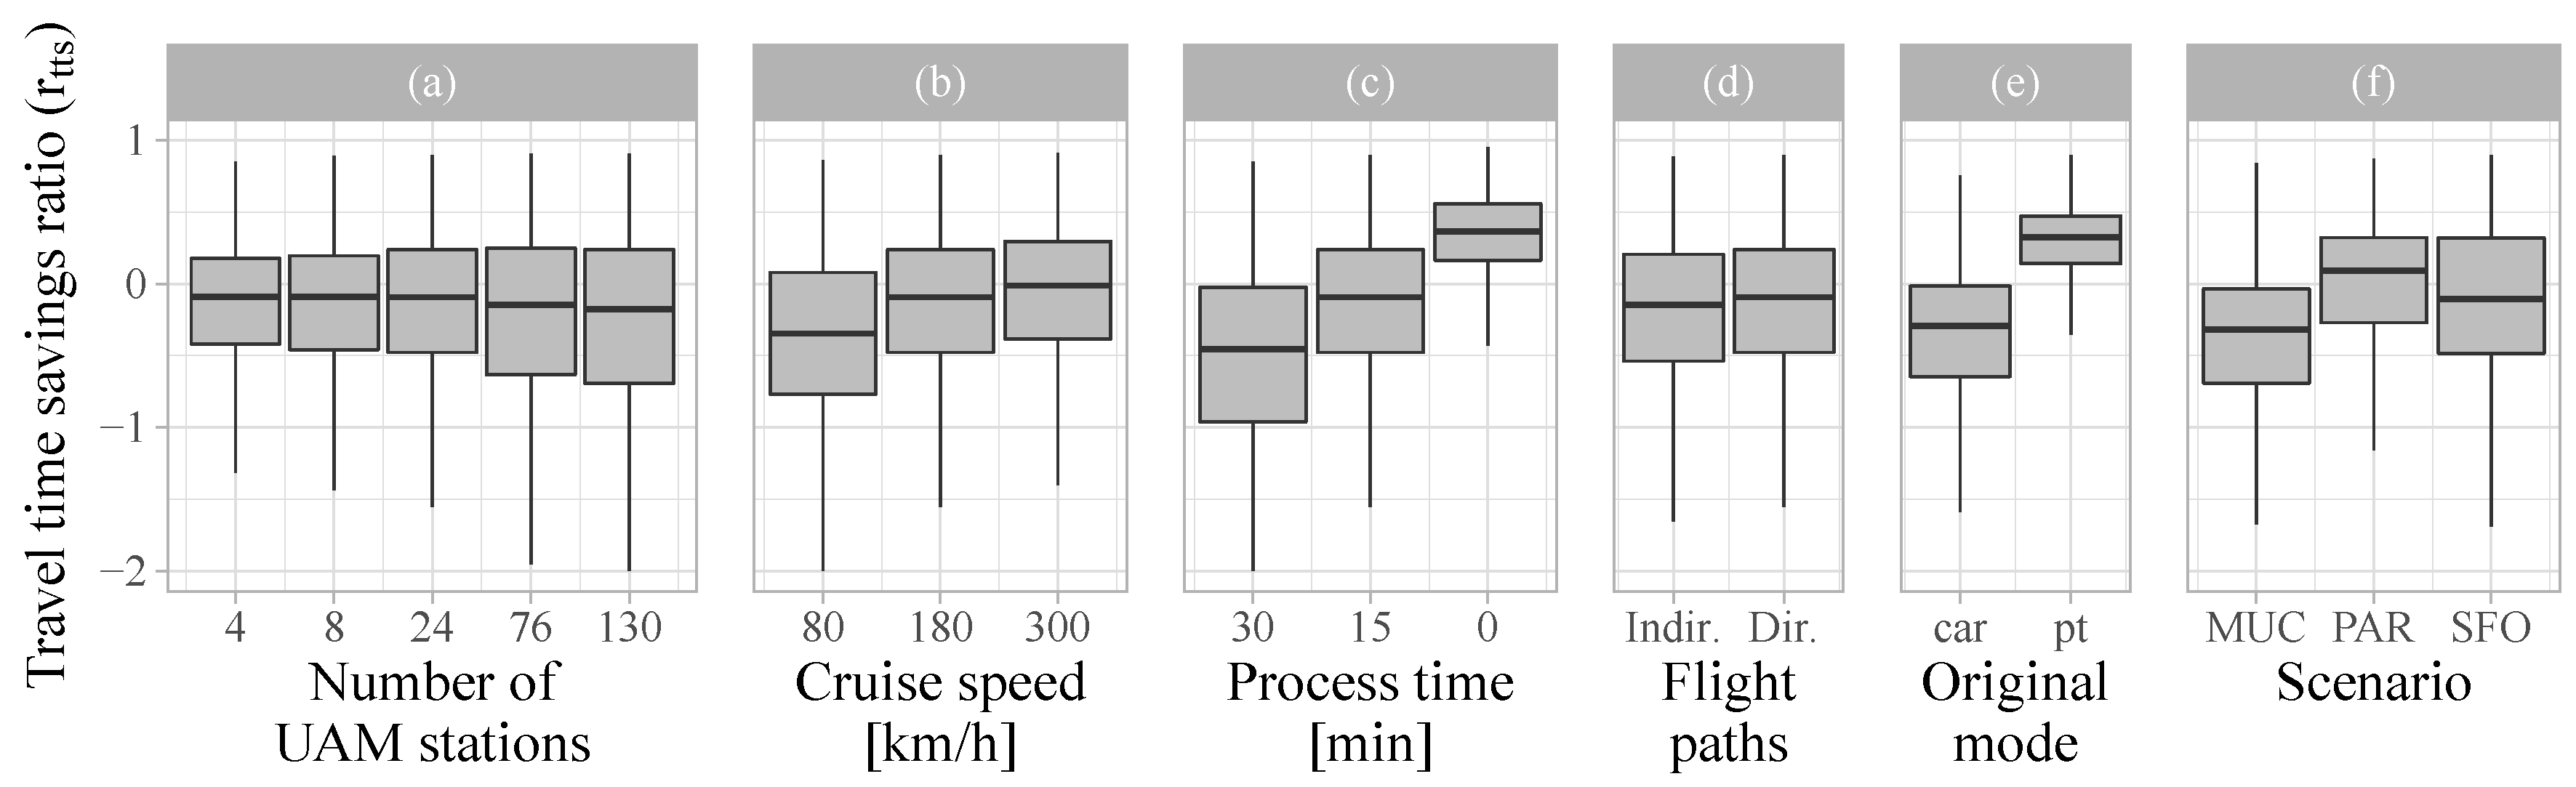
Figure 7 illustrates the distribution of UAM travel time savings ratios for UAM parameters (a) number of UAM stations, (b) cruise speed, (c) process time, and (d) flight path routing and for non-UAM parameters (e) trips’ original modes and (f) scenario. For each figure, base-case assumptions were used except for the specified UAM parameter that is being varied for
Figure 7a–d. For readability, the graph’s ratio-axis has been set to only show values for
.
While more numerous UAM stations do significantly increase service coverage, as can be seen from
Figure 5b, the potential for travel time savings does not improve—as is evident from
Figure 7a. On the contrary, the median travel time saving slightly decreases. For cruise speed, the median ratios increase by 0.35 between 80 km/h (
) and 300 km/h (
). More drastic is the impact of UAM process time with a 0.91-increase in median travel time savings ratio from −0.54 with 30 min to 0.37 without process time—even further, the spread of ratios is also significantly reduced. Whether UAM flight paths are direct (station-to-station) or indirect (routed), paths makes a ratio difference of 0.06 when comparing their respective medians (
,
). The median travel time savings ratio for UAM over PT trips is significantly higher than for car trips, with median ratios of 0.32 and −0.30 for trips that originally were PT and car trips, respectively. Finally, there is quite a difference in the distribution of travel time savings ratios between the scenarios themselves (see
Figure 7e). MUC has the lowest median ratio with
. In-between MUC and PAR lies SFO with
; PAR has highest median ratio with
.
4.2. Travel Speed Comparisons
4.2.1. Impact of UAM Operation Parameters
As seen from the time savings ratio’s sensitivity analysis (see
Figure 7), the UAM operation parameters, cruise flight speed and process time, have a significant impact on travel time and, hence, travel speeds.
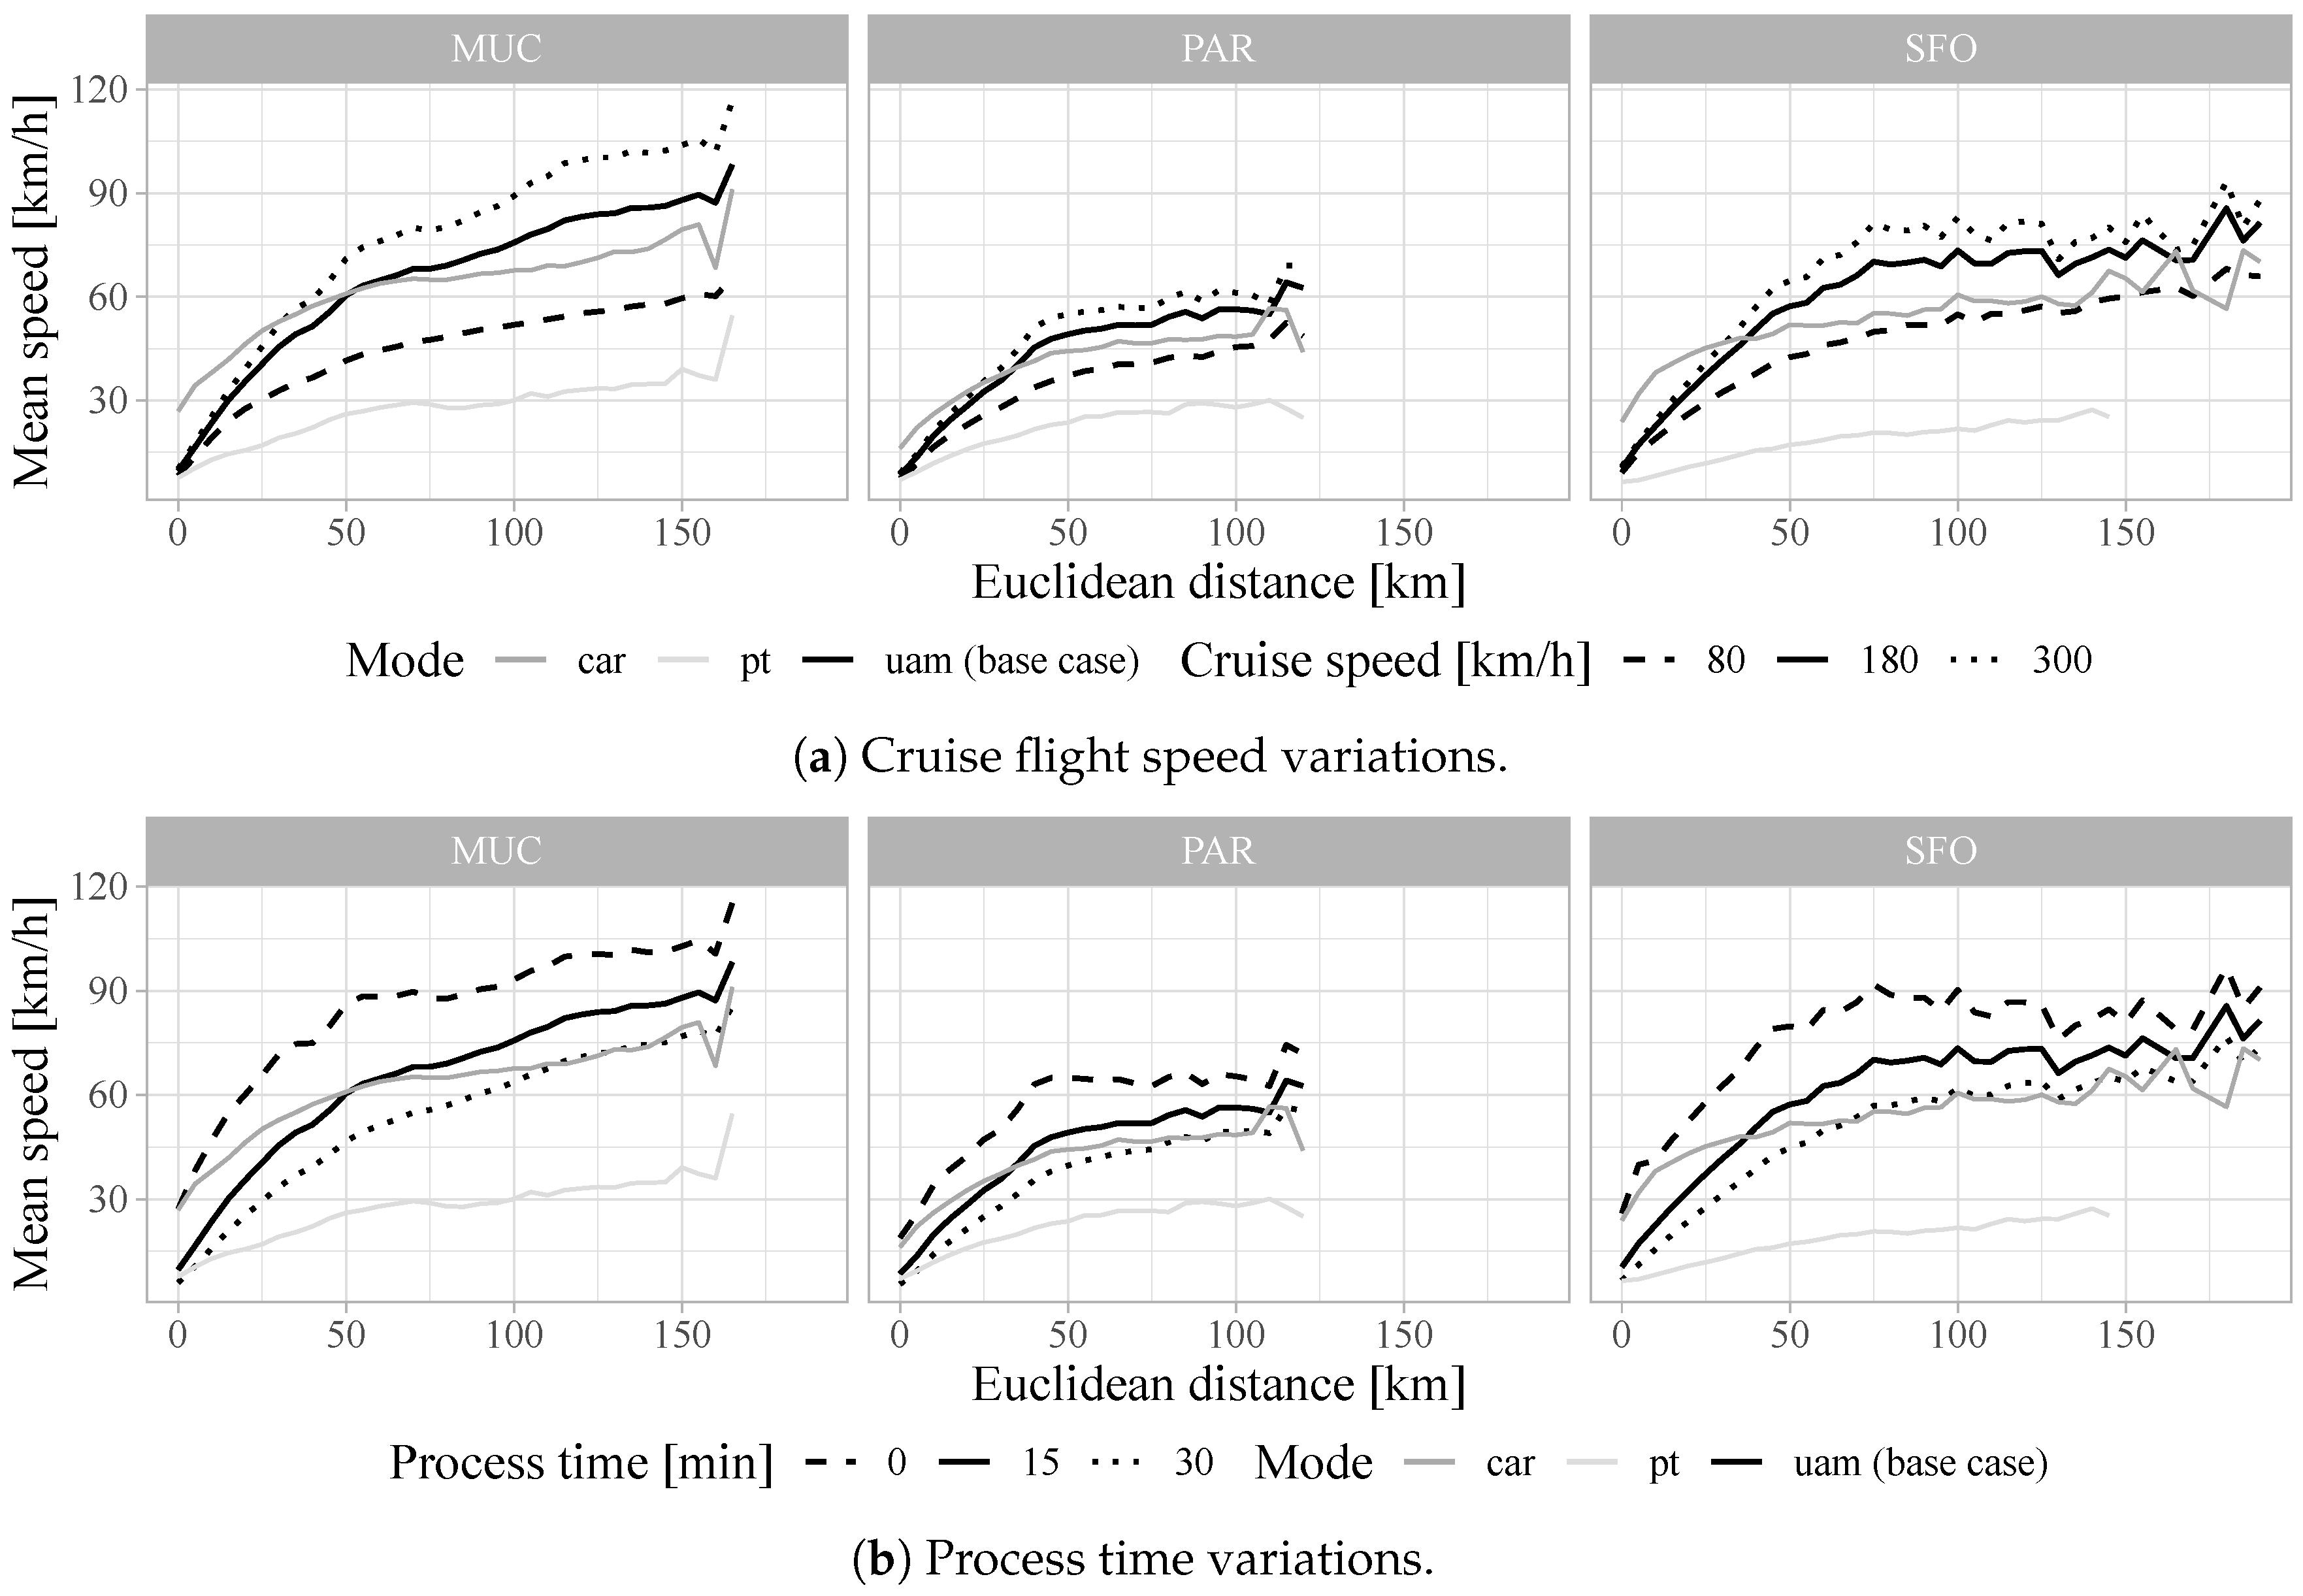
Figure 8a illustrates the mean trip travel speeds over Euclidean distance in 5 km-bins and shows the speed impact of different UAM cruise flight speeds. Except for the described variations in cruise flight speed, base-case parameters are set for UAM. At the base-case cruise speed of 180 km/h, UAM’s mean trip travel speed surpasses that of car at 60, 35, and 40 km/h for MUC, PAR, and SFO. While each scenario’s distance is slightly different, with their respective speeds, they all equate to a 50–55 min car ride. Beyond these Euclidean trip distances, UAM is—on average—expected to provide at least some travel time savings. When UAM’s cruise flight speed is reduced to 80 km/h, however, UAM’ mean speeds do not clearly surpass those of cars but merely approach them for PAR and SFO for distances larger than 100 km. Compared to PT speeds, however, even an 80 km/h-cruise speed results in consistently higher mean speeds. A cruise flight speed increase from 180 to 300 km/h leads to a reduction in intersection points between car and UAM, with them being 35 (MUC), 25 (PAR), and 30 km (SFO).
In contrast to the above,
Figure 8b illustrates the change of mean speeds for variations in assumed UAM process time. Most significant is the impact of reduced process times for short-range trips. When decreasing the process times from 15 min (base case) to zero, the mean UAM trip speeds start off and remain above those cars for all three scenarios. For an increase of process times to a total of 30 min at a cruise flight speed of 180 km/h, mean UAM trip speeds do not sufficiently surpass car speeds but begin being competitive beyond 120, 80, and 70 km for MUC, PAR, and SFO.
4.2.2. Impact of Flight Path Routing and Congestion
As non-UAM operation parameters, flight path routing and congestion also affect mean UAM trip speeds. For routed, i.e., indirect flight paths that follow ground-based infrastructure as discussed in
Section 3.2.3, a decrease in mean trip speeds is expected due to prolonged flight distances while the trips’ Euclidean distances remain unchanged. Overall, a mean speed reduction by 5% (MUC), 4% (PAR), and 7% (SFO) can be observed. However, the mean speed reduction varies with different trip distances, as shown in
Figure 9. The impact of indirect flight paths increases proportionally with longer Euclidean trip distances up to ca. 35 km, before starting to decrease with distances beyond ca. 100 km. Notably, the impact of indirect paths over distance is more volatile for SFO than for MUC or PAR. An auxiliary analysis showed that a very low number of long-range trips and the scenario’s topography, i.e., the presence of a vast and central body of water, are two primary factors for said volatility. Beyond 130 km, SFO only has one third the number of trips when compared to MUC and, additionally, those trips are spread over a wider range of distance bands.
The overall impact of peak times, i.e., congestion, on mean UAM (base case) trip speeds is a reduction by 4% (MUC), 5% (PAR), and 2% (SFO). For car, the equivalent mean speed reductions are 9% for MUC and 14% for PAR and SFO. Thus, UAM is 51% (MUC), 63% (PAR), and 82% (SFO) less affected by ground-based traffic congestion compared to cars.
Figure 10 shows how the impact of ground-based congestion changes with variations in stations’ numbers.
5. Discussion
The importance of the number and distribution of UAM stations, for UAM to be a feasible alternative to ground-based transportation modes, can not be overstated. The restriction, of trips being UAM-eligible only if the flight distance is at least one third of the overall trip’s Euclidean distance, shows how few motorized trips actually have origins and destinations within reasonable UAM station distances. Even with 130 stations being distributed over the respective study areas, the share of UAM-eligible motorized trips remains a slight minority, thus limiting UAM’s trip share regardless of UAM’s potential travel times savings. Since UAM is assumed to be a station-based transportation system, like public transport, UAM’s potential for travel time reduction hinges on the accessibility of the system’s entry and exit points, i.e., UAM stations. This study’s observed UAM-eligibility rates, which are leveling off at 40–45% for 130 UAM stations, seem comparable to the findings of Syed et al. [
18] (see
Section 2.2), who applied a stricter radius limitation, but also placed more stations.
Higher station numbers substantially increased service coverage, yet did not significantly reduce median travel times. Rather than shortening overall access and egress distances, the number of very short-range trips grows. Even with base-case assumptions of 24 stations, most potential UAM trips have Euclidean distances of less than 50 km—confirming the results of Daskilewicz et al. [
20]. Especially for those short-range trips, the impact of process time duration heavily outweighs UAM’s cruise flight speeds. The results from early simulations (c.f. [
10]), in that potential future UAM operators should focus on station placement and processes instead of vehicle speed, must be reaffirmed. This can be linked with the finding that indirect flight paths (i.e., overlying ground-based infrastructure) do not overly reduce UAM travel times. It seems fair to assume that, for potential real-life UAM implementations, a regulatory requirement to circumvent certain non-fly zones or to follow ground-based infrastructure for noise-avoidance and safety reasons might be worth the trade-off with slightly-prolonged travel times.
On average, travel time savings are expected to be achieved beyond a 35–60 km range, which stands in contrast to most UAM trips being very short-range. One could reasonably argue, however, that UAM should not be encouraged as a transportation mode for such short-range trips. With UAM vehicles’ take-off and landing operations being the most energy-intensive flight phases, UAM’s questionable sustainability (c.f. [
21]) would be improved with longer trip distances. Disallowing UAM trips, with less than, say, 50 km Euclidean distance, would reduce the motorized trip shares of UAM by more than 75% (see
Figure 6). It is important to note that the sustainability of a potential future UAM realization very much depends on a multitude of factors, such as vehicle capacity, average load factors, or the share of renewable energy production. Still, high base usage fees for UAM might be an economic measure to reduce unsustainable short-range flights.
Since potential UAM service prices and costs are still very much speculation, pricing has purposefully not been included within this study. Thus, the reported motorized trip shares present the maximum possible shares, with the inclusion of pricing substantially reducing UAM’s trip shares—given that UAM is expected to be a more costly service than private car or PT usage. Especially when discussing UAM as a potential alternative for trips that originally were done using PT, it is fair to question whether such substitution can be assumed or—more importantly—desired. In light of making transport more sustainable and decreasing social inequality, reducing the trip share of PT for a more individualistic mode of transportation is wholly unwanted—despite UAM potentially offering shared services at some point in the future. Assuming that PT substitution would not occur, either due to economic or regulatory measures, the reported motorized trip shares for UAM would decrease by 40–79%.
6. Limitations and Future Research
This study primarily analyzes travel times savings without the inclusion of pricing. Combining various stated-preference surveys—especially the emerging study for San Francisco Bay Area by Garrow et al. [
51]—with the presented information could enable more detailed insight into potential UAM demand. Furthermore, more localized analyses of the study areas’ ground infrastructure and topography might lead to particular flight connections that prove to be useful despite being, e.g., short-range.
With UAM station selection being such a central influence on its coverage and trip shares, it is a topic worth its own analysis in the lines of Chakour and Eluru [
52], whose approach specifically addresses the issue of different sequences in passengers’ decisions for departure stations in whether the access mode or station precedes. Additionally, required UAM infrastructure throughput, potential for passenger pooling, public acceptance, and sustainability of UAM operations also warrant further investigation.
7. Conclusions
Urban air mobility, understood as short-range on-demand aerial passenger transport, is expected to provide a novel, time-saving mode of transportation. Except for potential future UAM realizations with vast numbers of UAM station, however, the majority of motorized trips are UAM-ineligible due to prolonged access and egress trips. Thus, the number and distribution of stations are key to achieving wide-spread UAM service coverage. Under base-case assumptions, UAM could provide travel time savings for 3–13% of motorized trips. Due to the necessity of accessing/egressing UAM stations, ground-based congestion does affect UAM travel times–compared to cars, however, UAM travel times are 51–82% less affected. UAM (base case) is estimated to provide time savings beyond respective distances of a 50–55 min car ride.
While UAM is not believed to be suitable for mass transport, based on the derived trip shares, the underlying technologies could provide valuable alternatives to conventional helicopters that are in use for emergency, touristic, or occasional passenger transport services. However, UAM might be a suitable addition to existing transportation systems in areas with, for example, ground terrain that causes large detours for ground-based transportation. For UAM manufacturers or intended UAM service providers, it is recommended to focus on UAM stations’ accessibility and distribution, rather than maximizing UAM vehicle cruise flight speed.
Author Contributions
Conceptualization, R.R.; methodology, R.R.; software, R.R. and M.B.; validation, R.R. and M.F.; formal analysis, R.R.; investigation, R.R.; resources, R.R.; data curation, R.R.; writing—original draft preparation, R.R.; writing—review and editing, R.R., M.F., M.B., and C.A.; visualization, R.R.; supervision, C.A.; All authors have read and agreed to the published version of the manuscript.
Funding
This work was supported by the Technical University of Munich within the Open Access Publishing Funding Program.
Institutional Review Board Statement
Not applicable.
Informed Consent Statement
Not applicable.
Data Availability Statement
The data presented in this study are available on request from the corresponding author. The data are not publicly available due to privacy concerns.
Conflicts of Interest
The authors declare that they have no conflict of interest.
Appendix A
Figure A1.
Location–allocation impedance minimization outputs for 4, 24, and 130 UAM stations for MUC, PAR, and SFO.
Figure A1.
Location–allocation impedance minimization outputs for 4, 24, and 130 UAM stations for MUC, PAR, and SFO.
References
- Fu, M.; Rothfeld, R.; Antoniou, C. Exploring Preferences for Transportation Modes in an Urban Air Mobility Environment: Munich Case Study. Transp. Res. Rec. 2019. [Google Scholar] [CrossRef]
- Al Haddad, C.; Chaniotakis, E.; Straubinger, A.; Plötner, K.; Antoniou, C. Factors affecting the adoption and use of urban air mobility. Transp. Res. Part A Policy Pract. 2020, 132, 696–712. [Google Scholar] [CrossRef]
- Moeckel, R.; Kuehnel, N.; Llorca, C.; Moreno, A.; Rayaprolu, H. Agent-Based Simulation to Improve Policy Sensitivity of Trip-Based Models. J. Adv. Transp. 2020, 2020. [Google Scholar] [CrossRef]
- Pukhova, A.; Llorca, C.; Moreno, A.; Zhang, Q.; Moeckel, R. Urban air mobility: Another disruptive technology or just an insignificant addition. In Proceedings of the European Transport Conference, Dublin, Ireland, 9–11 October 2019. [Google Scholar]
- Plötner, K.; Rothfeld, R.; Shamiyeh, M.; Kabel, S.; Frank, F.; Straubinger, A.; Llorca, C.; Fu, M.; Moreno, A.; Pukhova, A.; et al. Long-term Application Potential of Urban Air Mobility Complementing Public Transport: An Upper Bavaria Example. CEAS Aeronaut. J. Off. J. Counc. Eur. Aerosp. Soc. 2020. [Google Scholar] [CrossRef]
- Wang, F.; Ross, C.L. New potential for multimodal connection: Exploring the relationship between taxi and transit in New York City (NYC). Transportation 2019, 46, 1051–1072. [Google Scholar] [CrossRef]
- Balać, M.; Vetrella, A.R.; Rothfeld, R.; Schmid, B. Demand Estimation for Aerial Vehicles in Urban Settings. IEEE Intell. Transp. Syst. Mag. 2019, 11, 105–116. [Google Scholar] [CrossRef]
- Balać, M.; Rothfeld, R.; Hörl, S. The Prospects of on-demand Urban Air Mobility in Zurich, Switzerland. In Proceedings of the 2019 IEEE Intelligent Transportation Systems Conference, ITSC 2019, Auckland, New Zealand, 27–30 October 2019; pp. 906–913. [Google Scholar] [CrossRef]
- Postorino, M.N.; Sarné, G.M. Reinventing mobility paradigms: Flying car scenarios and challenges for urban mobility. Sustainability 2020, 12, 3581. [Google Scholar] [CrossRef]
- Rothfeld, R.; Balać, M.; Plötner, K.; Antoniou, C. Initial Analysis of Urban Air Mobility’s Transport Performance in Sioux Falls. In Proceedings of the 2018 Aviation Technology, Integration, and Operations Conference, Atlanta, GA, USA, 25–29 June 2018; pp. 1–13. [Google Scholar] [CrossRef]
- Vascik, P.D.; Hansman, R.J. Scaling Constraints for Urban Air Mobility Operations: Air Traffic Control, Ground Infrastructure, and Noise. In 2018 Aviation Technology, Integration, and Operations Conference; MIT International Center for Air Transportation (ICAT), Department of Aeronautics & Astronautics, Massachusetts Institute of Technology, American Institute of Aeronautics and Astronautics: Reston, VA, USA, 2018. [Google Scholar] [CrossRef]
- Liu, Y.; Kreimeier, M.; Stumpf, E.; Zhou, Y.; Liu, H. Overview of recent endeavors on personal aerial vehicles: A focus on the US and Europe led research activities. Prog. Aerosp. Sci. 2017, 91, 53–66. [Google Scholar] [CrossRef]
- Holden, J.; Goel, N. Fast-Forwarding to a Future of On-Demand Urban Air Transportation; Uber Technologies, Inc.: San Francisco, CA, USA, 2016; pp. 1–98. [Google Scholar]
- Antcliff, K.R.; Moore, M.D.; Goodrich, K.H. Silicon valley as an early adopter for on-demand civil VTOL operations. In Proceedings of the 16th AIAA Aviation Technology, Integration, and Operations Conference, Washington, DC, USA, 13–17 June 2016; American Institute of Aeronautics and Astronautics, Ed.; American Institute of Aeronautics and Astronautics: Washington, DC, USA, 2016. [Google Scholar] [CrossRef]
- Fadhil, D.N. A GIS-based Analysis for Selecting Ground Infrastructure Locations for Urban Air Mobility. Master’s Thesis, Technical University of Munich, Munich, Germany, 2018. [Google Scholar]
- Arellano, S. A Data- and Demand-Based Approach at Identifying Accessible Locations for Urban Air Mobility Stations. Master’s Thesis, Technical University of Munich, Munich, Germany, 2020. [Google Scholar]
- Lim, E.; Hwang, H. The Selection of Vertiport Location for On-Demand Mobility and Its Application to Seoul Metro Area. Int. J. Aeronaut. Space Sci. 2019, 20, 260–272. [Google Scholar] [CrossRef]
- Syed, N.; Rye, M.; Ade, M.; Trani, A.; Hinze, N.; Swingle, H.; Smith, J.C.; Marien, T.; Dollyhigh, S. ODM commuter aircraft demand estimation. In Proceedings of the 17th AIAA Aviation Technology, Integration, and Operations Conference, Denver, CO, USA, 5–9 June 2017. [Google Scholar]
- German, B.; Daskilewicz, M.; Hamilton, T.K.; Warren, M.M. Cargo Delivery in by Passenger eVTOL Aircraft: A Case Study in the San Francisco Bay Area. In 2018 AIAA Aerospace Sciences Meeting; American Institute of Aeronautics and Astronautics: Reston, VA, USA, 2018; Number 210059; pp. 1–13. [Google Scholar] [CrossRef]
- Daskilewicz, M.; German, B.; Warren, M.M.; Garrow, L.A.; Boddupalli, S.S.; Douthat, T.H. Progress in Vertiport Placement and Estimating Aircraft Range Requirements for eVTOL Daily Commuting. In 2018 Aviation Technology, Integration, and Operations Conference; American Institute of Aeronautics and Astronautics: Reston, VA, USA, 2018; pp. 1–11. [Google Scholar] [CrossRef]
- Pukhova, A. Environmental Evaluation of Urban Air Mobility Operation. Master’s Thesis, Technical University of Munich, Munich, Germany, 2018. [Google Scholar]
- Kasliwal, A.; Furbush, N.J.; Gawron, J.H.; McBride, J.R.; Wallington, T.J.; De Kleine, R.D.; Kim, H.C.; Keoleian, G.A. Role of flying cars in sustainable mobility. Nat. Commun. 2019, 10, 1–9. [Google Scholar] [CrossRef] [PubMed]
- Eißfeldt, H. Sustainable urban air mobility supported with participatory noise sensing. Sustainability 2020, 12, 3320. [Google Scholar] [CrossRef]
- Horni, A.; Nagel, K.; Axhausen, K.W. (Eds.) The Multi-Agent Transport Simulation MATSim; Ubiquity Press: London, UK, 2016. [Google Scholar] [CrossRef]
- Segui-Gasco, P.; Ballis, H.; Parisi, V.; Kelsall, D.G.; North, R.J.; Busquets, D. Simulating a rich ride-share mobility service using agent-based models. Transportation 2019, 46, 2041–2062. [Google Scholar] [CrossRef]
- Balać, M.; Becker, H.; Ciari, F.; Axhausen, K.W. Modeling competing free-floating carsharing operators—A case study for Zurich, Switzerland. Transp. Res. Part C Emerg. Technol. 2019, 98, 101–117. [Google Scholar] [CrossRef]
- Liu, J.; Kockelman, K.M.; Boesch, P.M.; Ciari, F. Tracking a system of shared autonomous vehicles across the Austin, Texas network using agent-based simulation. Transportation 2017, 44, 1261–1278. [Google Scholar] [CrossRef]
- Winter, K.; Cats, O.; Martens, K.; van Arem, B. Relocating Shared Automated Vehicles Under Parking Constraints: Assessing the Impact of Different Strategies for On-Street Parking; Number 0123456789; Springer: New York, NY, USA, 2020. [Google Scholar] [CrossRef]
- Kim, J. Assessment of the DRT system based on an optimal routing strategy. Sustainability 2020, 12, 714. [Google Scholar] [CrossRef]
- Rothfeld, R.; Balać, M.; Plötner, K.; Antoniou, C. Agent-based Simulation of Urban Air Mobility. In Proceedings of the 2018 Modeling and Simulation Technologies Conference, Kissimmee, FL, USA, 8–12 January 2018; pp. 1–10. [Google Scholar] [CrossRef]
- Maciejewski, M. Dynamic Transport Services. In The Multi-Agent Transport Simulation MATSim; Horni, A., Nagel, K., Axhausen, K.W., Eds.; Ubiquity Press: London, UK, 2016; Chapter 23; pp. 145–152. [Google Scholar] [CrossRef]
- Hörl, S. Implementation of an Autonomous Taxi Service in a Multi-Modal Traffic Simulation Using MATSim. Master’s Thesis, ETH Zurich, Zurich, Switzerland, 2016. [Google Scholar] [CrossRef]
- Shamiyeh, M.; Rothfeld, R.; Hornung, M. A Performance Benchmark of Recent Personal Air Vehicle Concepts for Urban Air Mobility. In Proceedings of the 31st Congress of the International Council of the Aeronautical Sciences, ICAS, Belo Horizonte, Brazil, 9–14 September 2018. [Google Scholar]
- Fu, M.; Straubinger, A.; Schaumeier, J. Scenario-based Demand Assessment of Urban Air Mobility in the Greater Munich Area. In AIAA AVIATION 2020 FORUM; American Institute of Aeronautics and Astronautics: Reston, VA, USA, 2020; pp. 1–16. [Google Scholar] [CrossRef]
- Rothfeld, R.; Balać, M.; Militão, A. MATSim-UAM. Available online: https://github.com/BauhausLuftfahrt/MATSim-UAM (accessed on 19 February 2021).
- Moeckel, R.; Kuehnel, N.; Llorca, C.; Moreno, A.; Rayaprolu, H. Microscopic Travel Demand Modeling: Using the Agility of Agent-Based Modeling Without the Complexity of Activity-Based Models. In Proceedings of the Annual Meeting of the Transportation Research Board, Washington, DC, USA, 8–12 January 2019. [Google Scholar]
- Hörl, S.; Balać, M. Reproducible scenarios for agent-based transport simulation. Arbeitsberichte Verkehrs Raumplan. 2020, 1499. [Google Scholar] [CrossRef]
- Balać, M.; Hörl, S. Synthetic Population for The State of California Based on Open-data: Examples of San Francisco Bay Area and San Diego County. In Proceedings of the 100th Annual Meeting of the Transportation Research Board, Washington, DC, USA, 5–29 January 2021. [Google Scholar]
- Moeckel, R. Constraints in household relocation: Modeling land-use/transport interactions that respect time and monetary budgets. J. Transp. Land Use 2017, 10, 211–228. [Google Scholar] [CrossRef]
- Moreno, A.; Moeckel, R. Population Synthesis Handling Three Geographical Resolutions. ISPRS Int. J. Geo-Inf. 2018, 7, 174. [Google Scholar] [CrossRef]
- Mobilität in Deutschland. Available online: https://www.mobilitaet-in-deutschland.de (accessed on 19 February 2021).
- Hörl, S.; Balać, M. Eqasim-org. Available online: https://github.com/eqasim-org (accessed on 19 February 2021).
- Hörl, S.; Balać, M. Introducing the eqasim pipeline: From raw data to agent-based transport simulation. Presented at the ABMTRANS, Warsaw, Poland, 23–26 March 2021. [Google Scholar]
- Hörl, S.; Balać, M.; Axhausen, K.W. A first look at bridging discrete choice modeling and agent-based microsimulation in MATSim. Procedia Comput. Sci. 2018, 130, 900–907. [Google Scholar] [CrossRef]
- Hörl, S.; Balać, M.; Axhausen, K.W. Pairing discrete mode choice models and agent-based transport simulation with MATSim. In Proceedings of the Transportation Research Board 98th Annual Meeting, Washington, DC, USA, 13–17 January 2019. [Google Scholar]
- Moeckel, R.; Donnelly, R. Gradual Rasterization: Redefining Spatial Resolution in Transport Modelling. Environ. Plan. B Plan. Des. 2015, 42, 888–903. [Google Scholar] [CrossRef]
- Hansman, R.J.; Vascik, P.D. Operational Aspects of Aircraft-Based On-Demand Mobility Aircraft-Based On-Demand Mobility. 21 April 2016. Available online: https://www.faa.gov/about/office_org/headquarters_offices/ang/library/events/jup/april2016/MIT/MIT_ICAT_Parker_Vascik.pdf (accessed on 12 February 2021).
- Vascik, P.D.; Hansman, R.J. Evaluation of Key Operational Constraints Affecting On-Demand Mobility for Aviation in the Los Angeles Basin: Ground Infrastructure, Air Traffic Control and Noise. In Proceedings of the 17th AIAA Aviation Technology, Integration, and Operations Conference, Denver, CO, USA, 5–9 June 2017; American Institute of Aeronautics and Astronautics: Reston, VA, USA, 2017. [Google Scholar] [CrossRef]
- Rothfeld, R.; Fu, M.; Antoniou, C. Analysis of Urban Air Mobility’s Transport Performance in Munich Metropolitan Region. In Proceedings of the mobil.TUM 2019, Munich, Germany, 11–12 September 2019. [Google Scholar] [CrossRef]
- Shamiyeh, M.; Bijewitz, J.; Hornung, M. A Review of Recent Personal Air Vehicle Concepts. In Proceedings of the Aerospace Europe 6th CEAS Conference, Bucharest, Romania, 16–20 October 2017; Number 913. pp. 1–16. [Google Scholar]
- Garrow, L.A.; Mokhtarian, P.; German, B.; Boddupalli, S.S. Commuting in the Age of the Jetsons: A Market Segmentation Analysis of Autonomous Ground Vehicles and Air Taxis in Five Large U.S. Cities. In AIAA AVIATION 2020 FORUM; American Institute of Aeronautics and Astronautics: Reston, VA, USA, 2020. [Google Scholar] [CrossRef]
- Chakour, V.; Eluru, N. Analyzing commuter train user behavior: A decision framework for access mode and station choice. Transportation 2014, 41, 211–228. [Google Scholar] [CrossRef]
| Publisher’s Note: MDPI stays neutral with regard to jurisdictional claims in published maps and institutional affiliations. |
© 2021 by the authors. Licensee MDPI, Basel, Switzerland. This article is an open access article distributed under the terms and conditions of the Creative Commons Attribution (CC BY) license (http://creativecommons.org/licenses/by/4.0/).


