Advanced Air Mobility: Demand Analysis and Market Potential of the Airport Shuttle and Air Taxi Markets
Abstract
:1. Introduction
2. Overview of Studies Forecasting AAM Demand
3. Methodological Overview
- Step 1.
- The first step included defining operational assumptions. For example, both the airport shuttle and air taxi markets are defined by range, demand, infrastructure availability, aircraft capabilities, and similar operational characteristics. The process of defining operational assumptions included consideration of the complete trip concept, such as ground transportation and first- and last-mile connections to a vertiport, transfers, and the air taxi flight.
- Step 2.
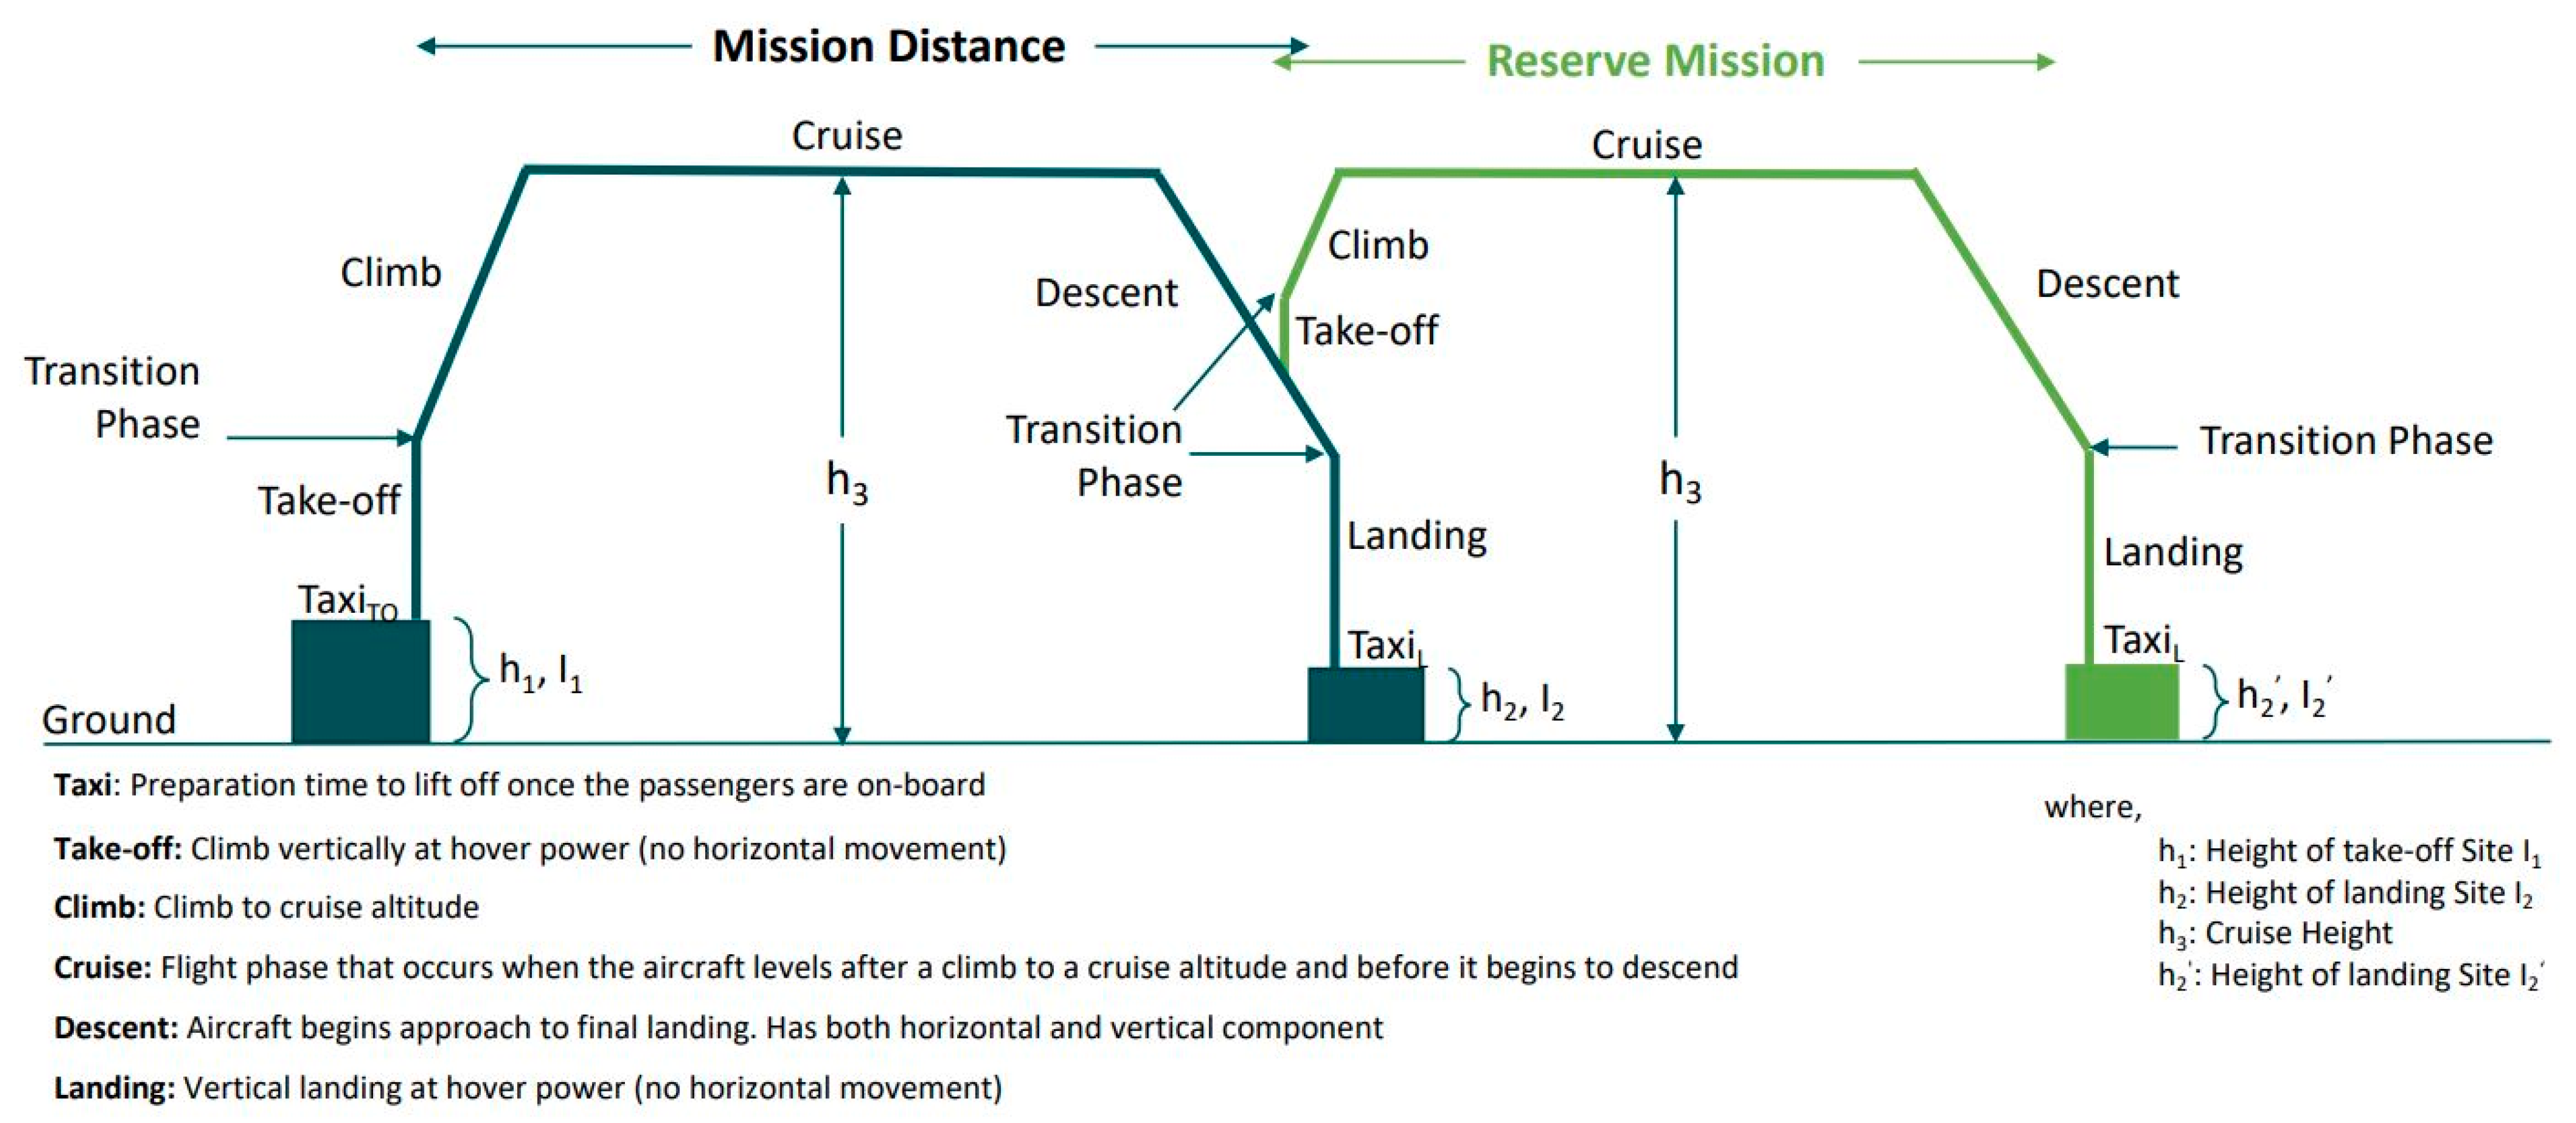
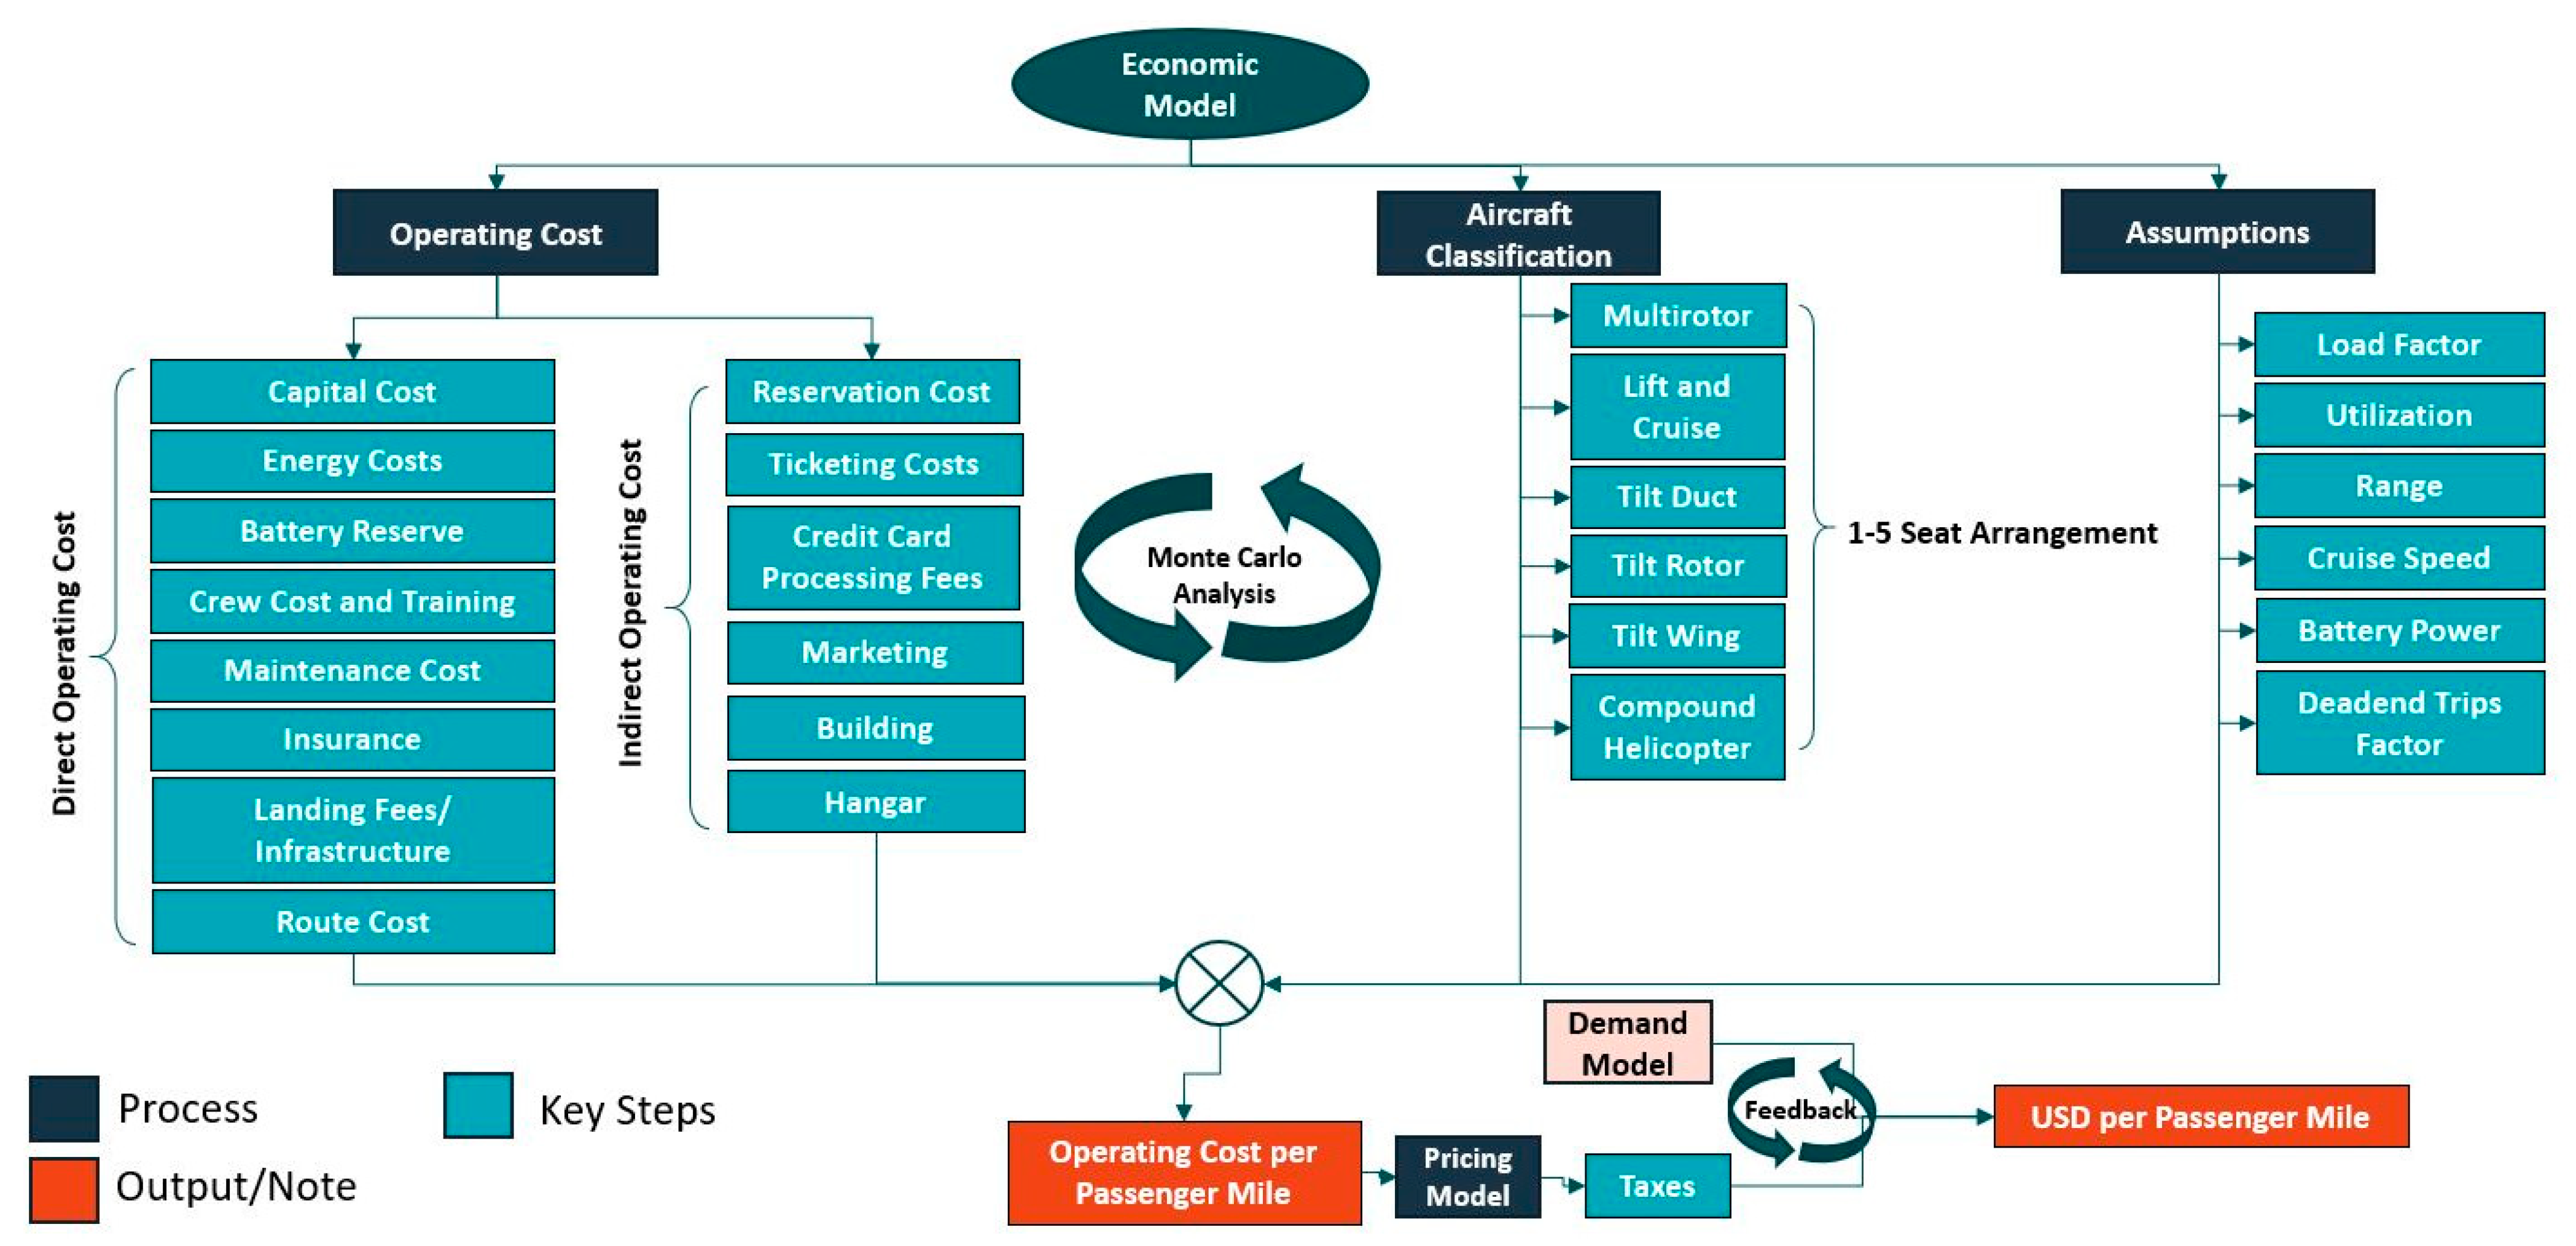
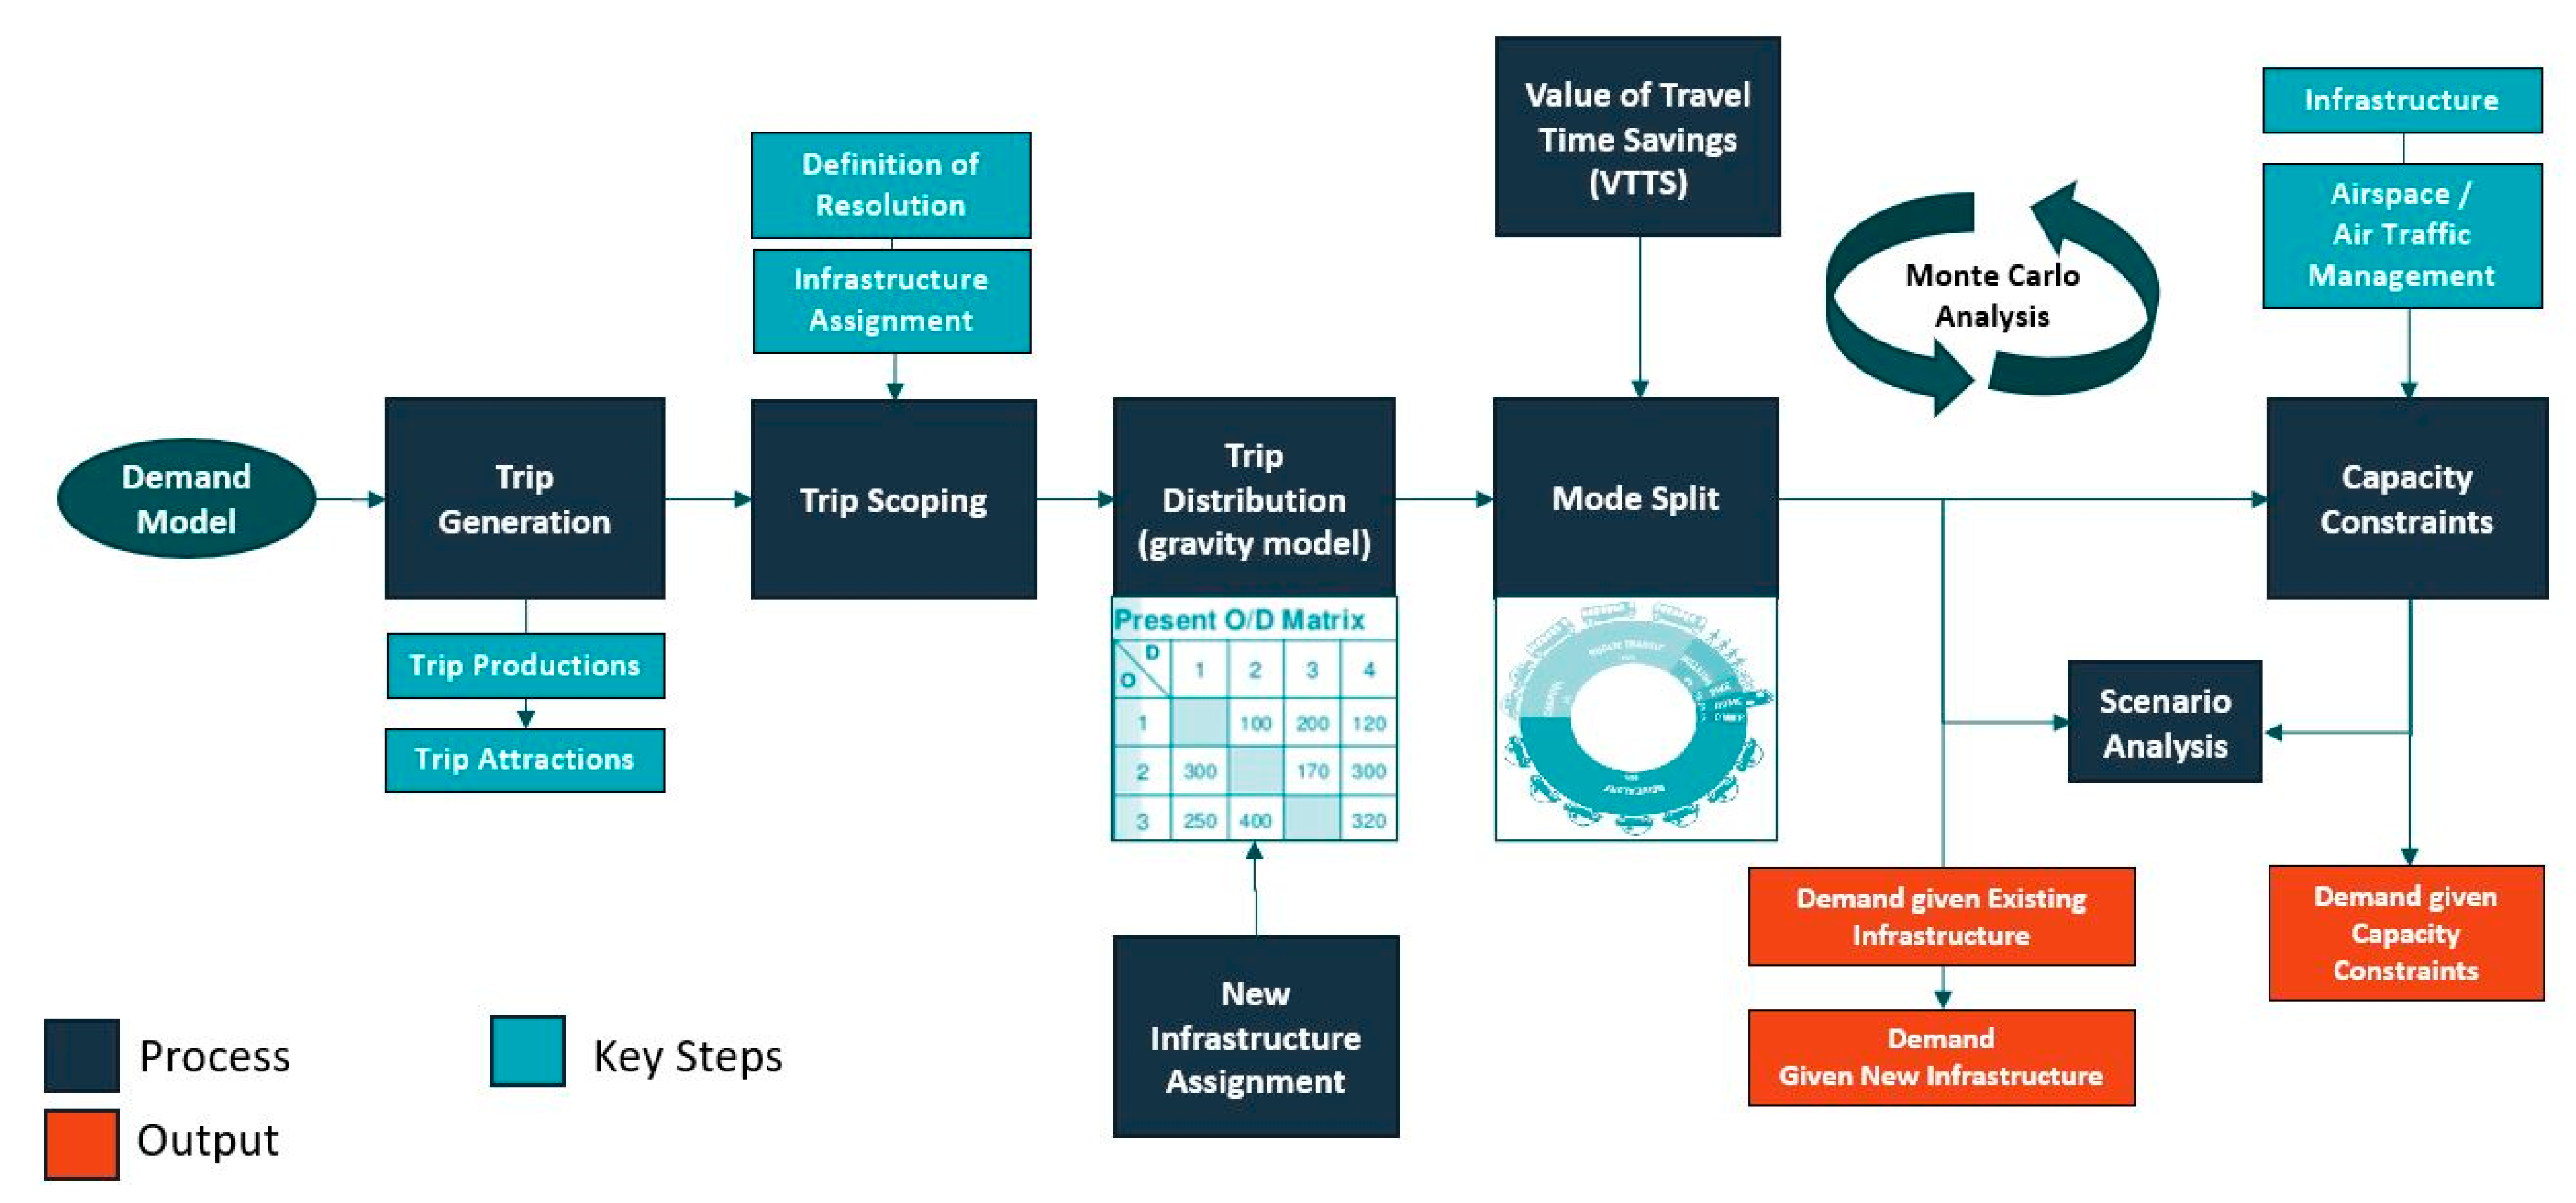
- The second step involved developing an operating model and calculating key performance metrics. To do this, the authors calculated the cost of passenger service for different aircraft types proposed to serve the air taxi and airport shuttle markets. Each cost, such as capital, maintenance, batteries, electric charging, and vertiports, was individually modeled. Weather adjustments, such as wind speed, temperature, and density for each urban area, were applied. The full methodology for the weather analysis can be found in [22]. Using the calculated cost of passenger service, the authors calculated demand using a demand model comprised of (1) trip generation, (2) scoping, (3) trip distribution, (4) mode choice, and (5) operational constraints.
- Step 3.
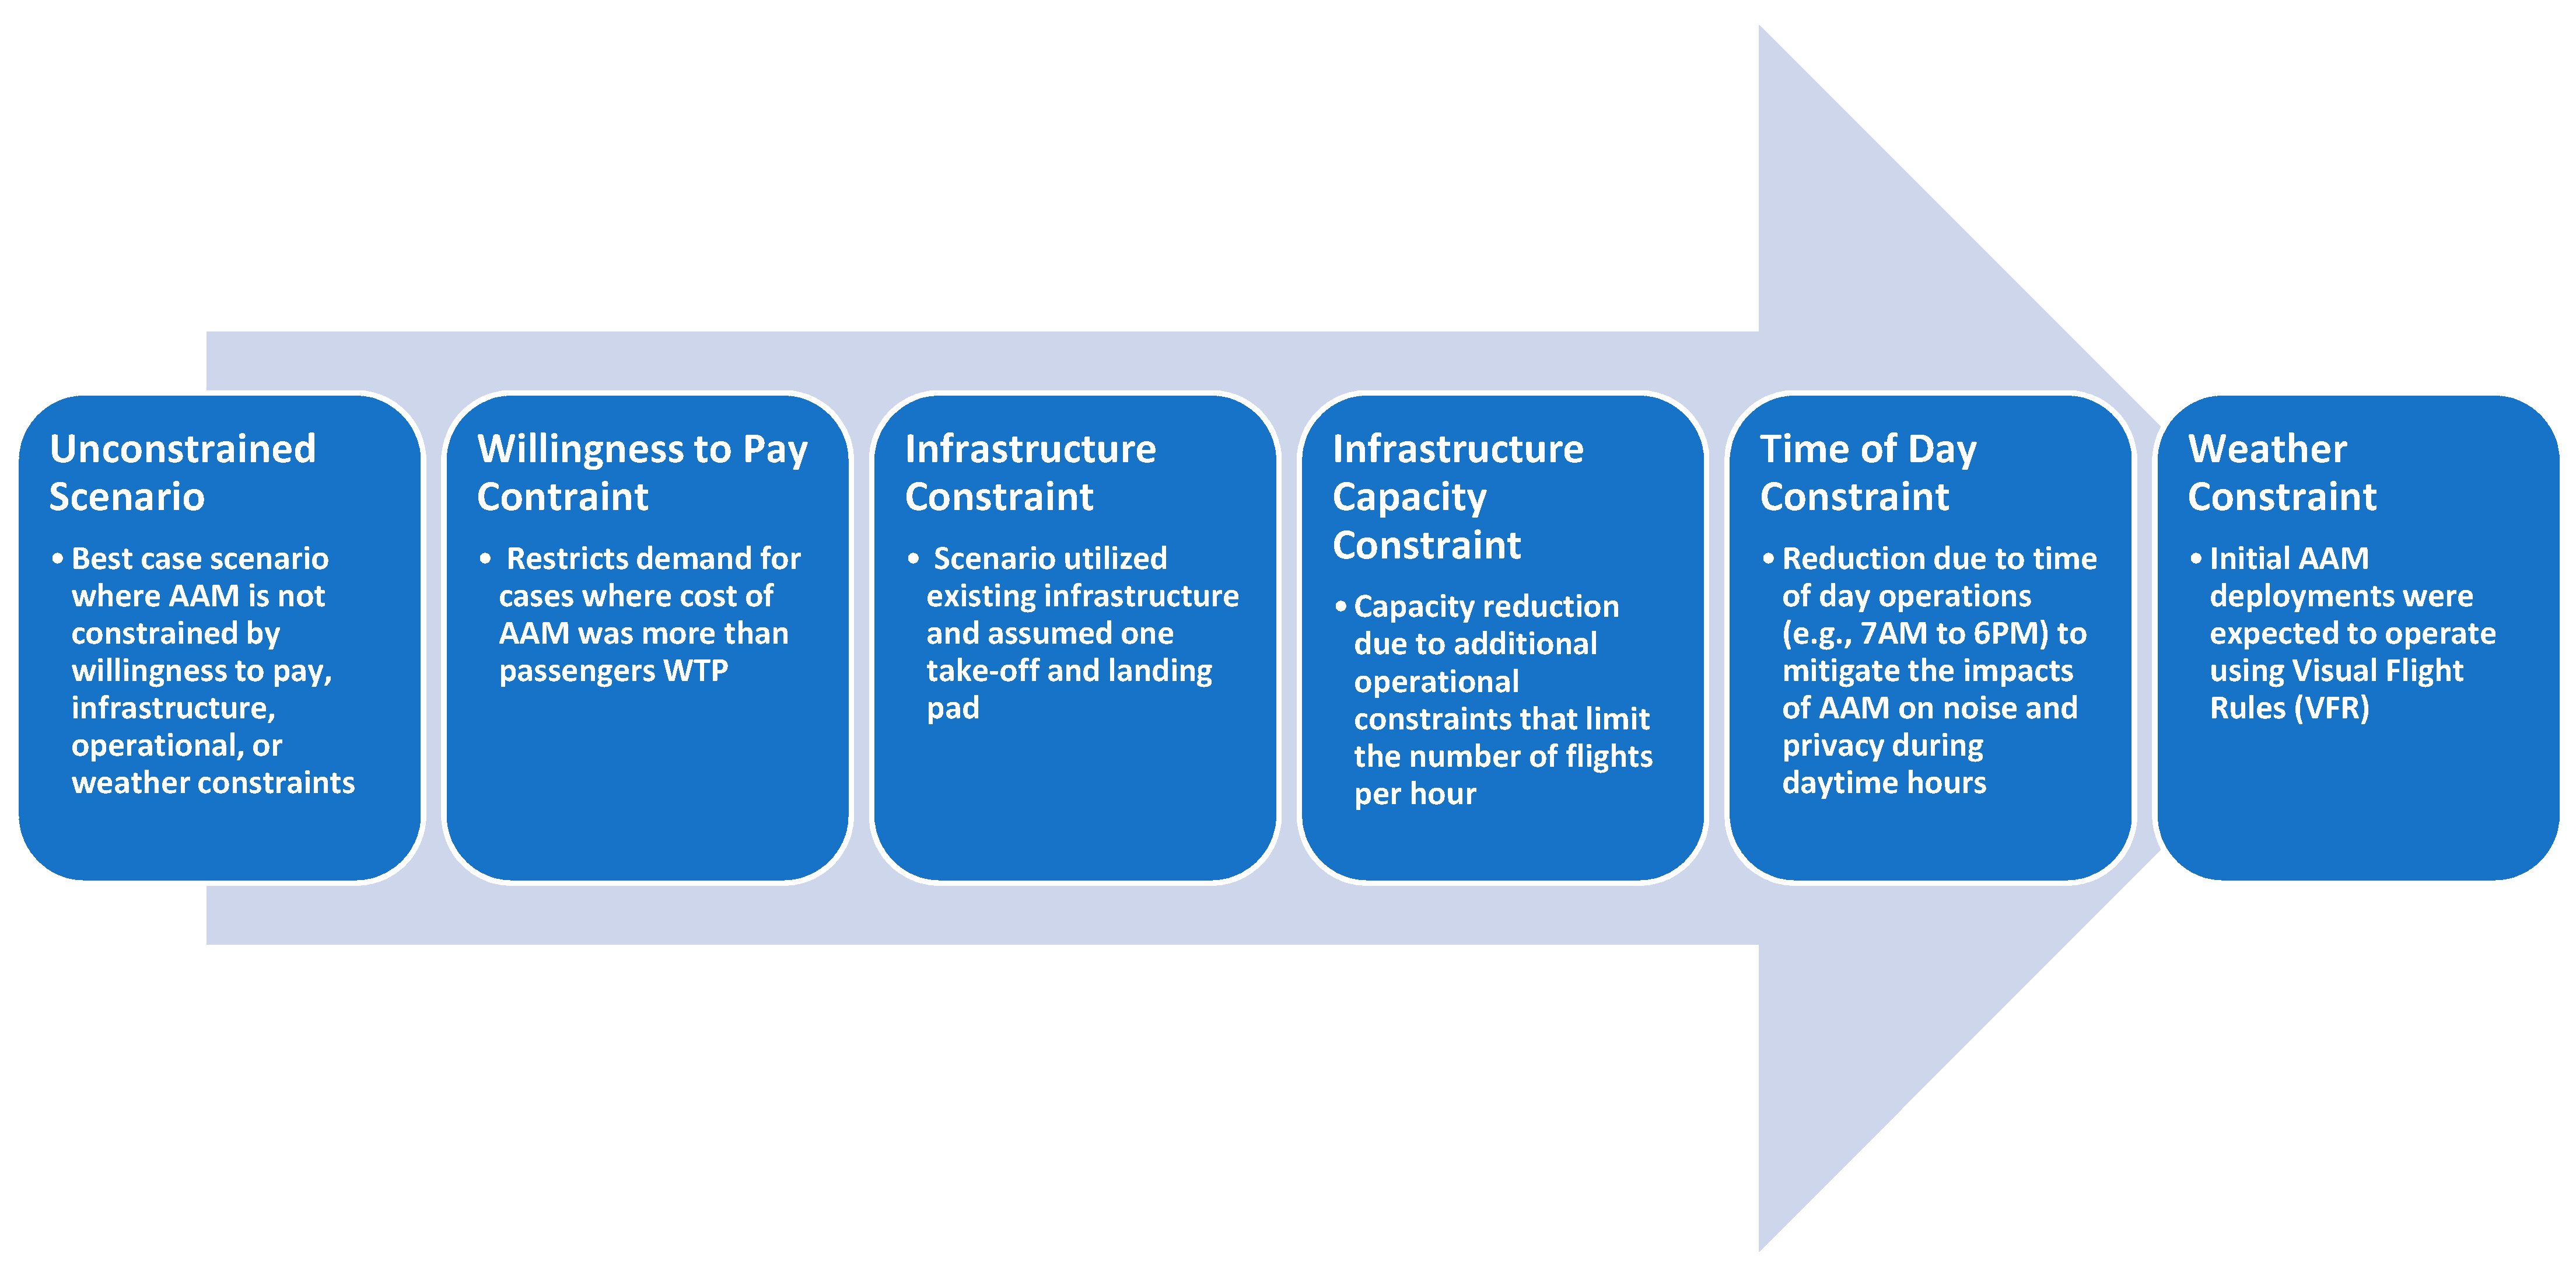
- Third, the authors developed what-if scenario analyses using operational constraints, such as infrastructure capacity, time of day restrictions (e.g., limiting flights during the night to minimize adverse community impacts), and regulatory challenges to flying under instrument flight rules (IFR) conditions.
- Step 4.
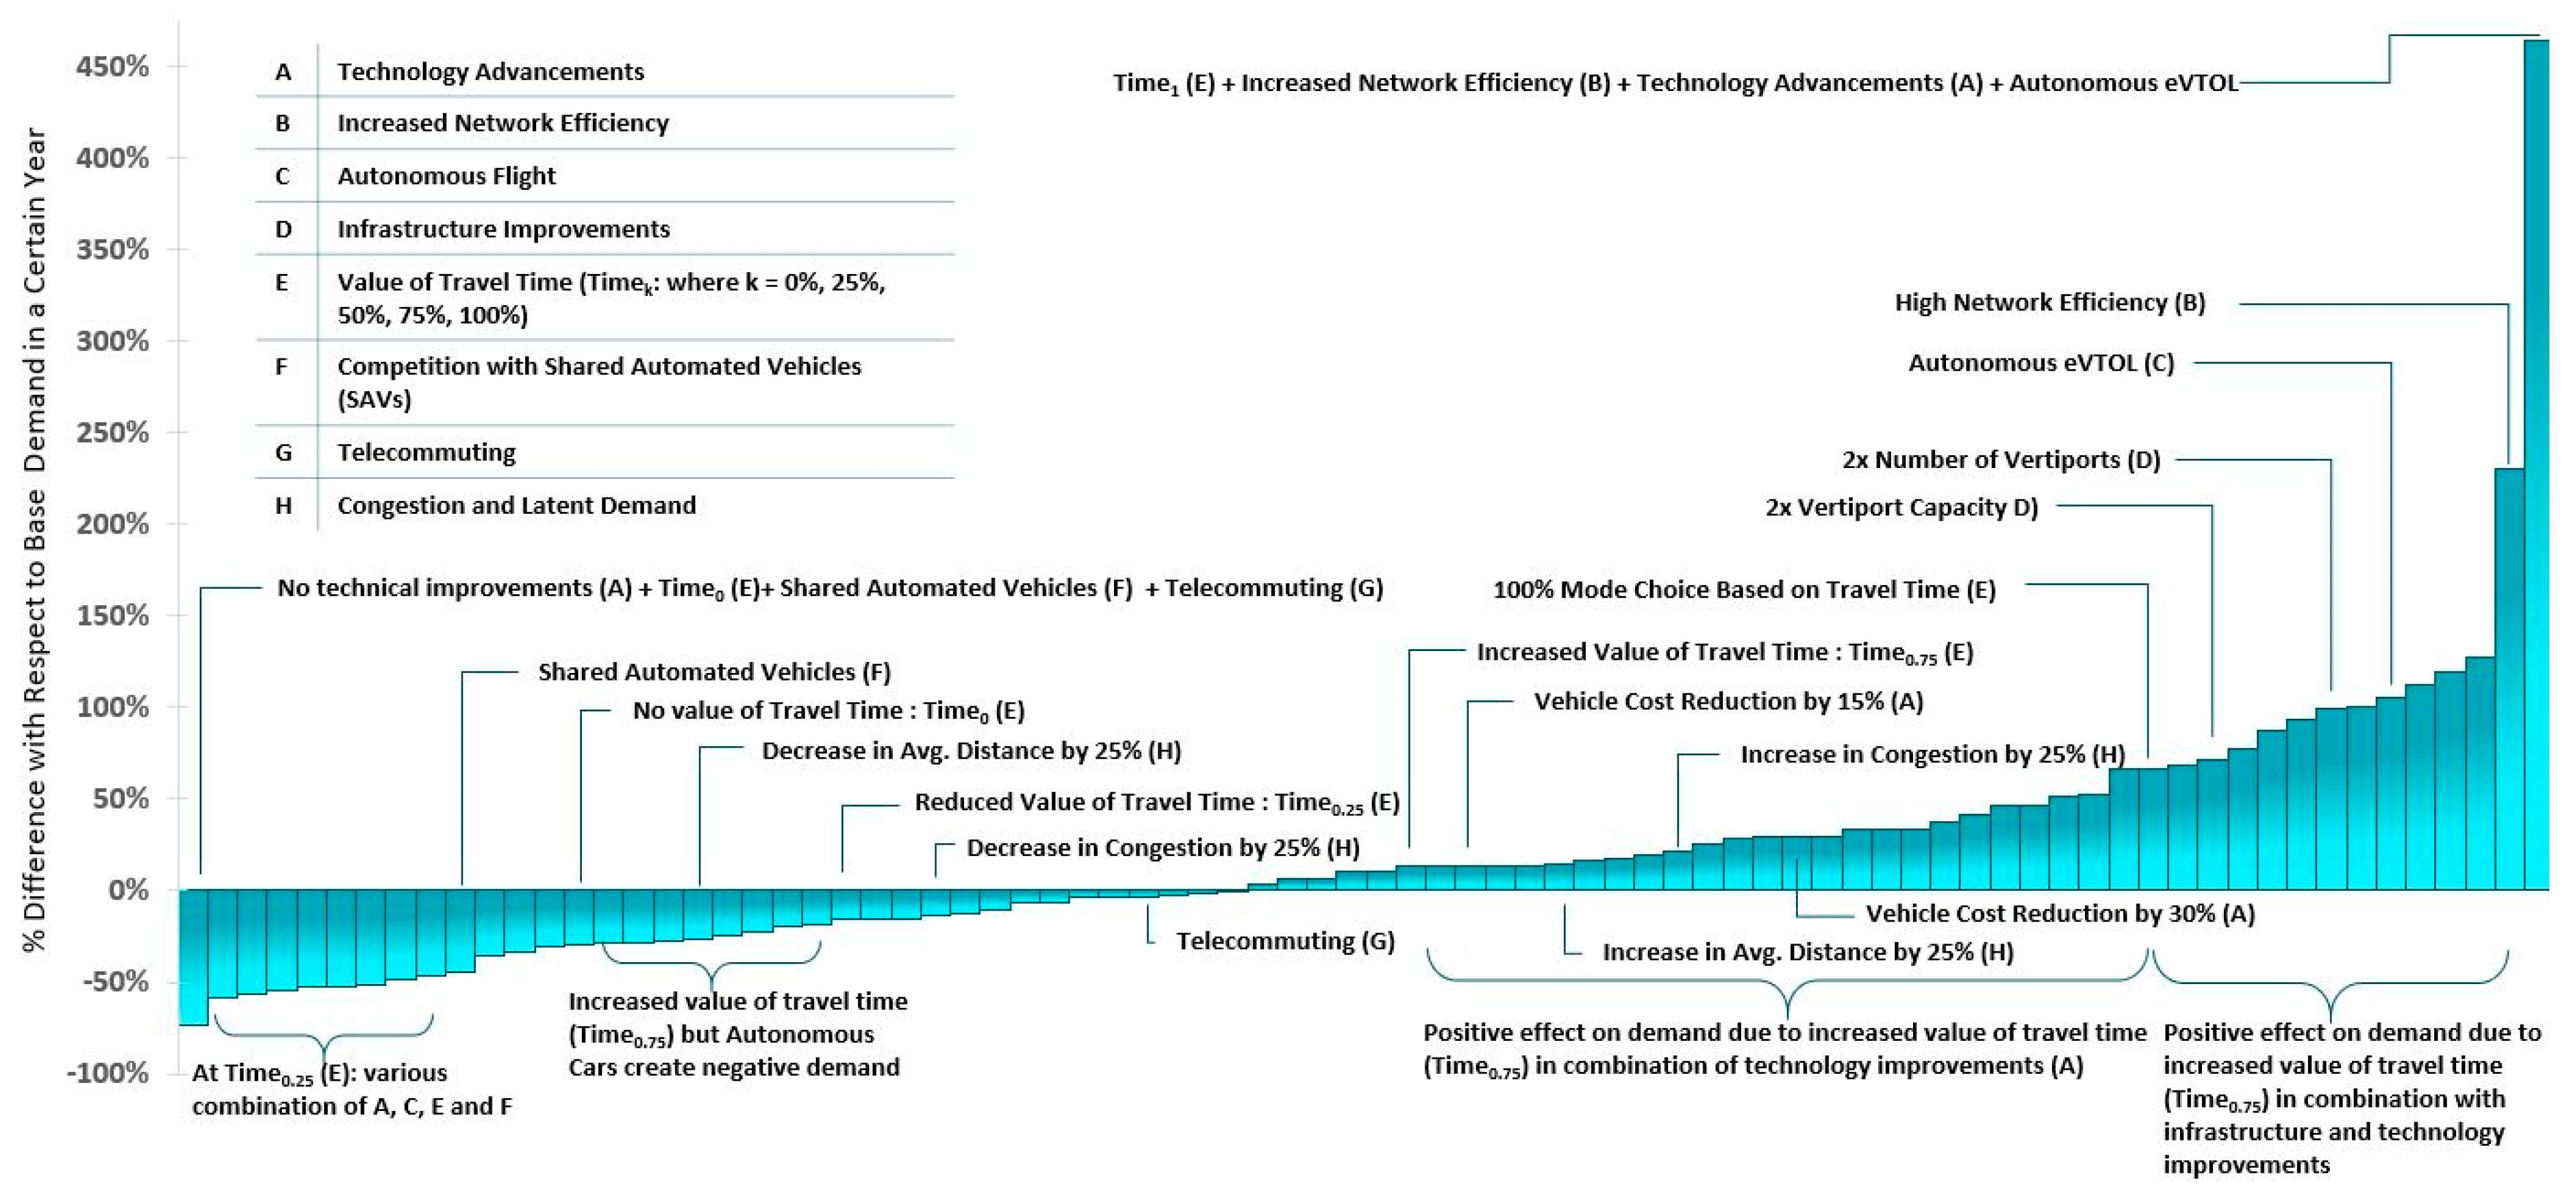
- In the final step, the authors performed a Monte Carlo sensitivity analysis to better understand the impact of these challenges and various assumptions on market size and viability. To do this, the authors simulated 10,000 randomly generated air taxi missions for each urban area. Eight scenarios were developed based on the current and future states of the air taxi system, including decisions by key stakeholders.
3.1. Operational Assumptions
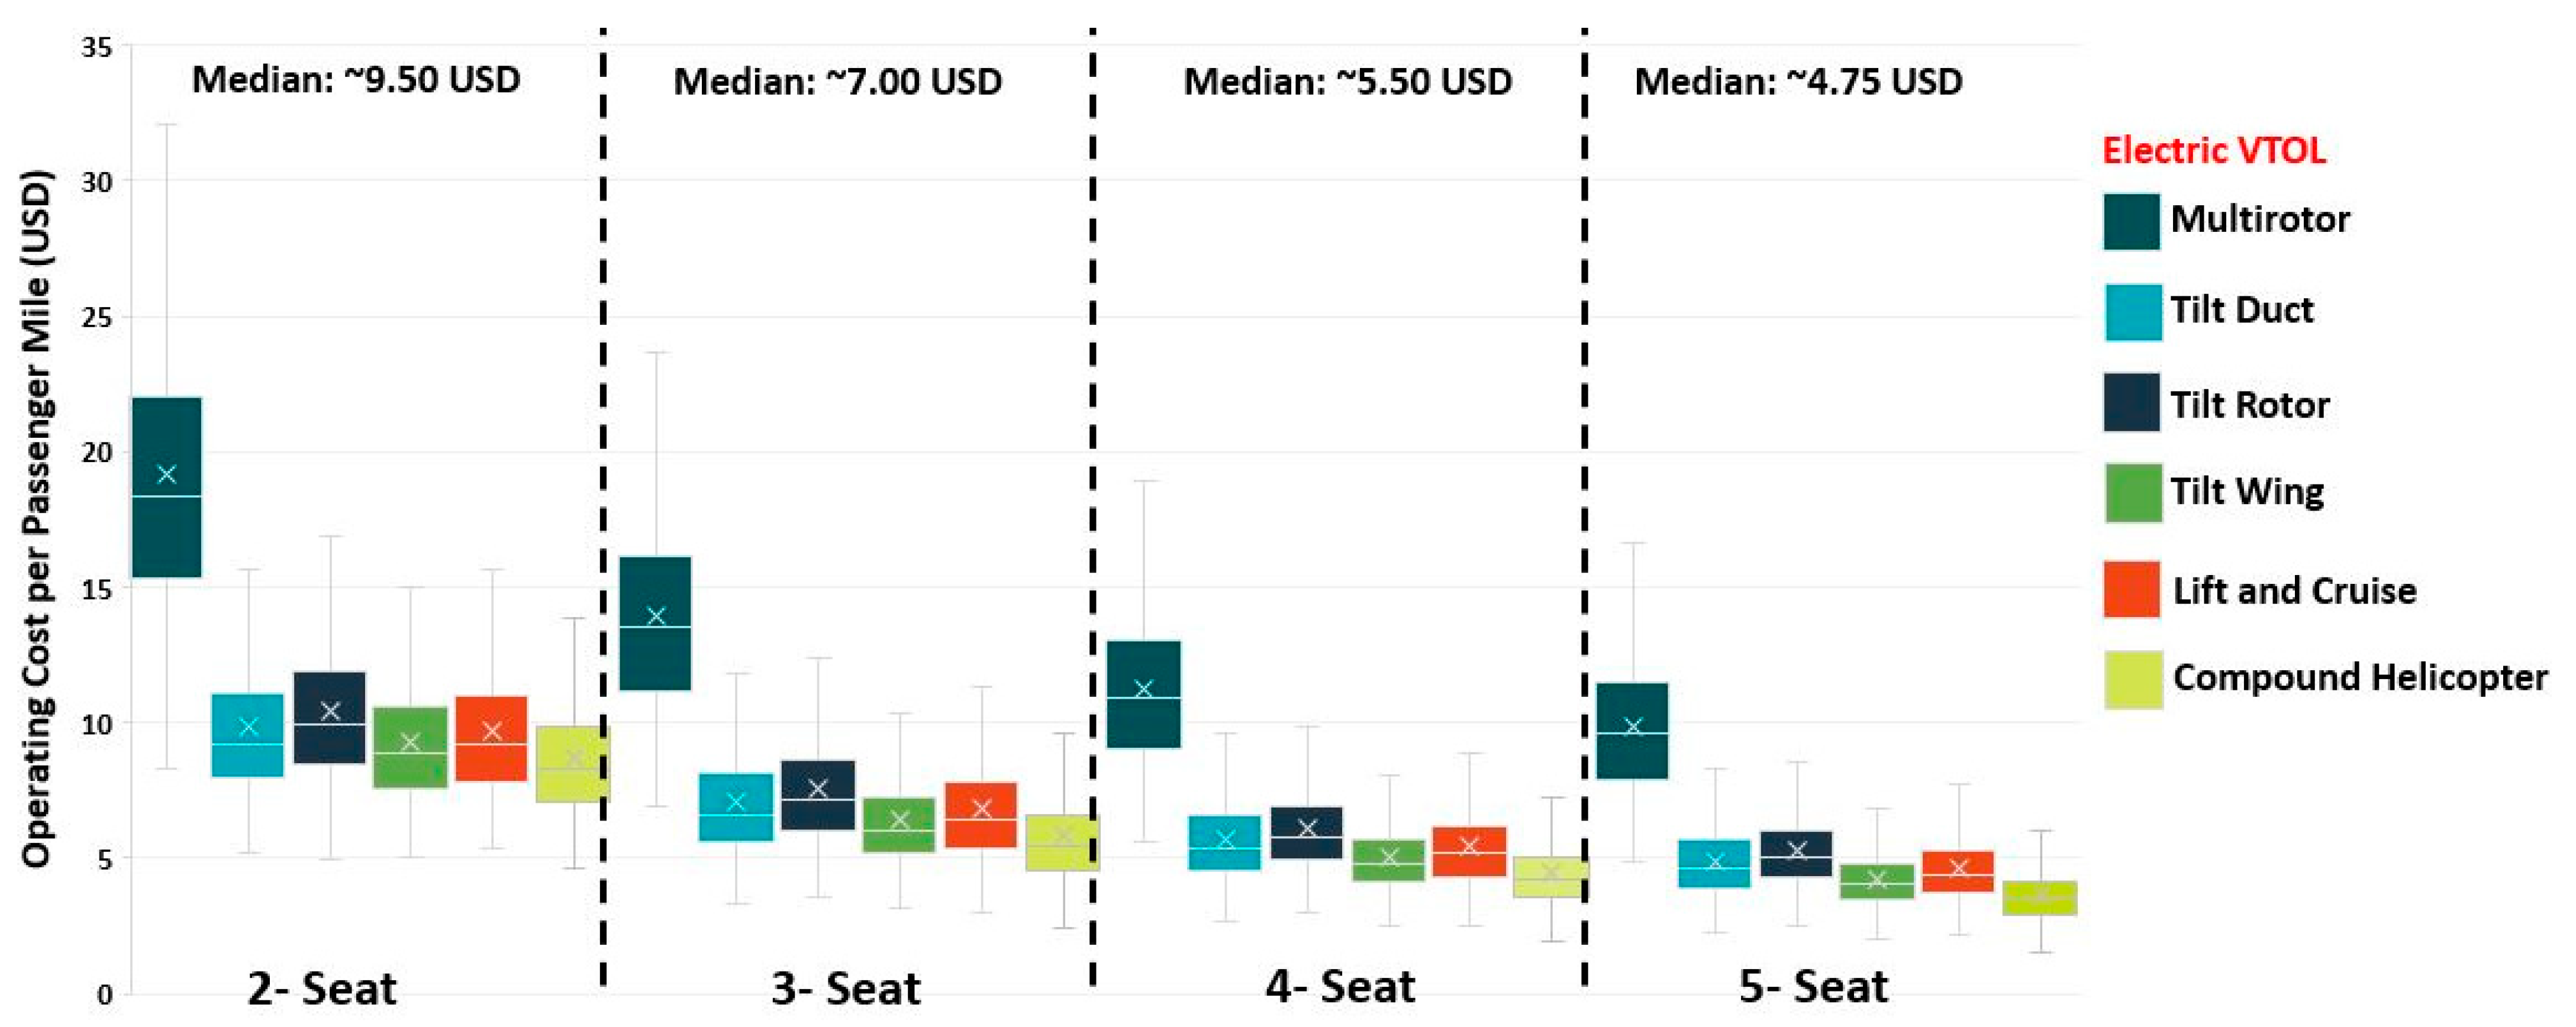
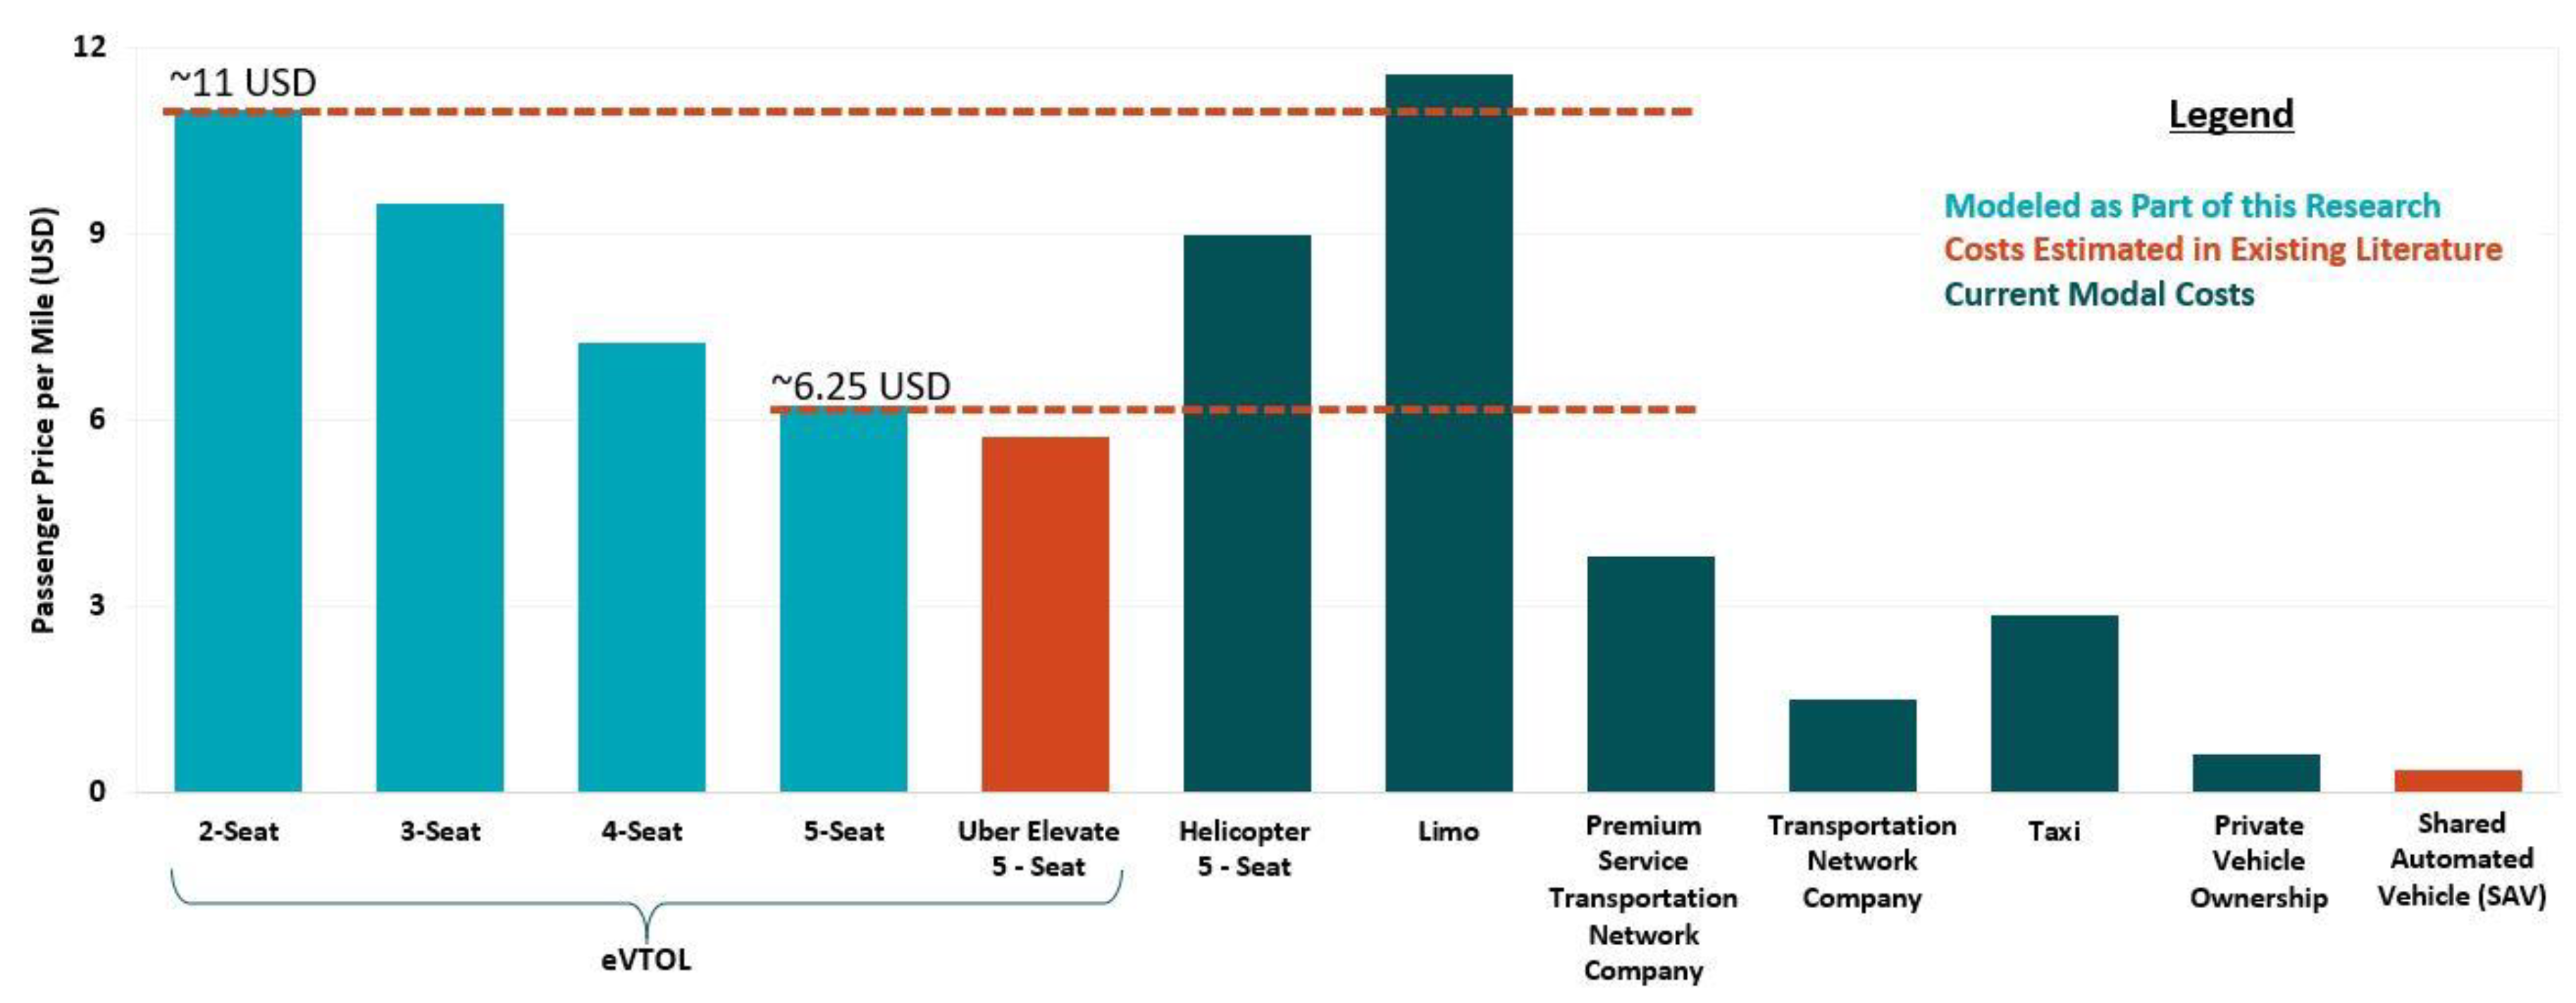
3.2. Price Per Passenger Mile
- (1)
- Multirotor-a rotorcraft with more than two rotors (e.g., Ehang and Volocopter).
- (2)
- Autogyro-a type of rotorcraft, which use an unpowered rotor in free autorotation to develop lift (e.g., Carter).
- (3)
- Conventional helicopter—a type of rotorcraft in which lift and thrust are supplied by rotors (e.g., Robinson R22).
- (4)
- Tilt duct—a eVTOL in which a propeller is inside a duct to increase thrust (e.g., Lilium Jet).
- (5)
- Coaxial rotor—a design with rotors mounted one above the other (e.g., GoFly).
- (6)
- Lift + cruise—a design that has independent thrusters for cruise and lift (e.g., Aurora Flight Sciences).
- (7)
- Tilt wing—an aircraft that uses a wing that is horizontal for conventional forward flight and rotates up for vertical takeoff and landing (e.g., A3 Vahana).
- (8)
- Compound helicopter—a design with a helicopter rotor-like system and one or more conventional propellers to provide forward thrust during cruising flight (e.g., HopFlyt).
- (9)
- Tilt rotor—an aircraft type that generates lift and propulsion by way of one or more powered rotors mounted on rotating engine pods or nacelles (e.g., Joby Aviation).
3.3. AAM Travel Demand Model
- Step 1.
- Trip generation is the first step in demand modeling and estimates the number of trips that are produced. For this step, the model was calibrated using the U.S. Department of Transportation data on mandatory trips (e.g., work-related) and discretionary trips (e.g., retail, leisure, etc.). For the air taxi analysis, works trips were generated using 2016 American Community Survey (ACS) commuting data and discretionary trips were generated using 2017′s National Travel Household Survey (NTHS) data. For the airport shuttle analysis, 2018 U.S. Bureau of Transportation Statistics (BTS) T-100 Market (All Carriers) data was used. Airport-specific trips were generated by proportionally distributing daily demand from each airport in an urban area to each census tract based on its population.
- Step 2.
- Scoping was performed using ACS datasets available at different geographic levels (block groups, census tracts, place, county, and urban area) for various mode types. Temporal resolution of the datasets was limited to an average day of year. The authors first performed a tradeoff analysis between fidelity in results and computational speed for different combinations of geographic levels and mode types. The analysis was then conducted at a census tract level for mode types classified as driving, TNCs, taxi, public transportation, and walking. Next, the authors assumed that no new infrastructure would be constructed prior to early AAM operations. Existing infrastructure (i.e., heliports and airports) were obtained from the FAA’s Aviation Environment Design Tool (AEDT) database. Capacity enhancements, such as additional vertiports and increased capacity per vertiports were evaluated in the Monte Carlo sensitivity analyses. Next, infrastructure was assigned to each census tract using a nearest neighbor algorithm. For the airport shuttle market, not all passengers arriving or departing at a major airport were considered potential customers of AAM because of various limitations, such as travel characteristics. For example, a family of four traveling a long distance with over 200 lbs. of baggage would be unlikely to use AAM, because of the high cost compared to other alternatives such as a rental car, and technically unable to use one AAM aircraft (because of performance limitations). Therefore, demand for the airport shuttle analysis focused on one to three passengers per air ticket.
- Step 3.
- Trip distribution was performed by distributing trips between census tracts (origin–destination pairs) using a simplified gravity model assuming equal likelihood of individual trip interchanges between the tracts. All the trips where AAM total travel time was greater than the travel time for ground transportation were not considered for further analysis.
- Step 4.
- Mode choice modeling was used to predict traveler mode choice while completing a trip. Air taxi and airport shuttle services were modeled to compete with personal cars, taxi, TNCs, and public transportation. Next, a utility function was developed based on two key attributes that influence choice of mode (i.e., travel time and travel cost per median household income per hour). Coefficients of the utility function were calibrated by fitting a logit model to the data generated using the 2016 American Community Survey. Having calibrated the utility function, a probabilistic choice model, the multinomial logit model (MNL), was selected to describe the preferences and choice of a user in terms of probabilities of choosing each alternative rather than predicting that an individual will choose a particular mode with certainty.
- Step 5.
- Constraints based on existing data were applied based on passenger’s willingness to pay (obtained from [23]) using a stated preference survey (n = 1722) in five U.S. cities), infrastructure availability and capacity, time of day, and visual flight rules operation restrictions. The process of applying constraints is show in Figure 6.
4. Findings and Discussion
4.1. Scenarios
4.2. Limitations
5. Conclusions
Author Contributions
Funding
Acknowledgments
Conflicts of Interest
References
- Cohen, A.; Shaheen, S.; Farrar, E. Urban Air Mobility: History, Ecosystem, Market Potential, and Challenges. IEEE Trans. Intell. Transp. Syst. 2021, 1–14. [Google Scholar] [CrossRef]
- Reich, C.; Goyal, R.; Cohen, A.; Serrao, J.; Kimmel, S.; Fernando, C.; Shaheen, S. Urban Air Mobility Market Study; National Aeronautics and Space Administration: Washington, DC, USA, 2018; pp. 1–163. Available online: https://ntrs.nasa.gov/citations/20190001472 (accessed on 25 June 2021).
- McKinsey & Company. Urban Air Mobility (UAM) Market Study; National Aeronautics and Space Administration: Washington, DC, USA, 2018; pp. 1–56.
- Grandl, G.; Ostgathe, M.; Cachay, J.; Doppler, S.; Salib, J.; Ross, H. The Future of Vertical Mobility: Sizing the Market for Passenger, Inspection, and Goods Services Until 2035; Porsche Consulting: Stuttgart, Germany, 2018; pp. 1–36. [Google Scholar]
- Morgan Stanley Research. Are Flying Cars Preparing for Takeoff; Morgan Stanley: New York City, NY, USA, 2019; Available online: https://www.morganstanley.com/ideas/autonomous-aircraft (accessed on 25 June 2021).
- Herman, E.; Dyment, M. Urban Air Mobility Study Prospectus; Nexa Advisors: McLean, VA, USA, 2019; pp. 1–32. Available online: https://www.nexaadvisors.com/uam-global-markets-study (accessed on 25 June 2021).
- Becker, K.; Terekhov, I.; Niklaß, M.; Gollnick, V. A Global Gravity Model for Air Passenger Demand between City Pairs and Future Interurban Air Mobility Markets Identification. In Proceedings of the 2018 Aviation Technology, Integration, and Operations Conference, Atlanta, GA, USA, 24 June 2018. [Google Scholar] [CrossRef] [Green Version]
- Mayor, T.; Anderson, J. Getting Mobility Off the Ground; KPMG: Atlanta, GA, USA, 2019; pp. 1–12. Available online: https://institutes.kpmg.us/content/dam/advisory/en/pdfs/2019/urban-air-mobility.pdf (accessed on 26 June 2021).
- Lineberger, R.; Hussain, A.; Silver, D. Advanced Air Mobility. Can the United States afford to lose the race? Deloitte. 2021. Available online: https://www2.deloitte.com/us/en/insights/industry/aerospace-defense/advanced-air-mobility.html?id=us:2el:3pr:4diER6839:5awa:012621:&pkid=1007244 (accessed on 25 June 2021).
- Robinson, J.; Sokollek, M.-D.; Justin, C.; Mavris, D. Development of a Methodology for Parametric Analysis of STOL Airpark Geo-Density. In Proceedings of the AIAA 2018 Aviation, Technology, Integration, and Operations Conference, Atlanta, GA, USA, 25–29 June 2018. [Google Scholar] [CrossRef]
- Mayakonda, M.; Justin, C.; Anand, A.; Weit, C.; Wen, J.; Zaidi, T.; Mavris, J. A Top-Down Methodology for Global Urban Air Mobility Demand Estimation. In Proceedings of the AIAA Aviation 2020 Forum, Virtual, 15–19 June 2020. [Google Scholar] [CrossRef]
- Antcliff, K.R.; Moore, M.D.; Goodrich, K.H. Silicon Valley as an Early Adopter for on Demand Civil VTOL Operations. In Proceedings of the 16th AIAA Aviation Technology, Integration, and Operations Conference, Washington, DC, USA, 13 June 2016. [Google Scholar] [CrossRef] [Green Version]
- Skabardonis, A.; Varaiya, P.; Petty, K.F. Measuring Recurrent and Nonrecurrent Traffic Congestion. Transp. Res. Rec. J. Transp. Res. Board 2003, 1856, 118–124. [Google Scholar] [CrossRef]
- Yedavalli, P.; Cohen, A. Planning and Designing Land-Use Constrained Networks of Urban Air Mobility Infrastructure. Transp. Res. Rec. J. Transp. Res. Board.
- Wei, L.; Justin, C.Y.; Briceno, S.I.; Mavris, D.N. Door-to-Door Travel Time Comparative Assessment for Conventional Transportation Methods and Short Takeoff and Landing on Demand Mobility Concepts. In Proceedings of the 2018 Aviation Technology, Integration, and Operations Conference, Atlanta, GA, USA, 25 June 2018. [Google Scholar] [CrossRef]
- Roland Berger. Urban Air Mobility: The Rise of a New Mode of Transportation. 2018. Available online: https://www.rolandberger.com/en/Insights/Publications/Passenger-drones-ready-for-take-off.html (accessed on 25 June 2021).
- Swadesir, L.; Bil, C. Urban Air Transportation for Melbourne Metropolitan Area. In Proceedings of the AIAA Aviation 2019 Forum, Dallas, TX, USA, 17 June 2019. [Google Scholar] [CrossRef]
- Rothfeld, R.; Balac, M.; Ploetner, K.O.; Antoniou, C. Agenct-Based Simulation of Urban Air Mobility. In Proceedings of the 2018 Aviation Technology, Integration, and Operations Conference, Atlanta, GA, USA, 25–29 June 2019. [Google Scholar] [CrossRef] [Green Version]
- Kreimeier, M.; Strathoff, P.; Gottschalk, D.; Stumpf, E. Economic Assessment of Air Mobility On-Demand Concepts. J. Air Transp. 2018, 23–36. [Google Scholar] [CrossRef]
- Fu, M.; Rothfeld, R.; Antoniou, C. Exploring preferences for transportation modes in an urban air mobility environment: Munich case study. Transp. Res. Rec. J. Transp. Res. Board 2019, 2673, 427–444. [Google Scholar] [CrossRef] [Green Version]
- Al Haddad, C.; Chaniotakis, E.; Straubinger, A.; Plötner, K.; Antoniou, C. Factors affecting the adoption and use of urban air mobility. Transp. Res. Part A Policy Pract. 2020, 132, 696–712. [Google Scholar] [CrossRef]
- Reiche, C.; Cohen, A.; Fernando, C. An Initial Assessment of the Potential Weather Barriers of Urban Air Mobility. IEEE Trans. Intell. Transp. Syst. 2021, 1–10. [Google Scholar] [CrossRef]
- Shaheen, S.; Cohen, A.; Farrar, E. The Potential Societal Barriers of Urban Air Mobility; National Aeronautics and Space Administration: Washington, DC, USA, 2018; pp. 1–115. [CrossRef]
| Parameter | Definition | Minimum | Maximum |
|---|---|---|---|
| Aircraft seats (passenger seats = aircraft seats − 1) | Number of seats in aircraft. Initial years of operation assumed a pilot on-board, hence there was one seat less available to be occupied by a passenger. | 1 | 5 |
| Load factor (%) | Passenger load factor, which measures the utilization of the capacity of the eVTOL, i.e., the number of seats occupied by a revenue passenger divided by the total number of available seats. | 50% | 80% |
| Utilization (annual number of flights) for 2+ seat aircraft (number of flight hours per year) | Average numbers of hours in a year that an aircraft was actually in flight. Conservative utilization numbers were used to consider battery recharging/swapping times. | 1000 | 2000 |
| Utilization (annual number of hours) for 2-seat aircraft (number of flight hours per year) | For 2-seat aircraft (only one passenger seat), the aircraft was only flown when the passenger seat was filled. Therefore, the utilization range was adjusted by multiplying with the load factor of a 2+ seat aircraft, i.e., 1000 × 50%, 2000 × 80%. | 500 | 1600 |
| Max reserve (mins) | Flight time for reserve mission (outside of mission time) at a specified altitude. | 20 | 30 |
| Deadhead trips (%) | Ratio of non-revenue trips and total trips. | 25% | 50% |
| Detour factor (%) | Factor that captures the lateral track inefficiencies equal to the ratio of actual flight distance divided by the great circle distance between two vertiports. | 5% | 15% |
| Cruise altitude (ft) | Cruise altitude for AAM vehicles. | 500 | 5000 |
| Embarkation time (mins) | Time spent in the process of loading AAM vehicle with passengers and preparing them for flight. | 3 | 5 |
| Disembarkation time (mins) | Time required for passengers to disembark the AAM vehicle after the flight. | 2 | 3 |
| Battery depth of discharge (%) | Referred to the degree to which a battery was discharged in relation to its total capacity. | 50% | 80% |
| Cost Component | Key Steps | Key Assumptions | ||
|---|---|---|---|---|
| Parameter | Min | Max | ||
| Capital and insurance cost |
| Vehicle life (flight hours) | 12 k | 15 k |
| Depreciation rate (%) | 5% | 10% | ||
| Finance rate (%) | 5% | 10% | ||
| Energy and battery cost |
| Battery specific energy in Wh/kg | 300 | 400 |
| Battery capacity specific cost (USD/kWh) | 200 | 250 | ||
| Energy conversion efficiency (%) | 90% | 98% | ||
| Crew cost |
| Pilot salary per year (USD) | 50 k | 90 k |
| Ground crew salary per year (USD) | 20 k | 30 k | ||
| Infrastructure cost |
| Cost of one supercharger (USD) | 200 k | 300 k |
| Cost of one regular charger (USD) | 10 k | 20 k | ||
| Maintenance cost |
| Mechanic wrap rate (USD per hour) | 60 | 100 |
| Maintenance manhours per flight hour | 0.25 | 1 |
| Daily Trips | Daily Passengers | Total Number of Aircraft | Annual Market Valuation (Billion USD) | |
|---|---|---|---|---|
| Unconstrained | 11,000,000 | 16,000,000 | 850,000 | 500 |
| Willingness to pay constraint | 8,800,000 | 13,000,000 | 680,000 | 400 |
| Infrastructure constraint | 1,000,000 | 1,500,000 | 80,000 | 45 |
| Infrastructure capacity constraint | 80,000 | 120,000 | 6000 | 3.6 |
| Time of day constraint | 60,000 | 90,000 | 4500 | 2.75 |
| Weather constraint | 55,000 | 82,000 | 4100 | 2.5 |
| Scenario Name | Description |
|---|---|
| Technology advancements | This scenario estimated a reduction in aircraft costs due to falling battery prices and increasing aircraft production. This scenario forecasted a reduction in battery costs to 100–150 USD per kWh by 2025, with a 10 USD per kWh annual reduction. Additionally, this scenario assumes the cost of aircraft production is reduced by ~15% every 5 years by doubling production. |
| Increased network efficiency | This scenario assumed increasing network efficiency by (1) increasing aircraft utilization from ~4 h a day to ~7 h a day due to battery and charging improvements, (2) increasing load factors from ~65% to 80%, and (3) reducing deadhead trips from ~37.5% to ~20%. |
| Autonomous flight | This scenario assumed an on-board pilot is no longer needed, allowing each aircraft additional passenger capacity. Additional ground staff were added for safety briefings and passenger boarding. |
| Infrastructure improvements | This scenario estimated an increase in the number of vertiports and capacity, the latter enabled through improvements in air traffic management (i.e., unmanned traffic management (UTM)). This scenario doubled the number of vertiports and the operational capacity every five years to model these improvements. |
| Value of travel time | Increased productivity while traveling may result in a decrease in the value of travel time, thereby affecting the demand of AAM. This scenario evaluated the importance of travel time by introducing a significance factor in the utility function varying between 0 and 1. “0” represents no importance to travel time, and the user was expected to choose the mode entirely based on price, comfort, etc. |
| Competition with shared automated vehicles (SAVs) | This scenario examined the potential impacts of the adoption of SAVs on AAM passenger demand, based on a penetration rate of 0.5% and 10% in 2025 and 2035, respectively. The scenario assumed an average vehicle occupancy of ~65% (comparable to AAM) and a cost of 0.90 USD per passenger mile, which is approximately 35% less than private vehicle ownership. |
| Telecommuting | This scenario estimated the impacts of the growth of telecommuting on AAM passenger demand using a forecast longitudinal telecommuting growth rate of approximately ~10% annually. |
| Congestion and latent demand | Passenger AAM has the potential to contribute to new mobility patterns, such as de-urbanization and induced demand (because of the potential of reduced travel times), which encourages more people to use the service. Using a parametric analysis by varying average distances for each trip by −25% to +25% at an interval of 10%, this scenario estimated the potential impacts of induced demand. Note, a negative percentage indicates increased urbanization. In some cases, pooling and increased access to public transportation could also cause a reduction in congestion. This was explored by varying the average driving speed by −25% to 25% at an interval of 10%. A negative percent indicates increased congestion. |
Publisher’s Note: MDPI stays neutral with regard to jurisdictional claims in published maps and institutional affiliations. |
© 2021 by the authors. Licensee MDPI, Basel, Switzerland. This article is an open access article distributed under the terms and conditions of the Creative Commons Attribution (CC BY) license (https://creativecommons.org/licenses/by/4.0/).
Share and Cite
Goyal, R.; Reiche, C.; Fernando, C.; Cohen, A. Advanced Air Mobility: Demand Analysis and Market Potential of the Airport Shuttle and Air Taxi Markets. Sustainability 2021, 13, 7421. https://doi.org/10.3390/su13137421
Goyal R, Reiche C, Fernando C, Cohen A. Advanced Air Mobility: Demand Analysis and Market Potential of the Airport Shuttle and Air Taxi Markets. Sustainability. 2021; 13(13):7421. https://doi.org/10.3390/su13137421
Chicago/Turabian StyleGoyal, Rohit, Colleen Reiche, Chris Fernando, and Adam Cohen. 2021. "Advanced Air Mobility: Demand Analysis and Market Potential of the Airport Shuttle and Air Taxi Markets" Sustainability 13, no. 13: 7421. https://doi.org/10.3390/su13137421
APA StyleGoyal, R., Reiche, C., Fernando, C., & Cohen, A. (2021). Advanced Air Mobility: Demand Analysis and Market Potential of the Airport Shuttle and Air Taxi Markets. Sustainability, 13(13), 7421. https://doi.org/10.3390/su13137421


