Article

Effect of Climate Variability on Green and Blue Water Resources in a Temperate Monsoon Watershed, Northeastern China

1
School of Geography, Liaoning Normal University, Dalian 116029, China
2
Institute of Marine Sustainable Development, Liaoning Normal University, Dalian 116029, China
*
Author to whom correspondence should be addressed.
These authors contributed equally to this work and should be considered co-first authors.
Sustainability 2021, 13(4), 2193; https://doi.org/10.3390/su13042193
Submission received: 6 January 2021 / Revised: 4 February 2021 / Accepted: 7 February 2021 / Published: 18 February 2021

Abstract

:
Over 80% of global grain production relies on green water, water from precipitation that is stored in unsaturated soil and supports plant growth. Blue water, precipitation that turns into surface water and groundwater, is also a vital surface water resource, and it can be directly utilized. The Tanghe River Basin is a typical temperate continental monsoon watershed in Northern China where residents and crops rely on blue and green water resources. In this study, the spatiotemporal distributions of water resources in the Tanghe River Basin were simulated using the soil and water assessment tool (SWAT) model for the period between 1970 and 2015. The results demonstrate that the Nash–Sutcliffe efficiency and coefficient of determination were both higher than 0.64 during the calibration and validation periods at all hydrological stations, indicating high simulation accuracy. The average annual water resources of the Tanghe River Basin are 759.37 mm. Green and blue water account for 68% and 32% of the total water resources, respectively. The study period was divided into the reference period (1970–1976) and the variation period (1977–2015), to explore the impact of climate change on the green and blue water resources of the Tanghe River Basin water resources. Compared with the reference period, the average green and blue water resources in the variation period decreased by 78.48 and 35.94 mm/year, and their rate changes were −13.45% and −13.17%, respectively. The water resource relative change rates were high in the south and low in the north, and they were predominantly affected by precipitation. This study improves our understanding of the hydrological processes as well as the availability of blue and green water in the study region, and can prove beneficial in promoting the sustainable development of small basins and the integrated watershed management in areas with similar climatic conditions.

1. Introduction

Water is vital to people and ecosystems. As the global economy and population have grown, human demand for water resources has also increased, affecting the health of the global ecosystem [1,2,3,4]. Due to this ongoing competition between humans and the environment for water resources, the availability of water resources must be comprehensively assessed to deepen our understanding of renewable water sources and realize sustainable, effective, and fair water resource management [5,6]. In the current literature, considerable attention has been paid to blue water resources, which are generated by surface and underground runoff. However, green water resources have been gaining attention in recent years. The concept of green water was first proposed by Falkenmark in 1995 [7]. Green water resources refer to the water from precipitation that is stored in unsaturated soil and supports plant growth. Green water can be classified into two components: green water flow, which refers to actual evapotranspiration, and green water storage, which refers to water stored in the soil [8]. It plays a critical role in preserving the production and service functions of land ecosystems. Green water resources account for the vast majority of water resource utilization; over 80% of the water used by global food production and forest grasslands is green water [9,10]. Climate change greatly impacts the hydrological cycle and green water resources in basins [11], and it is primarily reflected by changes in rainfall, temperature, and other meteorological elements. Therefore, determining the relationships between the ecological and hydrological processes of green and blue water resources by studying their spatiotemporal changes, mitigating the limitations of available water resources [12], and evaluating water resources in a comprehensive scientific manner is significant for water resource planning and management.
There are currently three primary evaluation method types for green water resources: hydrological, biological, and bio-hydrological approaches [13]. The hydrological model established by the hydrology method evaluates the spatial distribution changes of green and blue water resources in a basin; therefore, it has been widely utilized by scholars worldwide. The predominant global hydrological models include the hydrological land-use change, agricultural catchment research unit, and soil and water assessment tool (SWAT) models.
Modeling can be used to represent natural conditions and as a reference for additional. Models can also inform researchers and policymakers about the original state of a river basin for decision-making. The SWAT model is particularly utilized due to its high efficiency, high precision, long simulation cycles, and ease of operation for simulating watershed hydrology [14]. Thus, we selected this model for our study. Studies on blue and green water resources using the SWAT have been extensively conducted by various authors worldwide, including in Africa [15,16,17,18], Europe [19], and Asia [20,21,22]. These study types can provide a scientific basis for the planning and management of water resources.
The objective of this study was to establish the natural hydrological cycle process and quantify the spatiotemporal dynamics of green and blue water under the natural conditions of the Tanghe River Basin using the SWAT model. The Tanghe River Basin exhibits a temperate continental monsoon climate and is an important grain-producing area in Liaoning Province in Northern China. The Tanghe Reservoir in the basin is an essential source of drinking water for Liaoyang and Anshan. Many studies have been conducted on the water quality and surface water resources of the Tanghe River Basin; however, few studies have focused on the green water resources, which account for the greatest proportion of farmland water consumption. Therefore, it is necessary to study blue and green water in the Tanghe River basin to provide a scientific basis for the rational allocation and management of water resources in the basin.

2. Materials and Methods
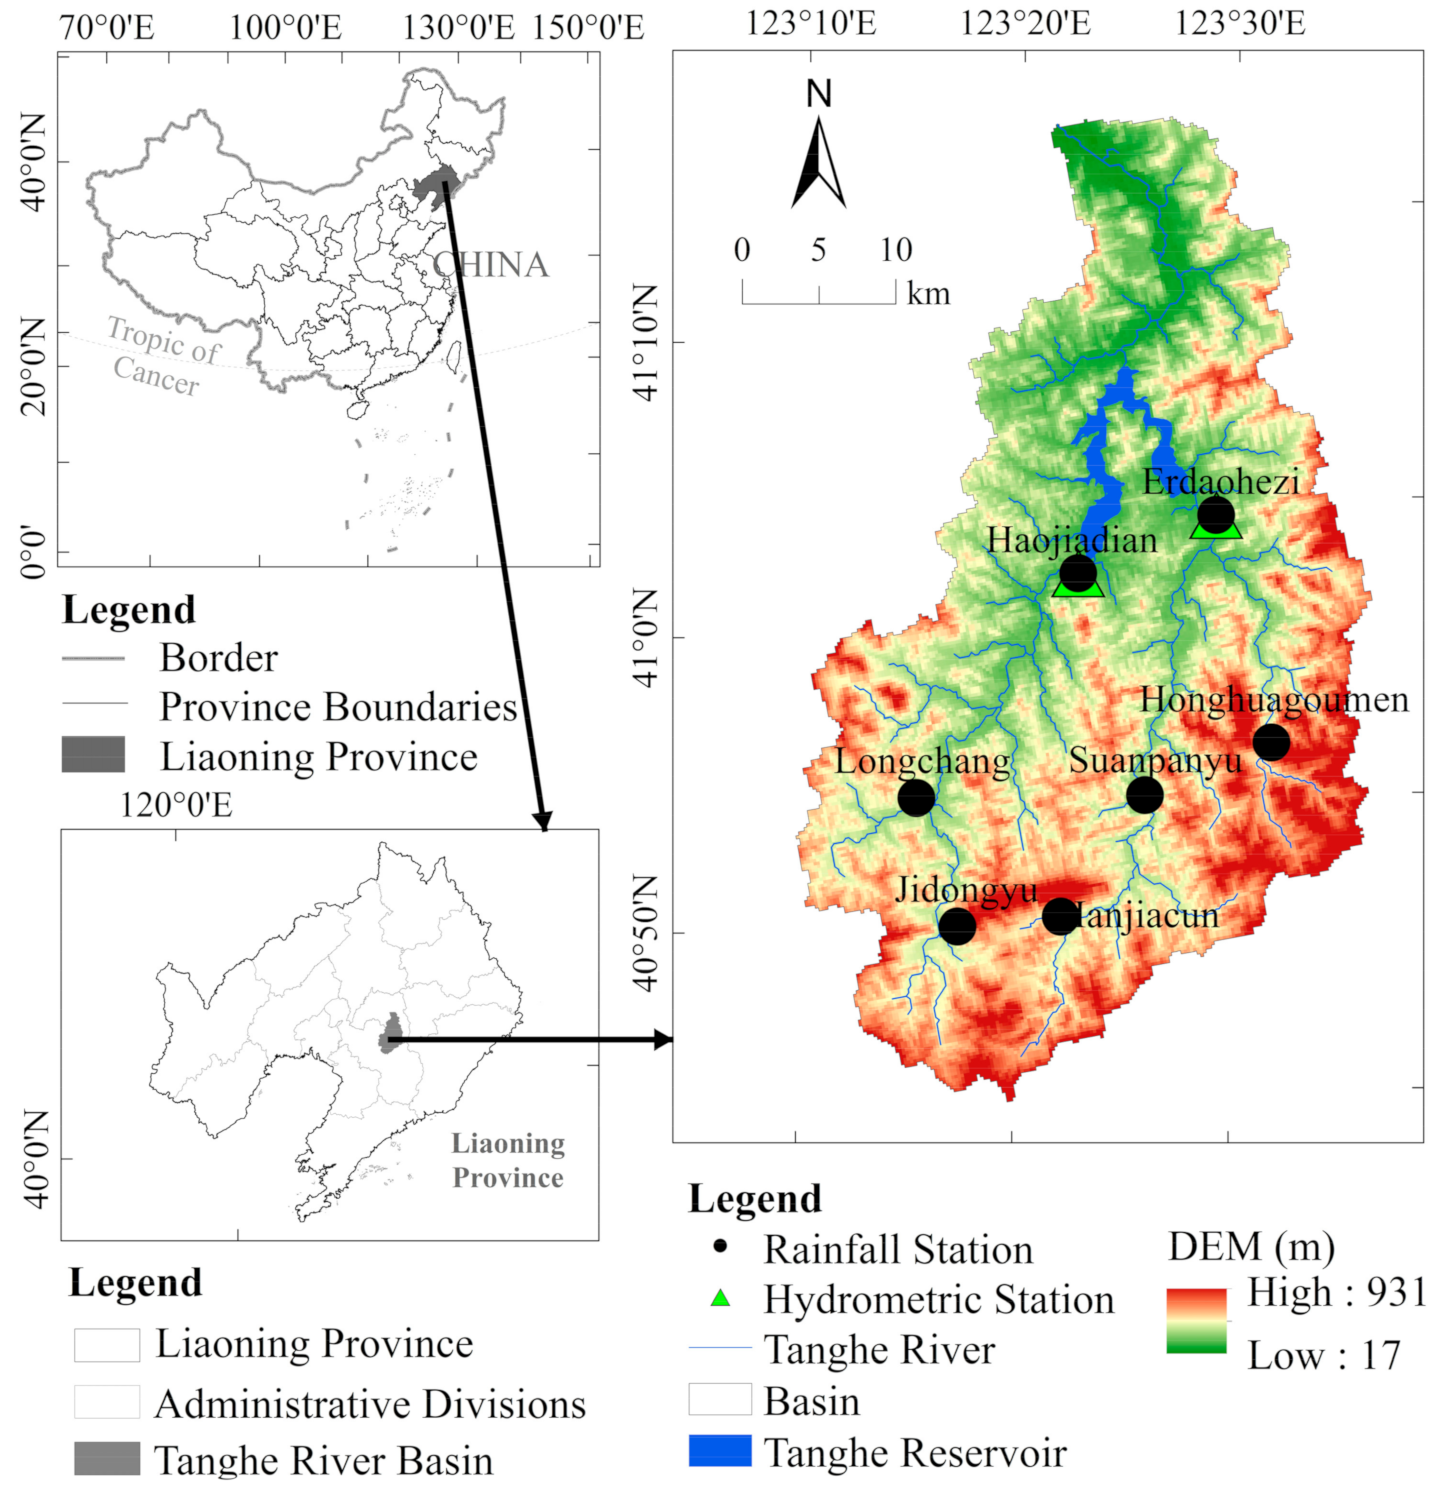
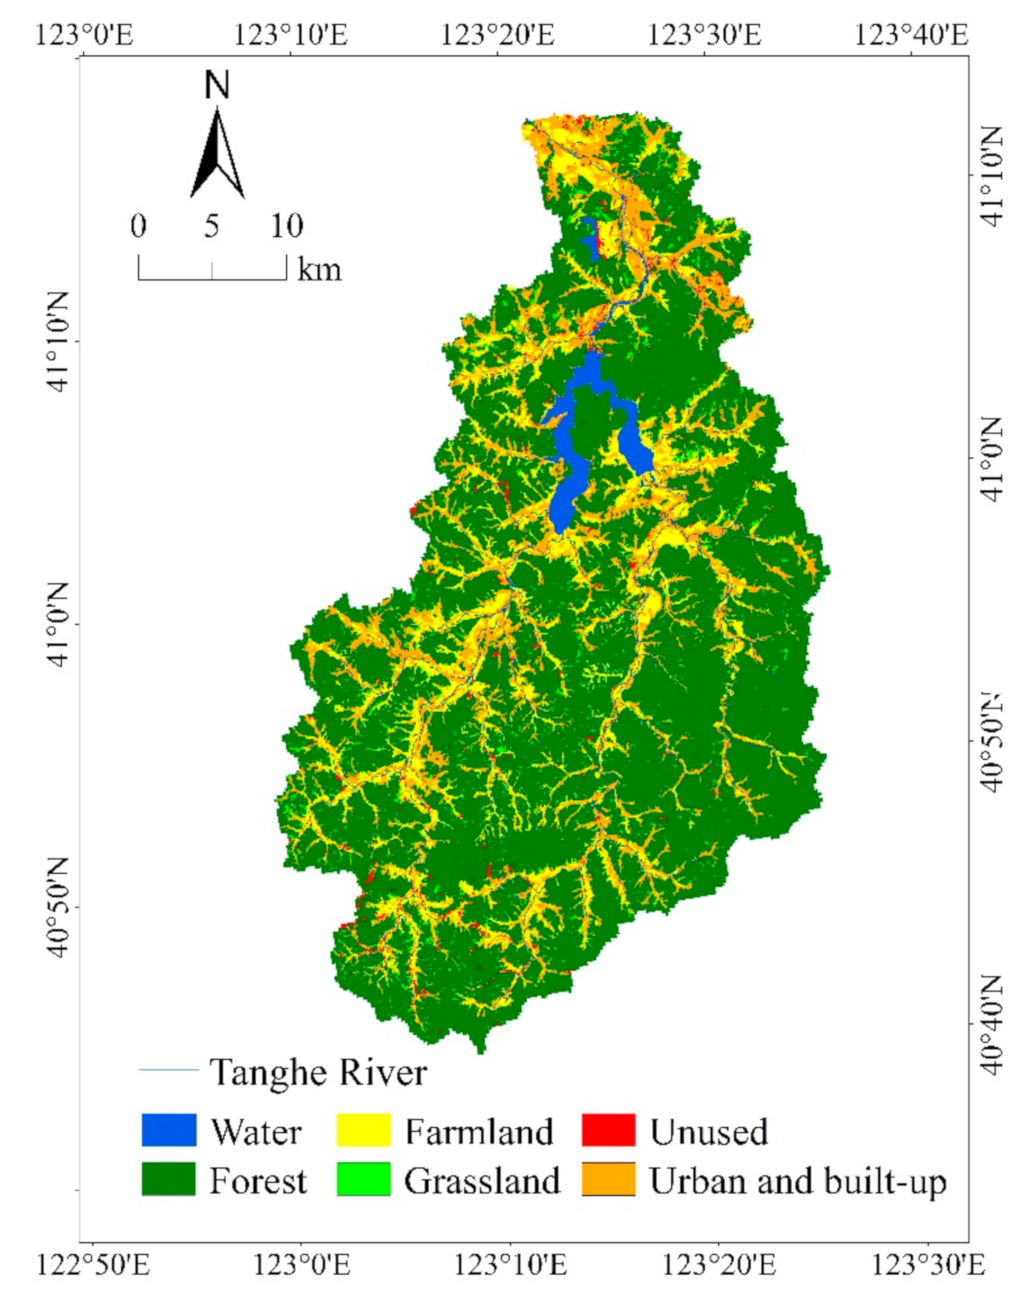
2.1. Study Area

The Tanghe River is the largest tributary of the Taizi River Basin, and it is located in Liaoning Province, China at 40°43′–41°16′ N, 123°03′–123°31′ E. Upstream of the river basin is divided into east and west tributaries, which flow into the Tanghe Reservoir through Anping and Gengjiatun and then into the Taizi River at Xishuangmiao Village in Xiaotunzhen. The river is 90.7 km in length, and the river basin covers an area of approximately 1466 km2 (Figure 1). The Tanghe River Basin is located in a temperate monsoon climate zone, with two distinct seasons: hot and rainy in the summer, and cold and dry in the winter. The annual temperature ranges from −17 to 29 °C, and the annual precipitation is approximately 710 mm. The basin terrain is low in the north and high in the south; the upstream is primarily mountains and hills, whereas the downstream has more plains. The land-use type is predominantly forest land, and downstream contains more farmland and construction land.

2.2. Data

The data required to construct the SWAT model primarily included spatial and hydrometeorological data. The spatial data included land-use, soil, and digital elevation model (DEM) data. Of these data types, the land-use data (Figure 2) were obtained from the 2016 Landsat OLI remote sensing image set, which was downloaded from the interpretation of geospatial data cloud. The soil data (1:100,000) were obtained from the Harmonized World Soil Database [23]. The DEM data exhibited a spatial resolution of 30 m and were derived from the SRTM1v3.0 data of the U.S. Geological Survey website in February 2020 (http://glovis.usgs.gov/ (accessed on 17 February 2021)). Hydrological data were obtained and verified using daily inflow data from two hydrological stations in the Tanghe River Basin—Erdaohezi and Haojiadian—from 1970 to 2015. The meteorological data included the daily rainfall, temperature, solar radiation, wind speed, and relative humidity from 1970 to 2015, and they were derived from the Liaoyang meteorological station and national meteorological science data sharing service platform (http://data.cma.cn/en (accessed on 17 February 2021)).

2.3. SWAT Model Data Preparation

The SWAT model is a widely used model that can simulate hydrological processes [24], including runoff [25], sedimentation [26], and water pollution [27], in large and complex watersheds over long periods. Hydrological cycle SWAT model simulations can be divided into land and routing phases. The land phase of the hydrological cycle simulates the water yield in each hydrological response unit (HRU), and the routing phase models the movement of water through the channel network and other water bodies to the outlet [28]. First, the SWAT divides the watershed into sub-basins according to topography and river course. Then, it divides the sub-basin into multiple HRUs according to the soil and land-use types. Finally, it calculates the runoff of each HRU to obtain the total meridional flow [29,30]. The hydrologic cycle process of the basin is simulated according to the water balance principle. The corresponding equation is as follows [31,32]:
S W t = S W 0 + i = 1 t R d a y + Q s u r f E a w s e e p Q g w
where SWt is the final soil water content (mm), i.e., the amount of water in the soil profile at the end of the period; SW0 is the initial soil water content on day i; Rday is the amount of precipitation on day i; Qsurf is the amount of surface runoff on day i; Ea is the amount of evapotranspiration on day i; Wseep is the amount of seepage and bypass water from the soil profile on day i; and Qgw is the amount of return flow on day i.
Based on the DEM, land-use data, and soil data, the spatial database of the SWAT model was established. The Tanghe River Basin was divided into 44 sub-basins and 655 HRUs. Monthly runoff data from the Erdaohezi and Haojiadian hydrological stations from 1970 to 1990 were used to calibrate the model. Monthly runoff data from 1991 to 2015 were used to verify the model, and the warm-up period was set to two years in order to ensure the establishment of basic flow conditions for the simulations [33].

2.4. SWAT Model Evaluation Index

In this study, the sequential uncertainty analysis method (SUFI-2) provided by the SWAT-CUP software was used to calibrate and verify the established SWAT model, and the SWAT performance was evaluated according to the statistical relationship between the observations and simulation results. The coefficient of determination (R2) and Nash–Sutcliffe efficiency (ENS) are the most commonly used statistical indicators for calibration and verification. R2 represents the degree of coincidence between the simulated and measured values, and the value range is 0 to 1. ENS is used to judge the simulation effect of the hydrological model, and its value range is −∞ to 1. Model results are considered credible when R2 ≥ 0.6 and ENS ≥ 0.5 [34,35,36,37]. The formulas for R2 and ENS are expressed as follows:
R 2 = [ i = 1 n Q m , i Q ¯ m Q s , i Q ¯ s ] 2 i = 1 n ( Q m , i Q ¯ m ) 2 i = 1 n ( Q s , i Q ¯ s ) 2
E N S = 1 i = 1 n ( Q m Q s ) i 2 i = 1 n ( Q m , i Q ¯ m ) 2
where Qm is the measured value over many years, Qs is the simulation value, Q ¯ m is the measured average value over many years, and Q ¯ s is the simulated average value.

2.5. Water Resource Statistics

The SWAT model can directly estimate the blue and green water components and quantify their available amounts. The water components include the subwatershed yield (WYLD), deep aquifer supply (DA_RCHG), actual evapotranspiration (ET), and soil moisture content (SW). Blue water is the sum of the subwatershed yield and deep aquifer recharge. According to the concept of green water and output results of the SWAT model, green water flow is the actual evapotranspiration (ET), and green water storage is soil water (SW). Thus, the total amount of green water resources is the sum of the actual evapotranspiration and soil moisture, i.e., the sum of the green water flow and reservoir [11]. The green water coefficient is the proportion of green water resources of the total water resources of a certain area, which can be used to evaluate the distributions of blue and green water resources in the basin [5,38,39]. The formulas for blue water, green water, and the green water coefficient are expressed by Equations (4)–(6), respectively.
B = W Y L D + D A _ R C H G
G = E T + S W
I G W C = G G + B
where IGWC is the green water coefficient, B is the amount of blue water resources, and G is the amount of green water resources.
In this study, the relative rate of change (RCR) was used to represent the changes in the green and blue water flows during different periods. The RCR formula is expressed as follows:
R C R = V i V 0 V 0 × 100 %
where V represents the green or blue water flow, i represents the later period, and 0 represents the initial period.

2.6. Abrupt Change Point Detection

The Mann–Kendall test, which is widely used in hydro-meteorological time series, is a nonparametric statistical test method [40,41]. Given that x1, x2…, xn is a series that denotes the studied time series, n is the sequence length, and the order column Sk is constructed using the following equations:
S k = i = 1 k j i 1 α i j k = 2 , 3 , n
α i j = 1   x i > x j 0   x i x j 1 j I
Statistical variables are defined as
U F K = S k E S K V a r S K K = 1 , 2 , , n
in which
E S K = k k + 1 4
V a r S K = k k 1 2 k + 5 72
The data sequence x is arranged in reverse order. Then, according to Equation (10),
U B k = U F k k = n + 1 k k = 1 , 2 , , n
where UFk and UBk are the forward and backward sequences, respectively. If UFk is positive, the sequence is increasing, and when it is negative, it is decreasing [42]. For a given significance level, |UFk| or |UBk| > Uα/2 indicates that the sequence exhibits a significant change in trend; otherwise, it is not significant. The significance level in this study was 0.05, and the critical values were U0.05 = ±1.96. The intersection of the UFk and UBk curves is the abrupt change point.

3. Results

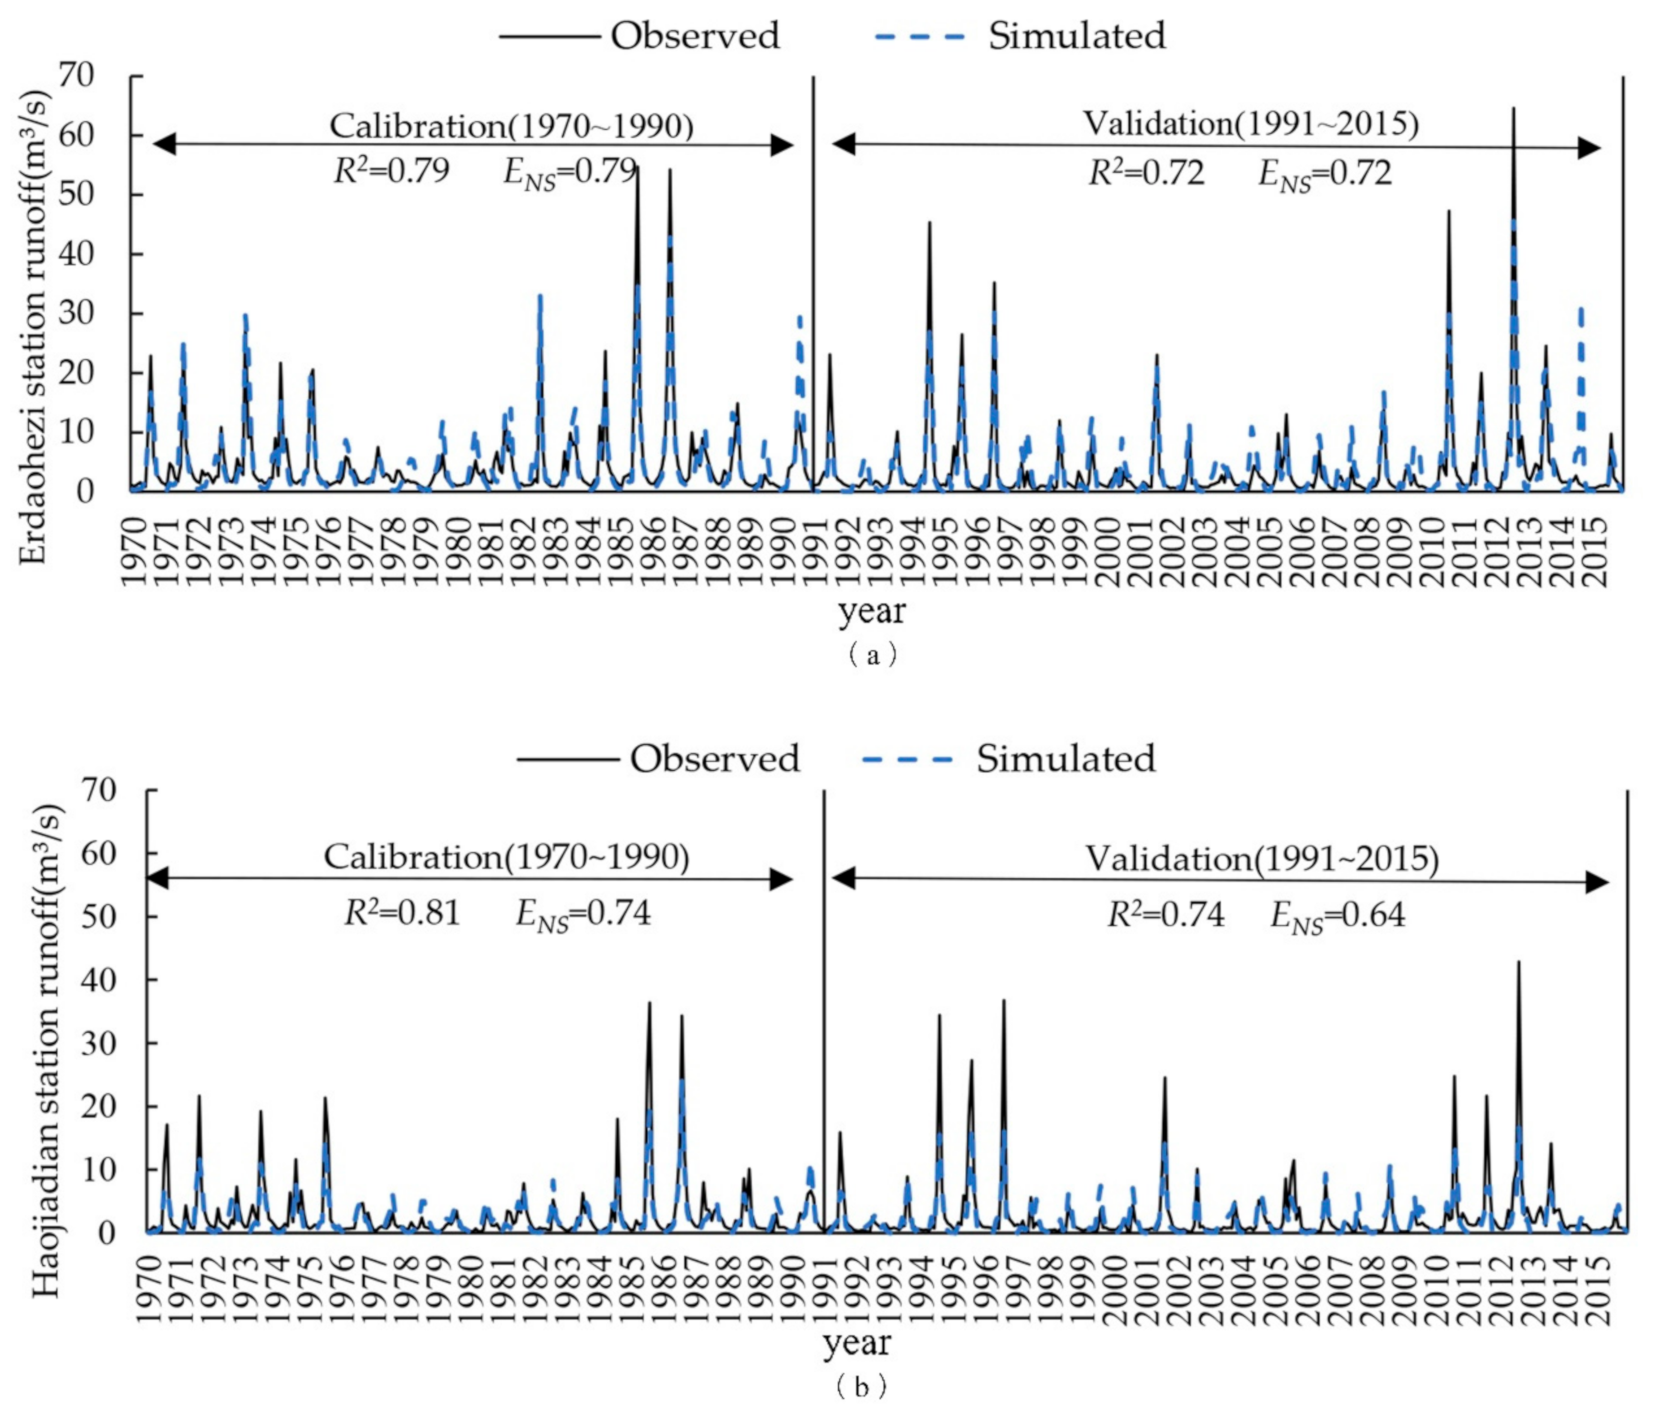
3.1. SWAT Model Construction, Calibration, and Validation

Parameter sensitivity analyses were conducted using the SWAT-CUP software [43,44], and 10 highly sensitive parameters were selected (Table 1). Parameter selection and initial ranges were based on a literature review and prior knowledge of similar watersheds [45,46]. Then, the parameters were automatically calibrated for streamflow using SWAT-CUP and 1000 simulations. The results are displayed in Table 1 and Figure 3.
The R2 of the Erdaohezi hydrological station was 0.79 for the calibration period and 0.72 for the validation period, and the ENS was 0.79 and 0.72, respectively. The R2 of the Haojiadian hydrological station was 0.81 for the calibration period and 0.74 for the validation period, and the ENS was 0.74 and 0.64, respectively. The SWAT model performed well with high accuracy [36,47], indicating that it can credibly describe the Tanghe River Basin hydrological cycle.
Table 1. SWAT calibration parameters.
Parameter Name and Document Type aDescription bInitial Range cCalibrated Value
v_SLSUBBSN.hruAverage slope length (m)−20% to +20%Increased to 11.971%
v_CANMX.hruMaximum canopy storage0–10018.780
r_CN2.mgtSCS curve number for moisture condition II−20% to +20%Decreased to 0.027%
r_SOL_K().solSaturated hydraulic conductivity (mm h−1)−20% to +20%Increased to 0.173% for the first layer
v_ESCO.hruSoil evaporation compensation factor0–10.952
v_EPCO.hruPlant uptake compensation factor0–10.341
v_CH_N2.rteManning “n” value for the primary channel0.01–0.30.146
v_RCHRG_DP.gwDeep aquifer percolation fraction0–10.132
v_GWQMN.gwThreshold depth of water in the shallow aquifer required for return flow to occur (mm H2O)0–50001.669
r_SOL_AWC().solAvailable soil water capacity (mm H2O mm−1 soil)−20% to +20%Increased to 0.084% for the first layer
a v indicates parameter changes by the specified value; r displays parameter changes by the original value, 1+ specified value; .hru indicates HRU conventional data entry; .mgt represents HRU management; .sol represents soil data entry; .rte indicates river hydrology; and .gw represents groundwater hydrology [46]. b Source: Neitsch et al. [48]. c Ranges used for parameter sensitivity analysis to maximize ENS [49].

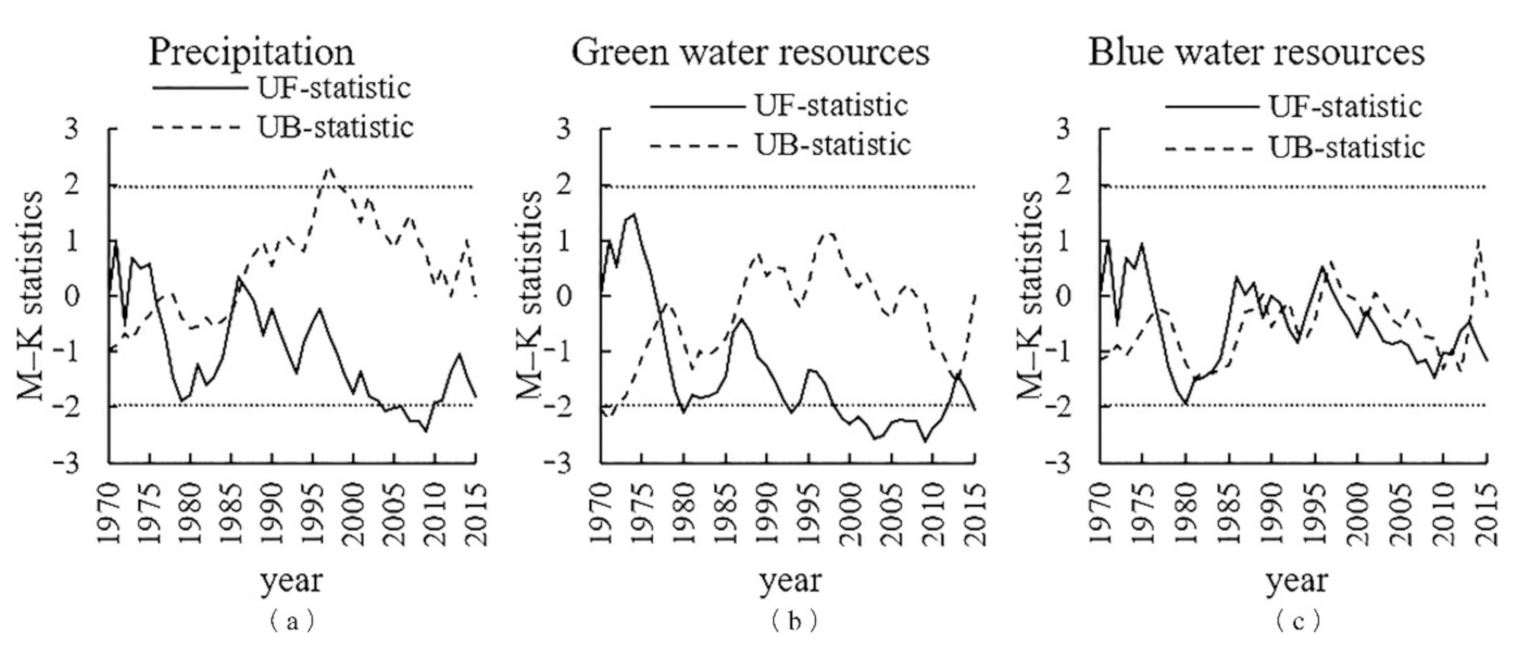
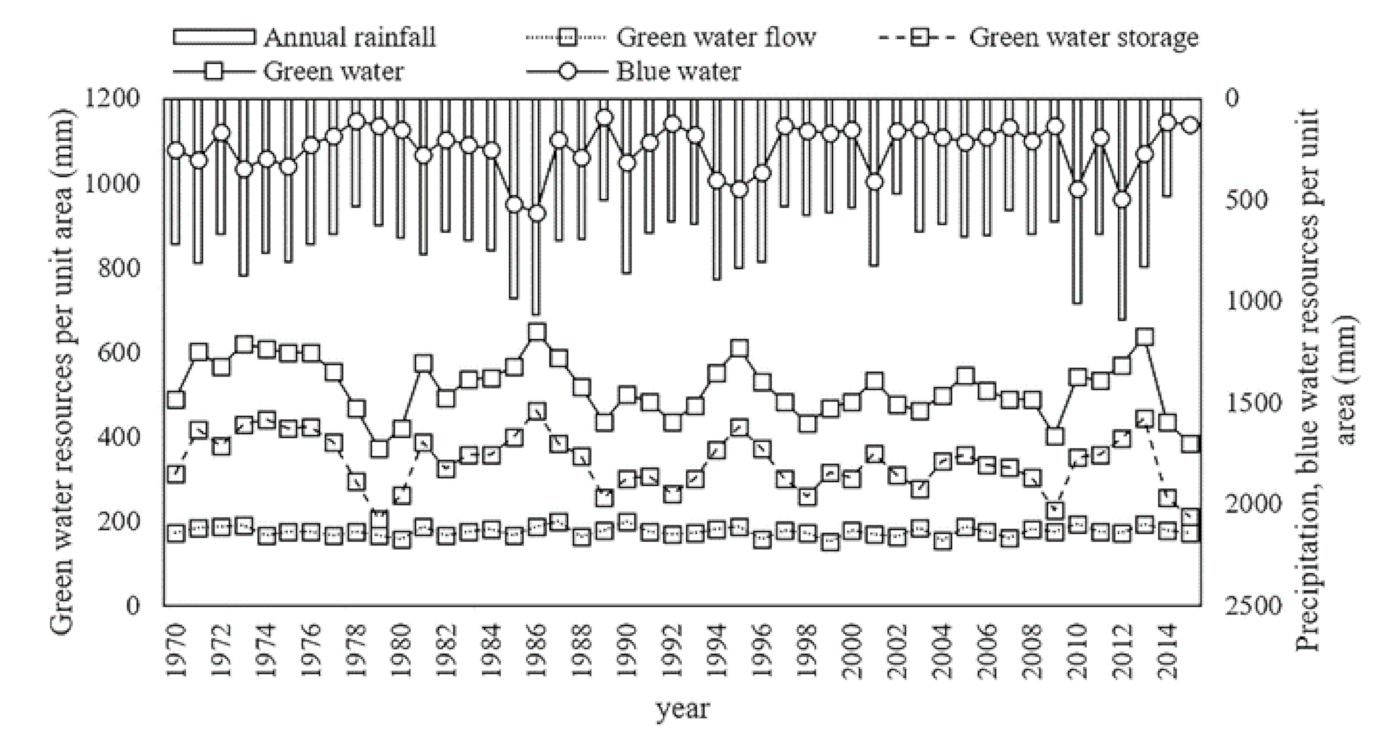
3.2. Variance Tendency of Green and Blue Water Resources from 1970 to 2015

As illustrated in Figure 4, the average annual water resources of the Tanghe River Basin were 759.37 mm, with an average annual green water resource of 516.83 mm, which included 176.50 mm of green water flow and 340.33 mm of green water storage. The blue water resource constituted 242.55 mm, and the average annual green water coefficient was 68%. These results indicated that the water resources in the Tanghe River Basin were primarily green water resources, which were 2.13 times the amount of blue water resources.
According to the unitary regression analysis results, the precipitation, blue water, and green water, including green water flow and water storage, in the Tanghe River Basin did not significantly change from 1970 to 2015. In these 46 years, the precipitation, blue water, and green water change rates were −11.48, −7.91, and −14.96 mm/decade, respectively. In addition, the change rates of the green water flow and storage were 0.07 and −15.03 mm/decade, respectively.

3.3. Effect of Climate Variability on Green and Blue Water Resources in Tanghe River Basin

The Mann–Kendall test was used to explore changes in precipitation and green and blue water resources. As illustrated in Figure 5, the UF and UB of the precipitation (Figure 5a), blue water resources (Figure 5b), and green water resources (Figure 5c) all intersected in 1976 and were all within a significance level of p < 0.05. The results demonstrated that 1976 is the transition point of the hydrological series of the Tanghe River, and the change in precipitation decisively influenced the green and blue water resources.
Considering the abrupt changes in precipitation, the entire period was divided into two parts, a reference period (1970–1976) and variation period (1977–2015), to explore the impact of climate change on the green and blue water resources of the Tanghe River Basin. The period results are displayed in Table 2.
After the abrupt change in 1976, the average annual precipitation decreased by 64.01 mm/year, and the rate of change was −8.38%. As a result, the average annual green water resources decreased by 78.48 mm, with a change rate of −13.45%. The average annual blue water resources decreased by 35.94 mm, with a change rate of −13.17%. The sum of the blue and green water was less than the precipitation amount. This result occurred because green water storage primarily refers to water that is stored in the soil, which includes groundwater recharge. The change rates of green and blue water resources were much higher than those of precipitation, indicating that the water system was particularly dependent on the climate and similar to those of climate changes, but it was more sensitive than the climate system.
From the spatial perspective, the precipitation RCR was high in the south and low in the north, and the RCRs were negative throughout the basin. The highest sub-basin RCR was upstream of the west tributary of the Tanghe River Basin, which was as high as −7% to −10% (Figure 6a). The spatial distribution of the RCR of green water resources (Figure 6b) was similar to that of precipitation. In all the sub-basins, green water resources decreased by −26% to 0%. The sub-basins with the greatest RCR range (−26% to −20%) were located in the eastern Tanghe River Basin, while the sub-basins with the smallest RCR range (−3% to −2%) were located in the east and upstream of the Tanghe River Basin. Compared with the green water resource RCRs, those of the blue water resources both increased and decreased (Figure 6c). In most of the sub-basins, the blue water resource RCRs decreased by −33% to 0%. The sub-basins with the largest RCR range (−33% to −17%) were located in the west branch of the Tanghe River Basin. In a few sub-basins, blue water resources increased by 0% to 37% in the upstream of the west branch of the Tanghe River Basin.
Regarding the spatial distributions, the differences between precipitation and the green and blue water demonstrated that the variations in green and blue water resources were predominantly affected by rainfall; they may also be affected by other factors, such as human activities and the underlying surface characteristics. Thus, the reasons for changes in green and blue water resources are complex.

4. Discussion

Green water resources accounted for 68% of the water resources in the Tanghe River Basin. this result is similar to that of our previous research where 69% of water resources were green water in the Xihe River Basin [39], which is also located in the temperate monsoon climate zone of Northeastern China. The runoff yield mechanism under this climate is primarily excess infiltration; thus, more precipitation was converted to green water. The same results have been found for other basins, such as the Wuyuer River Basin [50], where the average annual green water coefficient was 90%. Under different climatic conditions such as abundant precipitation, the runoff yield mechanism is predominantly excess storage. Blue water resources in basins such as the Dongjiang River Basin [38] and Xixi Basin [51] are substantially greater than the green water resources; the average annual green water coefficients of these basins were 39% and 36%, respectively. In combination with other research results presented in Table 3, we postulate that the precipitation magnitude and underlying surface properties determine the runoff yield mechanism and subsequently the allocation of blue and green water resources.
From the spatial distribution perspective, precipitation is the primary factor affecting the spatial distribution of blue water. However, it has no apparent effect on the spatial distribution of green water. Underlying surface properties and human activities (e.g., the conversion of farmland to forest or grassland, construction of reservoirs, agricultural irrigation, etc.) can affect the spatial distribution pattern of green water. This study contributes to our understanding of hydrological processes and the availability of blue and green water in the Tanghe River Basin. This knowledge is essential for promoting the sustainable development of small basins and the integrated management of watersheds under similar climatic conditions. The impacts of human activities such as agricultural irrigation and reservoir construction on blue and green water were not considered in the simulation of blue and green water in this study. Additionally, the conversion mechanism of blue and green water that can relieve the pressure on water resources and the basin environment remains unclear and requires further study in the future.

5. Conclusions

This study investigated the long-term spatiotemporal changes in the Tanghe River Basin from 1970 to 2015 by establishing a SWAT model, simulating the hydrological cycle processes within the basin, and exploring the spatiotemporal changes in green and blue water resources in the temperate monsoon climate zone of North China. The primary conclusions are as follows.
(1)
At the Erdaohezi hydrologic station, the ENS was 0.79 and the R2 was 0.79 in the calibration period and 0.72 and 0.72 in the validation period, respectively. At the Haojiadian hydrologic station, the ENS was 0.74 and the R2 was 0.81 in the calibration period and 0.64 and 0.74 in the validation period, respectively. The model simulations of the two hydrological stations were extremely precise, indicating that the model can accurately describe basic watershed hydrologic cycle processes.
(2)
From 1970 to 2015, the average amount of annual water resources in the Tanghe River Basin was 759.37 mm, that of green water resources was 516.83 mm, and that of blue water resources was 242.55 mm. The average annual green water coefficient was 68%, and the average amount of annual green water resources was 2.13 times that of the blue water resources. The amount of green water storage, green water resources, and blue water resources all demonstrated an insignificant downward trend.
(3)
From 1970 to 2015, the precipitation, green water resources, and blue water resources in the Tanghe Basin all experienced an abrupt change in 1976. Compared with that of the reference period, the average annual precipitation and green and blue water resources in the variation period decreased by 64.01, 78.48, and 35.94 mm/year, and their change rates were −8.38%, −13.45%, and −13.17%, respectively.
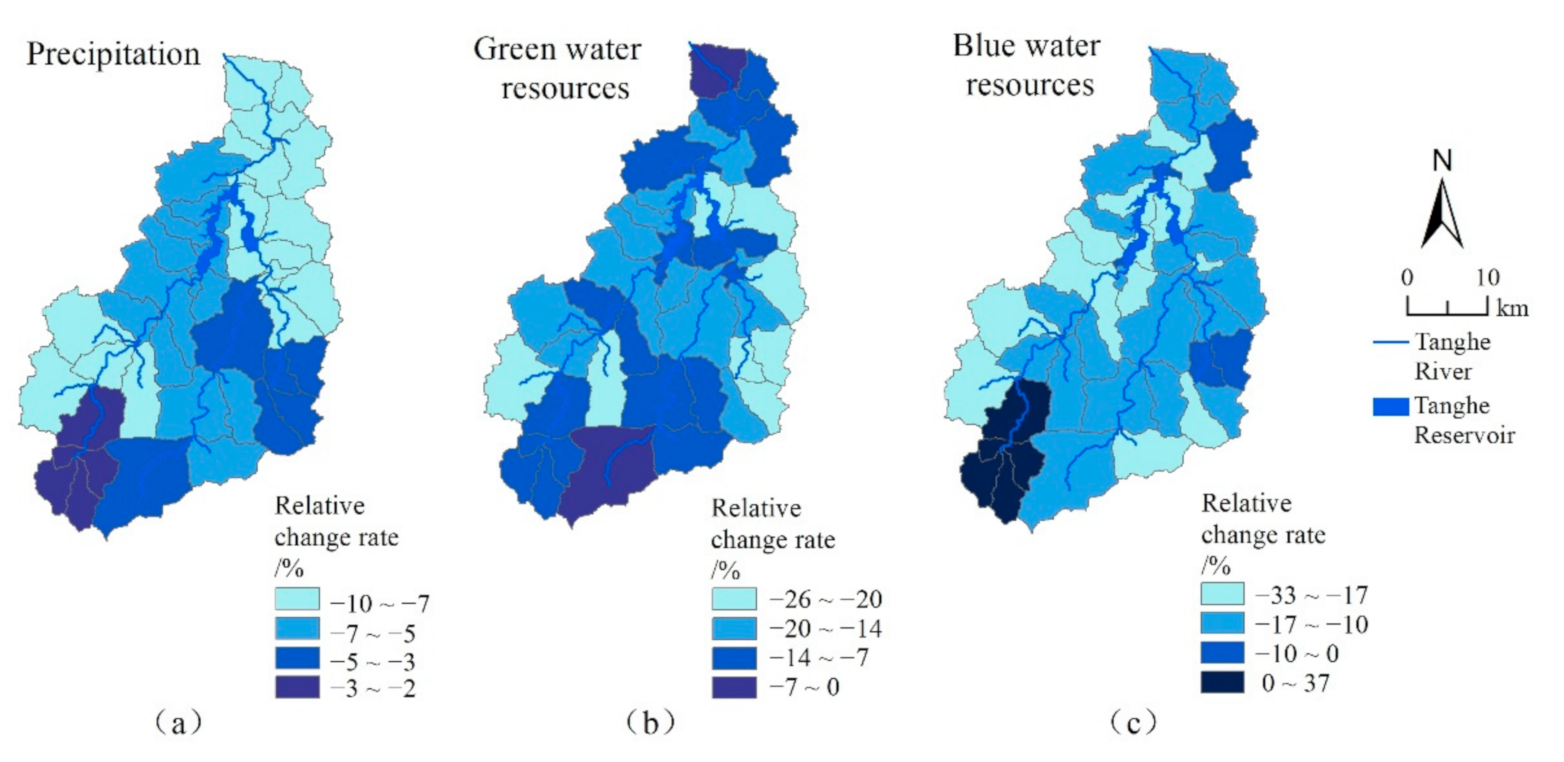
(4)
The spatial distributions of green and blue water resources and the precipitation RCR were similar, with high values in the south and low values in the north. Additionally, the RCRs of the green and blue water were all negative except for those in a small part upstream of the Tanghe Basin. These results indicate that precipitation greatly impacts green and blue water resources, and the influence of climate change in the region was significant.

Author Contributions

Conceptualization, L.L. and Y.H.; Methodology, J.J. and C.S.; Software, J.J. and L.L.; Validation, J.J.; Formal analysis, Y.H.; Investigation, Y.H.; Resources, J.J.; Data curation, Y.H. and C.S.; Writing—original draft preparation, Y.H.; Writing—review and editing, L.L.; Visualization, J.J. and L.L.; Supervision, L.L. and C.S.; Project administration, Y.H.; Funding acquisition, Y.H. All authors have read and agreed to the published version of the manuscript.

Funding

This research was funded by National Natural Science Foundation of China (grant number 41701208) and National Natural Science Foundation of China (grant number 42077272).

Data Availability Statement

Data sharing not applicable.

Conflicts of Interest

The authors declare no conflict of interest.

References

  1. Oki, T.; Kanae, S.; Musiake, K. Global Hydrological Cycles and World Water Resources. Science 2006, 313, 1068–1072. [Google Scholar] [CrossRef] [Green Version]
  2. Leta, O.T.; Bauwens, W. Assessment of the Impact of Climate Change on Daily Extreme Peak and Low Flows of Zenne Basin in Belgium. Hydrology 2018, 5, 38. [Google Scholar] [CrossRef] [Green Version]
  3. Mohammed, K.; Islam, A.K.M.S.; Islam, G.M.T.; Alfieri, L.; Bala, S.K.; Khan, J.U. Impact of High-End Climate Change on Floods and Low Flows of the Brahmaputra River. J. Hydrol. Eng. 2017, 22, 04017041. [Google Scholar] [CrossRef]
  4. Habel, S.; Fletcher, C.H.; Rotzoll, K.; El-Kadi, A.I. Development of a model to simulate groundwater inundation induced by sea-level rise and high tides in Honolulu, Hawaii. Water Res. 2017, 114, 122–134. [Google Scholar] [CrossRef]
  5. Zang, C.F.; Liu, J.; van der Velde, M.; Kraxner, F. Assessment of spatial and temporal patterns of green and blue water flows under natural conditions in inland river basins in Northwest China. Hydrol. Earth Syst. Sci. 2012, 16, 2859–2870. [Google Scholar] [CrossRef] [Green Version]
  6. Malin, F. Freshwater as shared between society and ecosystems: From divided approaches to integrated challenges. Philos. Trans. R. Soc. B Biol. Sci. 2003, 358, 2037–2049. [Google Scholar]
  7. Falkenmark, M. Land-Water Linkages: A Synopsis. In Land and Water Bulletin: Land and Water Integration and River Basin Management; Mather, T., Ed.; Food and Agriculture Organization (FAO) of the United Nations: Rome, Italy, 1995; pp. 15–16. [Google Scholar]
  8. Wu, H.; Wu, C.; Hao, F.; Jin, Y. Research on Assessment and Management of Green Water. China Popul. Resour. Environ. 2008, 18, 61–67. [Google Scholar]
  9. Liu, J.; Yang, H. Spatially explicit assessment of global consumptive water uses in cropland: Green and blue water. J. Hydrol. 2009, 384, 187–197. [Google Scholar] [CrossRef]
  10. Liu, J.; Zehnder, A.J.B.; Yang, H. Global consumptive water use for crop production: The importance of green water and virtual water. Water Resour. Res. 2009, 45. [Google Scholar] [CrossRef] [Green Version]
  11. Lyu, L.; Wang, X.; Sun, C.; Ren, T.; Zheng, D.-F. Quantifying the Effect of Land Use Change and Climate Variability on Green Water Resources in the Xihe River Basin, Northeast China. Sustainability 2019, 11, 338. [Google Scholar] [CrossRef] [Green Version]
  12. Liang, J.; Liu, Q.; Zhang, H.; Li, X.; Qian, Z.; Lei, M.; Li, X.; Peng, Y.; Li, S.; Zeng, G. Interactive effects of climate variability and human activities on blue and green water scarcity in rapidly developing watershed. J. Clean. Prod. 2020, 265, 121834. [Google Scholar] [CrossRef]
  13. Cheng, G. Green Water and Its Research Progresses. Adv. Earth Sci. 2006, 3, 221–227. (In Chinese) [Google Scholar]
  14. Khoi, D.N.; Nguyen, V.T.; Sam, T.T.; Nhi, P.T.T.; Khoi, D.N. Evaluation on Effects of Climate and Land-Use Changes on Streamflow and Water Quality in the La Buong River Basin, Southern Vietnam. Sustainability 2019, 11, 7221. [Google Scholar] [CrossRef] [Green Version]
  15. Lemann, T.; Roth, V.; Zeleke, G.; Subhatu, A.; Kassawmar, T.; Hurni, H. Spatial and Temporal Variability in Hydrological Responses of the Upper Blue Nile basin, Ethiopia. Water 2018, 11, 21. [Google Scholar] [CrossRef] [Green Version]
  16. Schuol, J.; Abbaspour, K.C.; Yang, H.; Srinivasan, R.; Zehnder, A.J.B. Modeling blue and green water availability in Africa. Water Resour. Res. 2008, 44, W07406. [Google Scholar] [CrossRef] [Green Version]
  17. Schuol, J.; Abbaspour, K.C.; Srinivasan, R.; Yang, H. Estimation of freshwater availability in the West African sub-continent using the SWAT hydrologic model. J. Hydrol. 2008, 352, 30–49. [Google Scholar] [CrossRef]
  18. Faramarzi, M.; Abbaspour, K.C.; Vaghefi, S.A.; Farzaneh, M.R.; Zehnder, A.J.; Srinivasan, R.; Yang, H. Modeling impacts of climate change on freshwater availability in Africa. J. Hydrol. 2013, 480, 85–101. [Google Scholar] [CrossRef]
  19. Abbaspour, K.C.; Rouholahnejad, E.; Vaghefi, S.; Srinivasan, R.; Yang, H.; Kløve, B. A continental-scale hydrology and water quality model for Europe: Calibration and uncertainty of a high-resolution large-scale SWAT model. J. Hydrol. 2015, 524, 733–752. [Google Scholar] [CrossRef] [Green Version]
  20. Yuan, Z.; Xu, J.; Wang, Y. Historical and future changes of blue water and green water resources in the Yangtze River source region, China. Theor. Appl. Clim. 2019, 138, 1035–1047. [Google Scholar] [CrossRef]
  21. Yuan, Z.; Xu, J.; Meng, X.; Meng, X.; Yan, B.; Hong, X. Impact of Climate Variability on Blue and Green Water Flows in the Erhai Lake Basin of Southwest China. Water 2019, 11, 424. [Google Scholar] [CrossRef] [Green Version]
  22. Zang, C. Spatial and temporal variability of blue/green water flows in typical meteorological years in an inland river basin in China. J. Water Clim. Chang. 2017, 8, 165–176. [Google Scholar] [CrossRef]
  23. Food and Agriculture Organization of the United Nations (FAO); International Institute for Applied Systems Analysis. China Soil Map Based Harmonized World Soil Database (HWSD) (v1.1) (2009); National Tibetan Plateau Data Center: Beijing, China, 2019. [Google Scholar]
  24. Al-Khafaji, M.S.A.; Saeed, F.H.; Al-Ansari, N. The Interactive Impact of Land Cover and DEM Resolution on the Accuracy of Computed Streamflow Using the SWAT Model. Water Air Soil Pollut. 2020, 231, 1–17. [Google Scholar] [CrossRef]
  25. Jakada, H.; Chen, Z. An approach to runoff modelling in small karst watersheds using the SWAT model. Arab. J. Geosci. 2020, 13, 318. [Google Scholar] [CrossRef]
  26. Zhang, Z.; Chen, S.; Wan, L.; Cao, J.; Zhang, Q.; Yang, C. The effects of landscape pattern evolution on runoff and sediment based on SWAT model. Environ. Earth Sci. 2021, 80, 1–12. [Google Scholar] [CrossRef]
  27. Luo, R.; Xu, Z.; Cheng, L. Application of SWAT Model in the Sanchuan River Catchment. J. Water Resour. Water Eng. 2008, 19, 28–33. (In Chinese) [Google Scholar]
  28. Du, X.; Shrestha, N.K.; Wang, J. Assessing climate change impacts on stream temperature in the Athabasca River Basin using SWAT equilibrium temperature model and its potential impacts on stream ecosystem. Sci. Total. Environ. 2018, 650, 1872–1881. [Google Scholar] [CrossRef]
  29. Zuo, D.; Xu, Z.; Peng, D.; Song, J.; Cheng, L.; Wei, S.; Abbaspour, K.C.; Yang, H. Simulating spatiotemporal variability of blue and green water resources availability with uncertainty analysis. Hydrol. Process. 2015, 29, 1942–1955. [Google Scholar] [CrossRef]
  30. Jiang, B. Study on the Change of Lake Water Inflow and Lake Level in Qinghai Lake Based on SWAT Model. Master’s Thesis, China University of Geosciences, Beijing, China, 2018. [Google Scholar]
  31. Shrestha, N.K.; Du, X.; Wang, J. Assessing climate change impacts on fresh water resources of the Athabasca River Basin, Canada. Sci. Total. Environ. 2017, 601–602, 425–440. [Google Scholar] [CrossRef]
  32. Pandey, B.K.; Khare, D.; Kawasaki, A.; Mishra, P.K. Climate Change Impact Assessment on Blue and Green Water by Coupling of Representative CMIP5 Climate Models with Physical Based Hydrological Model. Water Resour. Manag. 2019, 33, 141–158. [Google Scholar] [CrossRef]
  33. Jha, M. SWAT: Model use, calibration, and validation. Trans. Asabe 2012, 55, 1345–1352. [Google Scholar]
  34. Nilawar, A.P.; Waikar, M.L. Impacts of climate change on streamflow and sediment concentration under RCP 4.5 and 8.5: A case study in Purna river basin, India. Sci. Total. Environ. 2019, 650, 2685–2696. [Google Scholar] [CrossRef]
  35. Meng, Y.; Zhou, L.; He, S.; Lu, C.; Wu, G.; Ye, W.; Ji, P. A heavy metal module coupled with the SWAT model and its preliminary application in a mine-impacted watershed in China. Sci. Total Environ. 2018, 613–614, 1207–1219. [Google Scholar] [CrossRef] [PubMed]
  36. Moriasi, D.N.; Arnold, J.G.; Van Liew, M.W.; Bingner, R.L.; Harmel, R.D.; Veith, T.L. Model Evaluation Guidelines for Systematic Quantification of Accuracy in Watershed Simulations. Trans. ASABE 2007, 50, 885–900. [Google Scholar] [CrossRef]
  37. Muyibul, Z.; Shi, Q.; Muhtar, P.; Zhang, R. Land use and climate change effects on runoff in the upper Urumqi River watershed: A SWAT model based analysis. Acta Ecol. Sin. 2018, 38, 5149–5157. (In Chinese) [Google Scholar]
  38. Lyu, L.; Wang, X.; Jiang, Y.; Sun, C. Research on spatial and temporal distribution features of green and blue water in Dongjiang River Basin based on SWAT model. Water Resour. Prot. 2017, 33, 53–60. (In Chinese) [Google Scholar]
  39. Lyu, L.; Wang, X.; Sun, C.; Zhang, J. Study on the Spatiotemporal Variations of Blue and Green Water Resources in Xi River Basin Using the SWAT Moder. Resour. Environ. Yangtze Basin 2019, 28, 39–47. (In Chinese) [Google Scholar]
  40. Yue, S.; Pilon, P.; Cavadias, G. Power of the Mann–Kendall and Spearman’s rho tests for detecting monotonic trends in hydrological series. J. Hydrol. 2002, 259, 254–271. [Google Scholar] [CrossRef]
  41. Burn, D.H.; Elnur, M.A.H. Detection of hydrologic trends and variability. J. Hydrol. 2002, 255, 107–122. [Google Scholar] [CrossRef]
  42. Xue, D.; Zhou, J.; Zhao, X.; Liu, C.; Wei, W.; Yang, X.; Li, Q.; Zhao, Y. Impacts of climate change and human activities on runoff change in a typical arid watershed, NW China. Ecol. Indic. 2021, 121, 107013. [Google Scholar] [CrossRef]
  43. Wang, Q.; Liu, R.; Men, C.; Guo, L.; Miao, Y. Temporal-spatial analysis of water environmental capacity based on the couple of SWAT model and differential evolution algorithm. J. Hydrol. 2019, 569, 155–166. [Google Scholar] [CrossRef]
  44. Khalid, K.; Ali, M.F.; Rahman, N.F.A.; Othman, Z.; Bachok, M.F. Calibration Assessment of the Distributed Hydrologic Model Using SWAT-CUP; Springer: Berlin, Germany, 2018. [Google Scholar]
  45. Du, L.; Rajib, A.; Merwade, V. Large scale spatially explicit modeling of blue and green water dynamics in a temperate mid-latitude basin. J. Hydrol. 2018, 562, 84–102. [Google Scholar] [CrossRef]
  46. Guo, S.; Zhu, Z.; Lyu, L. Effects of Climate Change and Human Activities on Soil Erosion in the Xihe River Basin, China. Water 2018, 10, 1085. [Google Scholar] [CrossRef] [Green Version]
  47. Pan, D.; Ren, L. Application of Distributed Hydrological Model in Irrigation Management of Tuhai-Majia River Basin I. Parameter Calibration and Validation. Sci. Agric. Sin. 2012, 45, 471–479. [Google Scholar]
  48. Neitsch, S.L.; Arnold, J.; Kiniry, J.; Williams, J. Soil & Water Assessment Tool the Oretical Documentation Version 2009; Texas A&M University System: College Station, TX, USA, 2011. [Google Scholar]
  49. Chen, Y.; Marek, G.W.; Marek, T.H.; Porter, D.O.; Brauer, D.K.; Srinivasan, R. Simulating the effects of agricultural production practices on water conservation and crop yields using an improved SWAT model in the Texas High Plains, USA. Agric. Water Manag. 2021, 244, 106574. [Google Scholar] [CrossRef]
  50. Feng, X.; Zhang, G. Assessment of Water Resources in Wuyuer River Basin Based on Hydrological Model. J. China Hydrol. 2015, 35, 49–52. [Google Scholar]
  51. Rong, K.; Chen, X.; Li, Z.; Li, X. Estimating Green and Blue Water Resources in Xixi Watershed of Jinjiang Basin. Bull. Soil Water Conserv. 2011, 31, 12–15. [Google Scholar]
Figure 1. Tanghe River Basin overview.
Sustainability 13 02193 g001
Figure 2. Tanghe River Basin land-use map.
Sustainability 13 02193 g002
Figure 3. Observed and simulated monthly runoff rates at (a) Erdaohezi and (b) Haojiadian hydrological station in Tanghe River Basin during calibration and validation periods.
Sustainability 13 02193 g003
Figure 4. Amounts of blue and green water resources in Tanghe River Basin.
Sustainability 13 02193 g004
Figure 5. Mann–Kendall test results for (a) precipitation, (b) green water resources, and (c) blue water resources.
Sustainability 13 02193 g005
Figure 6. Spatial distributions of the (a) precipitation, (b) blue water, and (c) green water RCRs in Tanghe River Basin.
Sustainability 13 02193 g006
Table 2. Average annual precipitation and green and blue water resource statistics in reference and variation periods
PrecipitationGreen WaterBlue Water
Reference Period (1970–1976) (mm/year)763.71583.36273.02
Variation Period (1977–2015) (mm/year)699.70504.89237.08
Value of Change (mm)−64.01−78.48−35.94
Rate of Change (%)−8.38−13.45−13.17
Table 3. Distributions of green water resources in various river basins
River BasinClimate TypePrecipitation (mm)Green Water Coefficient (%)
Wuyuer River BasinTemperate monsoon climate496.790
Huangshui BasinPlateau continental climate400–60079
Xihe River BasinTemperate monsoon climate700–90069
Tanghe River BasinTemperate monsoon climate763.7168
Publisher’s Note: MDPI stays neutral with regard to jurisdictional claims in published maps and institutional affiliations.

