Abstract
In order to improve the process management of table grape packaging, its performance should be evaluated. However, the literature on performance evaluation indicators is scarce. To address this research gap, we propose a method for the development of performance evaluation indicators for table grape packaging units, which are characterized by labor-intensive and highly seasonal production processes in the agro-economic sector. The stages include the following: contextualizing table grape packaging units, selecting the performance objectives, selecting techniques to be used in the development of the indicators, and applying the method to the packaging units of table grapes. The techniques adopted in the development of the indicators aimed at the cost, quality, flexibility, reliability, and speed performance objectives were data envelopment analysis, principal component analysis, quantification of the batch, compliance with the program within the established deadline, and measurement of the execution time of the batch, respectively. The results obtained in the case study demonstrate that the correlations between the performance indicators do not indicate the need to disregard any of them. Furthermore, the standard deviation values for each indicator are similar. Thus, both results of correlations and standard deviation confirm the importance of the indicators chosen for the performance evaluation of table grape packaging.
1. Introduction
Performance measures enable the assessment of processes by monitoring the evolution of the goals set by the company for different objectives. The authors of [1] stated that monitoring favors organizational management by promoting continuous process improvement and institutional learning.
Evaluation by means of indicators has been expanding in the scientific literature [2]. Thus, myriad studies have been carried out with a focus on the definition, construction, and use of indicators for diverse objectives, such as performance evaluation, action planning, and decision-making support for global and strategic objectives in different sectors [3].
According to [4], the increase in the global competitiveness for food in the agribusiness sector has forced companies to seek greater efficiency in production processes. This demonstrates the importance of a control system that can provide essential information for performance evaluation, contributing to the development of the sustainability of the companies.
This research is relevant to the agro-economic sector as it addresses the performance evaluation of table grape packaging unit (TGPU) production processes. These units, which are also known as packing houses, are appropriate facilities that receive the grapes harvested from the field and subsequently process the cleaning, standardization (classification), and packaging [5]. They exist in several countries and exhibit the characteristics of seasonality of the process and the intensive use of labor owing to the special care required to avoid damage when handling the fruit, which is only possible using manual work.
TGPUs are considered as critical in the table grape supply chain [6,7,8]. However, no studies to date have focused on the use of performance evaluation indicators to improve the management of TGPUs. Instead, the scientific works have evaluated the following topics: the mechanization of activities [9]; the thermal environment [10]; weighing control [11]; and the effects of packaging under modified conditions and recruitment policies [12]. Thus, the gap left by the literature in this research field motivated the proposal of a method for the development of performance evaluation indicators for the productive processes of TGPUs, which is the aim of this study. The method was verified by its application to TGPUs located in the Vale do Submédio São Francisco (VSSF, São Francisco Lower Middle Valley), in northeast Brazil.
The structure of the proposed method for developing performance evaluation indicators for productive TGPU processes is illustrated in Figure 1.
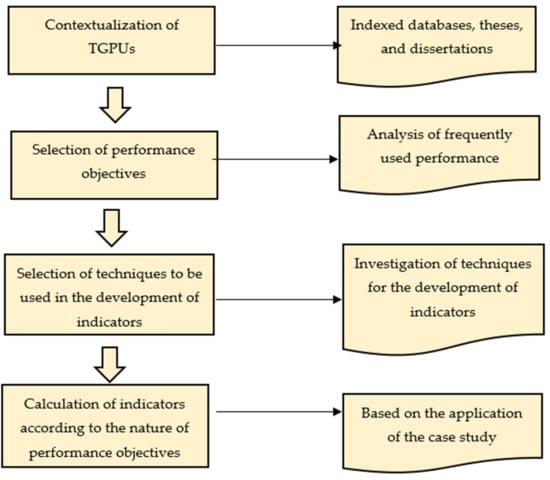
Figure 1.
Research structure for developing performance evaluation indicators for of table grape packaging units (TGPUs).
The contextualization of TGPUs, the selection of the performance objectives, and the selection of techniques for developing the indicators, as well as their impact on the sustainability dimensions, are presented in Section 2. The case study of the VSSF grape production is detailed, and the calculations of the indicators are discussed in Section 3. Finally, the conclusions and suggestions for future work are provided in Section 4.
2. TGPUS, Performance Objectives, Indicator Development Techniques, and Sustainability
2.1. TGPU
The global production and consumption of table grapes increased by 73% between 2000 and 2014, owing to the greater availability of the product in the markets, increased income, and changes in eating habits for a greater consumption of fruits and vegetables [13]. In this competitive market, table grape producers must demonstrate high operational efficiency and cost-effective strategies in the supply chain [14]. Given that this production chain is highly seasonal and labor-intensive, the packaging activity is a critical process [12].
The packaging process is carried out in a TGPU, which is also known as a table grape packing house. A TGPU is a hygienic, well-ventilated, fresh, and spacious facility that is properly protected from the sun, insects, and animals, in which the cleaning, classification, and packaging of the fruit take place [5]. After the grapes arrive at the TGPU, the following activities are carried out manually: the removal of malformed, rotten, cracked, green, and damaged grapes; the classification of bunches according to the size and quality (class) as well as color (type); and packaging (placing bunches in packages and weighing).
According to [9], the greatest difficulty in mechanizing table grape packaging activities is the meticulous and delicate process required to generate an aesthetically perfect product for consumers, who select fruits based on their visual appearance. The authors added that machines would more likely cause grooves and cracks in the grapes than a worker performing the activities manually.
For a better understanding of the purpose of this work, Figure 2 depicts the post-harvest activities of the table grapes, including those carried out in a TGPU, with an emphasis on the packaging process, which is the focus of this study and for which a method for the development of TGPU performance evaluation indicators is proposed.
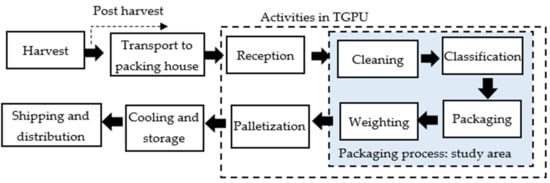
Figure 2.
Post-harvest activities of table grapes, including study area of the packaging process. TGPU, table grape packaging unit.
Similarly, to provide an improved understanding of the packaging process, Figure 3 presents the typical layout of a TGPU, in which each worker is responsible for completing the packaging process sequence. This processing method enables the recording of individual production measurements, facilitating the implementation of programs aimed at improving performance.
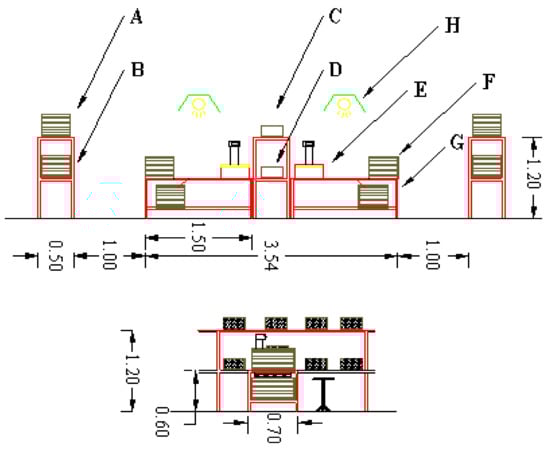
Figure 3.
Typical layout of a table grape packaging unit. A: empty container; B: container with grapes; C: empty packaging; D: packed grapes; E: weight; F: support for packed grapes; G: to discard; H: lighting.
2.2. Measurement Systems and Selection of Performance Objectives
Several relevant, well-structured, and integrated measurement systems for organizational performance evaluation have been developed [15,16,17,18]. Each system aims to address the purpose and context of the measurement in its own manner, by delving into diverse approaches: theoretical, practical, financial, non-financial, strategic, tactical, operational, process-focused, people-driven, and many other variations. The systems frequently found in the literature are described below.
2.2.1. Performance Measurement Matrix
The performance measurement matrix, proposed by Keegan et al. [19], establishes performance measures that are derived from the organizational strategy. These measures should be able to support the internal and external multidimensional environment, be related to cost and non-cost measures, and be based on a perfect understanding of the costs’ behaviors and relationships.
2.2.2. Strategic Measurement, Analysis, and Reporting Technique (SMART)—Performance Pyramid
SMART, proposed by [20], consists of a system to support process improvement. Its development was based on the concepts of total quality management, industrial engineering, and activity-based costing. This method takes the corporate vision, which is translated into market and financial objectives, to the departments and work centers where their operations are located. The focus is on the integration between departments and work centers.
2.2.3. Balanced Scorecard
The authors in [21] presented a balanced scorecard (BSC) after determining that guiding companies by means of financial indicators alone would no longer help them to remain competitive and innovative for long periods. Focused on managing strategies, the BSC complements traditional financial measures. The four perspectives of the BSC are the financial, customer, internal process, and learning and growth perspectives.
2.2.4. Performance Prism
This was proposed by [22] to integrate the best aspects of performance measurement systems and to aggregate the different performance perspectives provided by the systems, with the stakeholders’ view in the forefront.
2.2.5. Strategic Production Objectives
The strategic production objectives developed by [23] involve the classification of indicators in five performance objectives: quality, speed, reliability, flexibility, and costs, to assess the total performance of the production system. Each of these incorporates a competitive advantage for the organization, with significant production collaboration.
2.2.6. Final Considerations of Measurement Systems
The abovementioned performance measurement systems with financial and non-financial approaches attempt to offer a view of the organization management and results by aligning their objectives to improve their processes and activities continuously.
The authors of [24] identified two trends in addressing the performance objectives of productive systems. In the first trend, the performance is approached according to the supply chain operations reference model, and in the second strategy, the authors defined their own performance objectives for operations/production management. However, according to the authors, both trends usually resort to the range of performance objectives, namely, the cost, flexibility, quality, reliability, and speed, as proposed by [23].
The author in [25] noted that [26] used the four performance objectives of cost, quality, reliability, and flexibility. The work of [27] described seven performance objectives, which they referred to as market requirements: delivery time, reliability, product characteristics, quality, design flexibility, volume, and cost. The authors of [28] summarized six objectives: cost, quality, reliability, speed, flexibility, and innovation. The author in [25] recognized the differences among the authors, but also assumed the five performance objectives proposed by [23] (cost, quality, flexibility, speed, and reliability), considering that these were present in the proposals from all authors.
Therefore, considering that the performance evaluation of the productive TGPU processes is implemented at a more operational and/or tactical level than the strategic level, this work proposes the development of performance indicators in accordance with these five performance objectives (cost, flexibility, quality, reliability, and speed).
2.3. Techniques for Developing Indicators
Initially, the objectives and examples of performance indicators for evaluating the production processes are presented. Subsequently, considering the characteristics of table grape packaging, an indicator is proposed to represent each performance objective, the techniques for developing these indicators are outlined, and the hypotheses of this work are formulated.
2.3.1. Cost Performance Objective
Lower costs than those of the competitors are sought, through either resource acquisition or more efficient transformation processes. Measures that can be used for the cost objective include:
- minimum delivery time/average delivery time,
- variation against the budget,
- use of resources,
- labor productivity,
- added value, and
- efficiency.
The efficiency indicator of the production process was selected to represent the cost objective in this study. According to [29], efficiency handles the relationships between the various inputs and output measures of the system. Thus, different quantitative measures related to costs are used for its creation, and it was selected as an indicator for this reason.
The work of [30] noted that the main quantitative methods for assessing efficiency techniques are the stochastic frontier, Malmquist index, and data envelopment analysis (DEA). The authors explained that the main objective of the stochastic frontier is to estimate a function to obtain maximum production by efficiently combining the factors, whereas the Malmquist index evaluates the productivity evolution of each production unit in relation to the set of units in which it exists. In addition, other contributions have been proposed to these models, such as the introduction of a conditional to some external environmental variables [31] and how time affects the process of catching up [32]. The DEA compares the units and determines the relative efficiency of each one, and for this reason, it was the selected technique.
The DEA technique was introduced [33] when seeking a broader perspective of the measures presented by [29] to calculate the efficiency of units using multiple inputs and products. It is also defined as a benchmarking technique and aims to assess the relative efficiency of units by comparing all of them [33].
The two basic models of the DEA are known as constant returns to scale (CRS) and variable returns to scale (VRS). CRS expresses the global efficiency, and VRS considers the efficiency on the scale on which the decision-making unit (DMU) operates [34]. Input-oriented models were also created in an attempt to reduce the inputs while maintaining fixed outputs, and output-oriented models were created to increase the outputs while maintaining fixed inputs. These models yielded two equivalent formulations, the results of which were the same [35].
Equation (1) exemplifies the formulation of CRS, focused on the input, which was adopted in the case study analyzed here:
subject to:
where is the efficiency of the DMU0 under analysis; and are the weights of inputs and outputs ; and are inputs and outputs of DMU ; and and are inputs and outputs of DMU0; .
According to several studies [34,36,37,38,39,40,41,42], DEA is a recognized technique for assessing the relative efficiency of production units to support decision making for improved production processes.
2.3.2. Quality Performance Objective
In this objective, fewer errors are sought within the operations, with the direct reduction of waste and reworking and the elimination of surprises in the operation. Quality inspections and other processes are used to verify compliance with the specifications defined for the product. Some measures that can be used for the quality performance objective are:
- number of defects per unit,
- consumer complaint level,
- waste level,
- warranty claims,
- average failure time, and
- consumer satisfaction score.
Considering the characteristics of the productive process for packaging table grapes, a synthetic indicator is proposed for the various parameters that monitor product defects.
There are different means of obtaining a synthetic quality indicator, a common one of which makes use of the weighted aggregation of individual variables according to the degree of importance [43,44,45,46]. This is often referred to by the authors or by techniques as a hierarchical process analysis, which is widely applied and is based on expert judgments in paired comparisons.
Another possibility for synthesizing the quality indicator is to implement principal component analysis (PCA), which has been adopted for this purpose in certain studies [47,48,49]. It is a multivariate analysis technique that can be used to analyze the interrelationships among numerous variables and explains these variables in terms of their inherent dimensions (components). The authors in [50] explain that the technique groups individual indicators of the same measurement unit, which are collinear, to form a synthetic component that captures the common information of individual indicators as much as possible.
The proposal in this work mainly focuses on constructing the synthetic indicator using PCA so as to obtain measurements related to the quality parameters in the same unit as well as the convenience of dispensing with the use of specialists.
It is often possible to explain part of the data variation by a smaller number of variables with a data reorientation, so that several dimensions can explain the greatest possible amount of information [50]. However, the PCA may not always reduce a large number of original variables to a small number of transformed variables. When the original variables are not positively or negatively correlated, the analysis loses its value, thereby decreasing the possibility of a significant reduction in the original variables.
Finally, certain assumptions need to be confirmed in the development of the PCA. Regarding the correlation pattern between the variables, the correlation matrix should determine most of the coefficients to be above 0.30 [48], the determinant of the correlation matrix must be greater than 0.00001 [51], the global Kaiser–Meyer–Olkin (KMO) measure of sample adequacy should be greater than 0.6 [52], Bartlett’s sphericity test (multivariate normality) should be lower than 0.00005 (p-value) with the chi-square calculated to be greater than that of the distribution table [53], and the use of the first main components should reach a sum of variances above 80% [54].
2.3.3. Flexibility Performance Objective
Flexibility is understood as the ability of the manufacturing to migrate from one configuration to another, to adapt the operation to the customer needs or to the production process, and to adjust to changes in the supply channels. Flexibility refers to being able to change whenever necessary and with sufficient speed. Flexible operations adapt quickly to changing circumstances without disturbing the remaining operations. Measures that can be used for the flexibility dimension include:
- time required to develop new products/services,
- average batch or order size,
- time to increase the activity rate,
- average capacity/maximum capacity, and
- time to change schedules.
The indicator selected for the flexibility objective of the TGPU production process was the quantification of the variety of products, so that the packaging results would vary according to the marketed orders. The flexibility indicator demonstrates the product mix per day processed at the TGPU. The composition of the flexibility indicator is described by:
where is the product mix per day worked at TGPU, is the number of batches or cycles in TGPU , and is the number of days worked at TGPU .
2.3.4. Speed Performance Objective
Speed refers to working in a rapid manner, thereby reducing the time interval between the start of the manufacturing process and the delivery of the product/service to the customer, and making it quicker than that of competitors. Rapid operations reduce the stock in the process between the microoperations, and can also reduce the administrative staff. Measures that can be used for the speed dimension are:
- consumer quote time,
- order lead time,
- delivery frequency,
- actual versus theoretical traversal time, and
- cycle time.
The indicator selected for the speed objective of the TGPU production process is the batch execution cycle time. The aim of this indicator is to measure the average speed at which the operation processes a type of grape (kg) considering the number of benches available in its TGPU. Each type of grape is considered as a batch or production cycle, and the time is expressed in days. The composition of the speed indicator is represented by:
where is the average packaging speed in TGPU ; is the batch; = 1,…; is the cycle in kilograms of batch in TGPU ; is the benches available in TGPU ; and is the number of days to execute batch in TGPU .
2.3.5. Reliability Performance Objective
This performance objective is generally included in evaluating the total quality, and similarly to the other performance objectives, it can be viewed from an external and an internal perspective [25]. From the internal perspective, reliability is key for the system stability as a whole and, therefore, for operational excellence. From the external perspective, the key factor is the delivery of the order on time with the quantities and quality initially promised to the customer. Measures that can be used for the reliability dimension include:
- percentage of the orders delivered on time,
- average order delay,
- proportion of stock orders, and
- average deviation from arrival time promised.
The study area relates to the internal perspective, and the indicator selected for the reliability objective of the TGPU productive process is compliance with the program to the established deadline. The indicator corresponds to the delivery of the packaged grapes to the next operation within business hours. The extrapolation of the scheduled time results in a cost increase in the operations that must be executed in sequence and on the same day. The composition of the reliability indicator is presented as:
where is the reliability of TGPU , is the total number of hours worked at TGPU , and is the total overtime in TGPU .
2.3.6. Hypotheses
The following hypotheses are proposed in developing the performance indicators regarding the performance objectives:
- null hypothesis, most or all of the performance indicators are expressed in a correlated way to assess the performance objectives of TGPUs, and
- alternative hypothesis, most or all of the performance indicators are not expressed in a correlated way to assess the performance objectives of TGPUs.
2.4. Performance Indicators Impact on Sustainability Dimensions and Sustainable Business Models
Currently, companies are increasingly adopting sustainable practices, with the objective of improving environmental and social responsibility, while maintaining and improving profitability [55]. According to [56], the concern involving disasters of natural and human origin resulted in the need to reach a global goal of long-term sustainable development, at all environmental, social, and economic levels. In addition to exploring long-term results, companies adopt a proactive entrepreneurial approach, which aims to achieve environmental goals and encourage suppliers to develop sustainable actions [57].
According to [58], the sustainability of the agrifood supply chain is often assessed with a focus on social and environmental impacts, as is the case with TGPUs. In fact, in addition to the economic and social impacts related to workers, TGPUs impact the environment with the disposal of waste and use of natural resources, such as water for the cleaning process and electricity for air conditioning. The performance indicators adopted here have positive impacts on the different dimensions of sustainability, contributing to greater efficiency and better use of natural resources and higher quality, with less off-spec products and less waste, among other positive impacts on environmental, social, and economic sustainability.
Due to the adoption of practices related to sustainability, several definitions of sustainable business models (SBMs) have been proposed in the economic literature [59]. According to [60], an SBM must develop internal culture and structural capacity for the company to achieve sustainability, as well as collaborate with stakeholders so that the entire supply chain reaches sustainability. In agriculture studies, the work of [59] can be highlighted, in which the authors define how an SBM explores how stakeholders can contribute to innovation processes in dairy cooperatives towards sustainability. The authors of [61] have studied how promoting a culture of sustainability for a food and beverage packaging company affects supply chain actors. On the other hand, [56] studied how the sustainable and proactive behavior of a winery influences stakeholders to innovate and create business value. Here, the development of performance evaluation indicators also contributes to a sustainable business model for table grape packaging units.
3. VSSF Case Study, Results and Discussion
Initially, the production of table grapes from the VSSF is contextualized to justify the considerations adopted in the case study. Subsequently, the development of the case study and the respective results are presented.
3.1. VSSF Grape Production
This work focuses on the VSSF region, where the introduction of new crops and cultivation techniques have been made possible with modern irrigation technologies and infrastructure investments, leading to the production of fruits, vegetables, and export wines. The VSSF is considered as one of the most important agricultural regions in Brazil, particularly for the production of table grapes for export or for the domestic market. The table grape is the third most exported fresh fruit from Brazil, and almost 100% of Brazilian table grape and mango exports are produced in the VSSF.
It is worth highlighting two factors that are favorable to the competitiveness of the VSSF grape. First, the Food and Agriculture Organization of the United Nations has demonstrated a growth in the international fresh fruit market, enabling expansion of this market in countries with extensive territories such as Brazil [62]. Second, the VSSF region can offer grapes during periods of low competition in Europe. However, two significant threats are also posed. One of them is Peru, which is a new country entering this market, and is a strong competitor owing to its low labor costs, favorable climate, and international investors promoting technological advances. Another one is the fact that only few international agreements have been established to facilitate the entry of the Brazilian grape [63]. Hence, cost reductions in the entire table grape production chain of the VSSF, mainly at the TGPUs, are important, given that it is a highly seasonal and labor-intensive process.
3.2. Calculation of Indicators for Each Performance Objective
The steps carried out to develop the indicators related to each performance objective of the VSSF TGPU production process are presented below.
3.2.1. Selection of TGPUs, Process and Type of Packaging
The selection of TGPUs was based on companies with existing and consistent data to form a structured system of performance evaluation indicators for packaging units. Thus, 13 TGPUs were selected for this work.
In addition to delimiting the study area (cleaning, classification, packing/weighing activities), the verification of records corresponding to a type of packaging common to all units was defined for a homogeneous comparison, as the demand for labor in the packaging differs significantly for the different types of packaging. The selected packaging was a plastic box for 500 g of grapes, owing to its greater acceptance in the market.
3.2.2. Data Collection and Indicator Selection
A database containing approximately 35,000 operation records was collected, with reference to each day worked in the study area per employee during the period time of one year. The database included the hours and days worked, the quantity and type of grapes packaged, the results of quality inspections, and the number of benches in the TGPUs. The indicators for each performance objective were developed by using the database, as detailed below.
3.2.3. Cost Performance Objective Indicator
Cost monitoring is essential for the VSSF table grapes to be competitive in the international market at any time of the year, and it is represented in this work by the evaluation of the relative efficiency of the packaging units through the DEA.
Three inputs and one output were defined to evaluate the 13 (A to M) TGPUs (DMUs). The inputs were the number of hours worked (HW), total number of workstations (NW), and unused workstations (UW). The output was the quantity packed in kilograms (QP). These definitions did not violate the formulation of [35], who recommends that the minimum number of TGPUs should be the highest value between: (a) the quantity of inputs multiplied by the quantity of outputs or (b) three times the sum of the quantity of inputs and outputs.
Subsequently, the DEA model oriented to the input was processed with CRS to measure the relative global efficiency (C_I) of the packaging units. The results are shown in Table 1.

Table 1.
Table grape packaging unit (TGPU) efficiency indicators (C_I).
The global efficiency varied between 49.3% and 100%. Among the five TGPUs with a global efficiency of 100%, four achieved the highest output values, demonstrating the direct influence of the packaged quantity on the global efficiency.
3.2.4. Quality Performance Objective Indicator
Monitoring the grape quality is essential for the company to comply with the strict standards required by the international market, and it is expressed in this work by the quality indicator developed with the PCA.
The PCA variables were selected from the correlation analysis of the aggregated results of the inspections in different quality criteria for one year of operation of the TGPUs. Table 2 presents the selected variables, where higher values represent positive aspects, i.e., the higher the values, the higher the quality.
Table 2.
Quality variables (%).
Regarding the correlation pattern among the quality variables, the correlation matrix exhibited most of the coefficients with an absolute value above 0.30. Other assumptions for using the PCA were also met: the determinant of the correlation matrix was 0.009; the KMO measure of sampling adequacy was 0.615; Bartlett’s sphericity test was 0.000; and the calculated chi-square was 42.720 with 15 degrees of freedom and a significance level of 0.000, against the critical chi-square value in the distribution table of 26.996 with a significance level of 0.05.
The quality variables already ordered were normalized to obtain zero means and unit variances. After this, the PCA was processed, with the eigenvalues, eigenvectors, loads, communalities, and quality indicators for each TGPU presented in Table 3.
Table 3.
Principal component (PC) analysis for the quality indicator.
Principal components (PC) 1, 2, and 3 were used, which together explained 90.487% of the total variance (3.056 + 1.687 + 0.686)/6, thereby validating the assumption of considering variances above 80%. The quality indicator (Q_I) was calculated based on the multiplication of the eigenvalues of the three main components, with the standardized variables of each packing house. Next, the values were normalized within the interval of [0–1].
TGPUs M and G exhibited the highest quality indicators, and TGPUs I and J had the worst evaluations. The high power of the method to promote the discrimination of the results for the database used is also noted.
3.2.5. Flexibility, Speed, and Reliability Performance Goal Indicators
These indicators were calculated using (2), (3), and (4) to represent the performance objectives for flexibility (F_I) to portray the product mix processed per day at the TGPU, speed (S_I) to measure the speed at which the operation processed a batch, and reliability (R_I) to measure the delivery of the schedule within the normal working hours. These values are presented in Table 4.
Table 4.
Indicators F_I, S_I, and R_I.
3.2.6. Correlations and Standard Deviations
Different measurement units were observed for each indicator. Thus, before calculating the correlation between indicators and the standard deviation of each indicator, the values were normalized to the same amplitude within the interval of [0–1], as indicated in Table 5.
Table 5.
Normalized indicators [0–1].
Subsequently, the correlations between the five indicators and the significance matrix of the correlations were calculated. The results are shown in Table 6.
Table 6.
Correlations among five indicators and significance matrix of the correlations.
It was observed that the quality indicator was inversely proportional to the other indicators, with emphasis on the speed indicator, whose correlation was −0.86.
The significance values indicated lower results for pairs with greater correlation. Depending on these data, the two largest correlation pairs Q_I/S_I (−0.86) and C_I/S_I (0.7) obtained the lowest values of significance (0.0002) and (0.008), as well as the only results below 1%. Thus, the alternative hypothesis with a significance level of 1% was confirmed by statistical tests that showed correlation only in the pairs Q_I/S_I_ and C_I/S_I. Although the S_I indicator correlates with the two indicators mentioned above, its importance comes from the independence from the other indicators.
Subsequently, the standard deviation of each indicator was calculated. The values are presented in Table 7.
Table 7.
Standard deviations.
As all standard deviation values are similar, they all seem important, which reinforces and confirms the importance of the chosen indicators.
4. Conclusions
4.1. Concluding Remarks
The application of the proposed method was effective in the development of indicators for the case study performance objectives. The present method included the following steps: contextualization of TGPUs through a bibliographic survey; the selection of performance objectives by analyzing the most used ones; the choice of techniques to be used in the development of indicators through the investigation of existing techniques; and the calculation of indicators in the case study.
It is noteworthy that DEA was adopted for the definition of the relative efficiency of the units (representing the cost), and PCA was used for the quality composition. The quantification of the batch variety was applied for the flexibility. Next, the fulfilment of the schedule in the established timeline was used for the reliability. Finally, the measurement of the execution time cycle/batch was adopted for the speed.
The results obtained in the case study demonstrate that the correlations between the performance indicators do not indicate the need to disregard any of them. Furthermore, the standard deviation values for each indicator were similar. Thus, both results confirmed the importance of the indicators chosen for the performance evaluation of TGPUs.
Hence, we successfully address the gap in the literature regarding performance evaluation indicators. With our research results, the management of TGPUs, which are considered critical in the table grape supply chain, can be enhanced. The findings of this study are expected to contribute to developing more efficient methods to evaluate production units, by means of indicators that are more consistent with the business reality. The proposed method compares TGPUs and stimulates practices related to the fundamental benchmarking concept for the development of the VSSF. Another practical implication of this proposal comprehends the use of the indicators developed in the formation of actions in favor of the sustainability of the TGPUs and of the entire supply chain, resulting in positive impacts on the sustainability dimensions.
4.2. Suggestion for Future Works
Considering the potential for the practical application of the method, this work can be extended to other business groups or cooperatives of table grape producers in different regions. In addition, it is possible to extend the method to other types of production units, for example, producers of cheese, milk, wine, or coffee, so as to improve the management of units.
A possible limitation in the extension of the method to other processes concerns the selection of a sufficient number of DMUs, with similarity in the production process and in the operational records for the effective application of DEA and PCA. However, the limitation can be overcome by involving managerial actions in favor of planning data collection for the required applications.
Although this study is specific to TGPUs, its results are not limited to this work and can be considered in new research, given the importance of the indicators developed. In future research, a method can be proposed to compose these indicators in a robust global index for the evaluation of TGPUs. According to [64], the advantages of global classifications, when compared to individual indicators, are concerned with: facilitating interpretation; instruction and communication; monitoring progress over time; and use in decision making.
Author Contributions
Conceptualization, E.K., A.F. and C.C.; methodology, E.K., A.F. and C.C.; validation, E.K. and A.F.; formal analysis, M.E.; investigation, E.K.; resources, E.K.; data curation, E.K. and C.C.; writing—original draft preparation, E.K.; writing—review and editing, M.E.; supervision, M.E. All authors have read and agreed to the published version of the manuscript.
Funding
This research received no external funding.
Institutional Review Board Statement
Not applicable.
Informed Consent Statement
Not applicable.
Data Availability Statement
The data presented in this study are available on request from the corresponding author. The data are not publicly available due to restrictions privacy.
Acknowledgments
We would like to thank the table grape producers in the São Francisco Valley, for the research data.
Conflicts of Interest
The authors declare no conflict of interest.
References
- De Lima, E.P.; da Costa, S.E.G.; Angelis, J.J.; Munik, J. Performance measurement systems: A consensual analysis of their roles. Int. J. Prod. Econ. 2013, 146, 524–542. [Google Scholar] [CrossRef]
- Dienstmann, J.S.; Lacerda, R.T.D.O.; Ensslin, L.; Ensslin, S.R. Gestão da inovação e avaliação de desempenho: Processo estruturado de revisão da literatura. Rev. Produção Online 2014, 14, 2–30. [Google Scholar] [CrossRef][Green Version]
- Domínguez Serrano, M.; Blancas Pera, F.J.; Guerrero Casas, F.M.; González Lozano, M. Uma revisión crítica para la construcción de indicadores sintéticos. Rev. Métodos Cuantitativos Para Econ. Empresa 2011, 11, 41–70. [Google Scholar]
- Callado, A.L.C.; Callado, A.A.C.; Almeida, A. A utilização de indicadores de desempenho não-financeiros em organizações agroindustriais: Um estudo exploratório. Rural Agro Ind. Organ. 2008, 10, 1–14. [Google Scholar] [CrossRef]
- Leão, P.C.S. Novas tecnologias para a produção de uvas de mesa. In Proceedings of the 9th Semana Internacional da Fruticultura, Floricultura e Agroindústria, Ceará, Brazil, 16–19 September 2002. [Google Scholar]
- Blanco, A.; Masini, G.; Petracci, N.; Bandoni, J. Operations management of a packaging plant in the fruit industry. J. Food Eng. 2005, 70, 299–307. [Google Scholar] [CrossRef]
- Lambert, G.F.; Lasserre, A.A.A.; Ackerman, M.M.; Sánchez, C.G.M.; Rivera, B.O.I.; Azzaro-Pantel, C. An expert system for predicting orchard yield and fruit quality and its impact on the Persian lime supply chain. Eng. Appl. Artif. Intell. 2014, 33, 21–30. [Google Scholar] [CrossRef]
- Freires, F.G.M.; Marinho, S.V.; Walter, F. Canais de Distribuição da Manga e da Uva de Mesa Produzidas no Vale do São Francisco: Uma Análise Comparative; ENEGEP: Bento Gonçalves, RS, Brazil, 2000. [Google Scholar]
- Emídio, T.F.D.; Pires, W.E.L.; Leite, A.A.M. O Processo de Modernização das Fazendas Produtoras e Exportadoras de Uvas de Mesa da Microrregiao de Juazeiro–BA.; ENEGEP: Fortaleza, CE, Brazil, 2015. [Google Scholar]
- Vasconcelos, O.; Turco, S.; Dacanal, C.; Luz, S.; Freitas, S. Thermal Environment of Table Grape Packing Houses in the São Francisco Valley. Engenharia Agrícola 2017, 37, 35–45. [Google Scholar] [CrossRef]
- Smit, R.; Treurnicht, N.; Blanckenberg, M. Table Grape Punnet Packaging: The Influence of Check-Weighing. S. Afr. J. Ind. Eng. 2012, 23, 196. [Google Scholar] [CrossRef][Green Version]
- Mesabbah, M.; Rahoui, S.; Ragab, M.A.F.; Mahfouz, A.; Arisha, A. Seasonal recruiting policies for table grape packing operations: A hybrid simulation modelling study. In Proceedings of the Winter Simulation Conference (WSC), Las Vegas, NV, USA, 3–6 December 2017. [Google Scholar] [CrossRef]
- Food and Agriculture Organization. Food and Agriculture Organization of the United Nations Production Quantities by Country. 2016. Available online: http://faostat3.fao.org/ (accessed on 6 September 2020).
- Mesabbah, M.; Mahfouz, A.; Ragab, M.A.F.; Arisha, A. Hybrid modeling for vineyard harvesting operations. In Proceedings of the Winter Simulations Conference (WSC), Washington, DC, USA, 11–14 December 2016. [Google Scholar] [CrossRef]
- Bititci, U.S.; Turner, T.J.; Begemann, C. Dynamics of performance measurement systems. Int. J. Oper. Prod. Manag. 2000, 20, 692–704. [Google Scholar] [CrossRef]
- Martins, R.A. Sistemas de Medição de Desempenho: Um Modelo para Estruturação do Uso. PhD. Thesis, Escola Politécnica da Universidade de São Paulo, São Paulo, Brazil, 1999. [Google Scholar]
- Tezza, R.; Bornia, A.C.; Vey, I.H. Sistemas de medição de desempenho: Uma revisão e classificação da literatura. Gestão Produção 2010, 17, 75–93. [Google Scholar] [CrossRef]
- Santos, L.A. Integração do Balanced Scorecard e Modelo de Slack com ênfase na gestão do Desempenho Organizacional para o ramo de Telecomunicações. Master’s Thesis, Universidade Federal de Santa Maria, Santa Maria, RS, Brazil, 2016. [Google Scholar]
- Keegan, D.P.; Eiler, R.G.; Jones, C.R. Are your performance measures obsolete? Manag. Account. 1989, 70, 45–50. [Google Scholar]
- Cross, K.F.; Lynch, R.L. The “SMART” way to define and sustain success. Natl. Prod. Rev. 1988, 8, 23–33. [Google Scholar] [CrossRef]
- Kaplan, R.S.; Norton, D.P. strategic learning and the balanced scorecard. Strat. Leadersh. 1996, 24, 18–24. [Google Scholar] [CrossRef]
- Neely, A.; Adams, C.; Crowe, P. The performance prism in practice. Meas. Bus. Excel. 2001, 5, 6–13. [Google Scholar] [CrossRef]
- Slack, N.; Chanbers, S.; Harland, C.; Harrison, A.; Johnson, R.V. Admisnitração da Produção; Atlas: São Paulo, SP, Brazil, 2006. [Google Scholar]
- Ferreira, L.M.D.F.; Silva, C.; Azevedo, S.G. An environmental balanced scorecard for supply chain performance measurement (Env_BSC_4_SCPM). Benchmarking Int. J. 2016, 23, 1398–1422. [Google Scholar] [CrossRef]
- Lucero, A.G.R. Um método para desenvolvimento de medidas de desempenho como apoio à gestão de sistemas de manufatura. PhD. Thesis, Universidade Federal de Santa Catarina, Florianópolis, Brazil, 2016. [Google Scholar]
- Thomas, L.J.; Hayes, R.H.; Wheelwright, S.C. Restoring Our Competitive Edge: Competing through Manufacturing. Adm. Sci. Q. 1985, 30, 305. [Google Scholar] [CrossRef]
- Platts, K.; Gregory, M. Manufacturing Audit in the Process of Strategy Formulation. Int. J. Oper. Prod. Manag. 1990, 10, 5–26. [Google Scholar] [CrossRef]
- Spring, M.; Boaden, R. “One more time: How do you win orders?”: A critical reappraisal of the Hill manufacturing strategy framework. Int. J. Oper. Prod. Manag. 1997, 17, 757–779. [Google Scholar] [CrossRef]
- Farrell, M.J. The Measurement of Productive Efficiency. J. R. Stat. Soc. 1957, 120, 253–290. [Google Scholar] [CrossRef]
- Almeida, M.; Rebelatto, D. Sistematização das técnicas para avaliar a eficiência: Variáveis que influenciam a tomada de decisão estratégica. In Proceedings of the II SEGeT, Simpósio de Excelência em Gestão e Tecnologia, Rezende RJ, Brazil, 26–28 October 2005; Available online: https://www.aedb.br/seget/arquivos/artigos06/799_Tecnicas%20para%20avaliar%20a%20eficiencia%20em%20infra%20-%20final.pdf (accessed on 20 June 2020).
- Daraio, C.; Simar, L. Conditional nonparametric frontier models for convex and nonconvex technologies: A unifying approach. J. Prod. Anal. 2007, 28, 13–32. [Google Scholar] [CrossRef]
- Mastromarco, C.; Simar, L. Effect of FDI and Time on Catching Up: New Insights from a Conditional Nonparametric Frontier Analysis. J. Appl. Econ. 2014, 30, 826–847. [Google Scholar] [CrossRef]
- Charnes, A.; Cooper, W.W.; Rhodes, E. Measuring the efficiency of decision making units. Eur. J. Oper. Res. 1978, 2, 429–444. [Google Scholar] [CrossRef]
- Bagchi, M.; Zhuang, L. Analysis of farm household technical efficiency in Chinese litchi farm using bootstrap DEA. Custos e Agronegócio Online 2016, 12, 378–393. [Google Scholar]
- Cooper, W.W.; Seiford, L.M.; Tone, K. Data Envelopment Analysis: A Comprehensive Text with Models, Applications, References and DEA-SOLVER Software; Kluwer Academic Publishers: Dordrecht, The Netherlands, 2000. [Google Scholar]
- Dong, F.; Mitchell, P.D.; Knuteson, D.; Wyman, J.; Bussan, A.; Conley, S. Assessing sustainability and improvements in US Midwestern soybean production systems using a PCA–DEA approach. Renew. Agric. Food Syst. 2015, 31, 524–539. [Google Scholar] [CrossRef]
- Cui, N.; Sang, H.; Yu, X. Research on the Development Efficiency of Family Farm based on DEA Model: A Case Study. Int. J. Smart Home 2016, 10, 93–104. [Google Scholar] [CrossRef]
- Alrwis, K.N.; Aldawdahi, N.M.; Ahamad, S.A.B. Estimate the production efficiency of the dairy plants in Saudi Arabia using Data Envelopment Analysis (DEA). Custos Agronegócio Online 2015, 11, 298–316. [Google Scholar]
- Kočišová, K. Application of the DEA on the measurement of efficiency in the EU countries. Agric. Econ. 2016, 61, 51–62. [Google Scholar] [CrossRef]
- Nowak, A.; Kijek, T.; Domańska, K. Technical efficiency and its determinants in the European Union. Agric. Econ. 2016, 61, 275–283. [Google Scholar] [CrossRef]
- Toma, E.; Dobre, C.; Dona, I.; Cofas, E. DEA Applicability in Assessment of Agriculture Efficiency on Areas with Similar Geographically Patterns. Agric. Agric. Sci. Procedia 2015, 6, 704–711. [Google Scholar] [CrossRef]
- Toma, P.; Miglietta, P.P.; Zurlini, G.; Valente, D.; Petrosillo, I. A non-parametric bootstrap-data envelopment analysis approach for environmental policy planning and management of agricultural efficiency in EU countries. Ecol. Indic. 2017, 83, 132–143. [Google Scholar] [CrossRef]
- Semeoshenkova, V.; Newton, A.; Contin, A.; Greggio, N. Development and application of an Integrated Beach Quality Index (BQI). Ocean Coast. Manag. 2017, 143, 74–86. [Google Scholar] [CrossRef]
- Robati, M.; Monavari, S.M.; Majedi, H. Urban environment quality assessment by using composite index model. Environ. Prog. Sustain. Energy 2015, 34, 1473–1480. [Google Scholar] [CrossRef]
- Ribeiro, R.J.C. Índice composto de qualidade de vida urbana: Aspectos de configuração espacial, socioeconômicos e ambientais urbanos. PhD. Thesis, Universidade de Brasília, Brasilia, Brazil, 2008. [Google Scholar]
- Boccuzzo, G.; Gianecchini, M. Measuring Young Graduates’ Job Quality Through a Composite Indicator. Soc. Indic. Res. 2014, 122, 453–478. [Google Scholar] [CrossRef]
- Kubrusly, L.S. Um Procedimento Para Calcular Índices a Partir de Uma Base de Dados Multivariados. Pesqui. Oper. 2001, 21, 107–117. [Google Scholar] [CrossRef]
- Figueiredo Filho, D.B.; Paranhos, R.; Rocha, E.C.; Silva, J.A.; Maia, R.G. Análise de componentes principais para construção de indicadores sociais. Rev. Bras. Biom. 2013, 31, 61–78. [Google Scholar]
- Liu, K.; Jain, S.; Shi, J. Physician performance assessment using a composite quality index. Stat. Med. 2012, 32, 2661–2680. [Google Scholar] [CrossRef] [PubMed]
- Nardo, M.; Saisana, M.; Saltelli, A.; Tarantola, S.; Hoffman, A.; Giovannini, E.; Handbook on Constructing Composite Indicators: Methodology and User Guide. OECD Statistics Working Papers 2005/03. 2008. Available online: https://www.oecd.org/sdd/42495745.pdf (accessed on 10 June 2019).
- Field, A. Descobrindo a Estatística Usando o SPSS, 2nd ed.; Viali, L., Ed.; Artmed: Porto Alegre, RS, Brazil, 2009. [Google Scholar]
- Kaiser, H.F. The Application of Electronic Computers to Factor Analysis. Educ. Psychol. Meas. 1960, 20, 141–151. [Google Scholar] [CrossRef]
- Mingoti, S.A. Análise de Dados Através de Métodos de Estatística Multivariada, Uma Abordagem Aplicada; UFMG: Belo Horizonte, MG, Brazil, 2007. [Google Scholar]
- Manly, B.F.J. Métodos Estatísticos Multivariados: Uma Introdução, 3rd ed.; Bookman: Porto Alegre, RS, Brazil, 2008. [Google Scholar]
- Upward, A.; Jones, P.H. An Ontology for Strongly Sustainable Business Models. Organ. Environ. 2016, 29, 97–123. [Google Scholar] [CrossRef]
- Pucci, T.; Casprini, E.; Galati, A.; Zanni, L. The virtuous cycle of stakeholder engagement in developing a sustainability culture: Salcheto winery. J. Bus. Res. 2020, 119, 364–376. [Google Scholar] [CrossRef]
- Chin, T.A.; Tat, H.H.; Sulaiman, Z. Green Supply Chain Management, Environmental Collaboration and Sustainability Performance. Procedia CIRP 2015, 26, 695–699. [Google Scholar] [CrossRef]
- Hamprecht, J.; Corsten, D.; Noll, M.; Meier, E. Controlling the sustainability of food supply chains. Supply Chain Manag. Int. J. 2005, 10, 7–10. [Google Scholar] [CrossRef]
- Fiore, M.; Galati, A.; Gołębiewski, J.; Drejerska, N. Stakeholders’ involvement in establishing sustainable business models. Br. Food J. 2020, 122, 1671–1691. [Google Scholar] [CrossRef]
- Stubbs, W.; Cocklin, C. Conceptualizing a “Sustainability Business Model”. Organ. Environ. 2008, 21, 103–127. [Google Scholar] [CrossRef]
- Giacomarra, M.; Crescimanno, M.; Sakka, G.; Galati, A. Stakeholder engagement toward value co-creation in the F&B packaging industry. EuroMed J. Bus. 2019, 15, 315–331. [Google Scholar] [CrossRef]
- Rodrigues, J. Competitividade das Exportações Brasileiras de Frutas para o Mercado Europeu. Master’s Thesis, Universidade Federal Rural de Pernambuco, DLCH, Recife, PE, Brazil, 2012. [Google Scholar]
- Julião, L. Competitividade da Viticultura Regional e Brasileira: Uma Análise Setorial e Comparativa com Produtores Mundiais. Master’s Thesis, Universidade de Sao Paulo, FEA, Sao Paulo, SP, Brazil, 2015. [Google Scholar]
- Zhou, P.; Ang, B.W. Comparing MCDA Aggregation Methods in Constructing Composite Indicators Using the Shannon-Spearman Measure. Soc. Indic. Res. 2008, 94, 83–96. [Google Scholar] [CrossRef]


Publisher’s Note: MDPI stays neutral with regard to jurisdictional claims in published maps and institutional affiliations. |
© 2021 by the authors. Licensee MDPI, Basel, Switzerland. This article is an open access article distributed under the terms and conditions of the Creative Commons Attribution (CC BY) license (http://creativecommons.org/licenses/by/4.0/).