Article

Gender and Social Seed Networks for Climate Change Adaptation: Evidence from Bean, Finger Millet, and Sorghum Seed Systems in East Africa

by
Gloria Otieno
1,*,
Wesley Mlsna Zebrowski
2,
John Recha
3 and
Travis William Reynolds
4,*
1
Alliance of Bioversity International and CIAT, Kampala 24384, Uganda
2
O’Neill School of Public and Environmental Affairs, University of Indiana, Bloomington, IN 46202, USA
3
International Livestock Research Institute, CGIAR Research Program on Climate Change, Agriculture and Food Security (CCAFS), Nairobi 30709-00100, Kenya
4
Department of Community Development and Applied Economics, University of Vermont, Burlington, VT 05405, USA
*
Authors to whom correspondence should be addressed.
Sustainability 2021, 13(4), 2074; https://doi.org/10.3390/su13042074
Submission received: 1 January 2021 / Revised: 7 February 2021 / Accepted: 9 February 2021 / Published: 15 February 2021

Abstract

:
In many East African countries, women and men have different levels of access to formal markets for agricultural inputs, including seed, reflecting a combination of gender norms and resource constraints. As a result, women and men may have different levels of participation in—and reliance upon—informal seed systems for sourcing preferred planting material and accessing new crop varieties over time. We use network analysis to explore differences in seed networks accessed by women and men for three major food security crops—beans, finger millet, and sorghum—in Kenya, Tanzania, and Uganda. Drawing on data from an original survey of 1001 rural farm households across five study sites, we find that women, on average, have fewer connections to experts and farmers’ groups than men but are relatively better connected in farmer-to-farmer social networks across different farming systems. We further find women’s and men’s networks are clustered by gender (i.e., women’s networks include more women, and men’s networks include more men)—and that men’s networks are more likely to exchange improved seed. Women’s networks, though sometimes larger, are less likely to exchange improved varieties that might help farmers adapt to climate change. Women farmers across contexts may also be more reliant on farmer-to-farmer networks than men due to their relative isolation from other seed and information sources. Findings emphasize the need for careful attention to the different implications of seed policies, market interventions, and other seed system reforms to support gender-equitable food security options for women and men in sub-Saharan Africa.

1. Introduction

Women and female-headed agricultural households in sub-Saharan Africa regularly face production constraints—including discrepancies in access to resources such as land and agricultural inputs—that are associated with higher rates of poverty and food insecurity among women farmers than men [1,2,3,4]. East Africa’s economies are heavily dependent on small-scale agriculture, with at least two-thirds of all food production in the region coming from smallholder farms of less than 2 hectares and with minimal livestock holdings [5]. At the same time, East Africa has some of the highest rates of undernutrition globally [6,7,8]; efforts to sustain and enhance the productivity of women smallholders in the face of climate change and other threats to regional food systems are thus key to broader regional food security goals.
Climate change adaptation among smallholder farmers is one of the essential components to supporting food security and realizing broader regional economic development [9]. Past studies of East African farmers’ perceptions of climate change have identified shifting growing seasons, erratic rainfall, rising temperatures, longer drought periods, increased frequency of natural disasters, and the arrival of new crop and livestock pests and diseases as key areas of concern [10,11,12,13,14]. Changes in temperature and precipitation patterns have already led to unpredictable rainfall and a shorter growing season in parts of East Africa, with viable crop seasons expected to continue to shorten under the changing climate [15]. Due to the rain-dependence of much of the small-scale agriculture in the region, climate-change-related variability threatens to undermine rural agricultural production systems, livelihoods, and food security [13]. Resource-constrained rural smallholder farmers, including many women and female-headed households [16], are particularly vulnerable to climate change and may also lack access to resources (e.g., land, credit, and inputs including crop genetic resources) and the information needed to use those resources most effectively [17].
Farmers with limited resources may attempt to adapt to climate change effects and uncertainty by replacing their current crops with more resilient, alternative crops. In Zimbabwe, for instance, Progressio [17] found that many farmers were replacing maize crops with sorghum and millet, which are better adapted to the increasingly arid environment. Farmers may also adapt by seeking out drought-tolerant and early maturing varieties of the same crop they were growing previously [17,18,19]. In many cases, existing local crop diversity may present an opportunity for quicker adaptation to climatic stressors and variability [20]. This local genetic diversity may be especially consequential for women farmers, given that women and men may and often do have different levels of access to both agricultural input markets (including improved seed through formal seed systems) and agricultural output markets (including opportunities to sell new crops or varieties with greater market value), reflecting a combination of gender norms and resource constraints [21,22]. Such differences in market access mean that women and men may have different levels of participation in—and reliance upon—informal seed systems, including direct farmer-to-farmer exchange of seed through networks of neighbors and family, for sourcing preferred planting material and accessing new crop varieties over time.
In this paper, we use network analysis to explore differences in seed networks across women and men for three major food security crops—beans, finger millet, and sorghum—in Kenya, Tanzania, and Uganda. We focus on differences across women and men smallholders in terms of access to experts (e.g., extension services), access to farmer groups (e.g., farmers’ or women’s associations), and individual links to other farmers (farmer-to-farmer seed exchange). Drawing on original survey data collected from 1001 rural farm households across five study sites in the three countries, we examine variation in women versus men’s participation in informal seed networks across different agroecological and socio-institutional contexts.
In the next section, we review the recent literature on informal seed systems in East Africa and the use of social network analysis for the study of seed systems. We then summarize the data and network analysis methods used, followed by the results, comparing women’s and men’s access to agricultural experts, farmers’ groups, and direct farmer-to-farmer seed exchange for the primary crops grown in each study site. We conclude with a discussion of the potential gender-related implications of seed policies, market interventions, and other seed system reforms such as integrated seed systems development programs targeting supportive policies and institutions for both formal and informal seed systems in sub-Saharan Africa.

2. Informal Seed Networks in East Africa

Even as the formal seed sector continues to expand in many low- and middle-income countries, informal seed systems—including informal exchange of farmer-saved seed with neighbors and extended family—have remained the primary source of planting material for many smallholder farming communities. In East Africa, informal seed networks—consisting of seed obtained from own saved seed, exchange with neighbors, or seed obtained from local markets—supply as much as 80% of seed for some crops and geographies [23,24]. Smallholder farmers in particular often rely on informal seed networks to provide desired local varieties (which may or may not be available through formal channels) at the desired quantity and price [25,26,27].
Informal seed networks may also provide support for adaptation to climate change—the effects of climate change lead to shifts in small-scale farmers’ demand for specific crops and varieties [18] with desirable traits (e.g., drought tolerance), with ultimate seed choices affected by the farmers’ seed networks and their access to seed through either formal or informal seed system channels. Because many of the varieties exchanged through informal seed systems have evolved in the local environment, localized seed networks may be especially important for providing access to varieties already adapted to the local area’s agro-ecological conditions [27,28]. These informal seed networks are, thus, an important element in ensuring access to climate-resilient seeds at the prices and quantities required by the farmers [25] and, at the same time, maintaining and conserving the crop genetic diversity needed for future climate change adaptation [29].

Gender Dimensions of Seed Networks

Gender norms and differences in access to resources among women and men can significantly affect the processes of agricultural production, consumption, and distribution [30]. Gender norms often constrain women’s agricultural productivity, in part via a lack of equal access to seed, technologies, land, and other production factors. The World Bank outlines ten policy priorities to “close the gender gap” in agricultural production in Africa, with more than half focused on improving women’s access to inputs (i.e., improved seed) or output markets (i.e., sales of high-value/cash crops) [31]. Some recent studies have further underscored the myriad constraints women smallholders may face in accessing technology and information for agricultural production [32]: women farmers tend to have smaller plot sizes, they experience difficulties in accessing seed with desired production qualities through formal market channels, and women may have limited access to other resources such as inputs and capital for agricultural production [33,34]. In the aggregate, women’s unequal access to and control over resources compared to men’s is one of the underlying causes of global hunger—social and economic inequalities between women and men can undermine national and regional food security and impede/hinder economic growth and advances in agriculture [35].
Previous studies have shown that farmers’ access to seed can be heavily influenced by demographic factors including both wealth and gender norms [32,36]. In addition to facing resource and market constraints, women and men may also be constrained by gender norms defining “women’s” and “men’s” crops. In the Tharaka region of Kenya, for example, the maintenance of pearl millet seed and grain is considered the women’s responsibility [37]. Gendered differences in crops cultivated in part reflects the fact that, in many contexts, women are more focused on production for household food consumption, while men are more likely to grow at least some crops for cash [22,34,38].
In part a consequence of gender norms, women and men farmers often have separate social networks, exposing them to different crop varieties and different sources of crop information. Tadesse et al. [32] found that men in Ethiopia are more likely to share seeds and information with other men farmers, while women share almost equally with men and women farmers. However, they also found that women tend to have a greater role in sharing seeds outside of their community because they are often the ones to move to new households upon marriage and maintain family ties with their extended family in other villages or regions. As a consequence, in times of stress when larger amounts of different seed varieties may be needed than usual, women have been shown to be more likely to engage in long-distance seed acquisition, as for example, in the case of Uganda with pearl millet seed [32,39]. In East Africa, although women’s social networks are often smaller than men’s, their connections to distant relatives and peers can serve to geographically extend seed networks and potentially enhance resilience.
Finally, gendered differences in social networks can also influence the spread of information alongside genetic resources. In an analysis of nine East and West African countries, Perez et al. [40] found that men’s social networks rely on bridging and linking social capital, including more extensive connections to formal institutions (e.g., expertise through agricultural extension services or farmers’ groups), while women’s social networks were more likely to rely on bonding social capital (connections with family and friends). Other studies have reported that extension officers are more likely to work through male heads of households and may not reach out to women [40,41], and that women often rely less on governmental extension information sources [42]. In the presence of such differences, some studies have shown strengthening women’s social networks to be associated with improved agricultural productivity [43]. Given that women are estimated to comprise some 50–70% of the agricultural labor force in East African countries [35], improvements in women’s social networks for agricultural production might have broad impacts for household and regional food security, productivity, and economic development [32,39].
The existing literature provides ample reason to suspect systematic differences in access to and use of social seed networks by women and men, with potentially important implications for the climate change adaptation strategies undertaken. This paper draws on original survey data from three communities in Kenya, Tanzania, and Uganda to examine and better understand the dynamics of women and men smallholder farmers’ social networks and their resulting access to and exchange of seeds and information for climate change adaptation. By better understanding the differential impacts of social networks on resource access and information exchange by gender, our paper aims to determine whether these differences and/or similarities influence how women and men maintain, exchange, and access crop diversity for climate change adaptation. We also hope to inform gender-specific interventions to improve women’s access to genetic diversity for climate change adaptation in East Africa.

3. Materials and Methods

3.1. Use of Social Network Analysis for the Study of Seed Systems
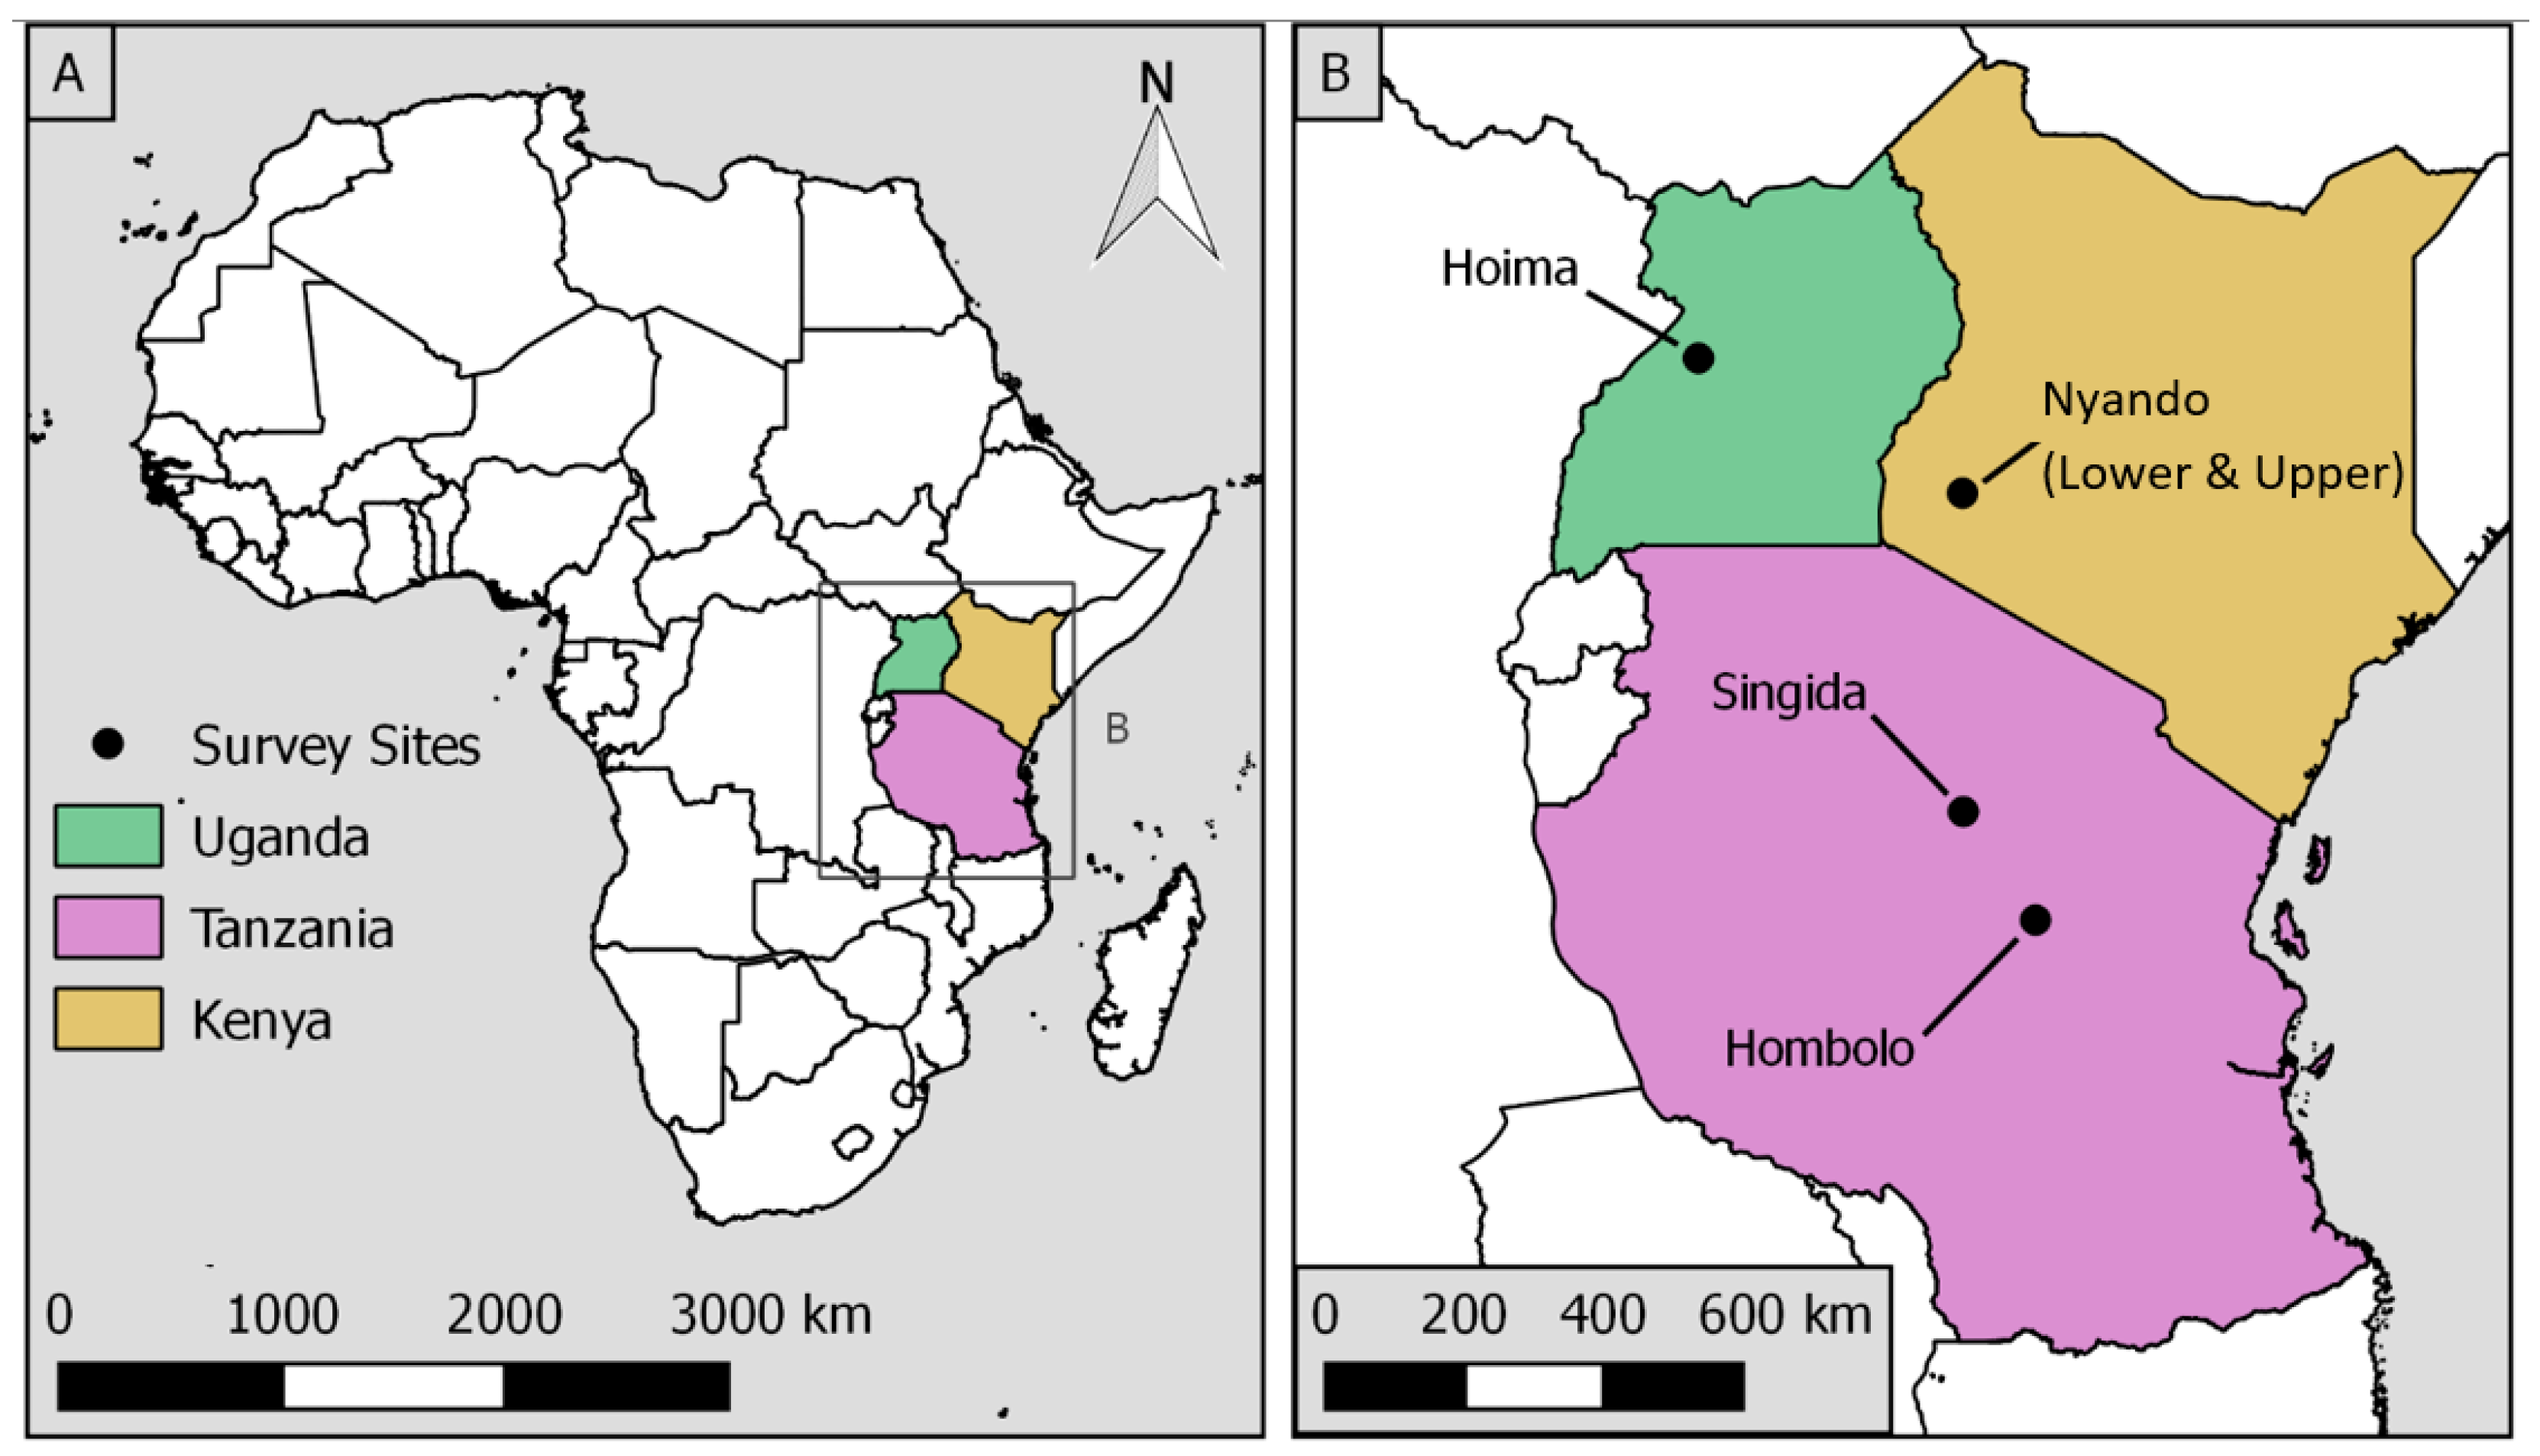
A social network broadly consists of interpersonal relationships, social interactions, and/or the exchange of goods or information. Although social network theory is relatively new in the study of farmers’ seed systems, some recent studies have applied the techniques to understand the importance of farmers’ networks in accessing and exchanging seed diversity and new technologies [44,45] with some studies in sub-Saharan African countries including Cameroon [39], Ghana [46], and Ethiopia [47,48].
Previous findings applying network analysis to seed systems suggest that community networks play key roles in managing local crop diversity and making diverse planting material accessible to farmers [49] and that such networks may have positive or negative impacts on farmers’ access to seed and information for climate change adaptation (depending on level of access to the network). Network metrics can be used to describe not only the number of linkages a given farmer has to other farmers, but also the direction and the strengths of those linkages. Commonly reported measures include degree centrality and betweenness centrality. Degree centrality is a count of the number of ties associated with any given node in a network (i.e., the number of other farmers providing seed to or receiving seed from a given farmer). In a social network, those with high degree centrality are characterized as prominent (more ties going in) and/or influential (more ties going out) [50,51]. Betweenness centrality measures the number of times a node lies on the shortest path between other nodes and is an indication of the “bridges” between nodes in the network [52]. These measures can help to identify nodal farmers, who are farmers with the most links in a given network, and who might be targeted for dissemination of new crop varieties and information about successful climate change adaptation strategies.

3.2. Study Sites

The three study countries in the East Africa region have some of the highest rates of undernutrition globally [6], with Kenya, Tanzania, and Uganda ranked 87th, 98th, and 89th, respectively, of 113 countries in overall national food security (The Economist Intelligence Unit, 2018). Case study sites were selected by the international agricultural research institute Bioversity International as representative of the primary agro-ecological systems in the region and include five sites: Lower Nyando and Upper Nyando in Kenya; Hombolo and Singida in Tanzania; Hoima in Uganda (Figure 1). Agriculture is the main activity for food security and livelihoods, with mixed farming being practiced in these sites by all smallholder farm households surveyed (Table 1).

3.3. Survey Methods and Focus Group Discussions

Data were collected from July through October of 2016. The sample of 1001 households includes 365 households from Lower and Upper Nyando in Kenya, 334 from Hombolo and Singida in Tanzania, and 302 from Hoima District in Uganda. The research team adopted a snowball sampling approach, a common approach used to identify the sample for a network survey. For initial interviews, we first identified two nodal farmers, a woman and a man, from each village during focus group discussions. As part of the network survey, these farmers provided the names of several other farmers from whom they obtained seed and/or information on seeds. We then surveyed the farmers named by the first two respondents. This process was continued until the interviewed farmers began to mention the same names again, completing the cycle of farmers within the community network.
Surveyed farmers were asked to name the varieties of seed they had used in the last year and from where they had sourced the seed; if they mentioned a neighbor or a farmer, they were asked to name them. The farmers were also asked to name anyone they had shared seed with in the last year; these farmers were also interviewed. Additionally, all respondents were asked to name experts, for example, extension workers or agronomists, from whom they had received seed. The surveys also collected various farm-level data on crops grown, farm level assets such as land, access to tools and assets, sources of seed and seed exchange networks, varieties of seed used and exchanged, varieties used for climate change adaptation, sources of expert information, and relationships between farmers and experts/extension. All survey data were entered on-site into the Open Data Kit (ODK) platform using tablets, to ensure data quality.
Finally, survey findings were supplemented by two focus group discussions conducted in each sample site, with women and men farmers gathering separately. Focus groups consisted of groups of 12–20 farmers with the aim of corroborating information obtained from the surveys regarding local perceptions of climate change, strategies adopted for climate change adaptation, and preferred seeds exchanged by farmers. Focus group discussions and expert consultations also supported the identification of seeds reported by farmers, including whether the varieties were local or improved. Discussions also explored the strength of community relationships with experts from extension services, research institutions, NGOs, and different government ministries.

3.4. Data Analysis

Preliminary analysis of the descriptive statistics on the various variables of importance was conducted by site and by gender in order to identify differences in: crops grown; types of varieties grown; assets; education; involvement in off-farm activities; access to information and extension services.
For the seed network analysis, the data were analyzed in R (4.0.3) and visualized in Gephi (0.9.2) network analysis software. Following established methods drawn from our review of literature, we conduct a social seed network analysis [44,48,53,54] illustrating how seeds are exchanged between men and women and how network structure differs by crop type and site. The relationships among farmers within each network were assessed through measures of degree centrality and betweenness centrality, both by gender and by major crop type for each network.
For all seed networks, we further examined the subset of farmers who reported growing the key crops identified through focus group discussions as those most supporting climate change adaptation, such as sorghum, finger millet, cassava, beans, and other legumes such as cow pea. Information gathered during focus group discussions indicated that farmers in Kenya, Tanzania, and Uganda were choosing new varieties of beans in some cases and, in others, replacing maize with more resilient sorghum and millet varieties, as a result of climate change. We thus further examined the social seed networks of those farmers adopting new/different crops and varieties as an adaptation strategy to climate change—again with a focus on differences by gender.

4. Results

4.1. Farmer Characteristics by Gender

In all five study sites, the majority of households were male-headed; however, in the Hombolo community, the difference was much less pronounced, with 58% of households headed by a man, and 42% by a woman. In all five sites, there were larger numbers of young women farmers. Men farmers between the ages of 21–30 made up 0% of the Lower Nyando sample, 12% of Upper Nyando, 4% of Hombolo, 6% of Singida, and 12% of Hoima. In contrast, women farmers between the ages of 21–30 made up 2% of the Lower Nyando sample, 13% of Upper Nyando, 11% of Hombolo, 16% of Singida, and 14% of Hoima. Male household heads were overwhelmingly married, with a small percentage of single, divorced, widowed, and cohabiting. Female heads of household were only slightly less likely to be married, yet a higher percentage of female heads of household were widowed. In the study sites, widowed female heads of household were 37% (Lower Nyando), 23% (Upper Nyando), 26% (Hombolo), 4% (Singida), and 12% (Hoima) of all female-headed households. In comparison, widowed male heads of households were only reported in Lower and Upper Nyando and Hoima, with 3%, 3%, and 4%, respectively, of the total.
There were also noteworthy discrepancies by gender in ownership of assets, including motorbikes in all sites, mobile phones in Hombolo, treadle water pumps in Lower and Upper Nyando and Hoima, motorized water pumps in Lower and Upper Nyando, and solar panels in Hombolo and Singida. The differences in land ownership between men and women were relatively small, except for rented and gifted land in Singida. In Singida, 94% of men reported renting land and 22% reported receiving land as a gift, while only 3% of women reported renting land and 6% reported receiving land as a gift.

4.2. Farmers’ Access to Information Sources

The sources of information available to farmers also varied significantly by gender. While women and men alike often accessed information about agriculture and climate change from sources such as radio, farmer field days, agricultural shows, and seed events, access to newspaper and TV was strongly gendered. Among men in Lower and Upper Nyando, Hombolo, Singida, and Hoima 6%, 34%, 10%, 21%, and 33%, respectively, cited television as a source of information. In contrast, only 4%, 9%, 8%, and 16% of women in Lower and Upper Nyando, Singida, and Hoima, respectively, cited television as a source, with no women in Hombolo citing television. Responses for newspaper access mirrored these findings.
The responses obtained for sources of information were in part a function of farm assets. In absolute terms, more men respondents reported owning televisions than women respondents in Lower Nyando (24% vs. 18%), Upper Nyando (10% vs. 3%), Singida (19% vs. 17%), and Hoima (18% vs. 9%).
Farmers often reported seeking seed-related information from expert sources, and there were gendered differences in access to experts by site (Table 2). In Lower Nyando, Hombolo, and Singida, men were more than twice as likely as women to obtain seed information from an expert. This difference was especially pronounced in Hombolo, where nearly a third of men in the sample reported consulting experts for seed information, compared to only 3% of women. Hoima did not appear to have a difference in expert connections across women and men, and in Upper Nyando, women had slightly higher rates (compared to men) of connecting with experts for seed information. This latter finding can be attributed to the fact that many women in the Kenyan sample (Lower and Upper Nyando) connect to experts through producer organizations and women’s groups.

4.3. Climate Change and Adaptation Strategies

At every site, a majority of farmers perceived that the growing seasons and rainfall patterns were changing (Appendix A). In all the three countries, the growing season (number of rainy days) had reportedly reduced over the last three years. At the Nyando and Hoima sites, farmers often reported that the yearly temperature of their location has risen over time. Farmers in Lower Nyando, Upper Nyando, Hombolo, and Singida additionally noted that rainfall is becoming more unpredictable and that rainfall amounts are also unpredictable. Farmers also reported that in recent years, incidences of drought have increased in the Lower/Upper Nyando, Hombolo, and Singida sites, making it increasingly difficult to rely on maize as a staple crop.
Focus group discussions revealed that farmers across sites frequently respond to climate change with low-cost and low-input strategies, including replanting, preparing land earlier, planting earlier, and using drought-tolerant varieties. In areas most affected by drought, such as Lower/Upper Nyando, Hombolo, and Singida, farmers reported switching to drought-tolerant crops, including millet, sorghum, and cassava. Nyando and Hoima farmers reported responding to perceptions of shifting viable altitude ranges by varying the elevation at which they plant different crops. In addition, farmers reported seeking off-farm income sources, in part to make up for declining on-farm crop production. In response to new pests and diseases in crops, farmers who could afford the treatment reported using pesticides, or alternatively using local varieties or breeds that are more resistant to pests and diseases. In response to the perception of new weed species, farmers reported introducing crop rotation and increasing the frequency of weeding. Notably, in the Hombolo and Singida sites, most adaptation strategies reported were focused on adapting to rainfall variation; such strategies often included replanting crops (requiring more seed) and switching to more resilient crops (requiring access to new/different seed).
The gender and other demographic dimensions of climate change adaptation varied considerably by site (Table 3). In Lower Nyando and Hombolo, men are adapting to climate change by planting new/varied seed of the same crops at a greater rate than women. In Hoima, higher percentages of younger farmers also reported adapting to climate change by planting new/varied seeds as compared to older farmers; however, this trend is not mirrored in other sites. More educated farmers, on average, appear to have higher rates of using different crop varieties to adapt to climate change across all study sites.

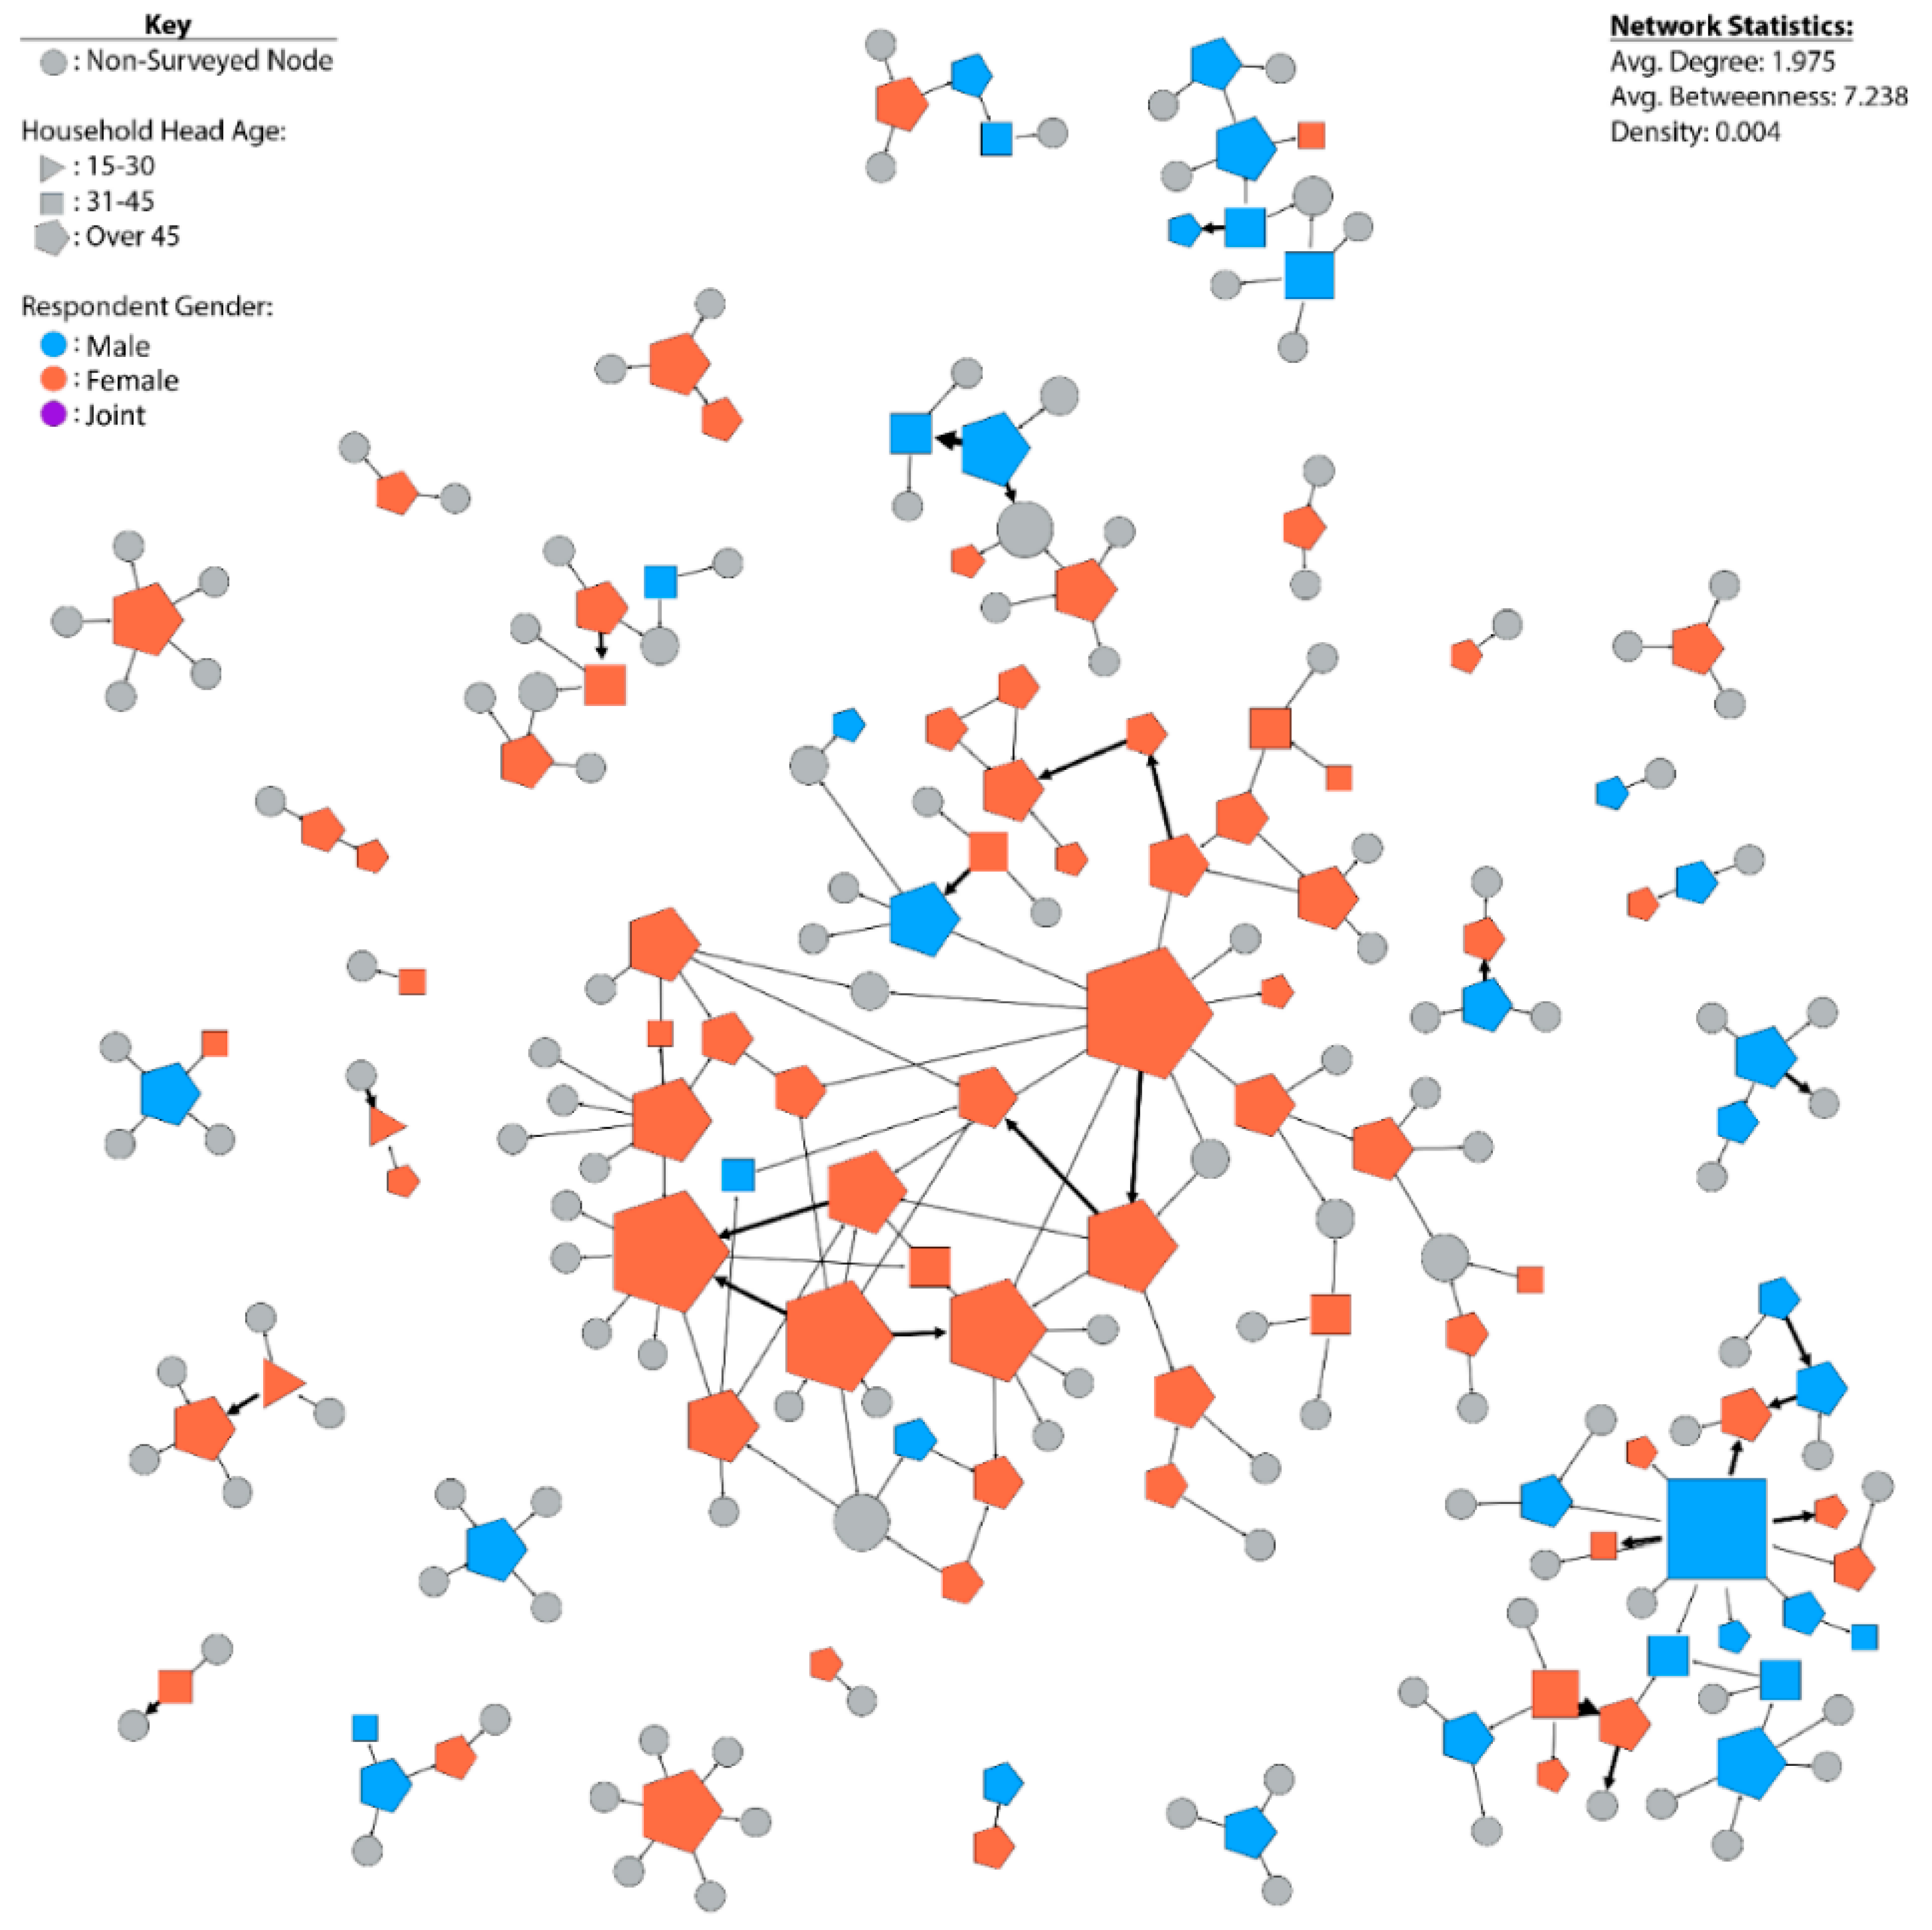
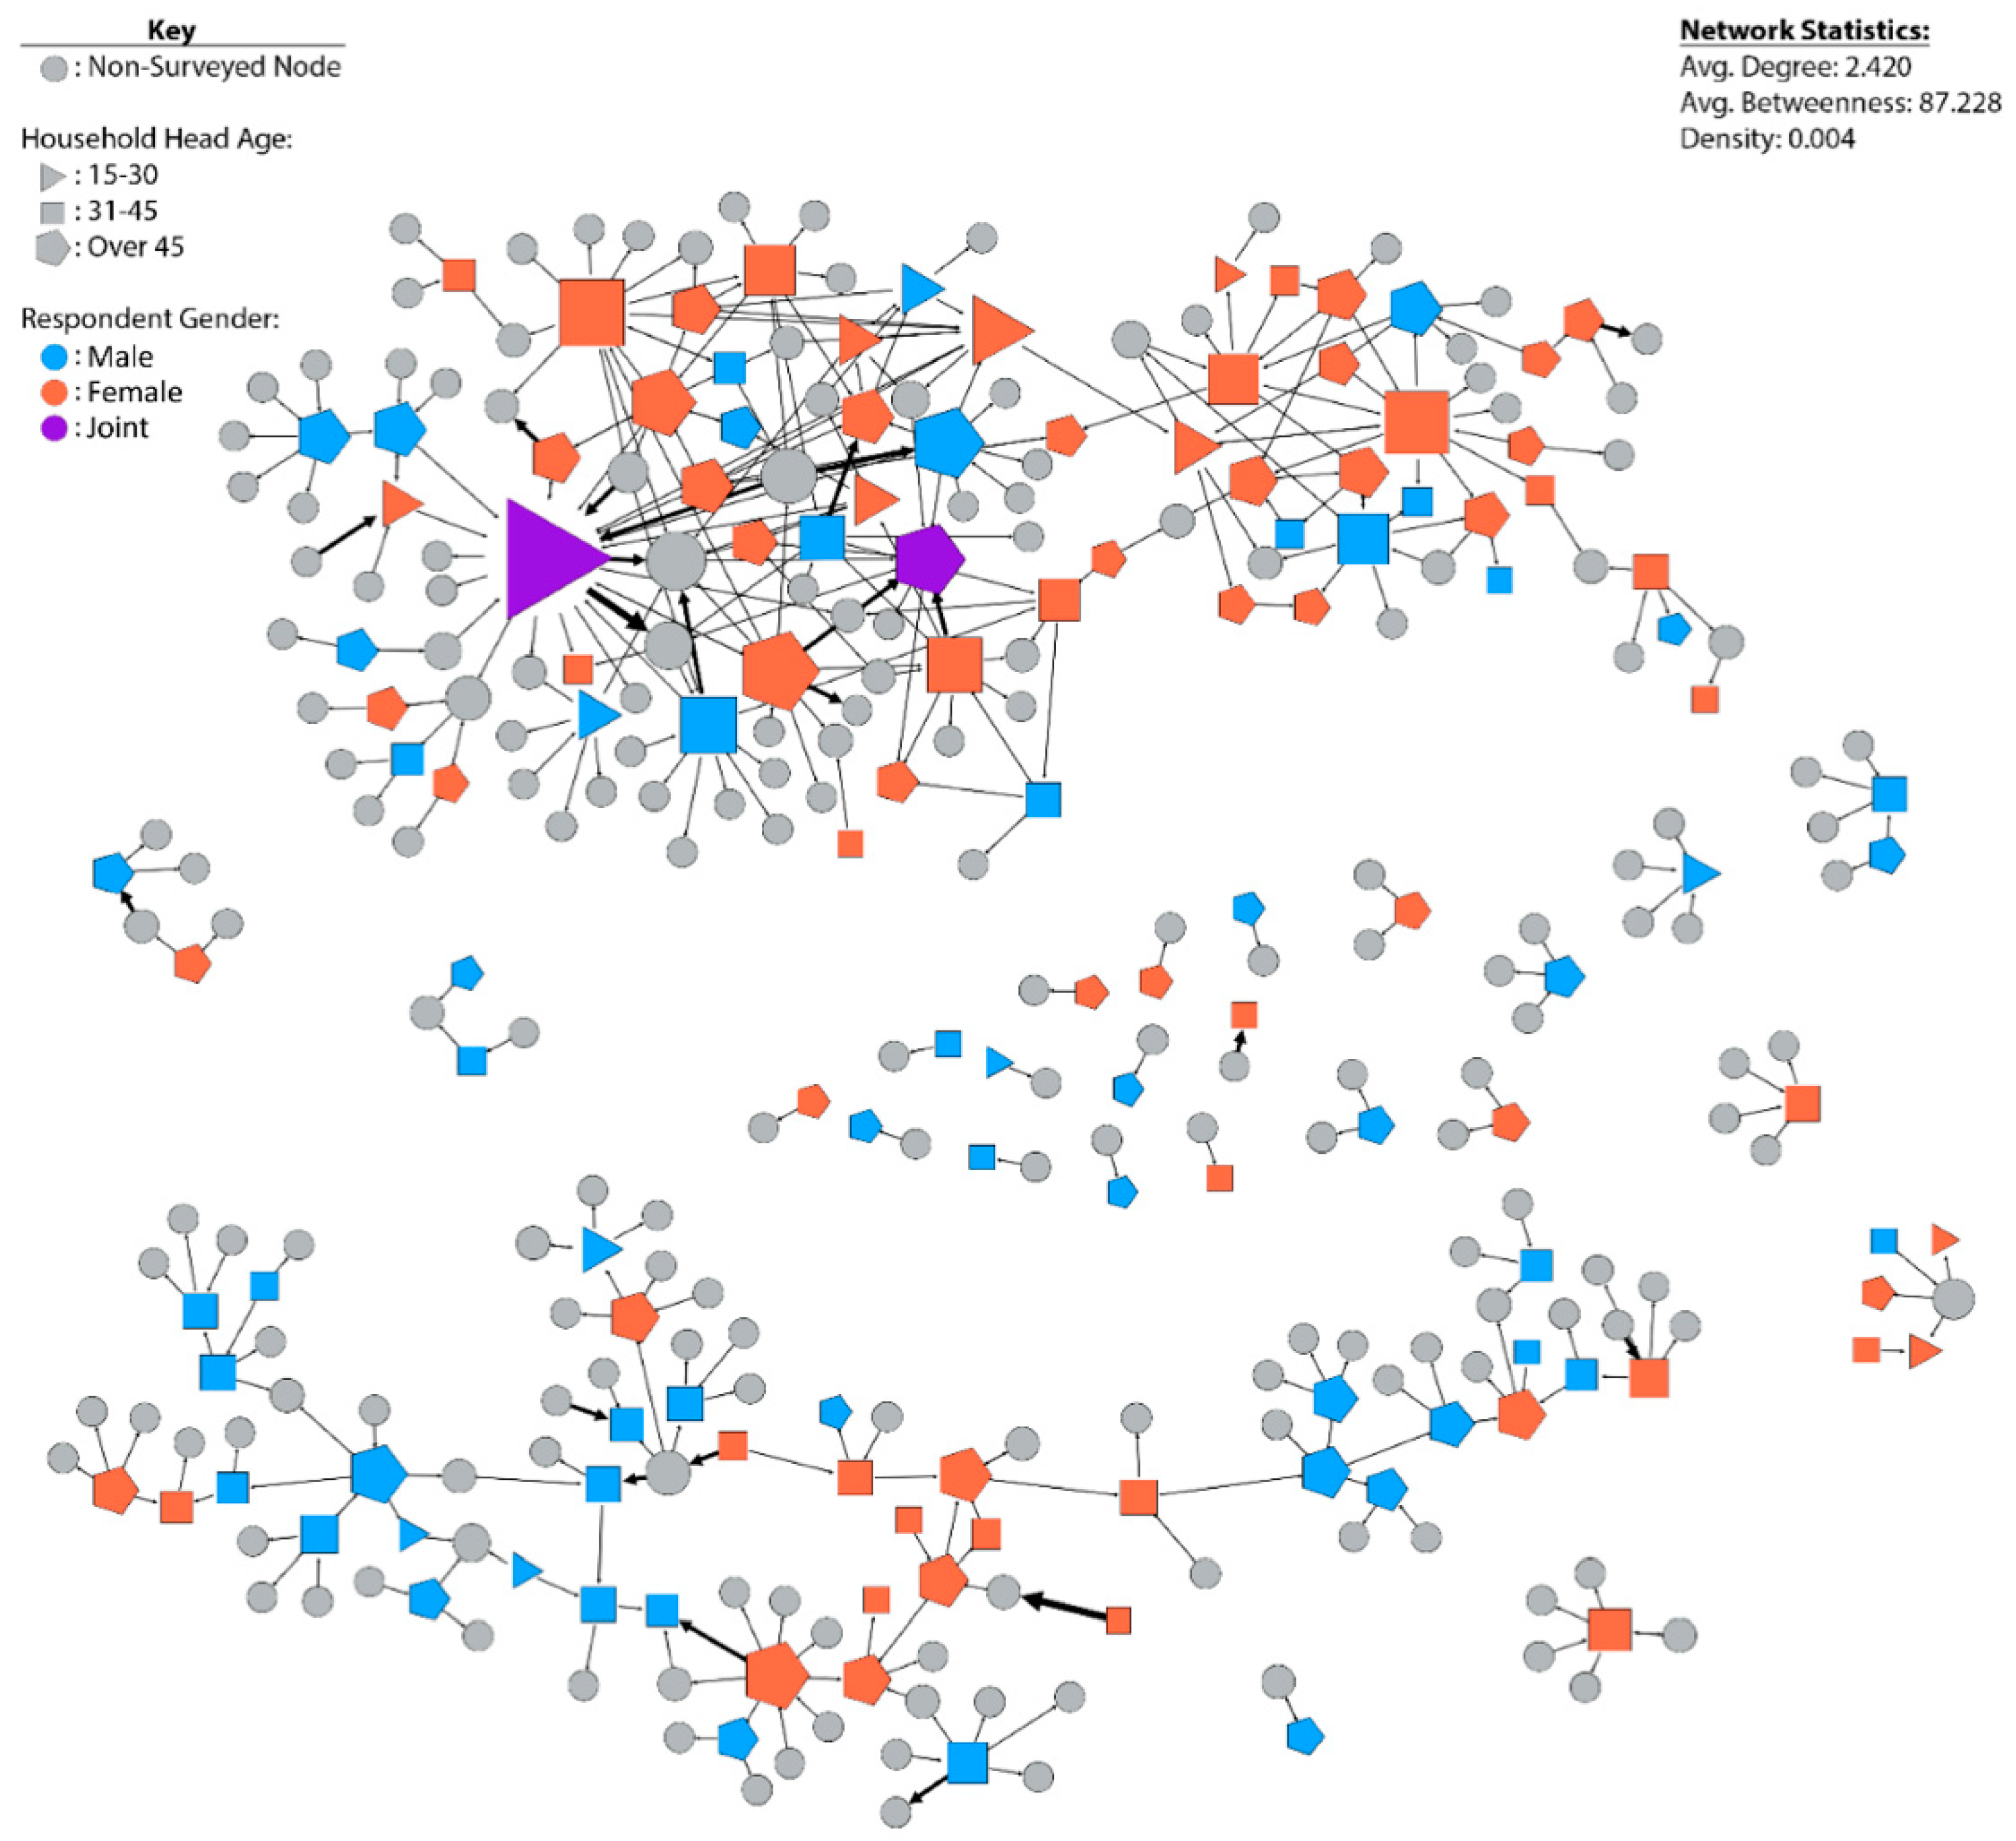
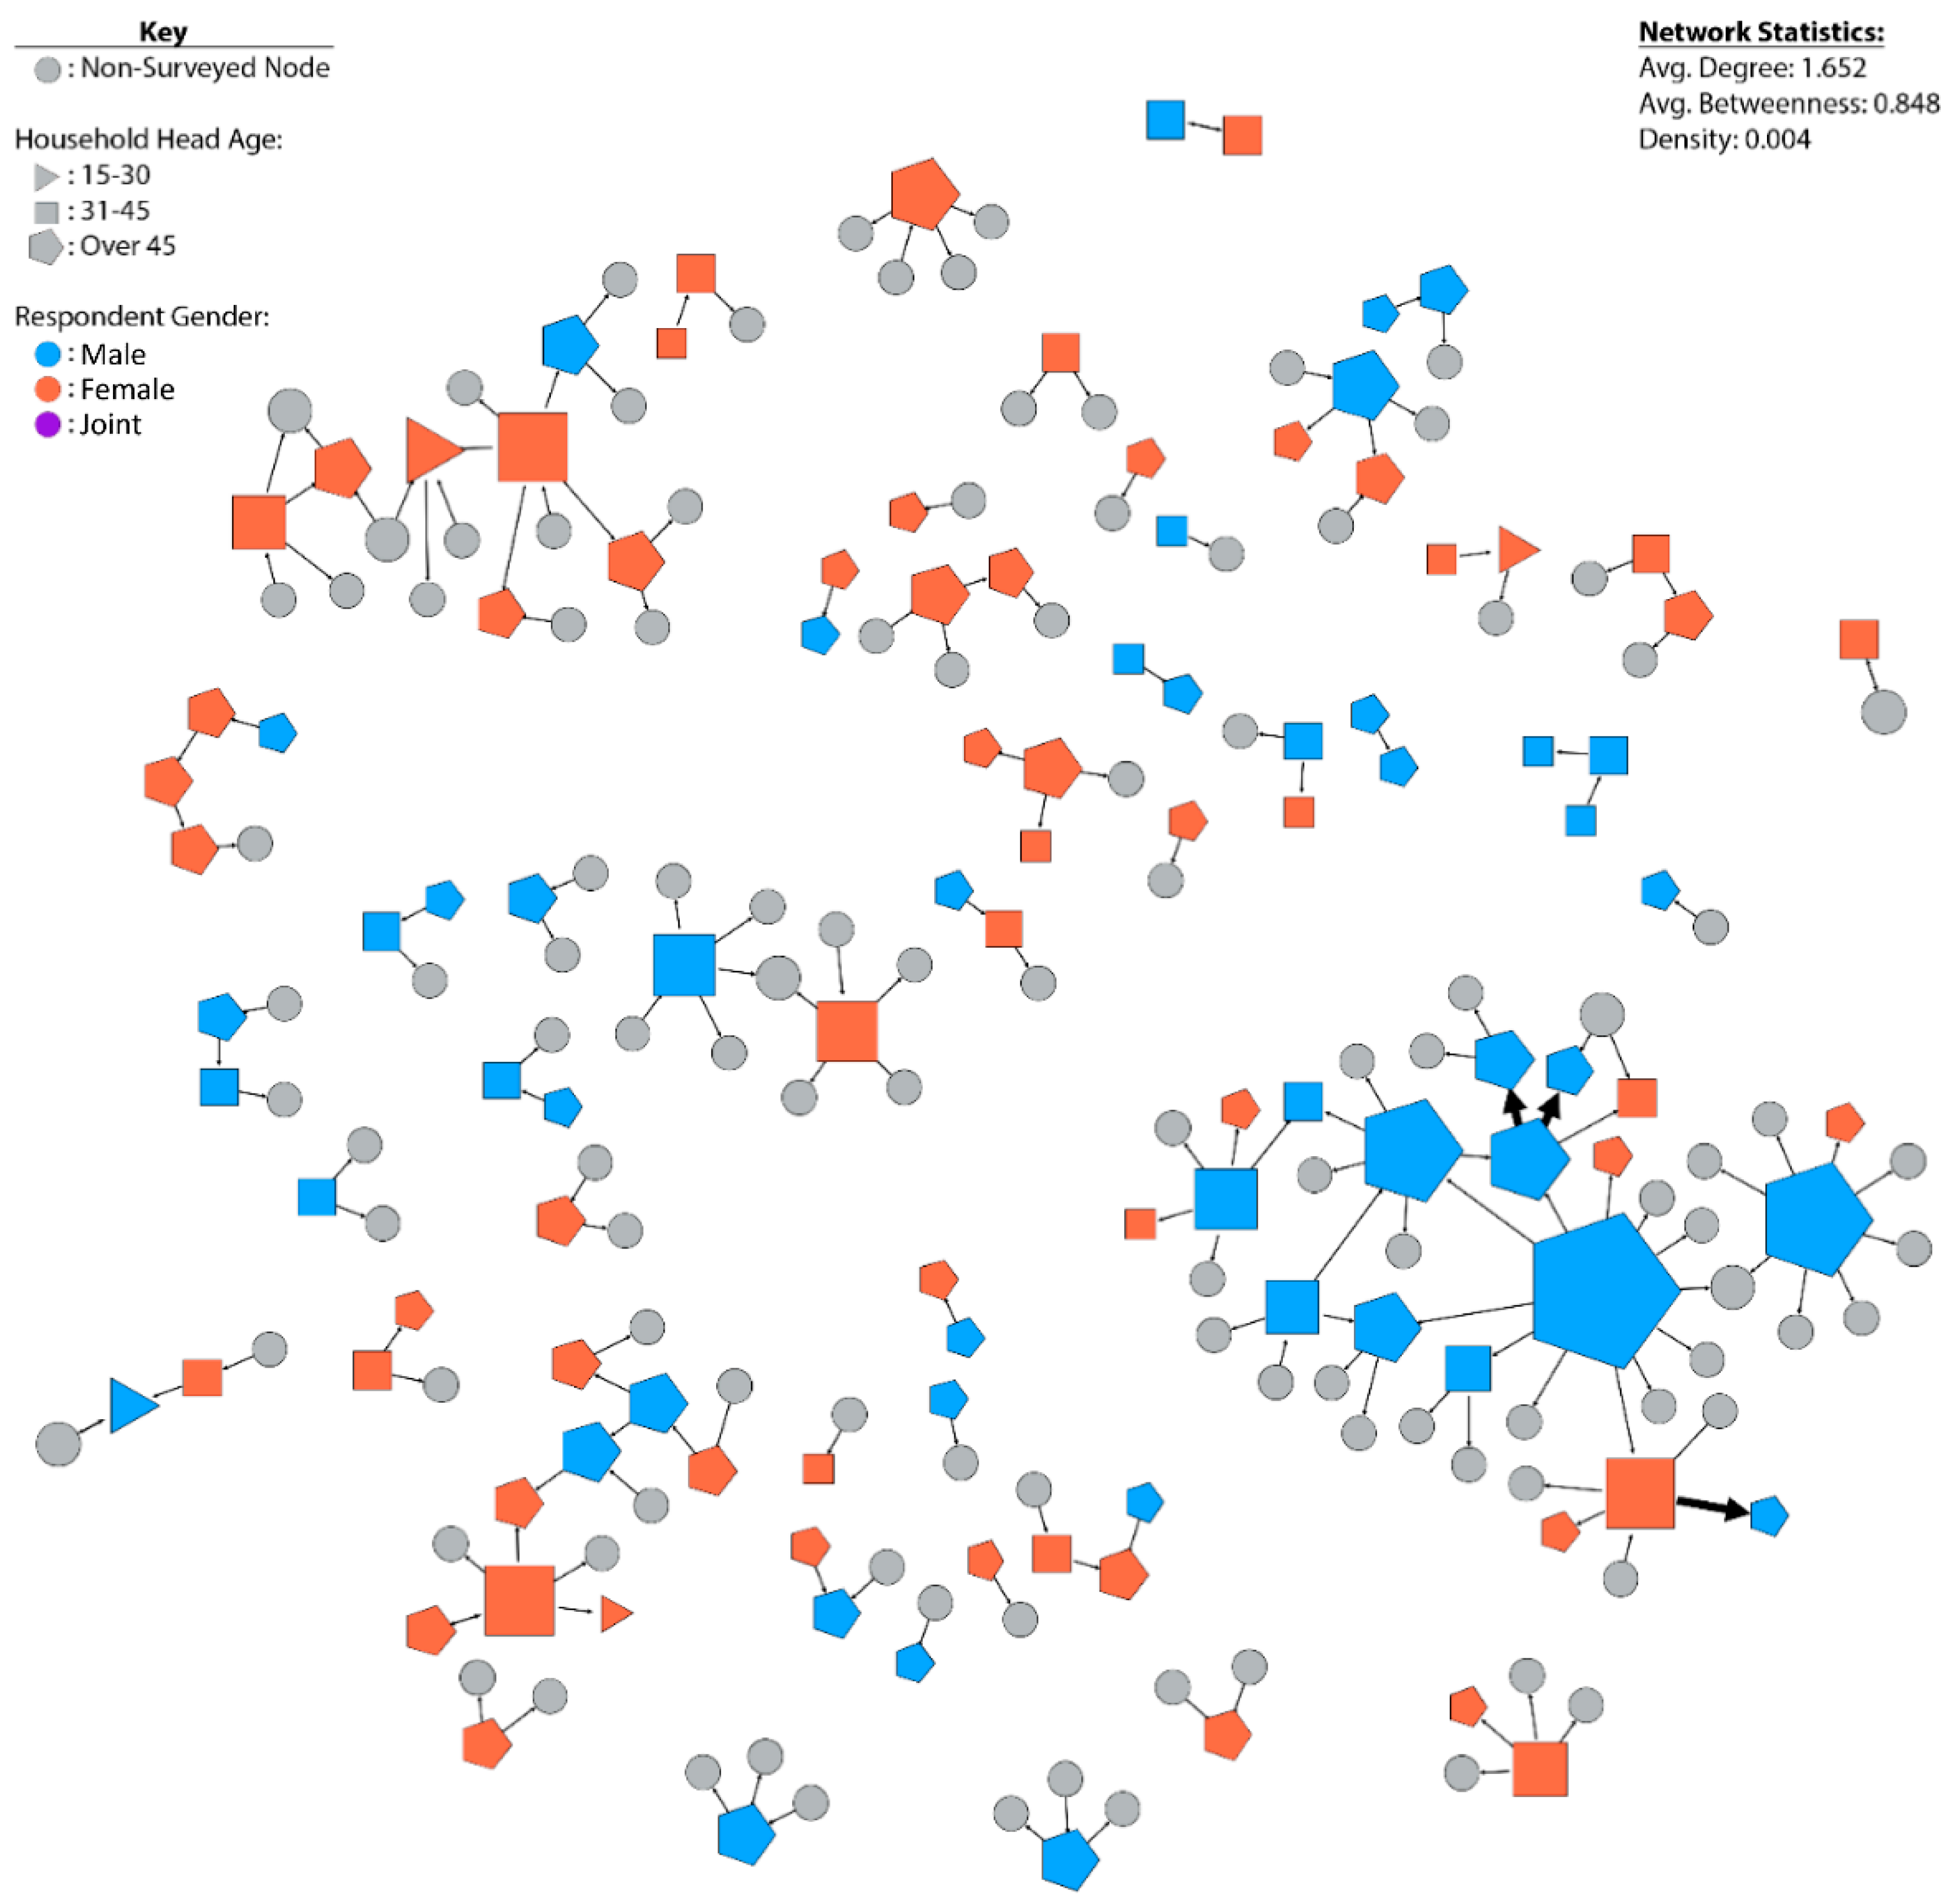
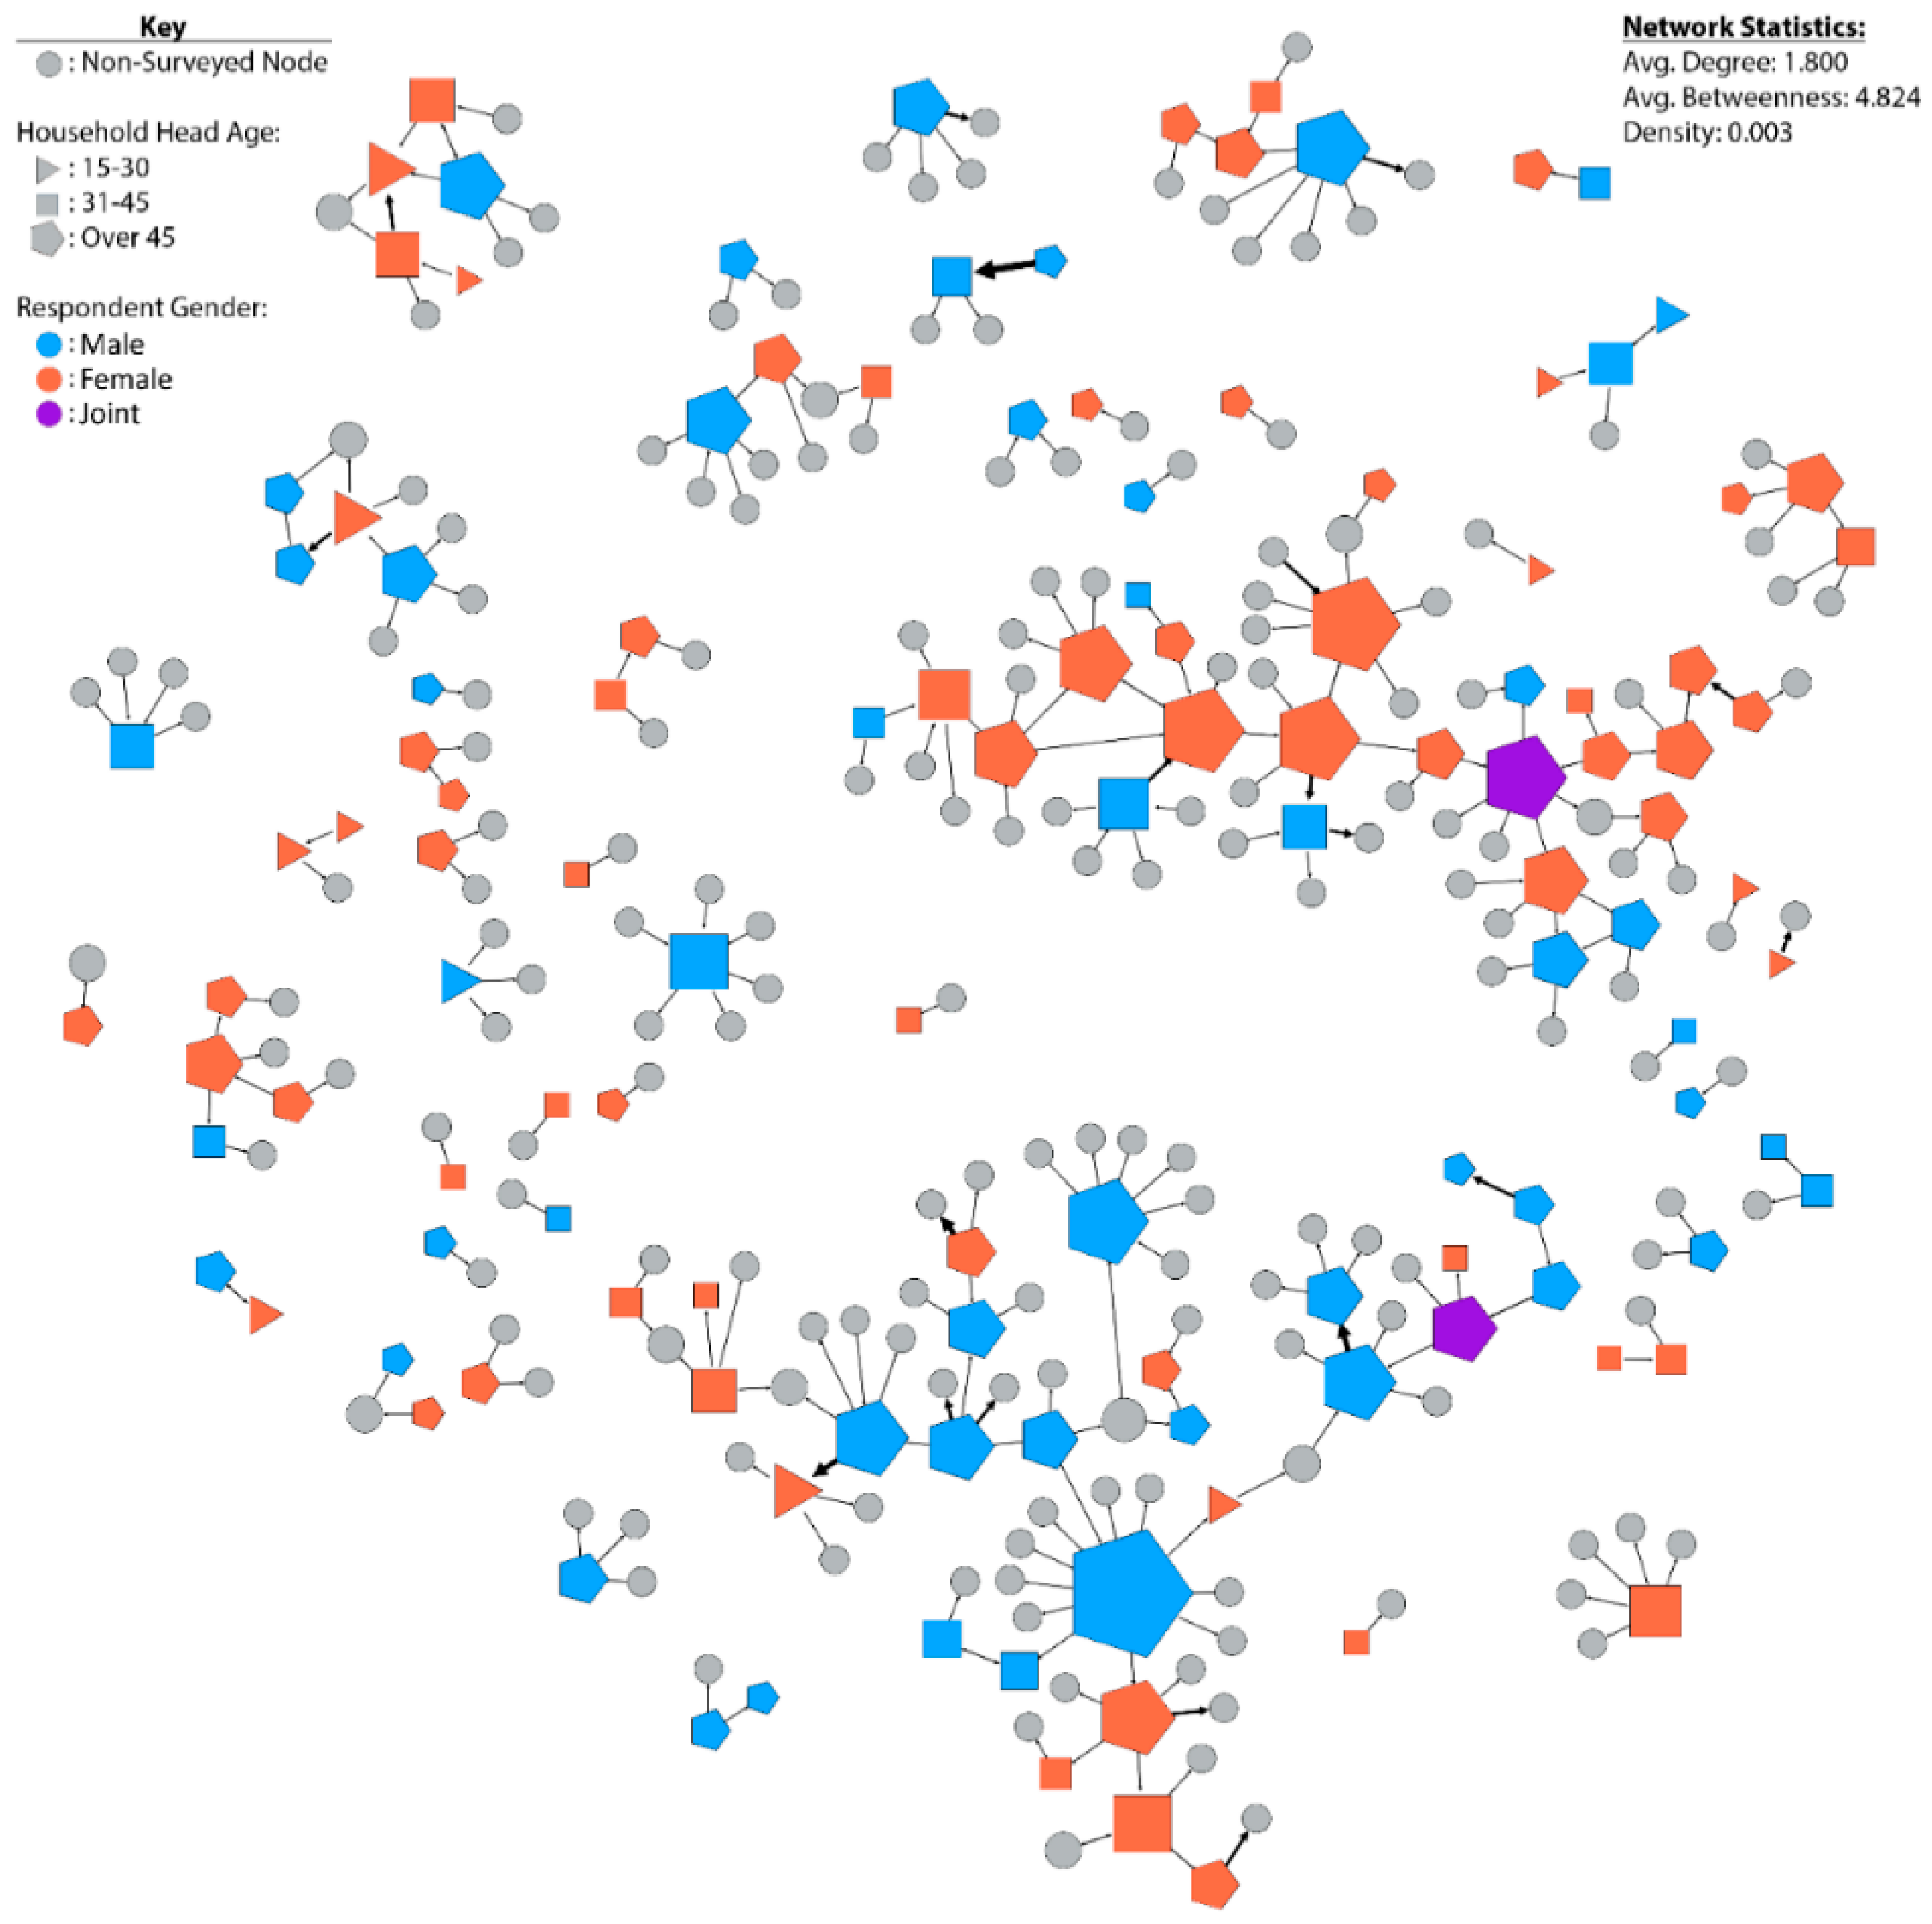
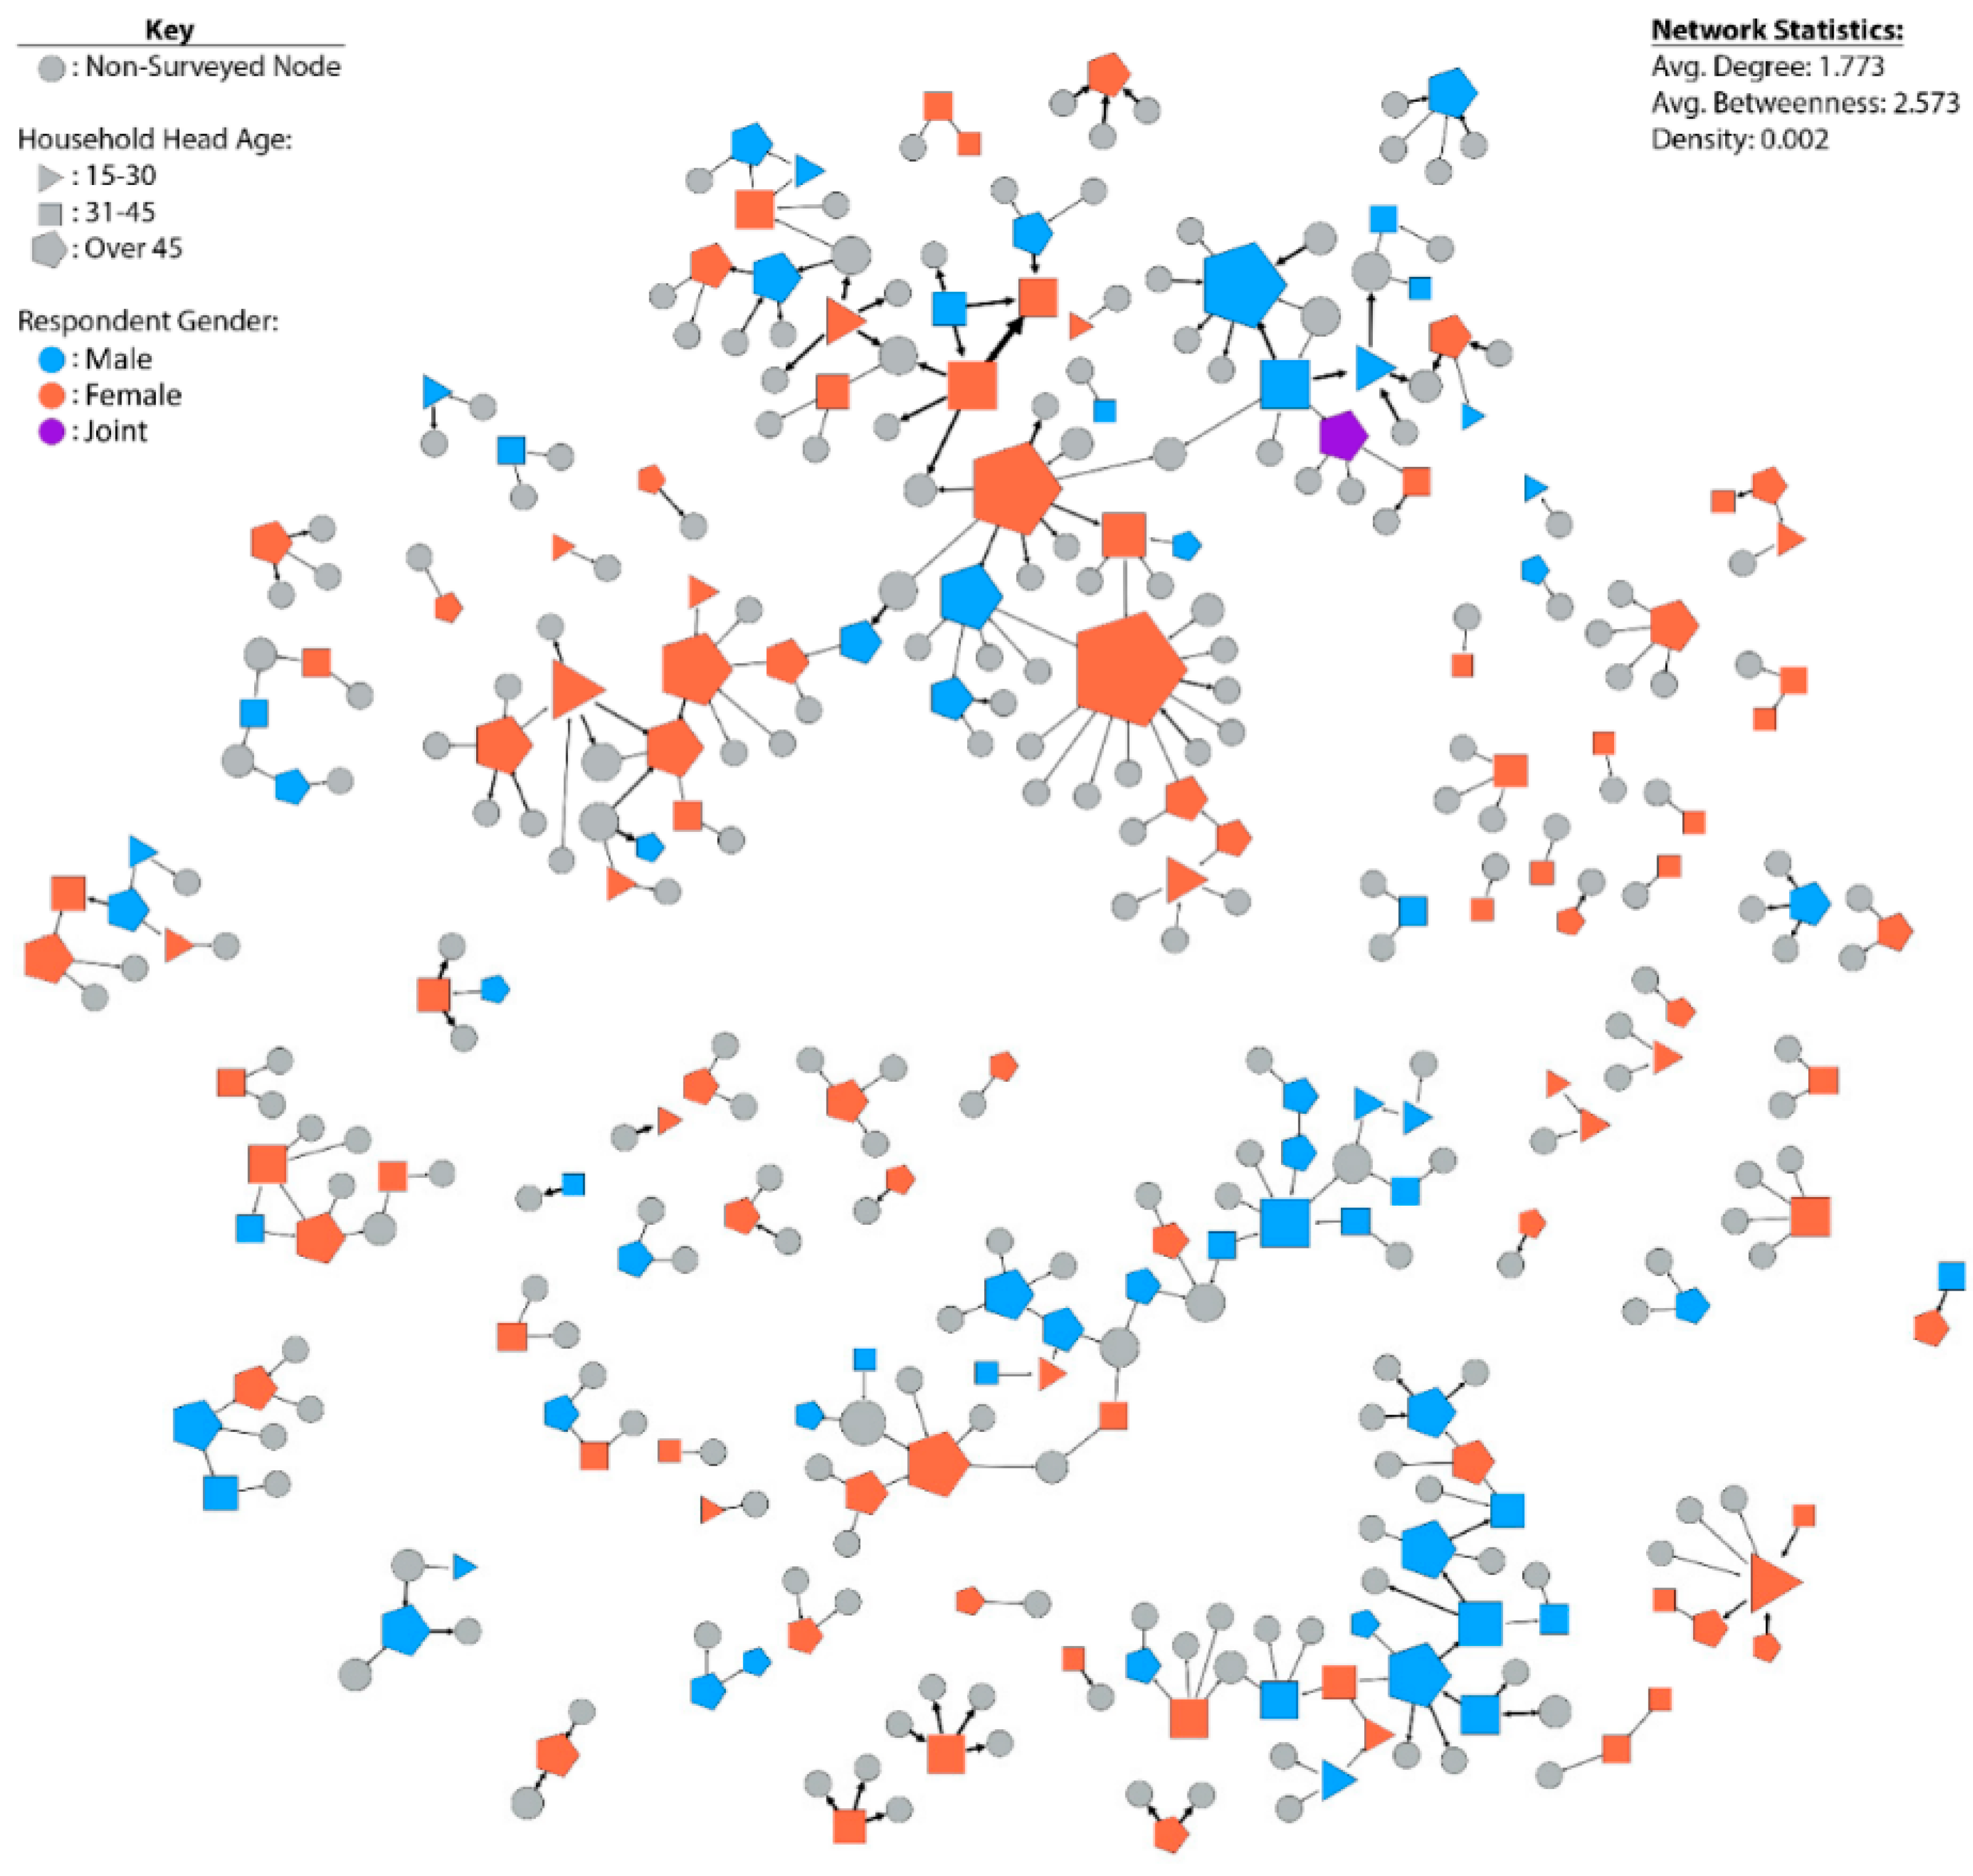
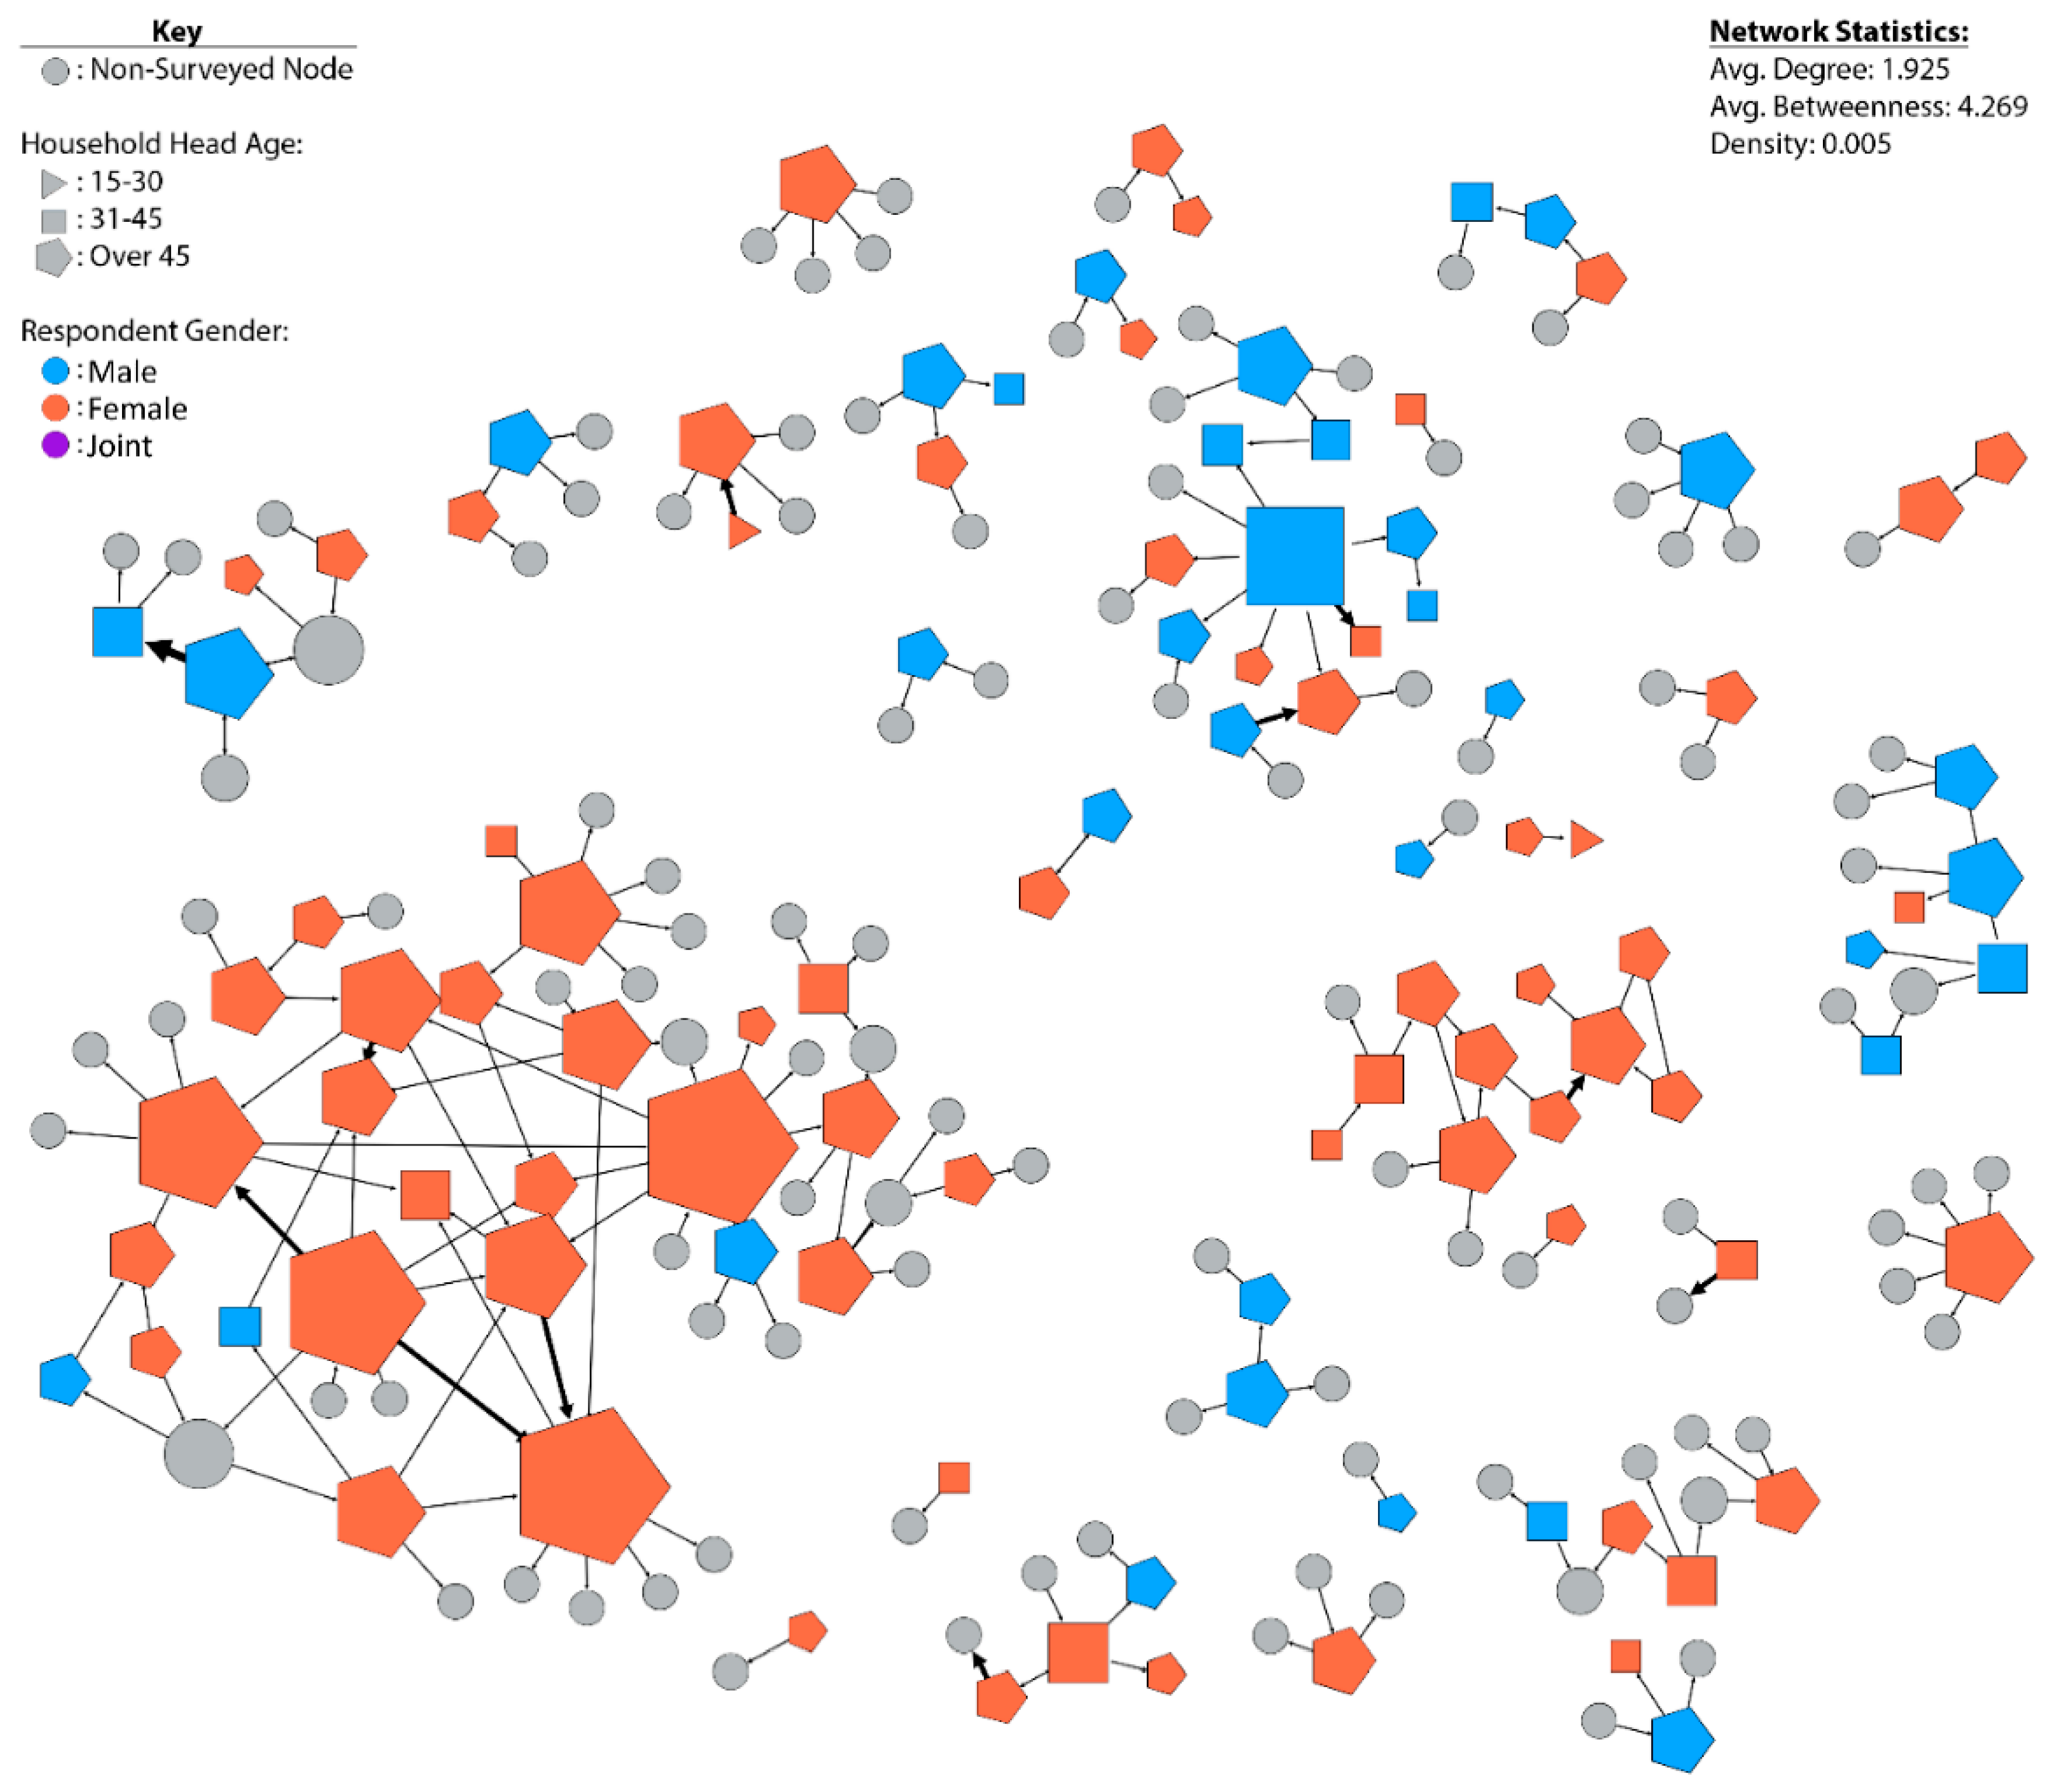
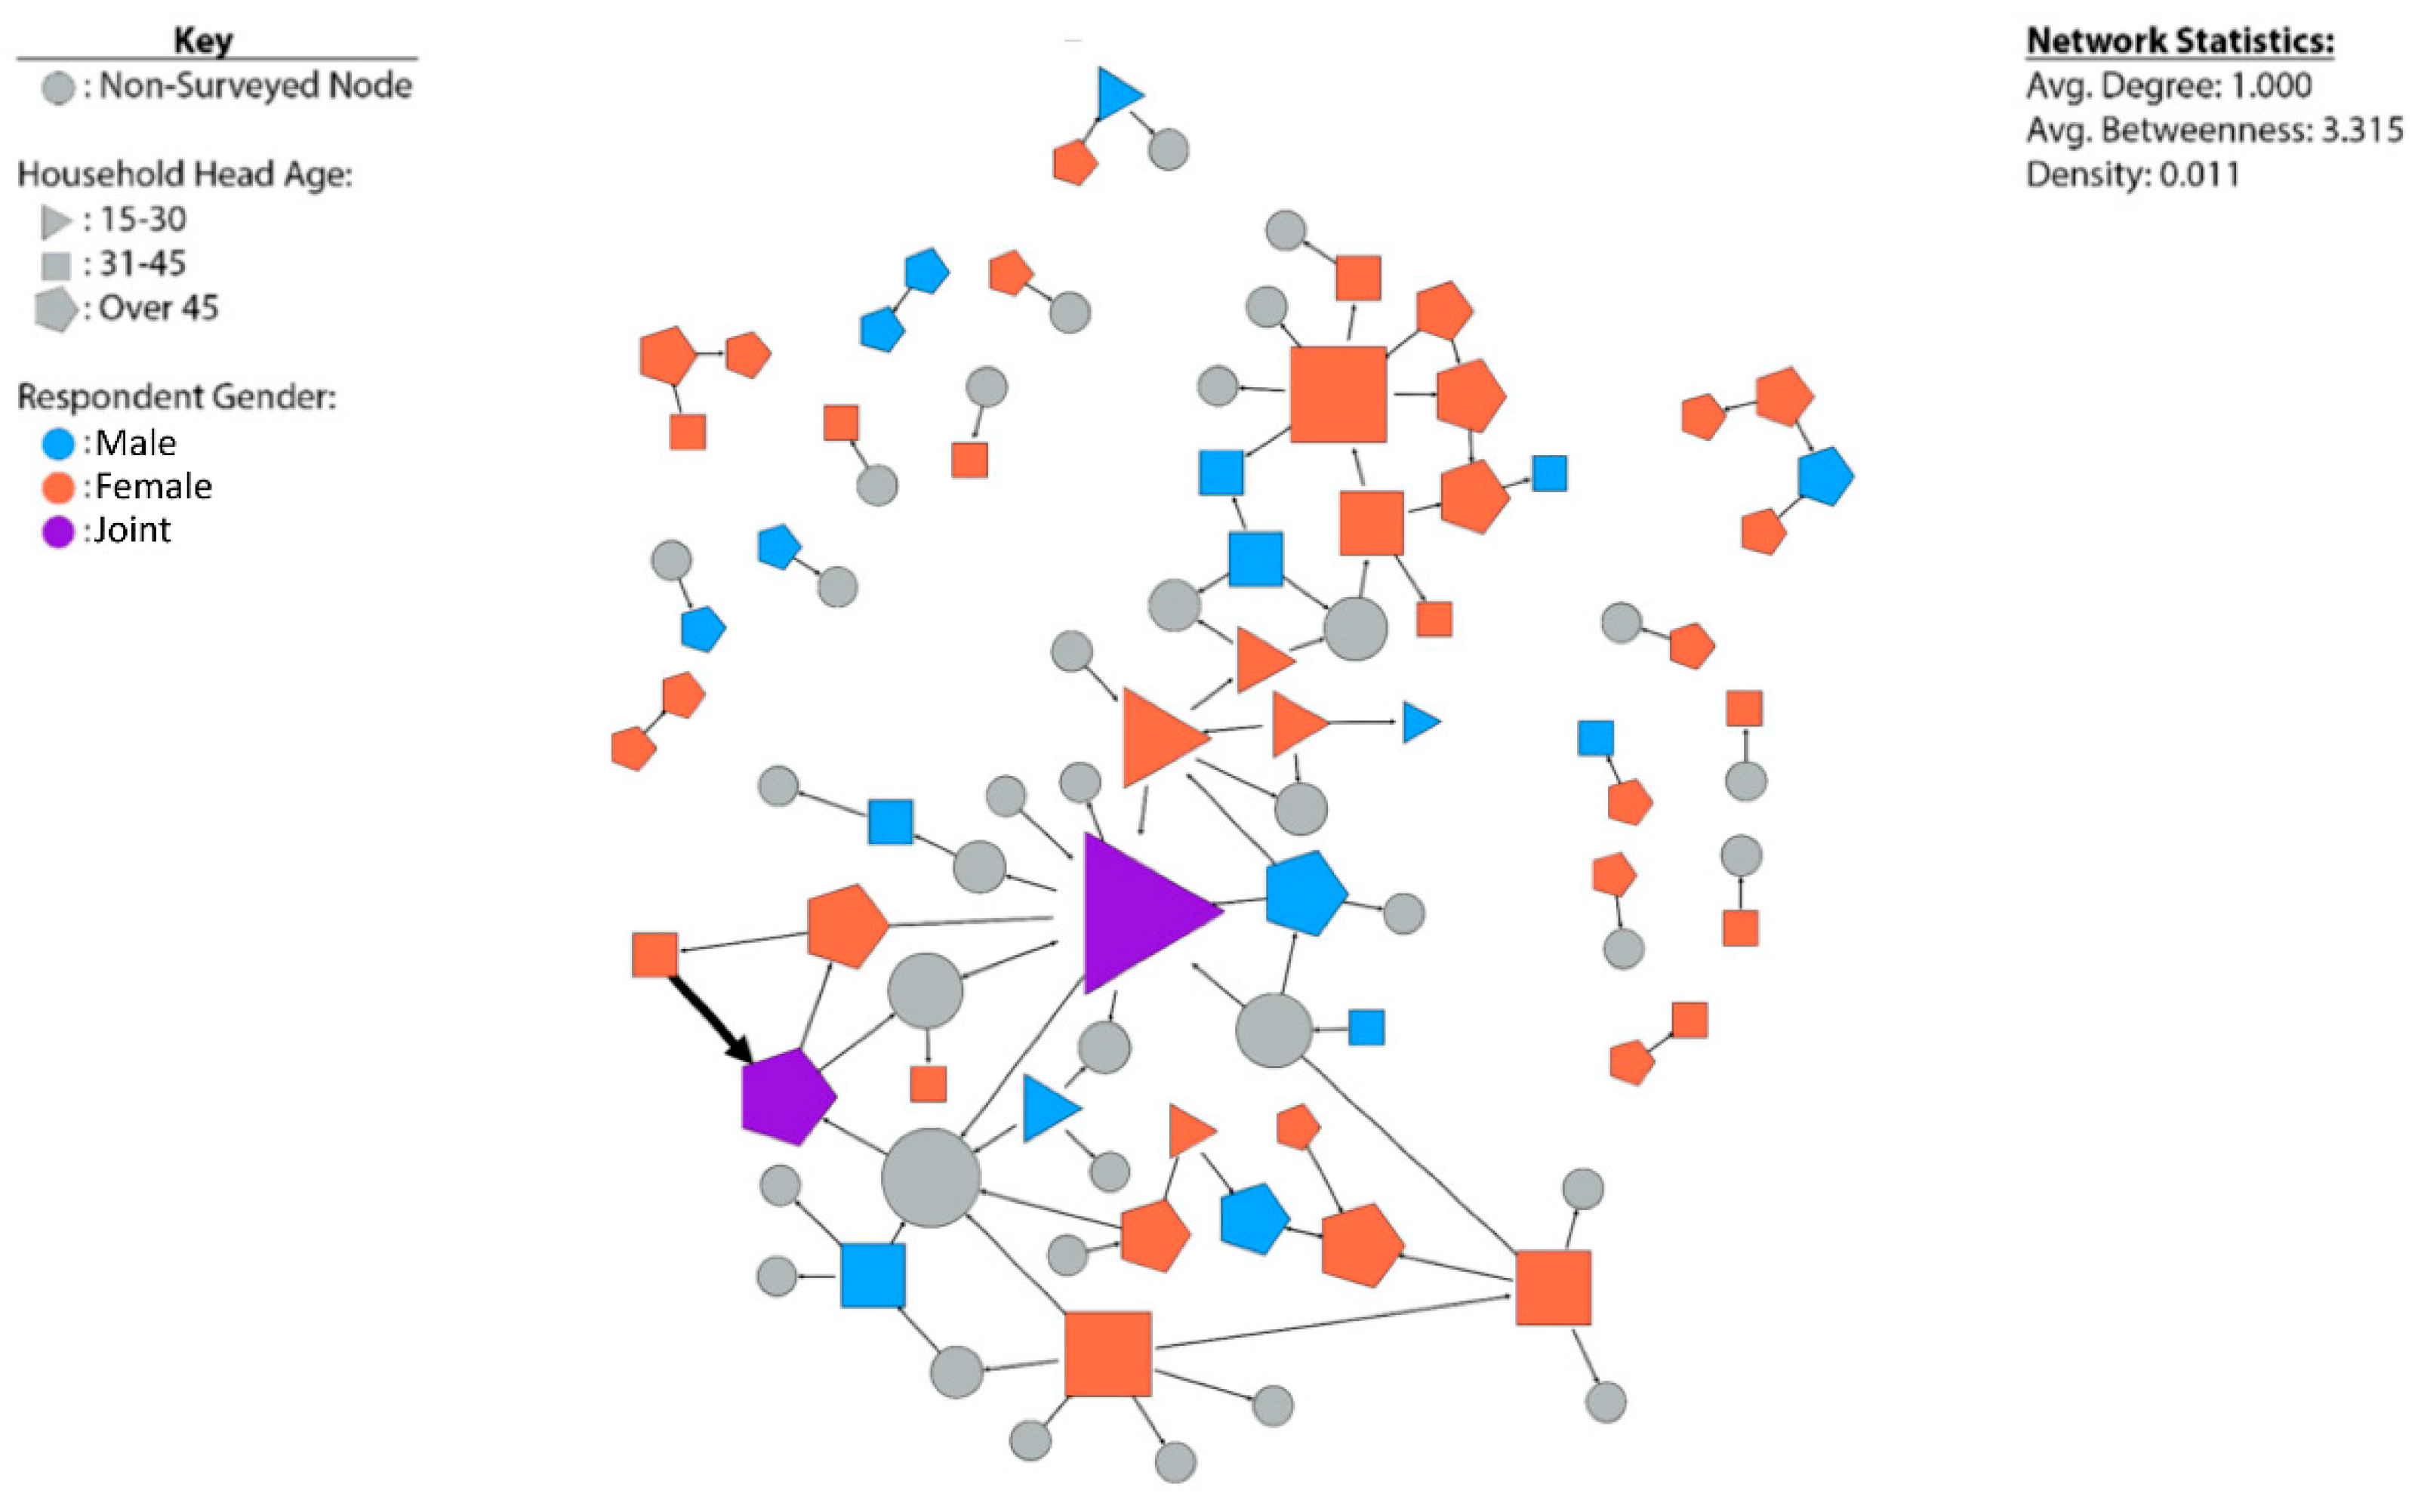
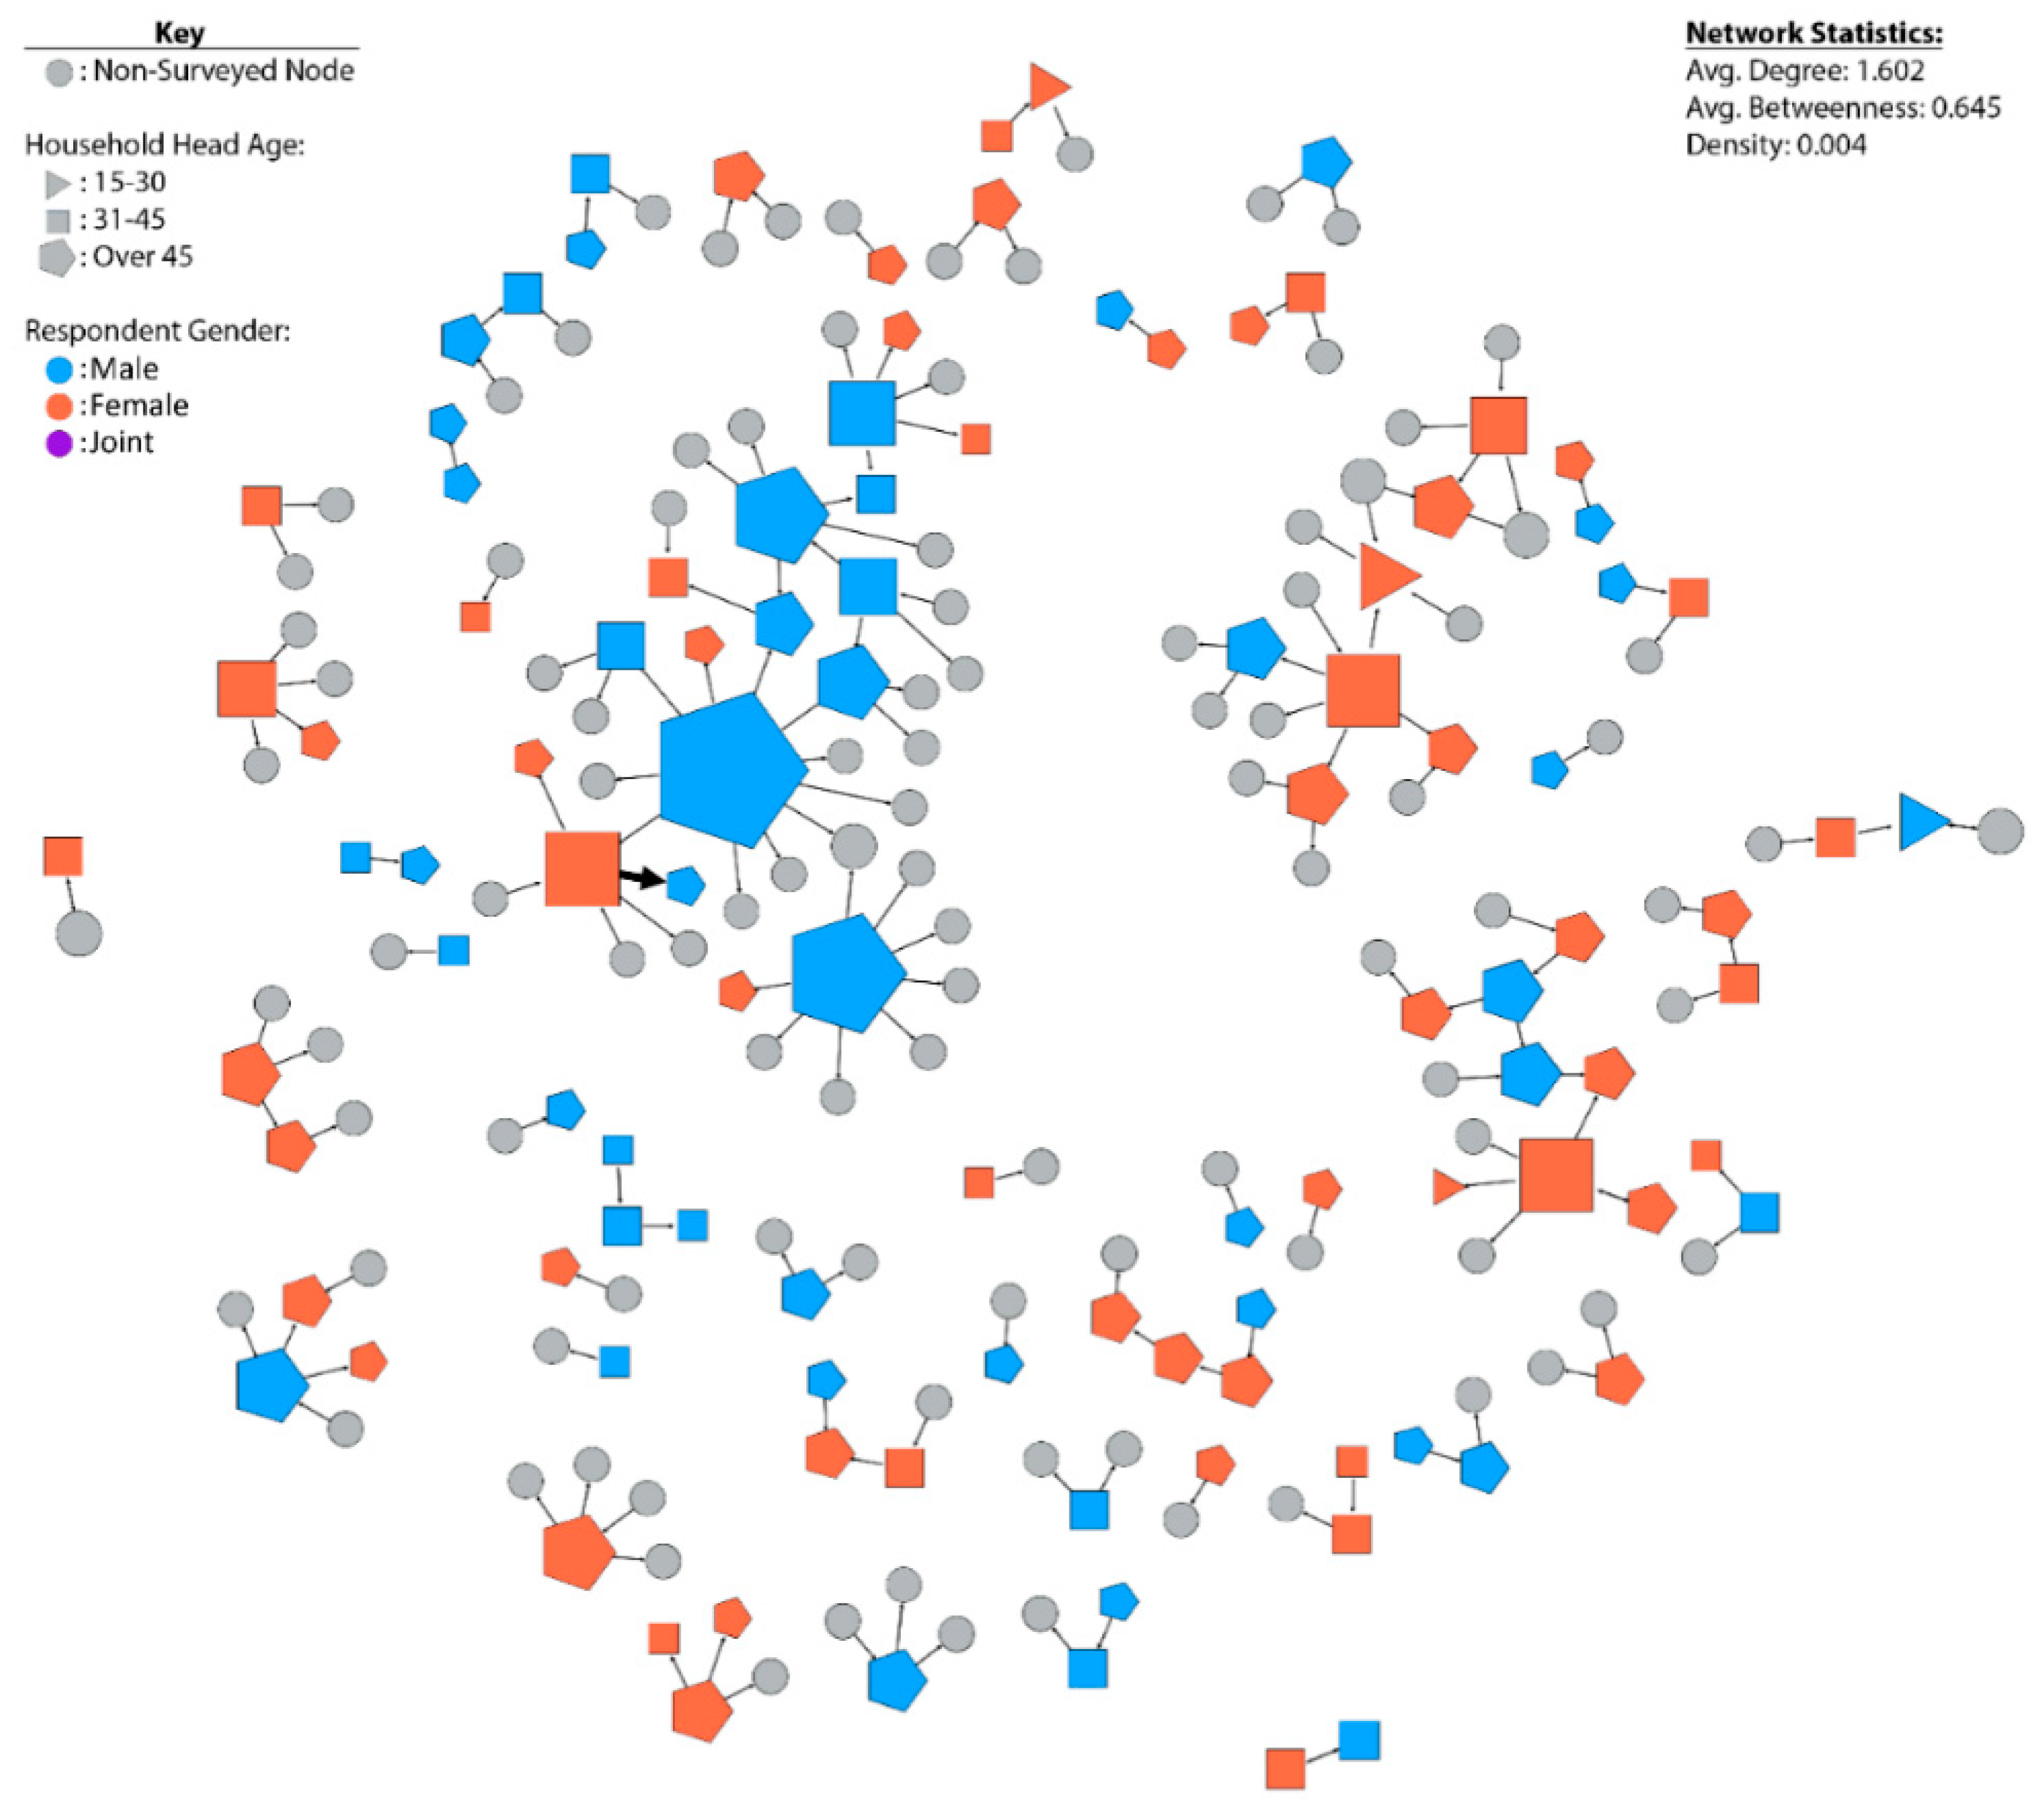
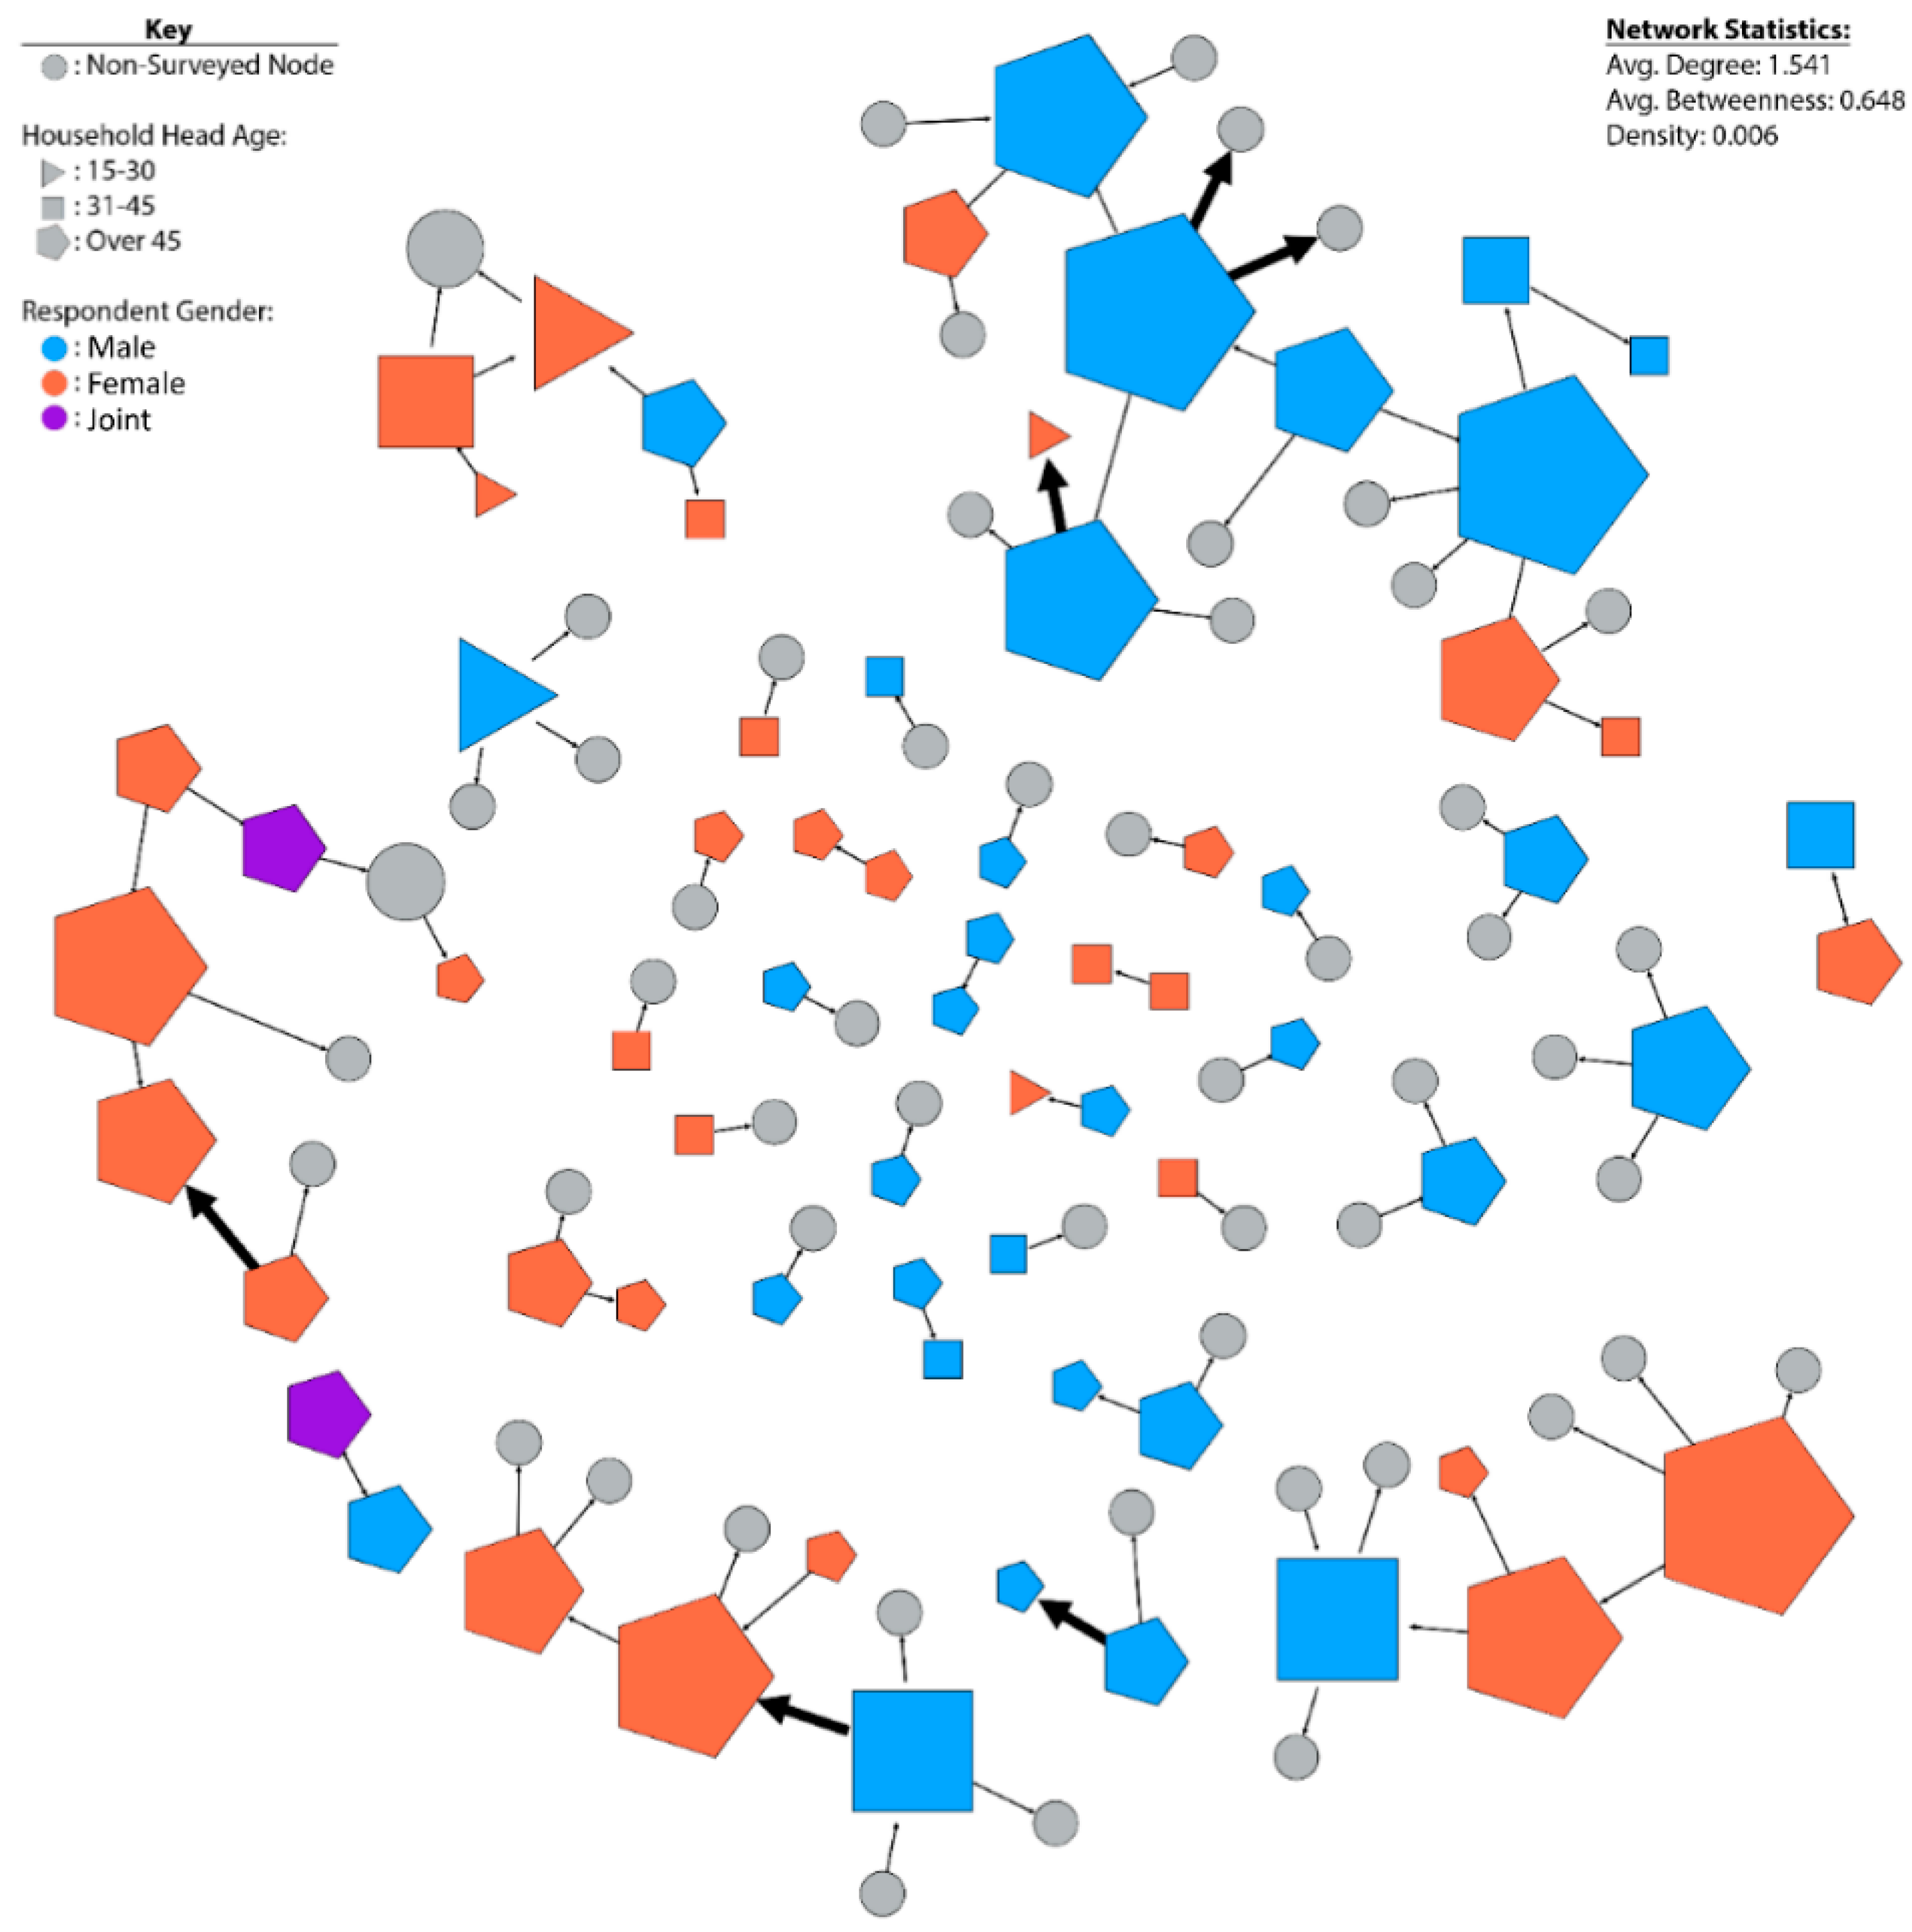
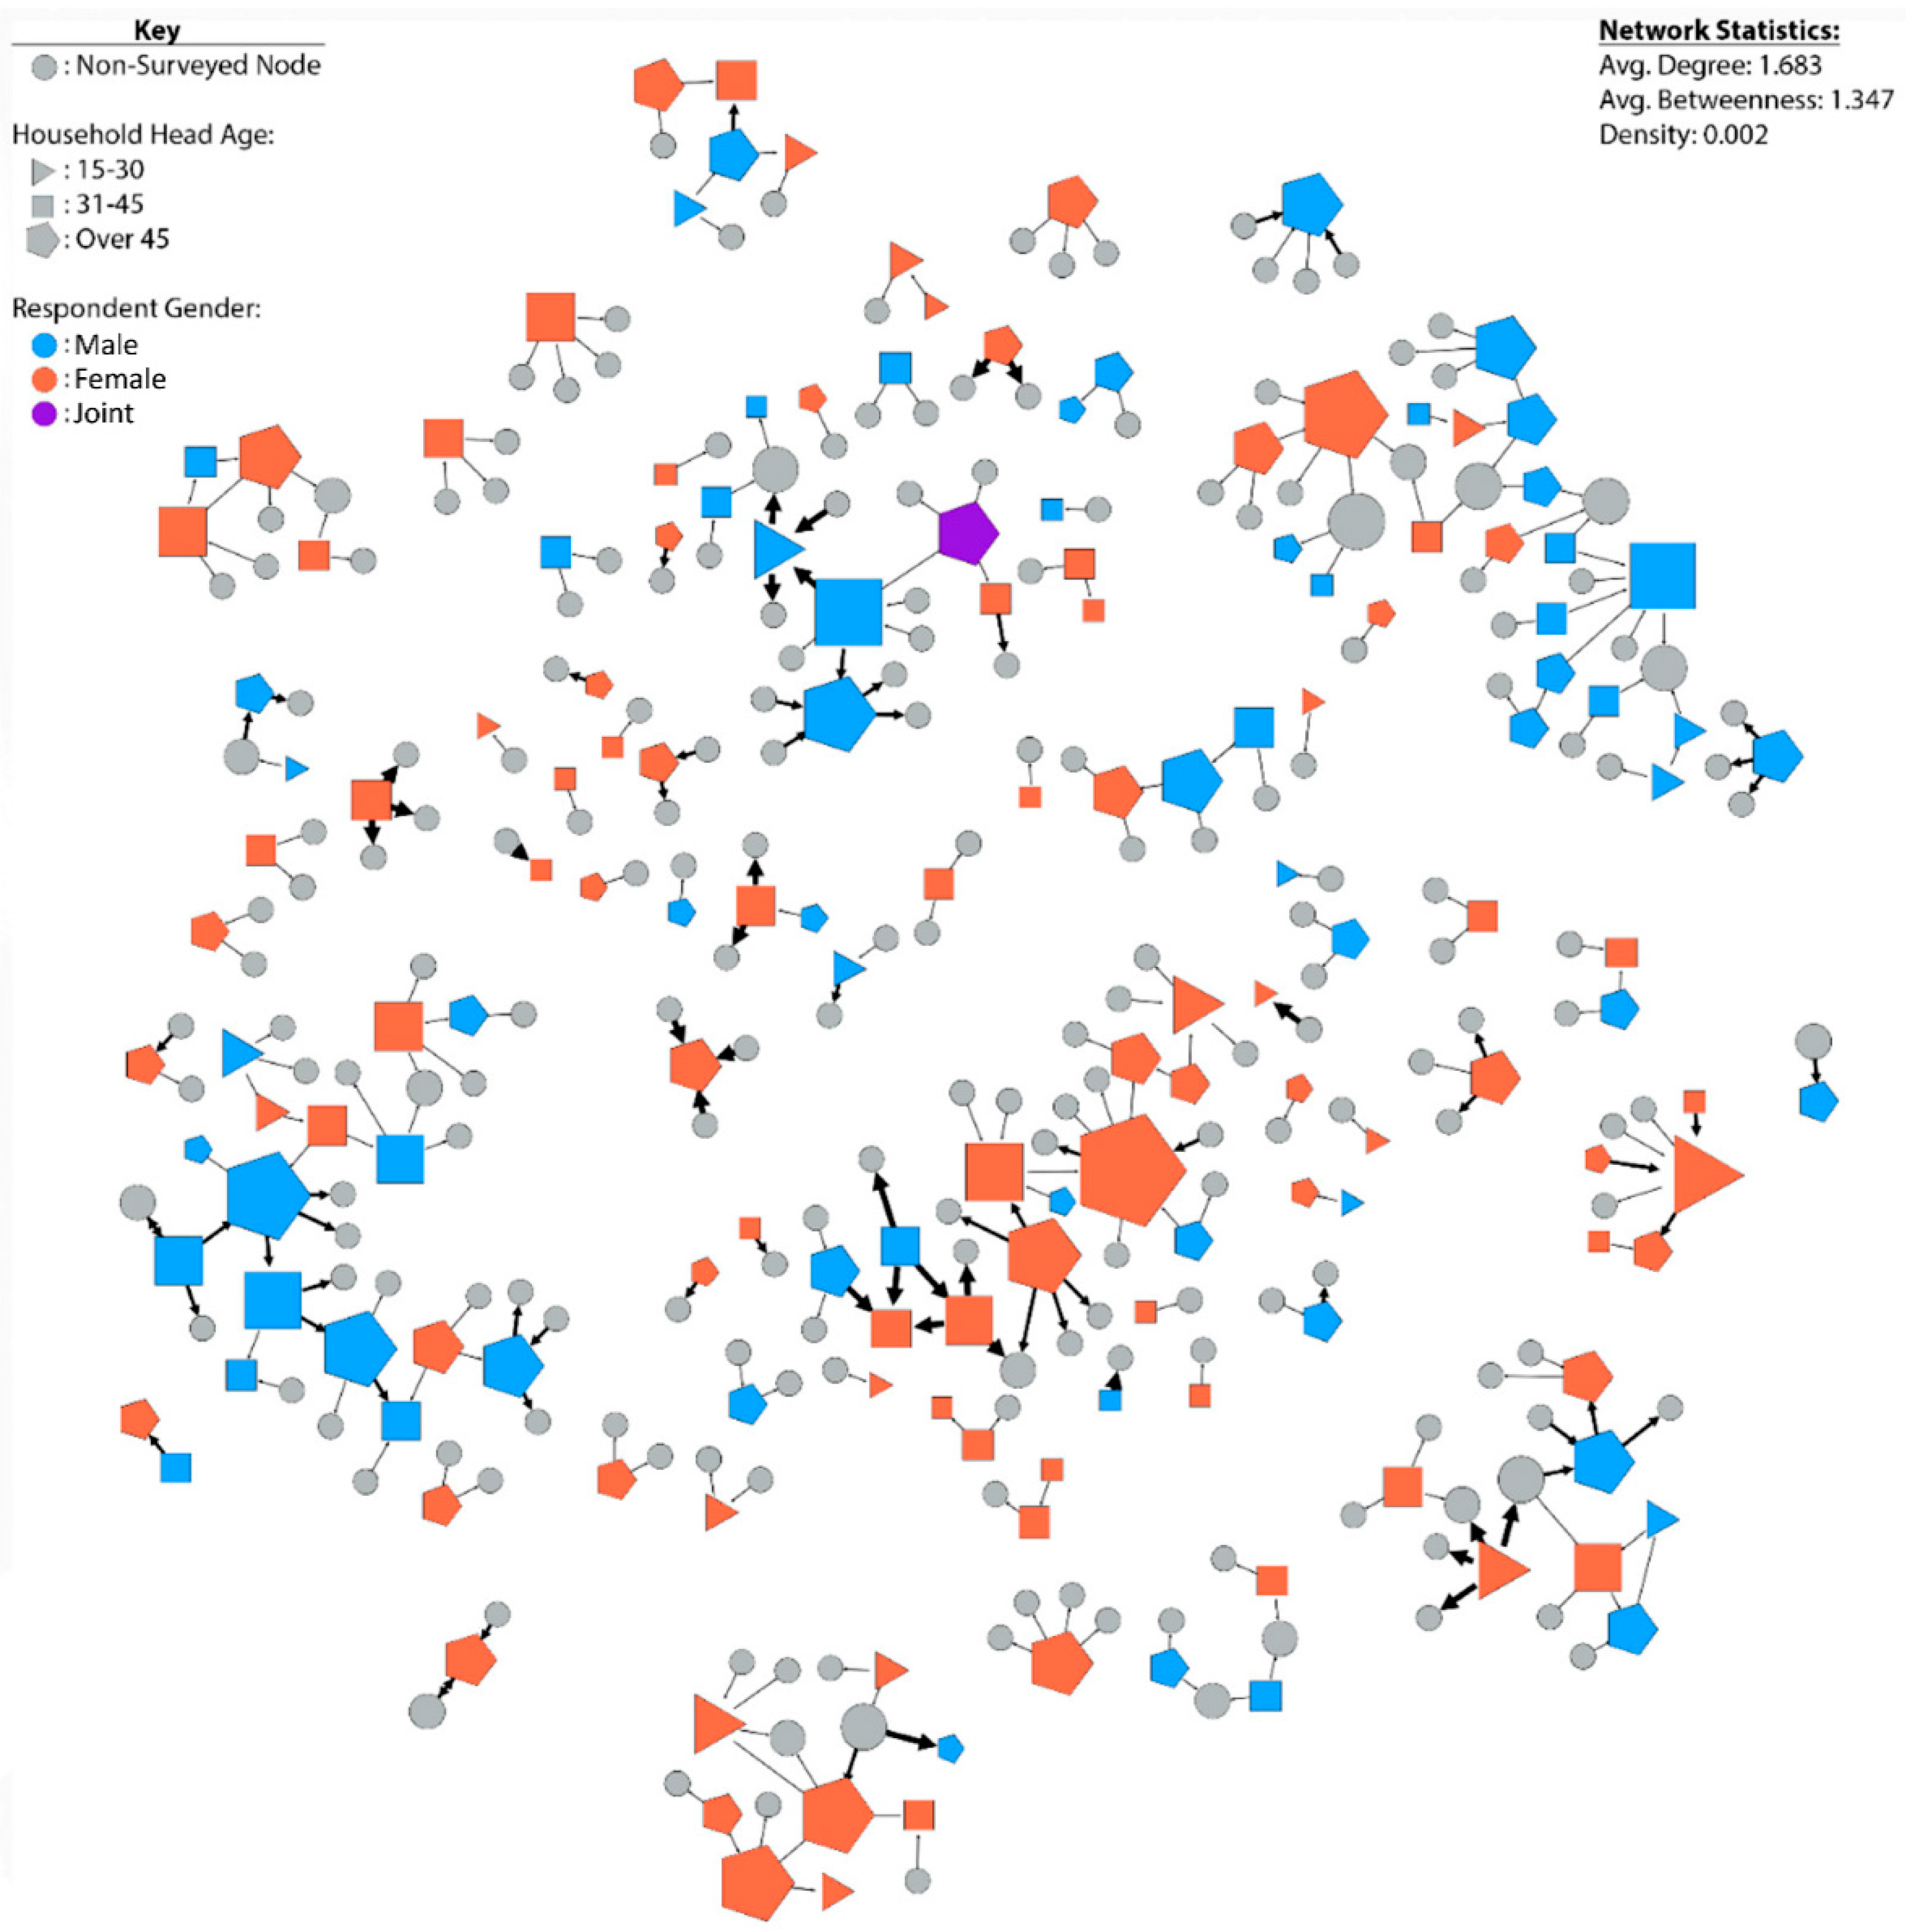
4.4. Social Seed Networks by Gender

This section summarizes findings from the social seed network analysis (Figure 2, Figure 3, Figure 4, Figure 5, Figure 6, Figure 7, Figure 8, Figure 9, Figure 10 and Figure 11), depicting the seed flows between farmers; all diagrams also show the age of the household head and the gender of the respondent. For each site, we present figures for the overall seed network (all seed exchanges at that site), as well as one crop-specific seed network (representing the network for the most widely used crop for climate change adaptation at that site). In some cases, we also looked at variety-specific networks (in cases where multiple varieties of a crop were grown, but one variety was most commonly used for climate change adaptation). The crop- and variety-specific networks are a subset of the overall network by site. Within the network diagrams presented (Figure 2, Figure 3, Figure 4, Figure 5, Figure 6, Figure 7, Figure 8, Figure 9, Figure 10 and Figure 11), each node is a household, and each household typically had one respondent. For the five households with both a male and a female respondent answering jointly, we did not assign a gender to the responses. Table 4 provides a summary of network statistics across sites and seed network types, including statistics for additional crop- and variety-specific networks. In most sites and for most crops, there was no statistical evidence of differences in the average degree centrality of women vs. men in the seed networks. However, our sample shows a higher participation of women in seed networks than men across all sites.
Table 5 shows the gender of seed exchange participants, illustrating what proportion of exchanges for a given gender are with other individuals of the same gender. Across sites, a higher proportion of women exchanged seed with other women than did men with other men.
At the Lower Nyando site in Kenya, we find an overall network density of 0.004. Lower Nyando is one of two sites with a significant gendered difference in centrality, with women having a significantly higher betweenness than men (20.806 vs. 3.250) (p = 0.005) (Table 4; Figure 2). Women appear to predominate the most dense, central component of the network, with men participating more in the peripheral components. Across the network, 71.6% of exchanges with women were between women, compared to only 41.7% of exchanges between only men (Table 5). Additionally, twice as many women are participating in the seed network than are men (72 vs. 36), further suggesting women farmers may disproportionately rely on social networks for accessing seed. This suggests that women have more extensive networks than men on average and, as a result, may have a greater access to more diverse seed through these networks then men in Lower Nyando.
At the Upper Nyando site, the network analysis shows a network density of 0.004, an average degree centrality of 2.420, and an average betweenness of 136.292 (Table 4; Figure 3). While Upper Nyando’s average betweenness is much higher than for other sites, its density is similar to other sites. Both women and men farmers in Upper Nyando have a similar number of connections and women farmers have greater betweenness (226.442 vs. 136.292), although this difference was not significant. Although some of the smaller and branching components in the network appear to have some gender-based clustering, with people with the same gender located adjacent to one another, the densest component of the network (at the top of the figure) is relatively mixed in gender. As a reflection of this, Upper Nyando had the highest rates of exchanges across genders—among all seed exchanges reported by men, 75.9% involved an exchange to/from women (Table 5).
The Hombolo network in Tanzania has a density of 0.004 (Table 4; Figure 4). This network is much more segmented than the other networks, having a low average betweenness of only 0.848 and the lowest average degree centrality among all the overall networks, at 1.602. We did not observe any gendered differences in network centrality; however, men’s networks and women’s networks are clearly clustered in the network map—i.e., women tend to exchange seeds with other women farmers, and men with other men. Men comprise most of the largest network component, whereas women tend to be dispersed in small clusters in smaller components. However, overall, both men and women exchanged seed with farmers of a different gender at slightly higher rates than with farmers of the same gender (Table 5). This may be because in Hombolo, the population density is very low and homes are widely dispersed, hence proximity plays an important role in determining with whom the farmers exchange seeds.
In Singida, Tanzania, there was no significant difference between genders in terms of network density or centrality (Table 4; Figure 5), again suggesting that men and women in this community may have equivalent access to seed diversity through social networks. In this network, we also observe more women over 45 years of age having more ties within the network, and we again observe some clustering by gender: overall, women exchange with other women at a slightly higher rate than men with other men (54.1% vs. 42.9%) (Table 5). However, this difference may be in part due to a higher proportion of women in the network itself (Table 4).
At the Hoima site in Uganda, we find an overall network density of 0.002, an average degree centrality of 1.773, and an average betweenness of 2.573 (Table 4; Figure 6). In general, the seed networks in Hoima have low network density and centrality because most farmers rely on own saved seed as a source of their planting materials. Additionally, men and women are about equally as likely to exchange with a like-gendered farmer as they are to exchange with a different-gendered farmer (Table 5). However, several small components appear to have pockets of like-gendered participants who exchange with each other.
Overall network analysis findings across the five study sites suggest that although women’s and men’s social seed networks are similar in terms of common network metrics (betweenness, centrality), women’s and men’s networks differ meaningfully. Women, and particularly older women, are, on average, more extensively connected to other farmers, and both women and men are often most likely to engage in seed exchange with other farmers of the same gender across most study sites. Both findings may be a reflection of gender norms restricting women’s access to both the formal seed sector (with limited access to the formal sector resulting in women’s greater reliance on other farmers for seed), as well as to potentially more lucrative crops and markets exchanged among men’s networks (as men’s networks are often largely separate from women’s).

4.5. Climate Change Adaption Varieties by Gender

The preferred crop variety for climate change adaptation varies by site, with no two sites having the same variety preference. Farmers at the Hoima site mainly choose beans as their preferred crop for climate change adaption, while farmers at all other sites predominantly choose sorghum varieties. In most sites, women and men agree on the top variety for climate change adaption but tend to deviate on the preferred second and third adaption varieties. These data suggest that women and men are largely adopting similar strategies and may potentially be receiving similar information. However, the sharp deviation of second and third choices suggests that a sizable share of women and men farmers are adopting meaningfully different climate adaption strategies.
Table 6 shows a summary of top varieties and crops for climate change adaptation in each site. Improved varieties seem to be the top varieties used for climate change adaptation. However, we see that overall men have better access to improved varieties, whereas women tend to have better access to local varieties that they exchange through social networks. Most notably, local varieties of sorghum (e.g., Cheplelilet) are used by women and not by men for climate change adaptation. Likewise, the local variety of sorghum known as Sandala is exclusively used by women for climate change adaptation in Hombolo, compared to improved varieties that are more accessible to men. This may again reflect the gender norms constraining women’s access to resources such as improved seeds and related information. Focus group discussions suggest improved varieties are often purchased from agrovets (local shops that stock seeds), requiring both cash and access to markets.
Figure 7, Figure 8, Figure 9, Figure 10 and Figure 11 show the farmers’ social seed networks with a focus on exchange of crops most commonly used to adapt to climate change at each study site.
Like the overall network, the sorghum networks in Lower Nyando, Kenya have a significant gender difference in network centrality, with women having a higher centrality than men (p = 0.01) (Table 4; Figure 7). However, this difference does not hold true for the specific variety Red sorghum (an improved variety) network, which was the most commonly reported variety used for climate change adaptation in Lower Nyando. This could suggest that men are more likely to exchange seed and information on improved varieties, while women are more prominent in networks for other (traditional) sorghum varieties. We further find that women who do exchange Red sorghum with other farmers tend to have a greater number of connections and to be older (over 45 years), further suggesting more resource-constrained and socially isolated young women farmers may be less likely to access improved seed varieties. Like for the overall network, women predominate the main component, and men occupy smaller periphery components in the sorghum network. However, the densest component of the full network for Lower Nyando (all crops, Figure 2) has split into two disconnected components in the sorghum network, indicating that a non-sorghum seed exchange served as a connection between the two sorghum-dominated components.
In Upper Nyando, few farmers reported using any crops to adapt to climate change (Table 4). Sorghum is the most common crop used by farmers to adapt to climate change in the study site, though no clear patterns emerge in the relatively thin sorghum-specific network (Figure 8).
The sorghum network in Hombolo, Tanzania has an overall density of 0.004 (Table 4; Figure 9), again with strong clustering by gender. Like the overall Hombolo network, the largest component of the Hombolo sorghum network is dominated by male farmers, whereas women tend to occupy smaller components. For the Macia sorghum variety specifically, men participate in significantly more seed exchanges than women. Once again, this may be because Macia is an improved variety that can be accessed mainly through agro-vets and, hence, is more easily accessible to men.
The Singida sorghum network shows no significant gendered differences (Table 4; Figure 10). However, we see male farmers over 45 years of age having more connections for seed exchange compared to women who have more connections with each other but with fewer nodal farmers (Table 5).
Finally, the bean network in Hoima, Uganda has a density of 0.002 (Table 4; Figure 11). We do not find significant gendered differences in this network. In contrast to other crops, for beans, the exchange of multiple varieties was relatively common, in part likely because farmers mostly rely on their own saved seeds for beans. Like the overall network, the bean network in Hoima shows some clustering by gender within smaller network components, but overall exchanges from women to men and men to women were also very common—roughly half of all exchanges were across genders (Table 5).

5. Discussion

This paper used network analysis to explore differences in seed networks across women and men for three major food security crops—beans, finger millet, and sorghum—in Kenya, Tanzania, and Uganda. Our results suggest that women and men alike perceive threats from climate change and seek to apply similar strategies for climate change adaptation. In all study sites, climate-related challenges reported by farmers included shortened seasons, increased incidences of drought, erratic rainfall, and increased average temperatures. In order to cope with these effects, farmers have adopted different strategies such as switching to more resilient crops, or to more resilient varieties of currently planted crops. However, there appear to be notable gendered differences in the access to and use of seeds for climate change adaptation, with men using improved seed to adapt at higher rates in Lower Nyando, Kenya and Hombolo, Tanzania, and with varietal choices varying markedly across women and men. Differences in varietal choices might occur due to gendered disparities in accessing seed resources and related information, since adapting using improved seed requires access to both genetic resources and information on seed.
Consistent with previous research suggesting discrepancies in access to resources, such as land and agricultural inputs, are associated with higher rates of poverty and food insecurity among women farmers than men [2,55], this study finds that men have greater access to improved varieties for climate change adaptation, while women are more reliant on social seed networks for access to hardier traditional varieties. Furthermore, both women and men farmers participate differently in seed networks, as is evidenced from this study, with women farmers having different levels of access to seeds, reflecting a combination of resource constraints and gender norms. In our study, we find that men have more access to improved varieties and more connections with each other, especially with respect to the exchange of information and seeds of improved varieties. Women, therefore, tend to rely more on their own exchange networks with greater access to local varieties, which they save and exchange amongst themselves, but also that are more easily accessible within their own social networks. Overall, a key finding across sites is that, although women have more connections than men in almost all the sites, men still often have access to more diverse seeds for climate change adaptation, including improved seeds.
Given growing evidence that climate change-related variability threatens to undermine rural agricultural production systems and food security [13], these findings suggest resource-constrained rural smallholder farmers, and in particular women and female-headed households, may have fewer options available to them to adapt to climate change than wealthier and male-headed households with greater access to resources and markets [4,56]. In this sense, local farmer-to-farmer exchanges through informal seed systems may not only present an opportunity for adaptation to climate variability [20], but may also have important gender equity implications: given women’s and men’s different levels of reliance upon informal seed systems, the diversity and quality of seed available through these “informal” networks may have profound consequences for women’s productivity, income, and welfare, including household food security.
Limitations of this study include the reliance on a snowball sampling approach, which may miss some especially isolated farmers who are not part of the surveyed networks. Our study is also limited by the way the network is defined—as an in-person exchange of seed or information about seed—which may miss the potentially important roles of electronic information and social media linkages increasingly available to farmers regardless of context (examples in [57,58]).
Nevertheless, our results provide valuable insights suggesting that climate change adaptation with seeds in East Africa appears to be dependent upon access to information, social networks, and resources, all of which have gendered disparities. Men appear to have greater access to improved varieties both via formal seed system channels and extension services, as well as through social networks disproportionately including men, which accompanies men’s higher rates of climate change adaption using improved varieties in the study sites. Meanwhile, women farmers on average are relatively more isolated from the formal seed system and information sources like extension and, thus, disproportionately rely on exchange of local varieties in their own social networks. As a result, gendered differences in access to planting material and accompanying knowledge is potentially leading to differences in climate change adaptation options and behaviors across women and men, and, ultimately, to differences in production, incomes, and other livelihood outcomes.

6. Conclusions

Many smallholder farmers in East Africa are already using climate change adaptation strategies. For example, drought-tolerant maize varieties [33], improved irrigation systems [59], companion cropping [60], and crop diversification [60,61,62,63] have all shown varying levels of effectiveness at helping farmers sustain or increase crop production. Yet, there is evidence that especially among lower-income households, more remote households, and female-headed households—many of the poorest farmers in sub-Saharan Africa—continue to rely on traditional, rainfed crops and production systems and remain reliant on their own production for food security to a larger degree than wealthier, more urban, and male-headed households with greater access to resources and markets [4,57].
The results of this study suggest that although women and men smallholder farmers in East Africa face similar climate-related challenges, their ability to cope with the effects of climate change can vary due to inequalities related to access to relevant resources for adaptation. Seed is one of the most important resources for climate change adaptation not only to improve productivity but also to ensure household food security. In order for adaptation strategies relying on seed to be effective, it is important to ensure that seed system interventions provide equitable access to diverse and improved seeds and information. Market interventions that take into account resource constraints experienced by women might better support expanded access to seeds for climate change adaptation. Furthermore, policies and strategies that seek to improve integrated seed systems, in terms of both quality and diversity to ensure they work to meet farmers’ needs, should be emphasized and supported.

Author Contributions

Conceptualization: G.O. and T.W.R.; methodology: G.O., J.R., T.W.R., and W.M.Z.; software: W.M.Z.; validation: G.O., T.W.R., and W.M.Z.; formal analysis: W.M.Z.; investigation: G.O., T.W.R., and W.M.Z.; data curation: G.O. and W.M.Z.; writing—original draft preparation: G.O. and W.M.Z.; content review and editing T.W.R., G.O., J.R., and W.M.Z.; visualization: W.M.Z.; supervision: G.O. and T.W.R.; project administration: G.O. and J.R.; funding acquisition: G.O. All authors have read and agreed to the published version of the manuscript.

Funding

This research was funded by the International Treaty for Plant Genetic Resources for Food and Agriculture through the Benefit Sharing Fund. This work was implemented as part of the CGIAR Research Program on Climate Change, Agriculture and Food Security (CCAFS), which is carried out with support from the CGIAR Trust Fund and through bilateral funding agreements. For details please visit https://ccafs.cgiar.org/donors. This material is also based upon work supported by the National Science Foundation under Grant No. SMA-1950766. Any opinions, findings, and conclusions or recommendations expressed in this material are those of the author(s); the views expressed in this document cannot be taken to reflect the official opinions of these organizations.

Institutional Review Board Statement

The study was conducted according to the guidelines of the Declaration of Alliance of Bioversity International and CIAT.

Informed Consent Statement

Informed consent was obtained from all subjects involved in the study.

Data Availability Statement

The data related to this study are available from the authors upon request.

Acknowledgments

The authors acknowledge technical support and organizational assistance from Joyce Adokorach and John W. Mulumba of the Uganda National Agricultural Research Organization (NARO), Margaret Mollel of the Tanzania National Plant Genetic Resources Center, and Carlo Fadda of Bioversity International, and further technical support from Eliza Baker-Wacks, Emilie Klein, Hannah Lacasse, and Nellie LaValle of Colby College. We also thank Olga Spellman of the Alliance of Bioversity International and CIAT for technical English and editing support.

Conflicts of Interest

The authors declare no conflict of interest.

Appendix A

Table A1. Climate change perception by gender and study site.
Climate Change PerceptionGenderLower Nyando,
Kenya
Upper Nyando,
Kenya
Hombolo,
Tanzania
Singida,
Tanzania
Hoima,
Uganda
Experienced climate change impactsMale98.2%96.7%100.0%87.5%90.1%
Female98.3%90.9%100.0%91.5%90.7%
Shifting seasonsMale98.2%92.3%100.0%96.8%90.8%
Female97.4%90.9%80.0%96.5%93.9%
Short rainsMale98.2%95.6%90.0%93.7%100.0%
Female98.3%90.9%97.1%95.3%95.8%
Heavy rainsMale98.2%95.6%40.0%14.3%81.7%
Female97.4%90.9%34.3%93.0%83.0%
Erratic rainsMale98.2%95.6%100.0%92.1%90.0%
Female95.7%90.9%94.3%95.3%84.2%
FloodingMale89.1%69.2%40.0%12.7%49.5%
Female91.5%39.4%45.7%17.4%41.2%
DroughtMale98.2%96.7%100.0%98.4%100.0%
Female98.3%90.9%100.0%97.7%99.3%
Increased temperaturesMale98.2%95.6%30.0%69.8%98.2%
Female98.3%90.9%60.0%82.6%99.3%
Pests and diseasesMale98.2%92.3%70.0%98.4%93.6%
Female94.0%87.9%88.6%100.0%96.4%
WindMale87.3%79.1%90.0%93.7%88.1%
Female86.3%77.8%94.3%97.7%92.7%

References

  1. FAO. Sex-Disaggregated Data in Agriculture and Sustainable Resource Management: New Approaches for Data Collection and Analysis; FAO: Rome, Italy, 2019.
  2. Quisumbing, A.R.; Meinzen-Dick, R.; Raney, T.L.; Croppenstedt, A.; Behrman, J.A.; Peterman, A. Gender in Agriculture: Closing the Knowledge Gap; Springer Science & Business: Dordrecht, The Netherlands, 2014. [Google Scholar]
  3. Peterman, A.; Quisumbing, A.; Berhman, J.; Nkonya, E. Understanding the complexities surrounding gender differences in agricultural productivity in Nigeria and Uganda. J. Dev. Stud. 2011, 47, 1482–1509. [Google Scholar] [CrossRef]
  4. Koppmair, S.; Kassie, M.; Qaim, M. The influence of farm input subsidies on the adoption of natural resource management technologies. Aust. J. Agric. Resour. Econ. 2017, 61, 539–556. [Google Scholar] [CrossRef]
  5. Salami, A.; Kamara, A.B.; Brixiova, Z. Smallholder Agriculture in East Africa: Trends, Constraints and Opportunities; African Development Bank: Tunis, Tunisia, 2010. [Google Scholar]
  6. FAO; IFAD; UNICEF; WFP; WH. The State of Food Security and Nutrition in the World 2018: Building Climate Resilience for Food Security and Nutrition; FAO: Rome, Italy, 2018.
  7. IFAD. Rural Development Report 2016: Fostering Inclusive Rural Transformation; IFAD: Rome, Italy, 2016. [Google Scholar]
  8. Niles, M.T.; Salerno, J. A cross country analysis of climate shocks on smallholder food insecurity. PLoS ONE 2018, 13, e0195405. [Google Scholar] [CrossRef]
  9. Ombogoh, D.B.; Tanui, J.; McMullin, S.; Muriuki, J.; Mowo, J. Enhancing adaptation to climate variability in the East African highlands: A case for fostering collective action among smallholder farmers in Kenya and Uganda. Clim. Dev. 2016, 10, 61–72. [Google Scholar] [CrossRef] [Green Version]
  10. Ampaire, E.L.; Jassogne, L.; Providence, H.; Acosta, M.; Twyman, J.; Winowiecki, L.; van Asten, P. Institutional challenges to climate change adaptation: A case study on policy action gaps in Uganda. Environ. Sci. Policy 2017, 75, 81–90. [Google Scholar] [CrossRef]
  11. Cooper, S.J.; Wheeler, T. Rural household vulnerability to climate risk in Uganda. Reg. Environ. Chang. 2017, 17, 649–663. [Google Scholar] [CrossRef]
  12. Jost, C.; Kyazze, F.; Naab, J.; Neelormi, S.; Kinyangi, J.; Zougmore, R.; Aggarwal, P.; Bhatta, G.; Chaudhury, M.; Tapio-Bistrom, M.L.; et al. Understanding gender dimensions of agriculture and climate change in smallholder farming communities. Clim. Dev. 2016, 8, 133–144. [Google Scholar] [CrossRef] [Green Version]
  13. Tiyo, C.E.; Orach-Meza, F.L.; Edroma, E.L. Understanding small-scale farmers’ perception and adaptation strategies to climate change impacts: Evidence from two agro-ecological zones bordering national parks of Uganda. J. Agric. Sci. 2015, 7, 253–270. [Google Scholar]
  14. Okonya, J.S.; Syndikus, K.; Kroschel, J. Farmers’ perception of and coping strategies to climate change: Evidence from six agro-ecological zones of Uganda. J. Agric. Sci. 2013, 5, 252–563. [Google Scholar] [CrossRef] [Green Version]
  15. Adhikari, U.; Nejadhashemi, P.A.; Woznicki, S. A climate change and East Africa: A review of impacts on major crops. Food Energy Secur. 2015, 4, 110–132. [Google Scholar]
  16. Doss, C.; Meinzen-Dick, R.; Quisumbing, A.; Theis, S. Women in agriculture: Four myths. Glob. Food Secur. 2018, 16, 69–74. [Google Scholar] [CrossRef]
  17. Progressio (Ed.) Seed Saving and Climate Change in Zimbabwe; Progressio: London, UK, 2009. [Google Scholar]
  18. Westengen, O.T.; Brysting, A.K. Crop adaptation to climate change in the semi-arid zone in Tanzania: The role of genetic resources and seed systems. Agric. Food Secur. 2014, 3, 3. [Google Scholar] [CrossRef] [Green Version]
  19. Altieri, M.A.; Funes-Monzote, F.R.; Peterson, P. Agroecologically efficient agricultural systems for smallholder farmers: Contributions to food security. Agron. Sustain. Dev. 2012, 32, 1–13. [Google Scholar] [CrossRef] [Green Version]
  20. McGuire, S.; Sperling, L. Making seed systems more resilient to stress. Glob. Environ. Chang. 2013, 23, 644–653. [Google Scholar] [CrossRef]
  21. Anderson, C.L.; Reynolds, T.W.; Biscaye, P.; Patwardan, V.; Schmidt, C. Economic benefits of empowering women in agriculture: Assumptions and evidence. J. Dev. Stud. 2020, 1–16. [Google Scholar] [CrossRef]
  22. Reynolds, T.W.; Tobin, D.; Otieno, G.; McCracken, A.; Guo, J. Differences in crop selection, resource constraints, and crop use values among female- and male-headed smallholder households in Kenya, Tanzania, and Uganda. J. Agric. Food Syst. Community Dev. 2020, 9, 1–28. [Google Scholar]
  23. CTA. Seed Systems, Science, and Policy in East and Central Africa; The Technical Centre for Agricultural and Rural Cooperation: Wageningen, The Netherlands, 2015; Available online: https://www.asareca.org/publication/seed-systems-science-and-policy-east-and-central-africa (accessed on 1 February 2021).
  24. Louwaars, N.P.; de Boef, W.S.; Edeme, J. Integrated seed sector development in Africa: A basis for seed policy and law. J. Crop Improv. 2013, 27, 186–214. [Google Scholar] [CrossRef]
  25. Rachkara, P.; Phillips, D.P.; Kalule, S.W.; Gibson, R.W. Innovative and beneficial informal sweetpotato private enterprise in northern Uganda. Food Secur. 2017, 9, 595–610. [Google Scholar] [CrossRef]
  26. Otieno, G.; Lacasse, H.; Fadda, C.; Reynolds, T.W.; Recha, J.W. Social Seed Networks for Climate Change Adaptation in Western Kenya; CCAFS Info Note; CGIAR Research Program on Climate Change, Agriculture and Food Security (CCAFS): Wageningen, The Netherlands, 2018; Available online: https://cgspace.cgiar.org/handle/10568/93210 (accessed on 1 February 2021).
  27. Bellon, M.R.; Hodson, D.; Hellin, J. Assessing the vulnerability of traditional maize seed systems in Mexico to climate change. Proc. Natl. Acad. Sci. USA 2011, 108, 13432–13437. [Google Scholar] [CrossRef] [PubMed] [Green Version]
  28. Hellin, J.; Bellon, M.R.; Hearne, S.J. Maize landraces and adaptation to climate change in Mexico. J. Crop Improv. 2014, 28, 484–501. [Google Scholar] [CrossRef]
  29. Otieno, G.; Mulumba, J.W.; Namulondo, B.; Halewood, M. Climate-Resilient Seed Systems & Access and Benefit-Sharing in Uganda; ISSD Africa: Kampala, Uganda, 2017. [Google Scholar]
  30. Food and Agricultural Organization of the United Nations (FAO); Rome, Italy, 2013. Available online: http://faostat.fao.org (accessed on 1 February 2021).
  31. O’Sullivan, M.; Rao, A.; Banerjee, R.; Gulati, K.; Vinez, M. Levelling the Field: Improving Opportunities for Women Farmers in Africa; World Bank: Washington, DC, USA, 2014. [Google Scholar]
  32. Tadesse, Y.; Almekinders, C.J.M.; Schulte, R.P.O.; Struik, P.C. Tracing the seed: Seed diffusion of improved potato varieties through farmers’ networks in Chencha, Ethiopia. Exp. Agric. 2016, 1–16. [Google Scholar] [CrossRef]
  33. Fisher, M.; Carr, E.R. The influence of gendered roles and responsibilities on the adoption of technologies that mitigate drought risk: The case of drought-tolerant maize seed in East Uganda. Glob. Environ. Chang. 2015, 35, 82–92. [Google Scholar] [CrossRef] [Green Version]
  34. McOmber, C.; Panikowski, A.; McKune, S.; Bartels, W.; Russo, S. Investigating Climate Information Services through a Gendered Lens. CCAFS Working Paper No. 42. 2013. Available online: https://cgspace.cgiar.org/handle/10568/27887 (accessed on 1 February 2021).
  35. FAO. The State of Food and Agriculture 2010–2011: Women in Agriculture; FAO: Rome, Italy, 2011.
  36. Coomes, O.T.; McGuire, S.J.; Garine, E.; Caillon, S.; McKey, D.; Demeulenaere, E.; Devra, J.; Guntra, A.; Adeline, B.; Pascal, C.; et al. Farmer seed networks make a limited contribution to agriculture? Four common misconceptions. Food Policy 2015, 56, 41–50. [Google Scholar] [CrossRef]
  37. Mucioki, M.; Johns, T.; Muriithi, C.; Hickey, G. The influence of gender roles and human migrations on the distribution of crop biodiversity in Tharaka, Kenya. J. Ethnobiol. 2016, 36, 172–191. [Google Scholar] [CrossRef]
  38. Pincus, L.; Croft, M.; Roothaert, R.; Dubois, T. African indigenous vegetable seed systems in western Kenya. Econ. Bot. 2018, 72, 380–395. [Google Scholar] [CrossRef]
  39. Violon, C.; Thomas, M.; Garine, E. Good year, bad year: Changing strategies, changing networks? A two-year study on seed acquisition in northern Cameroon. Ecol. Soc. 2016, 113, 98–103. [Google Scholar] [CrossRef] [Green Version]
  40. Pérez, C.; Jones, E.M.; Kristjanson, P.; Cramer, L.; Thornton, P.K.; Förch, W.; Barahona, C.A. How resilient are farming households and communities to a changing climate in Africa? A gender-based perspective. Glob. Environ. Chang. 2015, 34, 95–107. [Google Scholar] [CrossRef] [Green Version]
  41. Mudege, N.N.; Walsh, S. Gender and Roots Tubers and Bananas Seed Systems: A Literature Review; CGIAR Research Program on Roots, Tubers and Bananas (RTB), 2016. Available online: https://cgspace.cgiar.org/handle/10568/81051. (accessed on 1 February 2021).
  42. Nyberg, Y.; Jonsson, M.; Ambjörnsson, E.L.; Wetterlind, J.; Öborn, I. Smallholders’ awareness of adaptation and coping measures to deal with rainfall variability in Western Kenya. Agroecol. Sustain. Food Syst. 2020, 44, 1–29. [Google Scholar]
  43. Vasilaky, K. Female social networks and farmer training: Can randomized information exchange improve outcomes? Am. J. Agric. Econ. 2012, 95, 376–383. [Google Scholar] [CrossRef]
  44. Abay, F.; de Boef, W.; Bjørnstad, Å. Network analysis of barley seed flows in Tigray, Ethiopia: Supporting the design of strategies that contribute to on-farm management of plant genetic resources. Plant Genet. Resour. 2011, 9, 495–505. [Google Scholar] [CrossRef]
  45. Thomas, M.; Demeulenaere, E.; Dawson, J.C.; Khan, A.R.; Galic, N.; Jouanne-Pin, S.; Remoue, C.; Bonneuil, C.; Goldringer, I. On-farm dynamic management of genetic diversity: The impact of seed diffusions and seed saving practices on a population-variety of bread wheat. Evol. Appl. 2012, 5, 779–795. [Google Scholar] [CrossRef]
  46. Ricciardi, V. Social seed networks: Identifying central farmers for equitable seed access. Agric. Syst. 2015, 139, 110–121. [Google Scholar] [CrossRef]
  47. McGuire, S. Securing access to seed: Social relations and sorghum seed exchange in East Ethiopia. Hum. Ecol. 2008, 36, 217–229. [Google Scholar] [CrossRef]
  48. Pautasso, M.; Aistara, G.; Barnaud, A.; Caillon, S.; Clouvel, P.; Coomes, O.T.; Tramontini, S. Seed exchange networks for agrobiodiversity conservation. A review. Agron. Sustain. Dev. 2013, 33, 151–175. [Google Scholar] [CrossRef] [Green Version]
  49. Poudel, D.; Bhuwon, S.; Shrestha, P. An analysis of social seed network and its contribution to on-farm conservation of crop genetic diversity in Nepal. Int. J. Biodivers. 2015, 1–13. [Google Scholar] [CrossRef] [PubMed]
  50. Krebs, V. An Introduction to Social Network Analysis. 2005. Available online: http://www.orgnet.com/sna.html (accessed on 1 February 2021).
  51. Hanemann, R.A.; Riddle, M. Introduction to Social Network Methods; University of California: Riverside, CA, USA, 2005. Available online: http://faculty.ucr.edu/~hanneman/ (accessed on 1 February 2021).
  52. Salpeteur, M.; Calvet-Mir, L.; Diaz-Reviriego, I.; Reyes-García, V. Networking the environment: Social network analysis in environmental management and local ecological knowledge studies. Ecol. Society 2017, 22, 1–6. [Google Scholar]
  53. Rufino, M.C.; Hengsdijk, H.; Verhagen, A. Analyzing integration and diversity in agro ecosystems by using indicators of network analysis. Nutr. Cycl. Agroecosystems 2009, 84, 229–247. [Google Scholar] [CrossRef]
  54. Thuo, M.; Bell, A.A.; Bravo-Ureta, B.E.; Okello, D.K.; Okoko, E.N.; Kidula, N.L.; Deom, C.M.; Puppala, N. Social networking structures among groundnut farmers. J. Agric. Educ. Ext. 2013, 19, 339–359. [Google Scholar] [CrossRef]
  55. FAO; International Fund for Agricultural Development (IFAD); UNICEF; WFP (World Food Program); World Health Organization (WHO). The State of Food Security and Nutrition in the World: Safeguarding against Economic Slowdowns and Downturns. 2019. Available online: http://www.fao.org/publications/sofi/en/ (accessed on 1 February 2021).
  56. Lovo, S.; Veronesi, M. Crop diversification and child health: Empirical evidence from Tanzania. Ecol. Econ. 2019, 158, 168–179. [Google Scholar] [CrossRef] [Green Version]
  57. Amato, F.; Moscato, V.; Picariello, A.; Sperlí, G. Multimedia social network modeling: A proposal. In 2016 IEEE Tenth International Conference on Semantic Computing (ICSC); IEEE: Laguna Hills, CA, USA, 2016; pp. 448–453. [Google Scholar]
  58. Amato, F.; Moscato, V.; Picariello, A.; Sperlí, G. Diffusion algorithms in multimedia social networks: A preliminary model. In Proceedings of the 2017 IEEE/ACM International Conference on Advances in Social Networks Analysis and Mining, Sydney, Australia, 31 July–3 August 2017; pp. 844–851. [Google Scholar]
  59. Gathungu, G.K.; Aguyoh, J.N.; Isutsa, D.K. Effects of Integration of irrigation water and mineral nutrient management in seed potato (Solanum Tuberosum L.) production on water, nitrogen and phosphorus use efficiencies. In Adapting African Agriculture to Climate Change: Transforming Rural Livelihoods; Filho, W.L., Esilaba, A.O., Rao, K.P.C., Sridhar, G., Eds.; Springer International Publishing: Berlin/Heidelberg, Germany, 2015; pp. 171–183. [Google Scholar] [CrossRef]
  60. Midega, C.A.O.; Bruce, T.J.A.; Pickett, J.A.; Pittchar, J.O.; Murage, A.; Khan, Z.R. Climate adapted companion cropping increases agricultural productivity in East Africa. Field Crop. Res. 2015, 180, 118–125. [Google Scholar] [CrossRef] [Green Version]
  61. Cairns, J.E.; Hellin, J.; Sonder, K.; Araus, J.L.; MacRobert, J.F.; Thierfelder, C.; Prasanna, B.M. Adapting maize production to climate change in sub-Saharan Africa. Food Secur. 2013, 5, 345–360. [Google Scholar] [CrossRef] [Green Version]
  62. Martin, T.; Biruma, M.; Fogelqvist, J.; Okori, P.; Dixelius, C. Unlocking the potential of sorghum for development in East Africa. In Sorghum: Production, Growth Habits and Health Benefits; Nova: Hauppauge, NY, USA, 2013; pp. 45–65. [Google Scholar]
  63. Deressa, T.T.; Hassan, R.M.; Ringler, C.; Alemu, T.; Yesuf, M. Determinants of farmers’ choice of adaptation methods to climate change in the Nile Basin of Ethiopia. Glob. Environ. Chang. 2009, 19, 248–255. [Google Scholar] [CrossRef] [Green Version]
Figure 1. Study countries in East Africa (A) and survey sites in Kenya, Tanzania, and Uganda (B).
Sustainability 13 02074 g001
Figure 2. Seed exchange network among farmers in Lower Nyando, Kenya by gender and age. Thicker lines indicate greater numbers of varieties exchanged.
Sustainability 13 02074 g002
Figure 3. Seed exchange network among farmers in Upper Nyando, Kenya by gender and age. Thicker lines indicate greater numbers of varieties exchanged. Purple nodes indicate that two respondents of different genders responded jointly for the household.
Sustainability 13 02074 g003
Figure 4. Seed exchange network among farmers in Hombolo, Tanzania by gender and age. Thicker lines indicate greater numbers of varieties exchanged.
Sustainability 13 02074 g004
Figure 5. Seed exchange network among farmers in Singida, Tanzania by gender and age. Thicker lines indicate greater numbers of varieties exchanged. Purple nodes indicate that two respondents of different genders responded jointly for the household.
Sustainability 13 02074 g005
Figure 6. Seed exchange network among farmers in Hoima, Uganda by gender and age. Thicker lines indicate greater numbers of varieties exchanged. Purple nodes indicate that two respondents of different genders responded jointly for the household.
Sustainability 13 02074 g006
Figure 7. Exchange of sorghum among farmers in Lower Nyando, Kenya by gender and age. Thicker lines indicate greater numbers of sorghum varieties exchanged.
Sustainability 13 02074 g007
Figure 8. Exchange of sorghum among farmers in Upper Nyando, Kenya by gender and age. Thicker lines indicate greater numbers of sorghum varieties exchanged. Purple nodes indicate that two respondents of different genders responded jointly for the household.
Sustainability 13 02074 g008
Figure 9. Exchange of sorghum among farmers in Hombolo, Tanzania by gender and age. Thicker lines indicate greater numbers of sorghum varieties exchanged.
Sustainability 13 02074 g009
Figure 10. Exchange of sorghum among farmers in Singida, Tanzania by gender and age. Thicker lines indicate greater numbers of sorghum varieties exchanged. Purple nodes indicate that two respondents of different genders responded jointly for the household.
Sustainability 13 02074 g010
Figure 11. Exchange of beans among farmers in Hoima, Uganda by gender and age. Thicker lines indicate greater numbers of bean varieties exchanged. Purple nodes indicate that two respondents of different genders responded jointly for the household.
Sustainability 13 02074 g011
Table 1. Characteristics of the study sites.
Lower Nyando, KenyaUpper Nyando, KenyaHombolo, TanzaniaSingida, TanzaniaHoima, Uganda
Farming systemMixed subsistence Mixed subsistence to commercialMixed subsistenceMixed subsistenceMixed subsistence
Agro-ecologySemi-arid to Sub humidSub-humidSemi-aridSemi-arid to Sub humidSub-humid
Average rainfall (mm)80012204006001200
Temperature (°C)18–3412–3012–3512–3012–32
Altitude (MASL)1100–13001200–1400110015001120
Market accessVery goodVery goodPoorModerateVery good
Source: authors’ compilation.
Table 2. Expert connections, % and count by gender and study site.
One or More Expert Connections
Overall
% (Count)
Men
% of Men (Count)
Women
% of Women (Count)
KenyaLower Nyando28.3% (49)43.6% (24)21.2% (25)
Upper Nyando41.9% (80)37.0% (34)46.5% (46)
TanzaniaHombolo15.5% (26)32.9% (23)3.1% (3)
Singida9.6% (16)13.9% (10)6.4% (6)
UgandaHoima10.2% (31)10.7% (13)9.9% (18)
Table 3. Climate change adaptation with new/varied seed, % and count by study site.
Adapting Using New/Varied Seed
Study SiteLower NyandoUpper NyandoHomboloSingidaHoima
Any adaptation with seed reported57.2% (99)2.6% (5)51.2% (86)4.8% (8)23.4% (71)
Adaptation with seed among men83.6% (46)4.3% (4)60% (42)6.9% (5)20.7% (25)
Adaptation with seed among women44.9% (53)1% (1)44.9% (44)3.2% (3)25.3% (46)
Adaptation by age of household head:
 15–3050% (2)0% (0)50% (4)5.9% (1)31.8% (14)
 41–4572.7% (32)2.5% (2)38.9% (21)3.5% (2)26.1% (31)
 Over 4552% (66)3.5% (3)57.5% (61)5.6% (5)18.4% (25)
Adaptation by education of household head:
 Less than primary education0% (0)1% (1)34% (16)3.8% (2)9.1% (8)
 Primary education or more62.3% (99)4.3% (4)57.9% (70)5.3% (6)29.9% (63)
Table 4. Network statistics by site and seed network type.
Density and ParticipationAverage Degree CentralityAverage Betweenness
DensityMenWomenAllMenWomenT-Test
p-Value
AllMenWomenT-Test
p-Value
Lower Nyando0.00436721.9752.9173.0560.7257.2383.25020.8060.005
 Sorghum0.00535691.9252.4862.8990.2304.2691.65711.0720.010
 Red Sorghum0.01615121.3641.6671.4170.3740.1820.3330.1670.453
Upper Nyando0.00462712.4203.9194.1410.70787.228136.292226.4420.244
 Sorghum0.00535481.5231.9141.8330.8020.6651.3711.0210.595
Hombolo0.00449601.6522.5102.0830.2200.8482.3471.2500.161
 Sorghum0.00447591.6022.2982.0340.4260.6451.4261.1690.601
 Macia0.00528461.6342.8571.8910.0470.6011.9640.8040.096
Singida0.00355711.8003.1642.6340.1334.8239.67312.0990.647
 Sorghum0.00635331.5412.0291.8480.5420.6481.0571.2120.797
 Naco Mtama 10.0281061.2171.3001.1670.5660.0430.0000.1670.363
Hoima0.00267961.7732.6722.6250.8662.5736.4635.0100.496
 Beans0.00267921.6832.4932.3800.6091.3474.1192.1740.134
 Seed Engufu0.00431511.4922.0652.0590.9840.5751.6131.1180.513
Note: Bolded p-values denote statistical significance at p < 0.10.
Table 5. Seed exchanges by participant gender, % and count by site and crop-specific network.
Exchanges by MenExchanges by Women
Men to/from MenMen to/from WomenWomen to/from WomenWomen to/from Men
Lower Nyando41.7% (15)58.3% (21)71.6% (53)28.4% (21)
 Sorghum41.9% (13)58.1% (18)74.3% (52)25.7% (18)
Upper Nyando24.1% (19)75.9% (60)47.8% (55)52.2% (60)
 Sorghum16% (4)84% (21)36.4% (12)63.6% (21)
Hombolo46.5% (20)53.5% (23)46.5% (20)53.5% (23)
 Sorghum43.6% (17)56.4% (22)47.6% (20)52.4% (22)
Singida42.9% (21)57.1% (28)54.1% (33)45.9% (28)
 Sorghum52.2% (12)47.8% (11)57.7% (15)42.3% (11)
Hoima43.1% (22)56.9% (29)50% (29)50% (29)
 Beans43.8% (21)56.3% (27)48.1% (25)51.9% (27)
Table 6. Top varieties exchanged and used for climate change adaptation, % and count by study site.
SiteCropVarietiesOverall
% and Count of Farmers by Site
Men
% and Count of Men by Site
Women
% and Count of Women by Site
Lower NyandoAnyAny Crop Used for Climate Adaptation57.2% (99)83.6% (46)44.9% (53)
SorghumAny Sorghum Variety Used56.6% (98)83.6% (46)44.1% (52)
 Red Sorghum (Improved)20.8% (36)41.8% (23)16.1% (19)
 Andiwo (Local)12.1% (21)18.2% (10)9.3% (11)
 Seredo (Improved)8.7% (15)10.9% (6)7.6% (9)
Upper NyandoAnyAny Crop Used for Climate Adaptation2.6% (5)4.3% (4)1.0% (1)
SorghumAny Sorghum Variety Used2.6% (5)4.3% (4)1.0% (1)
 Gusneck (Improved)0.5% (1)1.1% (1)0.0% (0)
 Cheplelilet (Local)0.5% (1)0.0% (0)1.0% (1)
 Serena (Improved)0.5% (1)0.0% (0)1.0% (1)
HomboloAnyAny Crop Used for Climate Adaptation51.2% (86)60% (42)44.9% (44)
SorghumAny Sorghum Variety Used50.6% (85)58.6% (41)44.9% (44)
 Macia (Improved)39.9% (67)44.3% (31)36.7% (36)
 Sandala (Local)1.8% (3)0.0% (0)3.1% (3)
 Tegemeo (Improved)3.0% (5)2.9% (2)3.1% (3)
SingidaAnyAny Crop Used for Climate Adaptation4.8% (8)6.9% (5)3.2% (3)
SorghumAny Sorghum Variety Used4.2% (7)6.9% (5)2.1% (2)
 NACO Mtama 1 (Improved)2.4% (4)2.8% (2)2.1% (2)
 Hakika (Improved)1.8% (3)4.2% (3)0.0% (0)
Macia (Improved)1.2% (2)2.8% (2)0.0% (0)
HoimaAnyAny Crop Used for Climate Adaptation23.4% (71)20.7% (25)25.3% (46)
BeansAny Bean Variety Used23.1% (70)20.7% (25)24.7% (45)
 Seed Engufu (Local)19.8% (60)17.4% (21)21.4% (39)
 Kaita bahuru (Local)2.3% (7)0.8% (1)3.3% (6)
 White beans (Improved)2.0% (6)4.1% (5)0.5% (1)
Publisher’s Note: MDPI stays neutral with regard to jurisdictional claims in published maps and institutional affiliations.

