Abstract
The ecological environment of urban water resources in the Yangtze River Economic Belt (YREB) is in a huge challenge; yet, while myriad studies have investigated the carrying capacity or sustainable utilization of Chinese water resources, few to none have looked at the inclusive sustainable development of water resources. In this article, a new concept of urban water inclusive sustainability (UWIS) is firstly proposed, and the conceptual framework of ASFII and a five-dimensional indicator system are developed, integrating availability, sustainability, friendliness, inclusiveness and innovation. The panel data of 38 cities in the YREB are adopted from 2008 to 2018 to measure UWIS and five development indexes by the TOPSIS (technique for order preference by similarity to ideal solution) and entropy method. Moreover, the characteristics of the temporal–spatial evolution of the overall system and subsystems coupling coordination are described using the coupling coordination degree model. Key factors that hinder UWIS are identified through the obstacle degree model. The results indicate that the overall UWIS showed a gradual upward trend at a lower to medium level from 2008 to 2018 and a friendliness > sustainability > inclusiveness > innovation > availability index. The UWIS from high to low is YRDUA (Yangtze River Delta urban agglomeration), MRYRUA (middle reaches of the Yangtze River urban agglomeration) and CCUA (Chengdu–Chongqing urban agglomeration). The 38 cities are in low-level coordination, and their temporal characteristics show a trend of economy > science and technology > water resources > environment > societal system, YRDUA > MRYRUA > CCUA. The spatial differentiation is manifested as high in the east and low in the west. The main obstacles come from 12 factors, such as the water resources utilization rate, etc. The findings of our study will be a scientific reference for the Chinese government to track UWIS and ensure urban water resources security in the YREB.
1. Introduction
The Yangtze River Economic Belt (YREB) is the river basin economic belt with the largest population and industrial scale in the world. The urban development and 500 million people’s lives in the YREB are closely related to water resources. According to the China Water Resources Bulletin of 2019, the total water resources of the nine provinces and two municipalities in the YREB accounted for 42.95% of the nation. The water consumption of industry, agriculture, residents and ecological environment accounted for 59.4%, 36.85%, 44.7% and 19.57%, respectively, and wastewater discharge accounted for more than 40%. Moreover, heavy energy consumption, water consumption and polluting industries such as coal, chemicals, steel, non-ferrous metals and papermaking are gathered along the Yangtze River, which poses a major threat to the drinking water of urban residents in the YREB. The imbalance of regional development has further aggravated the contradiction between supply and demand of urban water resources and the difficulty of water resources management. The water resources utilization rate in the Yangtze River basin is 17.8%, the reuse rate of industrial water is about 62%, the leakage rate of urban water supply pipe network is generally about 20% and the utilization coefficient of irrigation water is about 0.45 [1]. As a result, the Yangtze River Economic Belt is in a huge challenge for ecological environment and support capacity of urban water resources, and it is urgent to solve the problems of sustainability of water resources and coordinated development between cities in the YREB.
Myriad studies have investigated the carrying capacity or sustainable utilization of Chinese water resources [2,3,4], yet few to none have looked at the inclusive sustainable development of water resources. The holistic approach for sustainability is centered on the three pillars of sustainable development: the economy, society and environment, not fully considering the contribution of scientific and technological progress, and even less for social equity. The concept of inclusive growth was firstly proposed by the Asian Development Bank in 2007, which refers to the process of ensuring that everyone can participate in the growth process fairly and benefit from it [5]. Subsequently, the World Bank and the United Nations have adopted inclusive growth as an important strategy to guide the development of countries. In 2016, Chinese President Jinping Xi stated at the G20 summit in Hangzhou that China should boost inclusive growth.
The Yangtze River Economic Belt is an important national strategic development area in China. In September 2016, the “Outline of the Yangtze River Economic Belt Development Plan” established a new development pattern of “one-axis, two-wing, three-pole and multi-point” in the YREB. The cities along the Yangtze River, as key carriers, are playing an extremely important role in promoting the coordinated and high-quality development of the upper, middle and lower reaches of the Yangtze River, under the background of ecological priority and green development. To propel the development of these cities, special attention should be paid to inclusive growth, not only economic development: that is, extensive participation, efficiency improvement, outcomes sharing and environmental sustainability. In addition, since science and technology play a key role in the development and utilization of water resources and water pollution control, the innovative applications of scientific and technological achievements are especially required in such areas as industrial wastewater and urban sewage treatment and recycling, agricultural water pollution control, river basin water pollution governance and comprehensive management, water saving and unconventional water resources integration, drinking water safety, etc. In order to achieve effectiveness and fairness in water resources sustainable development, we must adhere to the guidelines of people-oriented, high-quality development, environmental friendliness, science and technology development and incorporate the three pillars of sustainable development: economy, society and environment, and technological innovation. Therefore, it is necessary to integrate the concept of inclusive growth and sustainable development into the research of urban water resources. To this end, a new concept of urban water inclusive sustainability (UWIS) is developed in this article.
Regarding the water resources of Yangtze River Economic Belt, scholars have conducted fruitful research. Most of the existing research focused on water resource efficiency [6] and carrying capacity [2,3,4], but less on the sustainability and coupling coordination of urban water resources in the YREB. The water sustainability of cities is affected by the interaction of economic, social, environmental and technological subsystems. However, there are few ways to measure the degree of interaction between subsystems in the water sustainability system, thus a suitable evaluation method is badly needed in this respect.
In addition, most predecessors conducted empirical research along a river basin or at the provincial level. The research focusing on water resources in the YREB is mostly undertaken in nine provinces and two municipalities, while the theoretical and empirical research from the city level is quite rare in this regard. Since the prefecture-level cities along the Yangtze River are major carriers for the development of a new pattern of “one-axis, two-wing, three-pole and multi-point”, it is valuable to conduct research at the level of cities.
Since the inclusive and sustainable development of water resources of cities in the Yangtze River Economic Belt is crucial, the following questions have arisen and are also puzzling water resources researchers and policymakers:
(1) How can inclusive sustainability of water resources be characterized at the prefecture-level city?
(2) How to measure inclusive sustainability of water resources of cities along the Yangtze River on the basis of the panel data of 38 cities from 2008 to 2018?
(3) How to reveal the coupling coordination effect between the five major subsystems and their temporal–spatial evolution trend?
(4) How to identify the key factors in the water resources, economic, social, environmental and scientific and technological subsystems that promote or hinder the inclusive sustainability of water resources of cities in the Yangtze River Economic Belt?
The layout of this article is as follows. In Section 2, we review the existing research literature. In Section 3, we develop a new concept of urban water inclusive sustainability (UWIS) and present a conceptual framework and indicator system. In Section 4, we discuss data and methodology for assessing UWIS. An intensive empirical study of 38 cities in the YREB is conducted in Section 5. The context includes measurement of UWIS using the TOPSIS (technique for order preference by similarity to ideal solution) and entropy method, temporal–spatial evolution analysis of the coupling coordination and identification of obstacle factors. Some discussions and conclusions are provided in the last section. We hope our findings will be a scientific reference for public decision makers to determine that, in the integral water management cycle, water resource management should be carried out under the paradigm of water inclusive sustainability.
2. Literature Review
Since the Asian Development Bank first proposed the concept of inclusive growth in 2007 [5], scholars at home and abroad have carried out a series of studies concerning it. Domestic and foreign literature is centered upon the connotation and measurement of inclusive growth [7,8], focusing on the relationships between different objects or factors, such as financial inclusiveness [9], land use inclusiveness [10], green inclusiveness [11], inclusive innovation performance [12], the relationship between agriculture, poverty, food and energy security and inclusive growth [13,14,15,16], growth path [17,18] and inclusive growth strategic plan [19], etc. They have constructed national or provincial evaluation systems of economic inclusive growth from three or four levels of economic growth sustainability, coordination, fairness and effectiveness [20]. Some of them have established an inclusive development triangle [21], the triangle of land use inclusiveness [10], and other analytical frameworks. For example, McKinley proposed four dimensions of inclusive growth: namely, economic infrastructure, capacity development, income equity and social security [8]. In particular, there are also the five pillars proposed by Garrido-Lecca and his colleagues, who began to take innovation and knowledge into consideration but somewhat missed out the contribution of scientific and technological progress and intergenerational equity [22].
Scholars have recently begun to dabble in inclusive economy, inclusive wealth, etc., regarding the research of inclusiveness and sustainability. For instance, Asongu and Odhiambo examined the relevance of inclusive development in modulating the role of governance on environmental degradation [23]; Kalkanci and his colleagues put forward an “inclusive innovation” approach to discuss sustainability [24]; Ikeda and Managi developed a framework for evaluating the sustainability of regions, predicting the inclusive wealth index (IWI) under different future scenarios from 2015 to 2100 [25]; Kurniawan and Managi explored that shared socioeconomic pathways with high investments in broad societal development are associated with the highest growth in inclusive wealth [26]; Siddiqi and Collins discussed how the emerging concept of inclusive innovation bridges dimensions of environment and social inclusivity [27]. Some scholars have designed indicators of circular economy as evaluating instruments for sustainability and efficiency in wastewater treatment [28,29].
Consequently, inclusive growth emphasizes people-oriented, fair and reasonable sharing of economic growth, while sustainable development focuses on the coordinated development of economy, society and environment. Thus, our study must be based on social inclusiveness, economic sustainability, environmental friendliness and technological innovation, which requires us to consider all the above aspects and incorporate them into the unified framework for research. For this purpose, in this article, we propose a new concept of inclusive sustainability to fully describe the inclusive sustainable development capacity of urban water resources.
Regarding the water resources of Yangtze River Economic Belt, scholars have conducted fruitful research, mainly exploring the water ecological footprint [30,31], utilization efficiency [32], green efficiency [33,34] and carrying capacity [35] of water resources. Lots of the research has focused on water resource efficiency [6] and carrying capacity [2,3,4], but little on sustainable use of water resources. Most of the indicators are based on the pressure–state–response (PSR) framework [36], less on indicators for scientific and technological innovation. Measurement is mainly performed using principal component analysis [37], improved analytic hierarchy process [38], fuzzy comprehensive evaluation [39,40], grey relational analysis [41], data envelopment analysis (DEA) [42], system dynamics [6,43], technique for order preference by similarity to ideal solution (TOPSIS) [35,44] and back propagation (BP) neural network [45]. However, there are few ways to measure the degree of interaction between subsystems in the water resources sustainability system, and most scholars have undertaken their research on water resources in the Yangtze River Economic Belt from nine provinces and two municipalities, while the research from the urban level is quite rare in this regard. Since the cities along the Yangtze River are major carriers for the development of a new pattern of “one-axis, two-wing, three-pole and multi-point”, it is valuable to conduct research at the level of cities. Due to the fact that the water inclusive sustainability system is characterized by complexity and ambiguity, and the interaction between various subsystems needs to be considered, it is necessary to find out a suitable method for evaluation.
As for the research on the coupling coordination of urban water resources, scholars have mostly conducted empirical research on two subsystems between water resources and economy [46], social economy [47,48], ecological environment [49], energy [50], land resources [51,52], population [53], urbanization [54,55], etc. Only a few studies have focused on three subsystems [56,57]. Few scholars have discussed the interaction and multiple coupling relationships between water resources and economy, society, environment, and science and technology systems [58,59]. In this article, we will take this as the starting point to carry out the research.
In this context, we attempt to develop the theoretical framework and indicator system to characterize UWIS at the prefecture-level city in the Yangtze River Economic Belt. The TOPSIS integrated entropy method is employed to measure UWIS on the basis of the panel data of 38 cities in the YREB from 2008 to 2018. The coupling coordination degree model is used to describe the trend of temporal–spatial evolution of the coupling coordination of the overall UWIS system and the five major subsystems. Key factors that promote or hinder UWIS in the YREB are identified through the obstacle degree model and solutions to the constraints are given. The results will offer suggestions for the Chinese government to enhance the level of UWIS in the YREB.
3. Conceptual Framework and Indicator System
From the perspectives of inclusiveness and sustainable development, integrating the three pillars of sustainable development: economy, society and environment, and technological innovation, a new concept of urban water inclusive sustainability (UWIS) is proposed by authors in this article. UWIS is defined as: under a certain scientific and technological and natural condition, urban residents, whether present or future generations, can obtain the water resources needed for their development in a timely, appropriate, fair and economic manner through rivers, lakes and reservoirs, while ensuring that water quality and ecological environment are not destroyed, thus achieving economic, social and environmental coordination and high quality development.
The inclusive sustainability of urban water resources is a complex system involving such subsystems as water resources, society, economy, environment, science and technology, etc. The new concept of “urban water inclusive sustainability” proposed in this article combines the ideas of water availability, economic sustainability, environmental friendliness, social inclusiveness and technological innovation. Based on the five pillars proposed by Garrido-Lecca and his colleagues, in this article we establish the conceptual framework of ASFII of urban water inclusive sustainability, including five dimensions of availability, sustainability, friendliness, inclusiveness and innovation (as shown in Figure 1).
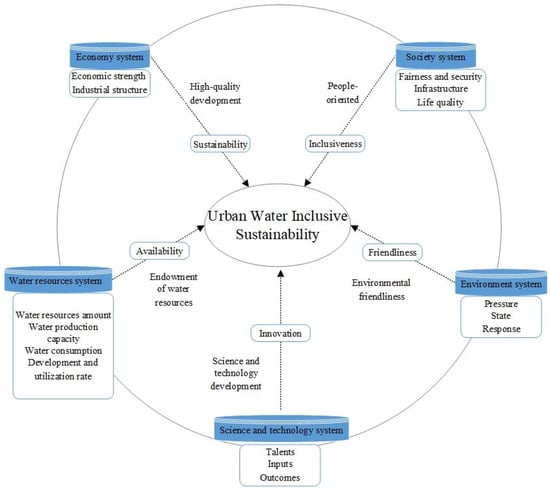
Figure 1.
The ASFII conceptual framework of urban water inclusive sustainability (UWIS).
In the conceptual framework of ASFII, “A” refers to availability, which indicates the endowment of water resources, characterized by water resources amount, water production capacity, water consumption, water development and utilization rate; “S” is sustainability, which reflects the high-quality development of the economy, involving economic strength and industrial structure; “F” symbolizes to friendliness, which indicates the friendly state of environment, characterized by pressure, state, and response; two “I” represent inclusiveness and innovation, respectively. Inclusiveness means that the social subsystem is people-oriented, focusing on fairness and security, infrastructure and life quality; and innovation describes the development of science and technology, characterized by talents, inputs and outcomes.
As explained above, UWIS is a new concept integrating the ideas of availability, sustainability, friendliness, inclusiveness and innovation of water resources, and stressing five perspectives of water resources endowment, high-quality development, environmental friendliness, people-oriented and science and technology development.
Based on the availability, sustainability, friendliness, inclusiveness and innovation (ASFII) conceptual framework, the key factors affecting UWIS are identified, and the corresponding evaluation indicators are selected accordingly (see Table 1), fully considering the drivers and constraints of UWIS, as well as the interaction between subsystems.

Table 1.
The indicator system of urban water inclusive sustainability (UWIS).
4. Data and Methodology
4.1. Sample and Data
The Yangtze River Economic Belt is an important national strategic development area in China. Covering nine provinces and two municipalities, the Yangtze River Economic Belt contains 41 cities. Considering the fact that the data of a few county-level cities such as Chaohu in Anhui Province, Shishou in Hubei Province and Shuifu in Yunnan Province are not available, the remaining 38 prefecture-level cities and above along the Yangtze River (see Figure 2) are selected as a sample for this research, covering the Yangtze River Delta urban agglomeration (YRDUA) (21 cities), the middle reaches of the Yangtze River urban agglomeration (MRYRUA) (12 cities) and the Chengdu–Chongqing urban agglomeration (CCUA) (5 cities). According to comprehensive competitiveness, the research sample is divided into four categories, which include 1 primary central city, 11 secondary central cities, 15 regional central cities and 11 general cities.
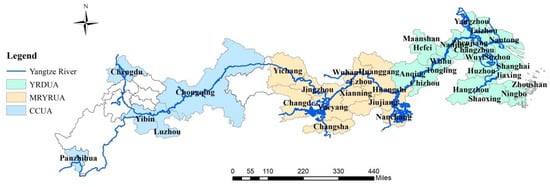
Figure 2.
The distribution map of sample cities in the Yangtze River Economic Belt.
Data are gathered from 38 cities in the Yangtze River Economic Belt from 2008 to 2018. The data were taken from “China City Statistical Yearbook (2009–2019)”, “China Environment Statistical Yearbook (2009–2019)”, “China City Construction Statistical Yearbook (2009–2019)”, statistical yearbooks of nine provinces and two municipalities in the Yangtze River Economic Belt (2009–2019), Water Resources Bulletin (2008–2018), City Statistical Yearbook (2009–2019), National Economic and Social Development Bulletin (2008–2018), etc. The indicator data were obtained by calculating some of the original data, and the default data were estimated by fitting.
4.2. Methodology
The UWIS measurement is a multi-criteria decision problem. From the literature review and existing research, it can be seen that the TOPSIS mainly judges the pros and cons of the alternative by calculating the Euclidean distance between each evaluation alternative and the positive and negative ideal alternative. It is suitable for multi-criteria decision problems. Different from the subjective weight determination method, the entropy method is often used to analyze the usefulness of information in decision-making problems through actual data. Therefore, the entropy method is a scientific and objective method for determining indicator weights, which is superior to the subjective weighting method. In this article, the TOPSIS and entropy method are employed to measure UWIS. We will use the entropy method to determine the weights of indicator and element levels. Since there are fewer dimensions at criterion level, the weight of criterion level is determined by the expert scoring method.
4.2.1. Entropy Method
The main steps of the entropy method [60] are as follows:
(1) Normalize the original data for positive, negative, moderate indicators, and use Formulas (1)–(4) for normalization, respectively.
For a positive indicator,
For a negative indicator,
For a moderate indicator,
where is the number of evaluated cities, and is the number of indicators.
In the Formulas (1)–(4), , and refer to the actual value, the normalized value and the median value of the indicator of the city, respectively, and and represent the maximum and minimum value of the indicator of all evaluated cities in a certain year.
(2) Calculate the characteristic proportion of each attribute value by using Formula (5).
(3) Calculate the entropy value of the indicator based on Formula (6).
If = 0, then define
(4) Calculate the coefficient of variance of the indicator according to Formula (7).
(5) Use the entropy value to calculate the weight of the indicator and obtain the weight set using the following Formulas (8) and (9):
4.2.2. TOPSIS
The main steps of TOPSIS [35] are as follows:
(1) Calculate the weighted normalized decision matrix by using Formula (10).
(2) Determine the positive ideal alternative and the negative ideal alternative on the basis of Formulas (11) and (12):
where
(3) Calculate the Euclidean distance and between each evaluation alternative and the positive and negative ideal alternative according to Formulas (13) and (14).
(4) Calculate relative closeness by using Formula (15).
4.2.3. Coupling Coordination Degree Model
The coupling degree is a measure of interaction between systems. The coupling degree model [61] is:
In Formula (16), is the coupling degree , is the development level (i.e., index) of the subsystem and is the number of subsystems. This study includes five subsystems: namely, water resources , economy , society , environment , and science and technology systems; that is, . In our study, , , , , and indicate availability, sustainability, friendliness, inclusiveness and innovation index, respectively. The Formula (17) is:
To further characterize the development level of the UWIS system and the level of interaction and coordination between the subsystems, the coupling coordination degree model is introduced on the basis of the coupling degree as follows [61]:
In Formula (18), is the comprehensive evaluation value reflecting the development level of the UWIS system; is the coupling coordination degree; are the weights of the criterion level, and . By inviting experts, scholars and managers from water resources planning and management departments in the field of water resources, we use the expert scoring method to obtain , respectively.
4.2.4. Obstacle Degree Model
In order to identify the key factors that promote or restrict the inclusive sustainability of urban water resources, the obstacle degree model [61] is adopted in this study:
In Formulas (19)–(21), is the weight of the indicator of the criterion level, is the weight of the criterion level where the indicator is located, refers to the normalized value of the indicator of the city, is the element contribution degree, is the indicator deviation degree and is the obstacle degree.
5. An Intensive Empirical Study
Based on the panel data of 38 cities in the Yangtze River Economic Belt from 2008 to 2018, the entropy method and expert scoring method are used to determine the weights. In light of the conceptual framework of ASFII and a five-dimensional indicator system for UWIS proposed in this article, TOPSIS is employed to measure UWIS and the five major development indexes of 38 cities in the YREB from 2008 to 2018. The characteristics of the temporal–spatial evolution of the coupling coordination of the overall UWIS system and the five major subsystems are described by the coupling coordination degree model. Key factors that promote or hinder UWIS in the YREB are identified through the obstacle degree model, so as to explore the changing trends and constraints of UWIS of the YREB, three major urban agglomerations and the cities involved.
5.1. Measurement of UWIS Based on the TOPSIS and Entropy Method
5.1.1. Measurement of UWIS
Firstly, based on the data of 38 cities in the Yangtze River Economic Belt from 2008 to 2018, the entropy method is used to calculate the weight of each indicator using Formulas (1)–(9) (see Appendix A).
Secondly, the weighted normalized decision matrix is given by Formula (10) so as to determine the positive and negative ideal solution and of the matrix by Formulas (11) and (12), as shown in Appendix A.
Finally, according to Formulas (13)–(15), the evaluation results of UWIS of 38 cities from 2008 to 2018 are obtained by calculating the Euclidean distance and between each city and the positive and negative ideal alternative, and by computing the relative closeness , as shown in Table 2, Figure 3.
Table 2.
The UWIS of 38 cities in the YREB based on the TOPSIS and entropy method (2008–2018).
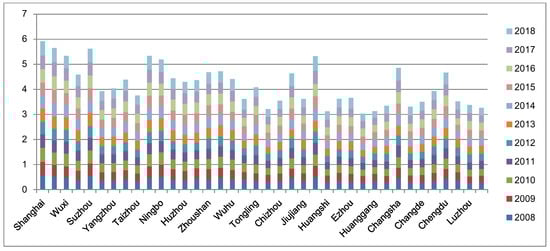
Figure 3.
The UWIS based on the TOPSIS and entropy method.
Considering the actual situation of this study, the classification of the levels of UWIS is determined as shown in Table 3.
Table 3.
Classification of urban water inclusive sustainability.
The results in Figure 3 showed that UWIS in the Yangtze River Economic Belt, though generally low and fluctuating, witnessed an upward trend from 2008 to 2018. In 2008, among 38 cities in the YREB, UWIS was at a medium level in 13 cities (accounting for 34.2%) and a lower level in 25 cities (accounting for 65.8%). In 2011, affected by severe drought and local floods in the Yangtze River basin, UWIS dropped to its lowest level in 2012, and the number of cities at a lower level increased to 29 (accounting for 76.3%). Compared with 2008, in 2018, 8 cities were elevated from a lower level to a medium level, and 20 cities were at a medium level (accounting for 52.6%), but there were still 18 cities at a lower level (accounting for 47.6%). It can be observed that the cities in the YREB are facing a rigorous situation in inclusive and sustainable development.
Within the three major urban agglomerations in the Yangtze River Economic Belt, the top 10 cities in UWIS are Shanghai, Nanjing, Wuxi, Suzhou, Hangzhou, Ningbo, Wuhan, Changsha, Nanchang and Hefei. Among them, six cities belong to the Yangtze River Delta urban agglomeration, and four belong to the middle reaches of Yangtze River urban agglomeration. The bottom 10 cities in UWIS are Anqing, Chizhou, Huangshi, Jingzhou, Huanggang, Xianning, Yueyang, Panzhihua, Luzhou and Yibin. Of them, two cities belong to the YRDUA, accounting for 9.5% in this area, five belong to the MRYRUA, accounting for 41.7% in this area and three belong to the CCUA, accounting for 60% in this area. Therefore, we ranked the three major urban agglomerations in terms of UWIS as follows: YRDUA, MRYRUA and CCUA. The UWIS of the primary and secondary central cities is significantly better than that of the regional central cities and general cities. This is mainly due to the fact that the primary and secondary central cities are located in the lower coastal areas of the YREB. In those areas, the vigorous governance of water resources and environment and a high level of economic development and urbanization all provide a driving force for UWIS in the YREB.
5.1.2. Measurement of the Five Major Development Indexes
From the perspective of each subsystem (as shown in Figure 4), among the five major development indexes, the average comprehensive development level from 2008 to 2018 in descending order is as follows: friendliness index (0.5855) > sustainability index (0.4470) > inclusiveness index (0.3366) > innovation index (0.2462) > availability index (0.1599).
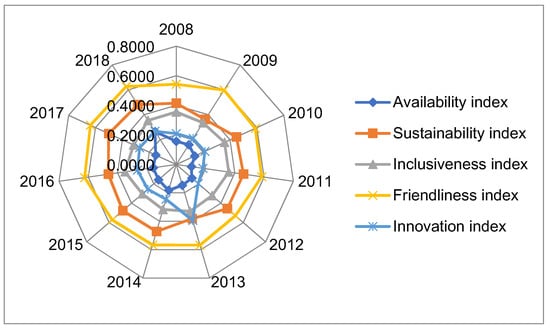
Figure 4.
Changes of the five major development indexes of cities in the YREB from 2008 to 2018.
As shown in Figure 5a, the availability index shows a fluctuating upward trend. From 2008 to 2011, it gradually declined at first, reaching its lowest point in 2011 and then began to rise. After a slight decrease in 2014, a significant surge was observed in 2018. The availability index ranks last among the five major development indexes and stays at the lowest level, indicating that the water resources endowment situation in the Yangtze River Economic Belt is severe. The availability index of cities in the YRDUA is generally higher than the average level of the YREB, while the MRYRUA’s and CCUA’s availability index are generally lower than the average level of the YREB. The availability index of the MRYRUA only surpassed the YREB in 2018, and even exceeded that of the YRDUA in that year.

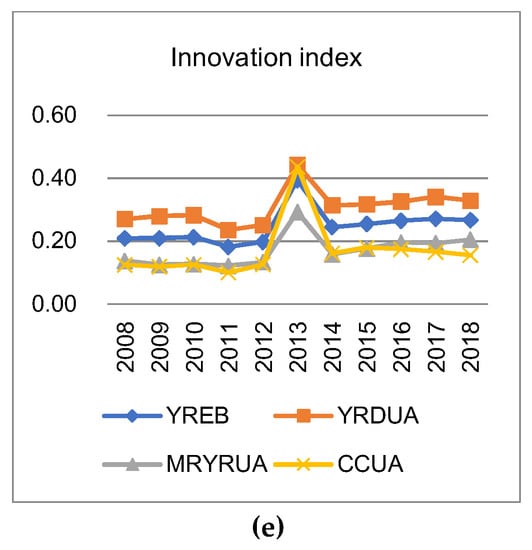
Figure 5.
Changes of the five major development indexes of the three major urban agglomerations from 2008 to 2018: (a) availability index; (b) sustainability index; (c) inclusiveness index; (d) friendliness index; (e) innovation index.
As seen in Figure 5b, the sustainability index shows a clear upward trend of volatility, staying at a medium level on the whole and ranking second among the five major development indexes. The sustainability index of the cities in the YRDUA is significantly higher than the average level of the YREB, while the sustainability index of the MRYRUA and the CCUA are relatively close and generally lower than the average level of the YREB.
From Figure 5c, the inclusiveness index shows decline at first and then rise, both in fluctuations. Among the five major development indexes, it ranks third and stays at a lower level. The inclusiveness index of the cities in the YRDUA is significantly higher than the average level of the YREB, while the inclusiveness index of the MRYRUA and the CCUA are relatively close and generally lower than the average level of the YREB.
As shown in Figure 5d, the trend of the friendliness index of the YREB and the three major urban agglomerations is basically the same, showing a slight upward tendency in fluctuations. Among the five major development indexes, it ranks first and stays at a medium level, indicating the government has made great efforts in water resources environmental governance and achieved initial success in implementing the “four waters and co-governance” model. However, it declined only in 2012. The friendliness index of the MRYRUA is higher than the average level of the YREB, while the CCUA’s and YRDUA’s friendliness indexes are slightly lower than the average level of the YREB.
The innovation index witnessed a fluctuating upward trend, reaching its peak in 2013 (see Figure 5e). It ranks fourth among the five major development indexes, staying at a lower level. The innovation index of the cities in the YRDUA is significantly higher than the average level of the YREB, while the MRYRUA’s and CCUA’s innovation indexes are relatively close, generally lower than the average level of the YREB. Only in 2013 was the innovation index of the CCUA above the average level and close to that of the YRDUA.
5.2. Analysis of Temporal–Spatial Evolution of Coupling Coordination
5.2.1. Analysis of Coupling Coordination Sequence
In order to further describe the temporal–spatial characteristics of the coupling coordination of the UWIS system in the Yangtze River Economic Belt, the coupling degree, coordination degree, and the coupling coordination degree of 38 cities from 2008 to 2018 are calculated according to Formulas (16)–(18), as shown in the Table 4.
Table 4.
The coupling degree (C), coordination degree (T) and coupling coordination degree (D) of the YREB and the three major urban agglomerations (2008–2018).
According to the current research, this study determines the classification of the coupling coordination degree as shown in Table 5.
Table 5.
Classification of coupling coordination degree (D).
From the perspective of the Yangtze River Economic Belt and the three major urban agglomerations (Table 4 and Table 5, Figure 6a–c), the UWIS system’s coupling coordination degree of 38 cities in the YREB from 2008 to 2018, to some extent, showed an upward trend on the whole. The overall coupling degree is high (>0.8) (except 0.7511 in 2011), the coordination degree is low (<0.4) and the coupling coordination degree is in a low coordination state (a mild coordination state only in 2011 (0.4898)). Among the three major urban agglomerations, the coupling coordination degree of the YRDUA is better than that of the MRYRUA and the CCUA, and the YRDUA is in a low-level coordination state, reaching a moderate coordination state in 2018 (0.6177). The MRYRUA is in a state of mild coordination, and it has improved obviously in 2018, reaching a state of low coordination; the CCUA has always been in a state of mild coordination.
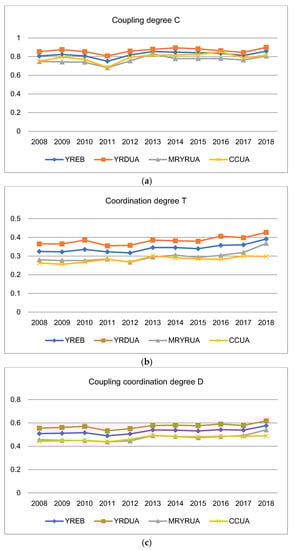
Figure 6.
The coupling degree (C), coordination degree (T) and coupling coordination degree (D) of the YREB and the three major urban agglomerations from 2008 to 2018: (a) coupling degree (C); (b) coordination degree (T); (c) coupling coordination degree (D).
Due to the large number of cities evaluated, the Spearman coefficient of rank correlation is introduced in this study in order to describe the changing trend of the coupling coordination degree of the UWIS’s system and each subsystem more explicitly. The calculation formula [61] is:
In Formula (22), is the coefficient of rank correlation, is the number of years (in this study, ), represents the serial number of the coupling coordination degree from low to high in 2008–2018, stands for the serial number in chronological order and is the difference between the two. From the related tables of statistics, when , at the confidence level of α=0.01, the critical value of the rank correlation coefficient test is , which means when , the changing trend is significant; when , the changing trend is not significant, and it can be initially judged whether it is an upward or downward trend based on the positive and negative of . Thus, the overall coupling coordination degree of 38 cities in the YREB and the coupling coordination degree of each subsystem were finally obtained, as shown in Figure 7.
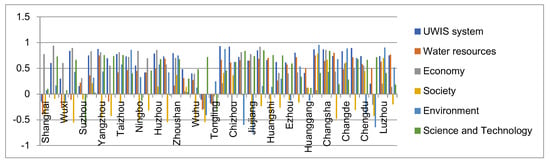
Figure 7.
The coefficient of rank correlation of coupling coordination degree of the UWIS system and each subsystem of 38 cities in the YREB.
From 38 cities in the Yangtze River Economic Belt, only three cities (Tongling, Shanghai and Maanshan) showed a downward trend in the coupling coordination degree of the overall UWIS system, while the remaining 35 cities witnessed an upward trend. The 13 cities with a significant upward tendency () are Anqing, Chizhou, Chongqing, Yangzhou, Xianning, Changsha, Wuhan, Changzhou, Changde, Jingzhou, Zhoushan, Huzhou and Taizhou, most of which are regional central cities in the YRDUA, secondary central cities and general cities in the MRYRUA and secondary central cities in the CCUA.
Among the five major subsystems of the UWIS system, the economy system has the highest coupling coordination degree, followed by the science and technology system, water resources system and environment system; the society system performed worst in this regard.
Among the 38 cities, 32 cities (more than 5/6) presented an upward or significant upward trend in the coupling coordination degree of the water resources system. The six cities with the highest coupling coordination degree are Yueyang (), Yibin (), Yangzhou (), Xianning (), Chongqing () and Jingzhou (), which are mainly located in the MRYRUA and the CCUA. Only six cities showed a downward trend in the coupling coordination degree of the water resource system, which are Shanghai (), Maanshan (), Wuxi (), Tongling (), Zhenjiang () and Changzhou (); all of them are located in the YRDUA. The average coupling coordination degree of the YRDUA is much lower than that of the CCUA and the MRYRUA. This is also the main reason for the low availability index in UWIS. In general, the three major urban agglomerations can be ranked as follows in terms of water resources coupling coordination degree: CCUA > MRYRUA > YRDUA. Therefore, the water resources coupling coordination capacity of the YRDUA should be strengthened.
Within the five major subsystems, the economy system has the highest degree of coupling coordination. The five cities of Tongling (), Chizhou (), Maanshan (), Panzhihua () and Huangshi () showed a downward trend in their coupling coordination degree, and among them Tongling showed a significant decline. The remaining 33 cities presented a climb. Of them, 12 cities including Nanjing, Wuhan, Changzhou, Huzhou, Changsha, Ningbo, Nantong, Yangzhou, Taizhou, Nanchang, Shanghai and Jiujiang were in a substantial upward tendency. The rise in the sustainability index of cities in the YREB is due to its strong economic coupling coordination capabilities, making it rank second among the five major development indexes, at a moderate level. Generally, the three major urban agglomerations can be ranked as follows in terms of economic coupling coordination degree: YRDUA > MRYRUA > CCUA. Therefore, the economic coupling coordination capacity of the CCUA should be enhanced.
Among the five major subsystems, the society system performed worst in coupling coordination degree. About two-thirds of the cities’ social coupling coordination degree showed a downward trend, covering all types of cities, such as primary and secondary central cities, regional central cities and general cities. Among them, the five cities with the lowest degree of social coupling coordination are Jiujiang (), Wuxi (), Changzhou (), Shaoxing () and Maanshan (), demonstrating an obvious descending trend. Only 13 cities (Xianning, Luzhou, Changsha, Changde, Chengdu, Nantong, Hangzhou, Huzhou, Zhoushan, Hefei, Anqing, Chizhou and Huanggang) presented a rising trend, of which Xianning showed an a substantial climb, and Luzhou, Changsha, Changde and Chengdu showed a marked climb. This also keeps the urban inclusiveness index of the YREB at a lower level. In general, the overall degree of social coupling coordination is in a downward trend: CCUA > MRYRUA > YRDUA. Therefore, the social coupling coordination capacity of the three major urban agglomerations in the YREB should be strengthened to improve the level of inclusiveness.
From the coupling coordination degree of the environment system, nearly one-third of the cities (11 cities) showed a downward trend. The five cities with the lowest degree of environmental coupling coordination are Jiujiang (), Panzhihua (), Nanchang (), Maanshan () and Chengdu (). All these five cities presented an obvious downward trend, and Jiujiang’s decline was the most significant, followed by Panzhihua, Nanchang and Maanshan. These cities are mainly located in the MRYRUA and the CCUA. More than two-thirds of the cities’ environmental coupling coordination degree is on a rise. Of them, the cities that performed highest in environmental coupling coordination degree are Xianning, Luzhou, Changde, Anqing and Hangzhou, which demonstrated a substantial climb. Overall, as regards the environmental coupling coordination degree, the three major urban agglomerations can be ranked as follows: YRDUA > CCUA > MRYRUA. Thus, special importance needs to be attached to improving the environmental coupling coordination capacity of the MRYRUA and the CCUA.
From the coupling coordination degree of the science and technology system, only four cities—Suzhou (), Tongling (), Ningbo (), and Shaoxing ()—showed a descending trend. Among them, Suzhou was in a sharp decline, and these cities are all located in the YRDUA; the remaining 34 cities showed an upward trend in the scientific and technological coupling coordination degree. Among these cities, Wuhan, Changsha, Nanchang, Huangshi, Yangzhou and Taizhou presented a substantial upward trend. Generally, the three major urban agglomerations can be ranked as follows in terms of scientific and technological coupling coordination degree: MRYRUA > CCUA > YRDUA. Therefore, the scientific and technological coupling coordination capacity of the YRDUA should be enhanced.
In summary, among the three major urban agglomerations, the YRDUA is relatively high in economic and environmental coupling coordination degree, while in social, water resources, and scientific and technological coupling coordination degree, it is relatively low; the MRYRUA is high in scientific and technological coupling coordination degree, but low in environmental and social coupling coordination degree, and its water resources and economic coupling coordination degree is at a moderate level. In comparison, the CCUA’s water resources and social coupling coordination degree is relatively high, its economic coupling coordination degree is low, and its environmental and scientific and technological coupling coordination degree is at a moderate level.
5.2.2. Analysis of Spatial Evolution Characteristics
To describe the spatial evolution characteristics of the coupling coordination of the various subsystems of 38 cities in the Yangtze River Economic Belt, three sample years of 2008, 2013 and 2018 were selected during the evaluation period, and the corresponding spatial distribution of coupling coordination degrees were drawn in Figure 8.
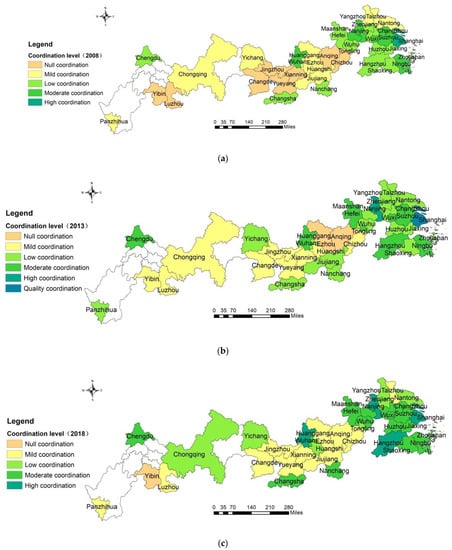
Figure 8.
The spatial distribution map of coupling coordination degree of 38 cities in the YREB in 2008, 2013 and 2018: (a) 2008; (b) 2013; (c) 2018. (Note: The blank areas in the figure are the unstudied regions).
From Figure 8a–c, it can be seen that, on the whole, the cities in the YREB presented the characteristic of evolving from mild and low coordination to moderate and high coordination. Their spatial evolution is characterized by being high in the east and low in the west, and the coupling coordination degree in the primary and secondary central cities is generally higher than that in the regional central cities and general cities.
In 2008, the urban coupling coordination degree of the CCUA in the western region of the YREB was basically in null and mild coordination; most of the cities in the central region of the MRYRUA were also in null and mild coordination, and only a few cities in this area were in the low and moderate coordination. Most cities in the eastern region of the YRDUA were in low to moderate coordination, while a few cities in this area were in null and mild coordination. By 2013, the three major urban agglomerations all witnessed an increase in the degree of coupling coordination. The cities in the YRDUA were generally at a low to moderate coordination level. The cities of Shanghai and Nanjing reached the level of quality coordination and high coordination. The cities located in the MRYRUA and the CCUA were mainly upgraded by one level.
By 2018, among the 21 cities in the YRDUA, the coupling coordination degree of Shanghai, Nanjing and Hangzhou climbed to a high level of coordination, and 11 cities including Suzhou stayed at a moderate level of coordination. The reasons for the YRDUA being at a higher level of coordination is that it contains megacities such as the municipality of Shanghai, the provincial capitals of Nanjing and Hangzhou, which are the core cities of the urban agglomeration with developed economies, complete social security and infrastructure, and vigorous environmental governance. The YRDUA is a pioneering area of national policies and a centralized area of high-quality resources, which leads to a high level of economic and environmental coupling coordination in this part. However, due to the low level of social coupling coordination of some cities such as Yangzhou and Taizhou, the degree of coupling coordination of water resources and science and technology are at a moderate level, making Yangzhou and the other four cities, and Taizhou and the other three cities still stay at a low level and mild coordination level, respectively.
Among the 12 cities in the MRYRUA, only Wuhan reached a high level of coordination in 2018. Wuhan, together with Shanghai and Chongqing, is one of the three core cities along the Yangtze River Golden Waterway. Its economic strength, social security, and scientific and technological development are comparatively advanced. Moreover, with a superior location, abundant water resources and a gathering of universities and talents, Wuhan has a more obvious radiative effect on improving the coordination level of other surrounding cities. The three cities of Nanchang, Changsha and Ezhou reached a moderate level of coordination. The remaining cities were at a low or mild level of coordination, owing to their insufficient environmental governance, incomplete infrastructure and inadequate social security, etc.
Compared with the YRDUA and the MRYRUA, the CCUA, although with two core megacities such as Chengdu and Chongqing, is relatively backward in development due to geographical restrictions. Among five cities in the CCUA, only Chengdu reached a moderate level of coordination in 2018, and the remaining four cities were in a state of low, mild coordination and even null coordination concerning the underdeveloped economy in the western region, the backward scientific and technological development, and the poor environmental governance. Although the CCUA reached a high level of water resources coupling coordination, its social coupling coordination was at a moderate level due to comparatively low economic development and slow development speed.
From the above spatial evolution analysis, the coupling coordination degree of the YRDUA surpasses that of the MRYRUA, while the CCUA is relatively weak in this regard.
5.3. Identification of Obstacle Factors
The Formulas (19)–(21) are used to calculate the obstacle degree of each indicator in 38 cities from 2008 to 2018, and then the mean values of the obstacle degree of each subsystem were obtained. The five subsystems can be ranked as follows in terms of obstacle degree: water resources > society > science and technology > economy > environment. The corresponding average obstacles degrees are 0.3048, 0.207, 0.1975, 0.1679 and 0.1228, respectively, as shown in Figure 9 and Figure 10. It can be observed that the main obstacle factors affecting UWIS in the Yangtze River Economic Belt are mainly from the subsystems of water resources, society, and science and technology. This is inseparable from the relatively high level of economic development and ecological priority initiatives.
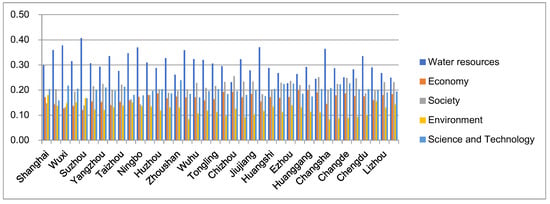
Figure 9.
The mean value of obstacle degree for each city in the YREB from 2008 to 2018.
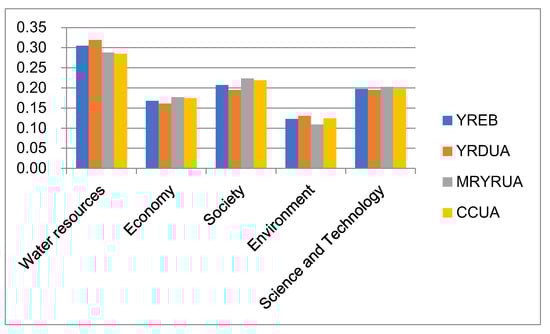
Figure 10.
The mean value of obstacle degree in the YREB and the three major urban agglomerations from 2008 to 2018.
5.3.1. Analysis of Obstacle Degree of the Indicators
The top one-third of the obstacle degree indicators is selected. The main obstacle factors of each subsystem are water resources utilization rate, rainfall depth and total water consumption per capita in the water resources system, drainage pipe length per 10,000 persons, rate of internet users in the society system, number of patents granted per 10,000 persons, college students per 10,000 persons, science and technology expenditure as a share of GDP in the science and technology system, GDP per capita, tertiary industry output value as a share of GDP, secondary industry output value as a share of GDP in the economy system and area of green land per capita in the environment system.
5.3.2. Analysis of Obstacle Degree in the Subsystems
From the distribution of the mean values of the obstacle degree in the city subsystem (see Figure 9), the top 10 obstacle factors in the water resources system mainly come from seven cities of the YRDUA, including Suzhou, Wuxi, Ningbo, Nanjing, Hefei, Hangzhou and Zhenjiang, the provincial capital cities of Wuhan and Changsha in the MRYRUA, and the provincial capital city of Chengdu in the CCUA. Obviously, the obstacle factors of the water resources system are primarily from provincial capital cities and secondary central cities, which, characterized by high living standards, are large in scale, population and water consumption per capita, and thus water resources development and utilization rate in those areas needs to be improved. Based on the obstacle degree of the water resources system, the three major urban agglomerations can be ranked in descending order as follows: YRDUA > MRYRUA > CCUA.
The top 10 obstacle factors in the society system generally come from Chizhou and Anqing in the YRDUA, Xianning, Changde, Ezhou, Jiujiang and Nanchang in the MRYRUA, and Chongqing, Yibin and Luzhou in the CCUA. It is obvious that obstacle factors in the society system are primarily from regional central cities and general cities (except Chongqing), and their social security and infrastructure are incomplete. In terms of the obstacle degree of the society system, the three major urban agglomerations can be ranked as follows: MRYRUA > CCUA > YRDUA.
The top 10 obstacle factors in the science and technology system mainly come from Zhoushan, Wuxi, Taizhou, Yangzhou and Changzhou in the YRDUA, and Changde, Ezhou, Yichang, Yueyang and Changsha in the MRYRUA. It is evident that the obstacle factors of science and technology system are primarily from regional central cities, followed by secondary central cities and general cities, whose talents and investment in science and technology are relatively insufficient. Based on the obstacle degree of the science and technology system, the three major urban agglomerations from high to low are MRYRUA > CCUA > YRDUA.
The top 10 obstacle factors in the economy system mainly come from Anqing, Chizhou and Huzhou in the YRDUA, Jingzhou, Huanggang, Xianning, Changde and Jiujiang in the MRYRUA, and Yibin and Luzhou in the CCUA. The obstacle factors of the economy system are generally from regional central cities and general cities, whose economic strength is not strong enough, and the industrial structure layout needs to be improved. Based on the obstacle degree of the economy system, the three major urban agglomerations in descending order are as follows: MRYRUA > CCUA > YRDUA.
The top 10 obstacle factors of environment system primarily come from seven cities, including Shanghai, Suzhou, Hangzhou, Changzhou, Wuxi, Taizhou and Nanjing in the YRDUA, Ezhou in the MRYRUA, and Panzhihua and Yibin in the CCUA. The obstacle factors of environment system are generally from primary and secondary central cities, and a few from central and general cities in the central and western regions. Due to the rapid economic development of the primary and secondary central cities, the heavy chemical industry has basically formed a pattern surrounding the river, involving five steel bases, seven oil refineries and a number of petrochemical bases. More than 400,000 chemical enterprises have gathered along the Yangtze River. The high energy consumption, high water consumption and pollution intensiveness have placed heavy pressure on the water environment and become a major obstacle factor. The regional central cities and general cities in the central and western regions are limited by their economic strength and poor water environment governance. Based on the obstacle degree of environment system, the three major urban agglomerations can be ranked as follows: YRDUA > CCUA > MRYRUA.
6. Discussions and Conclusions
6.1. Discussions
Based on the panel data of 38 cities in the Yangtze River Economic Belt from 2008 to 2018, the conceptual framework and a five-dimensional indicator system for UWIS proposed in this article are employed to measure UWIS using TOPSIS and the entropy method. It is found that UWIS in the YREB, though generally low and fluctuating, witnessed an upward trend from 2008 to 2018, staying at a lower to medium level. Among the three major urban agglomerations, UWIS from high to low is the YRDUA, MRYRUA, and CCUA. The UWIS of the primary and secondary central cities is obviously superior to that of regional central cities and general cities. The five major development indexes from 2008 to 2018 in descending order are friendliness index > sustainability index > inclusiveness index > innovation index > availability index.
From the analysis of temporal characteristics, the coupling coordination degree of the UWIS system for the 38 cities from 2008 to 2018 in the YREB, to some extent, has presented an upward trend on the whole, staying at a low level of coordination. Among the three major urban agglomerations, the coupling coordination degree of the YRDUA preceded that of the MRYRUA and CCUA, remaining at a low level of coordination and reaching a moderate coordination level in 2018; the MRYRUA was at a mild coordination level and went up the level of low coordination in 2018, while the CCUA has always been at the level of mild coordination.
The degree of coupling coordination of the five subsystems from high to low is as follows: economy system, science and technology system, water resource system, environment system and society system. From the perspective of the three major urban agglomerations, their coupling coordination in descending order is YRDUA > MRYRUA > CCUA. Among them, the YRDUA has relatively strong degrees of economic and environmental coupling coordination, while the YRDUA is relatively weak in the degrees of social, water resources, and scientific and technological coupling coordination; the MRYRUA has a strong degree of scientific and technological coupling coordination, weak degrees of environmental and social coupling coordination, and moderate degrees of water resource and economic coupling coordination; the CCUA is relatively strong in the degrees of water resources and social coupling coordination, weak in the degree of economic coupling coordination, and moderate in the degrees of scientific and technological and environmental coupling coordination.
From the spatial differentiation analysis, the cities in the YREB on the whole showed the characteristics of evolving from mild and low coordination to moderate and high coordination, and their spatial evolution is characterized by being high in the east and low in the west. Among them, the degree of coupling coordination of primary and secondary central cities is generally higher than that of regional central cities and general cities. The degree of coupling coordination of the YRDUA is superior to that of the MRYRUA, while the CCUA performs relatively weak in this regard.
The analysis of obstacle factors proved that the obstacle degree of each subsystem in descending order is as follows: water resources > society > science and technology > economy > environment system. The main obstacle factors come from 12 factors, such as the water resources utilization rate, drainage pipe length per 10,000 persons, etc. The three major urban agglomerations can be ranked as follows in terms of the obstacle degree of water resources system: YRDUA > MRYRUA > CCUA; MRYRUA > CCUA > YRDUA in terms of the obstacle degree of society, science and technology and economy system; and YRDUA > CCUA > MRYRUA in terms of the obstacle degree of environment system.
In response to the above evaluation results of UWIS, coupling coordination degree and obstacle degree, this study proposes the following suggestions to improve the urban water inclusive sustainability in the Yangtze River Economic Belt and the coupling coordination level of various subsystems.
The firstly is to improve urban water availability and scientific and technological innovation in the YREB.
The government should increase investment in the research and development of technologies for the efficient development and utilization of water resources, focusing on comprehensive water saving, the development and utilization of unconventional water resources, and the governance of rivers and lakes, and the technology and equipment patents of water resources in order to promote the transformation and application of scientific and technological achievements and tap into the potential of water resources. The total water consumption per capita is reduced by popularizing water-saving technologies and the recycling use of water resources. Through technological innovation, enterprises should improve the sewage treatment rate and the comprehensive development and utilization efficiency of water resources. Scientific research institutions are supposed to rely on scientific and technological progress to seek new and succeed resources of water. To summarize, the availability of water resources will be further improved by means of systematic planning, efficient development and reasonable utilization.
The second is to enhance the inclusiveness of urban water resources in the YREB and the level of coupling coordination of society system.
The government ought to further strengthen the construction of water resources infrastructure, such as urban water pipe networks, sewage treatment systems, etc., so as to extend the length of drainage pipes owned by 10,000 persons, which will enable urban residents to obtain the water resources they need in a timely, appropriate, fair and economical manner. Internet companies need to accelerate the construction of broadband networks across cities, mobile communication networks and broadband wireless access networks in order to further expand the ratio of Internet users, reinforce the information linkage between cities in the YREB and share information resources, thus realizing the high quality economic development and the coordinated development of society.
The third is to facilitate the coupling coordination of urban water environment in the YREB.
The government should improve the water environment, optimize the industrial structure, strictly control the discharge of industrial wastewater from cities along the Yangtze River and raise the rate of sewage under centralized treatment. On the basis of further maintaining and increasing the proportion of water, in rivers, lakes and reservoirs, superior to Class III water in quality throughout the year, and raising the rate of key water functional zones up to standard, the government is supposed to carry out a solid promotion of the construction of forest cities, expand urban greening renovation projects, restore urban natural ecology and increase the green coverage rate in built-up area and the area of green land per capita. Urban housing and urban–rural construction departments should add investment into highway greening to build a greenway system. Water conservancy departments should build multi-level and various green ecological channels.
From the perspective of the three major urban agglomerations, the Yangtze River Delta urban agglomeration is one of the most vigorous and open regions in China, energized in science and technology, education and innovation. As a guiding development zone for the YREB and an important intersection of the “One Belt and One Road” and the Yangtze River Economic Belt, it has a pivotal strategic position in promoting the high-quality development of other cities. The UWIS of the YRDUA is at a lower to medium level, with low degree of coordination. The obstacle factors are mainly from water resources and environment systems. Due to the developed economy and a huge population, the pressure on water resources and the environment has increased. Therefore, efforts should be made to remove the barriers in water resources and environment systems, and special attention needs to be paid to enhance the coupling coordination of society, water resources, and science and technology.
Shanghai needs to be taken as the leader to drive the coordinated development of surrounding cities in inclusive sustainable development of the YRDUA. In accordance with the requirement of “water saving priority”, we will exert the YRDUA’s advantages in science and technology, education and innovation, and actively propel the construction of water saving and conservation projects such as irrigation area reconstruction, rainwater and flood resource utilization, and seawater desalination, so as to solve the problem of water shortage and ensure the safety of drinking water. The government ought to strengthen the protection of drinking water sources and establish a mutual water supply system from rivers, reservoirs and seawater desalination. Meanwhile, the total amount and efficiency of water consumption and the pollution red lines of water functional zones must be scientifically decided. Moreover, an inclusive and sharing system needs to be established to facilitate the water resources of the YRDUA toward inclusive and sustainable development.
Owing to the golden waterway of the Yangtze River, the urban agglomeration in the middle reaches of the Yangtze River is superior in transportation. As a pioneering area for new urbanization in the central and western regions and a demonstration zone for inland opening and cooperation, the MRYRUA has been an important new economic growth pole in China, playing a leading and radiative role in the development of the western region. The UWIS in the MRYRUA is at a lower to medium level, staying at a mild coordination level. The obstacle factors mainly come from the society, science and technology, and economy systems. Therefore, efforts should be made to remove the obstacles in the society, science and technology, and economy systems, and the focus should be mainly placed on the improvement of the environmental and social coupling coordination.
Specifically, it is important to make full use of Wuhan’s advantages in science, education and industry to promote the transformation of technological achievement in water pollution governance; to further improve the coordination mechanism for joint prevention and governance of water pollution in the MRYRUA; to strictly control the development of heavy water consumption and polluting industries at the sources of rivers and drinking water protection zones; to optimize the industrial structure and implement the clean transformation of such heavy water consumption and polluting industries such as petrochemicals, non-ferrous metals, papermaking and printing; and to strengthen the comprehensive treatment and ecological restoration of the water environment.
Simultaneously, it is important to establish a compensation mechanism for water environment and ecological protection between cities, enhance the cooperation and linkage with the regions of the Yangtze River Delta and Chengdu–Chongqing to promote the coordinated development of the upper, middle and lower reaches of the Yangtze River. Moreover, the government should strengthen the interconnection of infrastructure, jointly construct a water conservancy infrastructure system and build an inclusive and sustainable water resources guarantee system focusing on river governance, water source engineering, irrigation engineering and recycled water utilization. Efforts will be made to increase the urban sewage treatment rate, step up the use of recycled water and start projects of high-quality water resources development and utilization. Furthermore, it is important to establish the monitoring and early warning mechanisms for water resources and water environment and to promote the coordination between the inclusive and sustainable economic and social development and carrying capacity of water resources and environment.
As an important platform for the development of the western region, the Chengdu–Chongqing urban agglomeration has obvious geographical advantages. The CCUA is not only a major demonstration area in the nation to accelerate new urbanization, but also a strategic hub to jointly develop the Yangtze River Economic Belt and the Silk Road Economic Belt. It has been China’s new economic growth pole. The UWIS of the CCUA is at a lower to medium level, staying at a mild coordination level. The obstacle factors are mainly from the society, science and technology, economy and environment systems. Although Chengdu and Chongqing, the two core cities, are playing a leading role in the regional development, they are not strong enough in radiation to drive the entire region. This is specifically reflected in the underdevelopment of regional central cities and general cities, the low level of infrastructure interconnection and the incomplete coordinated development mechanism. Therefore, the government should make more efforts to remove the obstacles in the society, science and technology, economy and environment systems, emphasizing the improvement of the economic coupling coordination.
Since the problem of inclusive and sustainable development of water resources in the Chengdu–Chongqing urban agglomeration is prominent, it is urgent to integrate the five perspectives of resource endowment, high-quality development, environmental friendliness, people-oriented and science and technology development into the sustainable development of water resources in the CCUA in order to ensure the coordinated development of economic development, environmental protection, technological innovation, infrastructure construction and social security.
The first is to facilitate the construction of major water storage, water lifting and water transfer projects across regions and establish a mutual supply system for waters in rivers and reservoirs.
The second is to set up a strict water resources management system, to make sure the regulations on the amount and efficiency of water consumption and pollution red lines of water function zones are followed, to strengthen ecological protection and restoration along the river, to promote the joint efforts in water ecology protection and water environment governance and to introduce multiple governance models to improve the coordination mechanism between the upper and lower reaches of the Yangtze River.
The third is to propel the construction of water resources scheduling, water quality and quantity supervision, water resources and water environment monitoring and early warning information platforms, actively promote the network coverage of urban agglomerations and increase the ratio of Internet users.
The fourth is to make full use of the advantages of the innovative resources of Chongqing and Chengdu as national innovative cities to drive the construction of regional central cities (Luzhou, Yibin) and general cities (Panzhihua), to improve the population and economic agglomeration capacity, to create a green ecological corridor along the river, so as to realize the inclusive and sustainable development of water resources in Chengdu-Chongqing urban agglomeration, to take advantage of the abundant water resources in the upper reaches of the Yangtze River, to optimize the layout of industries along the river and accelerate the industrial transformation and upgrading with a focus being placed on strengthening innovation drive protecting the water resources environment and consolidating the industry foundation, to enhance the population and economic agglomeration capacity and to create a green ecological corridor along the river so as to realize the inclusive and sustainable development of water resources in the CCUA.
6.2. Conclusions
In this article, we firstly proposed a new concept of urban water inclusive sustainability (UWIS), which expands the connotation of water resource efficiency and carrying capacity. We also developed the ASFII conceptual framework and a five-dimensional indicator system of UWIS, integrating availability, sustainability, friendliness, inclusiveness and innovation, which can be applied to comprehensively and scientifically measure UWIS at the level of cities and river basins as well as provinces.
Unlike the predecessors who only focused on a specific river basin or provinces, the uniqueness of this article lies in applying the data covering the length of 11 years and expanding the scope of research to all prefecture-level cities along the Yangtze River of YREB in China’s national strategic basin. Moreover, empirical studies were carried out to measure UWIS and five development indexes by using the panel data of 38 cities in the YREB. The characteristics of temporal–spatial evolution of the coupling coordination are described, and key factors that hinder UWIS are identified. The results indicate that, from 2008 to 2018, the overall UWIS of the YREB shows a gradual upward trend, at a relatively weak to medium level, and the indexes are ranked as follows: friendliness > sustainability > inclusiveness > innovation > availability. The 38 cities are in a low-level coordination, and their temporal characteristics show the following trend: economy > science and technology > water resources > environment > society system. The spatial differentiation is manifested as high in the east and low in the west. Twelve factors, such as the water resources utilization rate, are observed as main obstacles. The findings in this article will be helpful for future academic research, for they not only offer suggestions to the cities along the Yangtze River in promoting coordinated and high-quality development of the upper, middle and lower reaches of the Yangtze River under the background of ecological priority and green development, but are also a valuable reference and empirical case for the sustainable use and coordinated development of urban water resources in other river basins.
Therefore, this research provides a new concept, framework and indicator system for UWIS measurement. The concept integrates quite successfully the three pillars of traditional sustainability: economy, society and environment, while also incorporating the idea of inclusive growth and highlighting the important role of scientific and technological progress. It concludes that the inclusive and sustainable development of water resources must adhere to the guidelines of people-oriented, high-quality development, environmental friendliness, and science and technology development. This is in compliance with the 2015–2030 global development goals established by the United Nations Summit in 2015. Overall, this article is innovative in incorporating the concepts of urban water inclusiveness and sustainability, which can help public decision makers to determine that, in the integral water management cycle, water resource management should be carried out under the paradigm of water inclusive sustainability, and more specifically, help the Chinese government track UWIS and ensure urban water resources security in the YREB.
As is known, integrated water management is a vital resource for achieving the objectives of sustainable development and improving the life quality of citizens. The new concept, framework and indicator system proposed in this article require further empirical research.
This research was carried out along the prefecture-level cities in the Yangtze River Economic Belt. Due to the large number of the cities involved and the data covering the length of 11 years, we spent a lot of time and made great efforts to collect data, yet a few statistics are not available for some cities (such as the proportion of the added value of high-tech industries in GDP, etc.), especially the data reflecting the development of science and technology of water resources. We recommend relevant departments of statistics to fill these gaps in data in order to further improve our study in the future.
Author Contributions
Conceptualization, S.G. and J.Y.; framework and indicator system, S.G.; data processing, S.G.; methodology; S.G. and J.Y.; empirical study, S.G.; writing—original draft, S.G.; writing—review and editing, all authors; supervision, H.G.; funding acquisition, H.G. and J.Y. All authors have read and agreed to the published version of the manuscript.
Funding
This research was funded by (1) The National Natural Science Foundation of China (Grant Ref 72074198, (2) Fundamental Research Funds for the Central Universities, China University of Geosciences (Wuhan)(Grant Ref G1323541816), and (3) Key Projects of Open Fund of Mineral Resource Strategy and Policy Research Center of China University of Geosciences (WUHAN), Resources Environmental Economic Research Center of China University of Geosciences (WUHAN) (Grant Ref H2018006A).
Institutional Review Board Statement
Not applicable.
Informed Consent Statement
Not applicable.
Data Availability Statement
The data presented in this study are available and can be found from statistical yearbooks and bulletins. The source of data was described in Section 4.1.
Conflicts of Interest
The authors declare no conflict of interest.
Appendix A
Table A1.
Weights of entropy method for each indicator, the positive and negative solutions of the evaluation objects.
Table A1.
Weights of entropy method for each indicator, the positive and negative solutions of the evaluation objects.
| W1 | W2 | W3 | W4 | W5 | W6 | W7 | W8 | Ec1 | Ec2 | Ec3 | Ec4 | ||
| 2008 | 0.2405 | 0.1310 | 0.2733 | 0.1062 | 0.249 | 0.4371 | 0.5629 | 1 | 0.6932 | 0.3068 | 0.5245 | 0.4755 | |
| 0.2405 | 0.1310 | 0.2733 | 0.1062 | 0.249 | 0.4371 | 0.5629 | 1 | 0.6932 | 0.3068 | 0.5245 | 0.4755 | ||
| 0 | 0 | 0 | 0 | 0 | 0 | 0 | 0 | 0 | 0 | 0 | 0 | ||
| 2009 | 0.2147 | 0.0696 | 0.0558 | 0.0397 | 0.6201 | 0.3161 | 0.6839 | 1 | 0.7838 | 0.2162 | 0.4842 | 0.5158 | |
| 0.2147 | 0.0696 | 0.0558 | 0.0397 | 0.6201 | 0.3161 | 0.6839 | 1 | 0.7838 | 0.2162 | 0.4842 | 0.5158 | ||
| 0 | 0 | 0 | 0 | 0 | 0 | 0 | 0 | 0 | 0 | 0 | 0 | ||
| 2010 | 0.1772 | 0.1186 | 0.0987 | 0.0971 | 0.5084 | 0.4284 | 0.5716 | 1 | 0.661 | 0.339 | 0.4994 | 0.5006 | |
| 0.1772 | 0.1186 | 0.0987 | 0.0971 | 0.5084 | 0.4284 | 0.5716 | 1 | 0.661 | 0.339 | 0.4994 | 0.5006 | ||
| 0 | 0 | 0 | 0 | 0 | 0 | 0 | 0 | 0 | 0 | 0 | 0 | ||
| 2011 | 0.1266 | 0.1003 | 0.0677 | 0.0899 | 0.6155 | 0.5732 | 0.4268 | 1 | 0.6988 | 0.3012 | 0.4665 | 0.5335 | |
| 0.1266 | 0.1003 | 0.0677 | 0.0899 | 0.6155 | 0.5732 | 0.4268 | 1 | 0.6988 | 0.3012 | 0.4665 | 0.5335 | ||
| 0 | 0 | 0 | 0 | 0 | 0 | 0 | 0 | 0 | 0 | 0 | 0 | ||
| 2012 | 0.1632 | 0.0955 | 0.0686 | 0.0554 | 0.6173 | 0.6482 | 0.3518 | 1 | 0.6737 | 0.3263 | 0.5012 | 0.4988 | |
| 0.1632 | 0.0955 | 0.0686 | 0.0554 | 0.6173 | 0.6482 | 0.3518 | 1 | 0.6737 | 0.3263 | 0.5012 | 0.4988 | ||
| 0 | 0 | 0 | 0 | 0 | 0 | 0 | 0 | 0 | 0 | 0 | 0 | ||
| 2013 | 0.2354 | 0.1946 | 0.1333 | 0.118 | 0.3187 | 0.5673 | 0.4327 | 1 | 0.7587 | 0.2413 | 0.4429 | 0.5571 | |
| 0.2354 | 0.1946 | 0.1333 | 0.118 | 0.3187 | 0.5673 | 0.4327 | 1 | 0.7587 | 0.2413 | 0.4429 | 0.5571 | ||
| 0 | 0 | 0 | 0 | 0 | 0 | 0 | 0 | 0 | 0 | 0 | 0 | ||
| 2014 | 0.2955 | 0.1234 | 0.1221 | 0.1161 | 0.3429 | 0.573 | 0.427 | 1 | 0.6916 | 0.3084 | 0.6915 | 0.3085 | |
| 0.2955 | 0.1234 | 0.1221 | 0.1161 | 0.3429 | 0.573 | 0.427 | 1 | 0.6916 | 0.3084 | 0.6915 | 0.3085 | ||
| 0 | 0 | 0 | 0 | 0 | 0 | 0 | 0 | 0 | 0 | 0 | 0 | ||
| 2015 | 0.1567 | 0.1058 | 0.0642 | 0.0944 | 0.5789 | 0.6456 | 0.3544 | 1 | 0.7322 | 0.2678 | 0.3857 | 0.6143 | |
| 0.1567 | 0.1058 | 0.0642 | 0.0944 | 0.5789 | 0.6456 | 0.3544 | 1 | 0.7322 | 0.2678 | 0.3857 | 0.6143 | ||
| 0 | 0 | 0 | 0 | 0 | 0 | 0 | 0 | 0 | 0 | 0 | 0 | ||
| 2016 | 0.2488 | 0.1281 | 0.1636 | 0.068 | 0.3916 | 0.7821 | 0.2179 | 1 | 0.708 | 0.292 | 0.3929 | 0.6071 | |
| 0.2488 | 0.1281 | 0.1636 | 0.068 | 0.3916 | 0.7821 | 0.2179 | 1 | 0.708 | 0.292 | 0.3929 | 0.6071 | ||
| 0 | 0 | 0 | 0 | 0 | 0 | 0 | 0 | 0 | 0 | 0 | 0 | ||
| 2017 | 0.2043 | 0.1121 | 0.4461 | 0.066 | 0.1717 | 0.4681 | 0.5319 | 1 | 0.7483 | 0.2517 | 0.3528 | 0.6472 | |
| 0.2043 | 0.1121 | 0.4461 | 0.066 | 0.1717 | 0.4681 | 0.5319 | 1 | 0.7483 | 0.2517 | 0.3528 | 0.6472 | ||
| 0 | 0 | 0 | 0 | 0 | 0 | 0 | 0 | 0 | 0 | 0 | 0 | ||
| 2018 | 0.2881 | 0.1273 | 0.1752 | 0.1625 | 0.247 | 0.5218 | 0.4782 | 1 | 0.7573 | 0.2427 | 0.3173 | 0.6827 | |
| 0.2881 | 0.1273 | 0.1752 | 0.1625 | 0.247 | 0.5218 | 0.4782 | 1 | 0.7573 | 0.2427 | 0.3173 | 0.6827 | ||
| 0 | 0 | 0 | 0 | 0 | 0 | 0 | 0 | 0 | 0 | 0 | 0 | ||
| S1 | S2 | S3 | S4 | S5 | S6 | S7 | S8 | S9 | S10 | En1 | En2 | ||
| 2008 | 0.3039 | 0.1395 | 0.1962 | 0.3605 | 0.6047 | 0.3953 | 0.0848 | 0.1742 | 0.0866 | 0.6545 | 0.7388 | 0.1267 | |
| 0.3039 | 0.1395 | 0.1962 | 0.3605 | 0.6047 | 0.3953 | 0.0848 | 0.1742 | 0.0866 | 0.6545 | 0.7388 | 0.1267 | ||
| 0 | 0 | 0 | 0 | 0 | 0 | 0 | 0 | 0 | 0 | 0 | 0 | ||
| 2009 | 0.2638 | 0.1485 | 0.2577 | 0.33 | 0.5798 | 0.4202 | 0.0482 | 0.4402 | 0.0391 | 0.4724 | 0.6382 | 0.2251 | |
| 0.2638 | 0.1485 | 0.2577 | 0.33 | 0.5798 | 0.4202 | 0.0482 | 0.4402 | 0.0391 | 0.4724 | 0.6382 | 0.2251 | ||
| 0 | 0 | 0 | 0 | 0 | 0 | 0 | 0 | 0 | 0 | 0 | 0 | ||
| 2010 | 0.2561 | 0.1235 | 0.2457 | 0.3747 | 0.5359 | 0.4641 | 0.0688 | 0.4329 | 0.1765 | 0.3218 | 0.478 | 0.2119 | |
| 0.2561 | 0.1235 | 0.2457 | 0.3747 | 0.5359 | 0.4641 | 0.0688 | 0.4329 | 0.1765 | 0.3218 | 0.478 | 0.2119 | ||
| 0 | 0 | 0 | 0 | 0 | 0 | 0 | 0 | 0 | 0 | 0 | 0 | ||
| 2011 | 0.248 | 0.0571 | 0.3374 | 0.3575 | 0.5492 | 0.4508 | 0.1691 | 0.2434 | 0.055 | 0.5325 | 0.4675 | 0.2928 | |
| 0.248 | 0.0571 | 0.3374 | 0.3575 | 0.5492 | 0.4508 | 0.1691 | 0.2434 | 0.055 | 0.5325 | 0.4675 | 0.2928 | ||
| 0 | 0 | 0 | 0 | 0 | 0 | 0 | 0 | 0 | 0 | 0 | 0 | ||
| 2012 | 0.2512 | 0.0654 | 0.3034 | 0.38 | 0.652 | 0.348 | 0.0854 | 0.2449 | 0.2191 | 0.4505 | 0.6284 | 0.2187 | |
| 0.2512 | 0.0654 | 0.3034 | 0.38 | 0.652 | 0.348 | 0.0854 | 0.2449 | 0.2191 | 0.4505 | 0.6284 | 0.2187 | ||
| 0 | 0 | 0 | 0 | 0 | 0 | 0 | 0 | 0 | 0 | 0 | 0 | ||
| 2013 | 0.292 | 0.0572 | 0.301 | 0.3499 | 0.5752 | 0.4248 | 0.0755 | 0.2555 | 0.1715 | 0.4975 | 0.5133 | 0.2058 | |
| 0.292 | 0.0572 | 0.301 | 0.3499 | 0.5752 | 0.4248 | 0.0755 | 0.2555 | 0.1715 | 0.4975 | 0.5133 | 0.2058 | ||
| 0 | 0 | 0 | 0 | 0 | 0 | 0 | 0 | 0 | 0 | 0 | 0 | ||
| 2014 | 0.2997 | 0.0805 | 0.2903 | 0.3295 | 0.5384 | 0.4616 | 0.0369 | 0.2801 | 0.1296 | 0.5534 | 0.4687 | 0.1821 | |
| 0.2997 | 0.0805 | 0.2903 | 0.3295 | 0.5384 | 0.4616 | 0.0369 | 0.2801 | 0.1296 | 0.5534 | 0.4687 | 0.1821 | ||
| 0 | 0 | 0 | 0 | 0 | 0 | 0 | 0 | 0 | 0 | 0 | 0 | ||
| 2015 | 0.2483 | 0.1573 | 0.2422 | 0.3522 | 0.6336 | 0.3664 | 0.0546 | 0.2869 | 0.1247 | 0.5337 | 0.2922 | 0.3929 | |
| 0.2483 | 0.1573 | 0.2422 | 0.3522 | 0.6336 | 0.3664 | 0.0546 | 0.2869 | 0.1247 | 0.5337 | 0.2922 | 0.3929 | ||
| 0 | 0 | 0 | 0 | 0 | 0 | 0 | 0 | 0 | 0 | 0 | 0 | ||
| 2016 | 0.3384 | 0.0521 | 0.1513 | 0.4583 | 0.5332 | 0.4668 | 0.0718 | 0.376 | 0.0607 | 0.4915 | 0.2513 | 0.2801 | |
| 0.3384 | 0.0521 | 0.1513 | 0.4583 | 0.5332 | 0.4668 | 0.0718 | 0.376 | 0.0607 | 0.4915 | 0.2513 | 0.2801 | ||
| 0 | 0 | 0 | 0 | 0 | 0 | 0 | 0 | 0 | 0 | 0 | 0 | ||
| 2017 | 0.2754 | 0.0488 | 0.3641 | 0.3117 | 0.5776 | 0.4224 | 0.053 | 0.371 | 0.077 | 0.4989 | 0.3745 | 0.2148 | |
| 0.2754 | 0.0488 | 0.3641 | 0.3117 | 0.5776 | 0.4224 | 0.053 | 0.371 | 0.077 | 0.4989 | 0.3745 | 0.2148 | ||
| 0 | 0 | 0 | 0 | 0 | 0 | 0 | 0 | 0 | 0 | 0 | 0 | ||
| 2018 | 0.2358 | 0.0831 | 0.3197 | 0.3614 | 0.4775 | 0.5225 | 0.0474 | 0.3528 | 0.2251 | 0.3747 | 0.5137 | 0.1651 | |
| 0.2358 | 0.0831 | 0.3197 | 0.3614 | 0.4775 | 0.5225 | 0.0474 | 0.3528 | 0.2251 | 0.3747 | 0.5137 | 0.1651 | ||
| 0 | 0 | 0 | 0 | 0 | 0 | 0 | 0 | 0 | 0 | 0 | 0 | ||
| En3 | En4 | En5 | En6 | En7 | En8 | En9 | En10 | T1 | T2 | T3 | T4 | ||
| 2008 | 0.1345 | 0.2326 | 0.1817 | 0.2535 | 0.3323 | 0.3956 | 0.2418 | 0.3626 | 1 | 0.5219 | 0.4781 | 1 | |
| 0.1345 | 0.2326 | 0.1817 | 0.2535 | 0.3323 | 0.3956 | 0.2418 | 0.3626 | 1 | 0.5219 | 0.4781 | 1 | ||
| 0 | 0 | 0 | 0 | 0 | 0 | 0 | 0 | 0 | 0 | 0 | 0 | ||
| 2009 | 0.1368 | 0.3729 | 0.103 | 0.2206 | 0.3035 | 0.4232 | 0.3738 | 0.203 | 1 | 0.5794 | 0.4206 | 1 | |
| 0.1368 | 0.3729 | 0.103 | 0.2206 | 0.3035 | 0.4232 | 0.3738 | 0.203 | 1 | 0.5794 | 0.4206 | 1 | ||
| 0 | 0 | 0 | 0 | 0 | 0 | 0 | 0 | 0 | 0 | 0 | 0 | ||
| 2010 | 0.3102 | 0.2491 | 0.1091 | 0.1693 | 0.4725 | 0.3525 | 0.3816 | 0.2659 | 1 | 0.4691 | 0.5309 | 1 | |
| 0.3102 | 0.2491 | 0.1091 | 0.1693 | 0.4725 | 0.3525 | 0.3816 | 0.2659 | 1 | 0.4691 | 0.5309 | 1 | ||
| 0 | 0 | 0 | 0 | 0 | 0 | 0 | 0 | 0 | 0 | 0 | 0 | ||
| 2011 | 0.2397 | 0.3026 | 0.0705 | 0.241 | 0.3859 | 0.3869 | 0.4144 | 0.1986 | 1 | 0.3988 | 0.6012 | 1 | |
| 0.2397 | 0.3026 | 0.0705 | 0.241 | 0.3859 | 0.3869 | 0.4144 | 0.1986 | 1 | 0.3988 | 0.6012 | 1 | ||
| 0 | 0 | 0 | 0 | 0 | 0 | 0 | 0 | 0 | 0 | 0 | 0 | ||
| 2012 | 0.1529 | 0.2548 | 0.0799 | 0.178 | 0.4873 | 0.2723 | 0.2081 | 0.5197 | 1 | 0.5343 | 0.4657 | 1 | |
| 0.1529 | 0.2548 | 0.0799 | 0.178 | 0.4873 | 0.2723 | 0.2081 | 0.5197 | 1 | 0.5343 | 0.4657 | 1 | ||
| 0 | 0 | 0 | 0 | 0 | 0 | 0 | 0 | 0 | 0 | 0 | 0 | ||
| 2013 | 0.2809 | 0.3041 | 0.0918 | 0.1614 | 0.4427 | 0.3877 | 0.2269 | 0.3853 | 1 | 0.3916 | 0.6084 | 1 | |
| 0.2809 | 0.3041 | 0.0918 | 0.1614 | 0.4427 | 0.3877 | 0.2269 | 0.3853 | 1 | 0.3916 | 0.6084 | 1 | ||
| 0 | 0 | 0 | 0 | 0 | 0 | 0 | 0 | 0 | 0 | 0 | 0 | ||
| 2014 | 0.3492 | 0.3387 | 0.1219 | 0.1967 | 0.3427 | 0.2856 | 0.3034 | 0.411 | 1 | 0.5439 | 0.4561 | 1 | |
| 0.3492 | 0.3387 | 0.1219 | 0.1967 | 0.3427 | 0.2856 | 0.3034 | 0.411 | 1 | 0.5439 | 0.4561 | 1 | ||
| 0 | 0 | 0 | 0 | 0 | 0 | 0 | 0 | 0 | 0 | 0 | 0 | ||
| 2015 | 0.3149 | 0.345 | 0.0852 | 0.1739 | 0.3959 | 0.3485 | 0.2293 | 0.4221 | 1 | 0.6569 | 0.3431 | 1 | |
| 0.3149 | 0.345 | 0.0852 | 0.1739 | 0.3959 | 0.3485 | 0.2293 | 0.4221 | 1 | 0.6569 | 0.3431 | 1 | ||
| 0 | 0 | 0 | 0 | 0 | 0 | 0 | 0 | 0 | 0 | 0 | 0 | ||
| 2016 | 0.4686 | 0.3191 | 0.2463 | 0.1489 | 0.2856 | 0.4073 | 0.2146 | 0.3781 | 1 | 0.5049 | 0.4951 | 1 | |
| 0.4686 | 0.3191 | 0.2463 | 0.1489 | 0.2856 | 0.4073 | 0.2146 | 0.3781 | 1 | 0.5049 | 0.4951 | 1 | ||
| 0 | 0 | 0 | 0 | 0 | 0 | 0 | 0 | 0 | 0 | 0 | 0 | ||
| 2017 | 0.4107 | 0.4177 | 0.2456 | 0.0816 | 0.2551 | 0.2172 | 0.2663 | 0.5165 | 1 | 0.3143 | 0.6857 | 1 | |
| 0.4107 | 0.4177 | 0.2456 | 0.0816 | 0.2551 | 0.2172 | 0.2663 | 0.5165 | 1 | 0.3143 | 0.6857 | 1 | ||
| 0 | 0 | 0 | 0 | 0 | 0 | 0 | 0 | 0 | 0 | 0 | 0 | ||
| 2018 | 0.3211 | 0.3343 | 0.1976 | 0.1268 | 0.3412 | 0.2323 | 0.1912 | 0.5765 | 1 | 0.2431 | 0.7569 | 1 | |
| 0.3211 | 0.3343 | 0.1976 | 0.1268 | 0.3412 | 0.2323 | 0.1912 | 0.5765 | 1 | 0.2431 | 0.7569 | 1 | ||
| 0 | 0 | 0 | 0 | 0 | 0 | 0 | 0 | 0 | 0 | 0 | 0 |
References
- Wang, Z.; Zhang, L. Research on problems and protection countermeasures of utilization of water resources in the Yangtze River Economic Belt. China Water Resour. 2018, 11, 1–3. [Google Scholar] [CrossRef]
- Dang, L.; Xu, Y. Review of research progress in carrying capacity of water resources. Res. Soil Water Conserv. 2015, 22, 341–348. [Google Scholar] [CrossRef]
- Wang, J.; Zhai, Z.; Sang, X.; Li, H. Study on index system and judgment criterion of water resources carrying capacity. J. Hydraul. Eng. 2017, 48, 1023–1029. [Google Scholar] [CrossRef]
- Zhang, J.; Li, L.; Zhang, Y.; Liu, Y.; Ma, W.; Zhang, Z. Using a fuzzy approach to assess adaptive capacity for urban water resources. Int. J. Environ. Sci. Technol. 2018, 16, 1571–1580. [Google Scholar] [CrossRef]
- Sakai, K.; MacCormac, C.; Hattor, S.; Senapaty, M.; Tulasidhar, V.B. Strategy 2020: The Long-Term Strategic Framework of the Asian Development Bank 2008-2020; Asian Development Bank: Mandaluyong City, Philippines, 2008. [Google Scholar]
- Wang, H.; Zhang, J.; Zeng, W. Intelligent simulation of aquatic environment economic policy coupled ABM and SD models. ScTEn 2018, 618, 1160–1172. [Google Scholar] [CrossRef]
- Klasen, S. Measuring and Monitoring Inclusive Growth: Multiple Definitions, Open Questions, and Some Constructive Proposals. ADB Sustainable Development Working Paper Series 12; Asian Development Bank: Mandaluyong City, Philippines, 2010; pp. 1–14. Available online: http://hdl.handle.net/11540/1404 (accessed on 1 June 2010).
- McKinley, T. Inclusive Growth Criteria and Indicators: An Inclusive Growth Index for Diagnosis of Country Progress. ADB Sustainable Development Working Paper Series 14; Asian Development Bank: Mandaluyong City, Philippines, 2010; pp. 1–44. Available online: http://hdl.handle.net/11540/1405 (accessed on 1 June 2010).
- Zhu, D.; Ren, L.; Liu, Y. Financial inclusive development, economic growth and carbon emissions in China. China Popul. Resour. Environ. 2018, 28, 66–76. [Google Scholar] [CrossRef]
- Ji, Z. Inclusiveness evaluation and pressure analysis for land use. China Univ. Geosci. 2015. Available online: http://202.114.202.219/rwt/CNKI/https/NNYHGLUDN3WXTLUPMW4A/kns/brief/default_result.aspx.2015.05.01 (accessed on 1 November 2020).
- Li, Z.; Liu, K. The map of China green-inclusive development and the analysis of impact mechanism. J. Xi’an Jiaotong Univ. 2018, 38, 48–59. [Google Scholar] [CrossRef]
- Gao, T.; Liu, Y.; Zhou, J. The measurement of China’s regional inclusive innovation performance: Theoretical model and its empirical verification. Stud. Sci. Sci. 2014, 32, 592, 613–621. [Google Scholar] [CrossRef]
- Dev, S.M. Inclusive Growth in India Agriculture, Poverty, and Human Development; Mahendra, D.S., Ed.; OUP: New Delhi, India, 2008; pp. 2–30. [Google Scholar] [CrossRef]
- Gunatilake, H.M.; Abeygunawardena, P. Energy Security, Food Security, and Economics of Sugarcane Bioethanol in India; Asian Development Bank: Mandaluyong City, Philippines, 2011; pp. 2–30. [Google Scholar] [CrossRef]
- Bergh, G.; Melamed, C. Inclusive Growth and a Post-2015 Framework; ODI: London, UK, 2012; pp. 1–9. [Google Scholar]
- Sahoo, P. Insights into inclusive growth, employment and well-being in India. J. Asia Pac. Econ. 2014, 19, 522–524. [Google Scholar] [CrossRef]
- Tunis, T. African 50 Years’ Time-The Road towards Inclusive Growth: The Road towards Inclusive Growth; Asian Development Bank: Mandaluyong City, Philippines, 2011; pp. 3–71. [Google Scholar]
- Tsokhas, K. Poverty, inequality, and inclusive growth in Asia: Measurement, policy issues, and country studies. J. Contemp. 2013, 43, 201–205. [Google Scholar] [CrossRef]
- International Development Research Centre. Supporting Inclusive Growth Program Prospectus for 2011–2016; IDRC: Ottawa, ON, Canada, 2010; pp. 1–18. [Google Scholar]
- Yu, M.; Wang, X. China’s inclusive growth: Measurement and evaluation. Econ. Rev. 2012, 30–38. [Google Scholar] [CrossRef]
- Di, Y. Connotation, measurement and strategy of China’s inclusive development. Inq. Econ. Issues 2016, 2, 16–27. [Google Scholar]
- Garrido-Lecca, J.; Mayolo, C.; Chiquillán, R.; Morillo, M. Proposal for an Inclusive Development Framework. Available online: https://xueshu.baidu.com/usercenter/paper/show?paperid=87885b4187eb0ada476e258676bdd0d1&site=xueshu_se (accessed on 1 November 2020).
- Asongu, S.A.; Odhiambo, N.M. Inclusive development in environmental sustainability in sub-Saharan Africa: Insights from governance mechanisms. Sustain. Dev. 2019, 27, 713–724. [Google Scholar] [CrossRef]
- Kalkanci, B.; Rahmani, M.; Toktay, L.B. The role of inclusive innovation in promoting social sustainability. Prod. Oper. Manag. 2019, 28, 2960–2982. [Google Scholar] [CrossRef]
- Ikeda, S.; Managi, S. Future inclusive wealth and human well-being in regional Japan: Projections of sustainability indices based on shared socioeconomic pathways. Sustain. Sci. 2019, 14, 147–158. [Google Scholar] [CrossRef]
- Kurniawan, R.; Managi, S. Measuring long-term sustainability with shared socioeconomic pathways using an inclusive wealth framework. Sustain. Dev. 2018, 26, 596–605. [Google Scholar] [CrossRef]
- Siddiqi, A.; Collins, R.D. Sociotechnical systems and sustainability: Current and future perspectives for inclusive development. Curr. Oper. Environ. Sustain. 2017, 24, 7–13. [Google Scholar] [CrossRef]
- Molina-Moreno, V.; Leyva-Díaz, J.C.; Llorens-Montes, F.J.; Cortés-García, F.J. Design of indicators of circular economy as instruments for the evaluation of sustainability and efficiency in wastewater from pig farming industry. Water 2017, 9, 653. [Google Scholar] [CrossRef]
- Argudo-García, J.J.; Molina-Moreno, V.; Leyva-Díaz, J.C. Valorization of sludge from drinking water treatment plants. A commitment to circular economy and sustainability. Dyna 2017, 92, 71–75. [Google Scholar] [CrossRef]
- Jin, C.; Deng, R.; Liu, Y.; Ren, B.; Xiao, H. Research for spatio-temporal analysis and prediction of water resource ecological footprint in Yangtze River Economic Belt. J. Water Resour. Water Eng. 2018, 29, 59–66. [Google Scholar] [CrossRef]
- Dai, D.; Sun, M.; Xu, X.; Lei, K. Assessment of the water resource carrying capacity based on the ecological footprint: A case study in Zhangjiakou city. North China. Env. Sci. Pollut. Res. 2019, 26, 11000–11011. [Google Scholar] [CrossRef]
- Liu, G.; Wu, R.; Wang, H.; Huang, J. Spatial variability analysis of water resources utilization efficiency under water footprint perspective—Case study in Yangtze river economic belt. Soft Sci. 2018, 226, 107–111, 118. [Google Scholar] [CrossRef]
- Sun, C.; Jiang, K.; Zhao, L. Measurement of green efficiency of water utilization and its spatial pattern in China. J. Nat. Resour. 2017, 32, 1999–2011. [Google Scholar] [CrossRef]
- Yang, G.; Xie, Q. Study on spatial and temporal differentiation of green water resources efficiency in the Yangtze River Economic Belt. Resour. Environ. Yangtze Basin 2019, 28, 349–358. [Google Scholar] [CrossRef]
- He, G.; Xia, Y.; Qin, Y.; Zhu, Y.; Wang, W. Evaluation and spatial-temporal dynamic change of water resources carrying capacity in the Yangtze River economic belt. Res. Soil Water Conserv. 2019, 26, 287–292, 300. [Google Scholar] [CrossRef]
- Chen, H.; Li, Q. Assessment and analysis on the water resource vulnerability in arid zone based on the PSR model. Adv. Mat. Res. 2014, 955, 3757–3760. [Google Scholar] [CrossRef]
- Liu, C.; Wang, R.; Zhang, X.; Cheng, C.; Huan, S.; Yu, H. Comparative Analysis of Water Resources Carrying Capacity Based on Principal Component Analysis in Beijing-Tianjin-Hebei Region from the Perspective of Urbanization. AIP Conf. Proc. 2017, 1794, 1551–1556. [Google Scholar] [CrossRef]
- Minatour, Y.; Bonakdari, H.; Aliakbarkhani, Z.S. Extension of fuzzy delphi AHP based on interval-valued fuzzy sets and its application in water resource rating problems. Water Resour. Manag. 2016, 30, 3123–3141. [Google Scholar] [CrossRef]
- Li, G.; Jin, C. Fuzzy comprehensive evaluation for carrying capacity of regional water resources. Water Resour. Manag. 2009, 23, 2505–2513. [Google Scholar] [CrossRef]
- Zhao, Q.; Li, X.; Gao, Q.; Zhu, M. Evaluation of Water Resources Carrying Capacity in Shandong Province Based on Fuzzy Comprehensive Evaluation. E3S Web Conf. 2018, 38. [Google Scholar] [CrossRef]
- Gu, H.; Xu, J. Grey relational model based on AHP weight for evaluating groundwater resources carrying capacity of irrigation district. Int. Symp. Water Resour. Environ. Prot. 2011, 308–310. [Google Scholar] [CrossRef]
- Lu, X.; Xu, C. Study the utilization efficiency of water resources in Yangtze River Economic Belt based on three-stage DEA and Malmquist index decomposition. Resour. Environ. Yangtze Basin 2017, 26, 7–14. [Google Scholar] [CrossRef]
- Dong, Q.; Zhang, X.; Chen, Y.; Fang, D. Dynamic management of a water resources-socioeconomic-environmental system based on feedbacks using system dynamics. Water Resour. Manag. 2019, 33, 2093–2108. [Google Scholar] [CrossRef]
- Xing, Z.; Fu, Q.; Liu, D.; Yi, J. Application of EW-TOPSIS model in water resources sustainable utilization evaluation. Adv. Sci. Lett. 2013, 19, 2744–2746. [Google Scholar] [CrossRef]
- Jin, J.; Wei, Y.; Liu, L.; Zou, L.; Zhang, W.; Zhou, Y. Forewarning of sustainable utilization of regional water resources: A model based on BP neural network and set pair analysis. Nat. Hazards 2012, 62, 115–127. [Google Scholar] [CrossRef]
- Wei, Y.; Wei, J.; Western, A.W. Evolution of the societal value of water resources for economic development versus environmental sustainability in Australia from 1843 to 2011. Glob. Environ. Chang. 2017, 42, 82–92. [Google Scholar] [CrossRef]
- Hao, C.; Jia, Y.; Niu, C.; Liang, L. Research on driving mechanism of socio-economic factors for water cycle. Adv. Mater. Res. 2014, 955, 3011–3014. [Google Scholar] [CrossRef]
- Cui, D.; Chen, X.; Xue, Y.; Li, R.; Zeng, W. An integrated approach to investigate the relationship of coupling coordination between social economy and water environment on urban scale-A case study of Kunming. J. Environ. Manag. 2019, 234, 189–199. [Google Scholar] [CrossRef]
- Qiao, G.; Xu, Y.; He, F. Influence on water resource and eco-environment system of Tongguan gold mine area by mining development projects. Adv. Mater. Res. 2012, 518, 5059–5062. [Google Scholar] [CrossRef]
- Bi, B.; Chen, D.; Deng, P.; Zhang, D.; Zhu, L.; Zhang, P. The evolutionary characteristics analysis of coupling and coordination of regional water-energy-food. China Rural Water Hydropower 2018, 2, 72–77. [Google Scholar] [CrossRef]
- Danielson, L.E. Coupling of land and water systems. J. Am. Water Resour. Assoc. 1976, 12, 182–183. [Google Scholar] [CrossRef]
- Pan, Y.; Si, X.; Jin, M.; Xie, J. Optimal Allocation of Coupling about Water and Land Resources in the Process of Urbanization; ICEEG: Guangzhou, China, 2010; pp. 4244–4247. [Google Scholar] [CrossRef]
- Bellin, A.; Majone, B.; Cainelli, O.; Alberici, D.; Villa, F. A continuous coupled hydrological and water resources management model. Environ. Model Softw. 2016, 75, 176–192. [Google Scholar] [CrossRef]
- Cui, X.; Fang, C.; Li, J.; Liu, H.; Zhang, Q. Progress in dynamic simulation modeling of urbanization and ecological environment coupling. Prog. Geogr. 2019, 38, 111–125. [Google Scholar] [CrossRef]
- Zhang, K.; Shen, J.; He, R.; Fan, B.; Han, H. Dynamic analysis of the coupling coordination relationship between urbanization and water resource security and its obstacle factor. Int. J. Public Health 2019, 16, 4765. [Google Scholar] [CrossRef]
- Biggs, E.M.; Bruce, E.; Boruff, B.; Duncan, J.M.; Horsley, J.; Pauli, N.; McNeill, K.; Neef, A.; Van Ogtrop, F.; Curnow, J.; et al. Sustainable development and the water-energy-food nexus: A perspective on livelihoods. Environ. Sci. Policy 2015, 54, 389–397. [Google Scholar] [CrossRef]
- Jiang, L.; Bo, L.; Wu, Y. Coupling and coordinating degrees of provincial economy, resources and environment in China. J. Nat. Resour. 2017, 32, 788–799. [Google Scholar] [CrossRef]
- Raghupathi, V.; Raghupathi, W. Innovation at country-level: Association between economic development and patents. J. Innov. Entrep. 2017, 6, 1–20. [Google Scholar] [CrossRef]
- Wu, M.; Zhao, M.; Wu, Z. Evaluation of development level and economic contribution ratio of science and technology innovation in eastern China. Technol. Soc. 2019, 59, 101194–101201. [Google Scholar] [CrossRef]
- Tang, Z. An integrated approach to evaluating the coupling coordination between tourism and the environment. Tour. Manag. 2015, 46, 11–19. [Google Scholar] [CrossRef]
- Guo, J.; Yu, J.; He, Y.; Jiang, L.; Zhang, Z. Spatio-temporal analysis and obstacle diagnosis on water resources coordination in the middle reaches of Yangtze river. Hubei Agric. Sci. 2020, 59, 92–98. [Google Scholar] [CrossRef]


Publisher’s Note: MDPI stays neutral with regard to jurisdictional claims in published maps and institutional affiliations. |
© 2021 by the authors. Licensee MDPI, Basel, Switzerland. This article is an open access article distributed under the terms and conditions of the Creative Commons Attribution (CC BY) license (http://creativecommons.org/licenses/by/4.0/).