1. Introduction
Since the signing of the treaty during the United Nations COP21 meeting in Paris by 174 nations in 2015, the target of limiting global warming to well below 2 degrees versus pre-industrial levels by 2050 has moved up on the agenda. Institutional investors are under increasing pressure from governments, regulators and other stakeholders to contribute to this goal. We believe the listed real estate sector in particular could play a substantial role in achieving these aspirations, as real estate accounts for well over 30 percent of all greenhouse gas emissions. Ancillary and related activities such as infrastructure requirements arising from real estate add to this number, making the built environment the key source of greenhouse gas emissions. Furthermore, pension funds and other investors are looking for investment opportunities through which they can make a positive contribution to societal challenges. Large institutional investors have on average allocated 8 percent of their assets to real estate and are likely to further increase their allocation in the years ahead—see [
1] for a full review of pension fund investments in real estate. Among the options of institutional investors to reach this allocation, publicly listed real estate investment firms are an attractive way of achieving this, as positions can be built quickly and without requiring large adjustments to the knowledge base in terms of trading and portfolio management. Contrary to other implementation forms, the listed market offers the opportunity to instantaneously achieve a full investment, whereas it would take a large amount of time to replicate this otherwise. However, this does require product availability. At the start of 2020, investors had the choice between over 800 publicly listed real estate investment firms to invest with globally, varying widely in portfolio size, focus and investment strategies.
During the selection process, investors are considering and screening for specific features that align with both their financial aims and their purpose. A wide range of environmental, social and corporate governance (ESG) metrics have become available to investors. These are metrics that can help them select investments that fit best with both their financial as well as their non-financial corporate aspirations and ambitions. However, an objective discussion and evaluation of the available ESG metrics in the listed real estate market is still largely missing. There is little evidence on the interlink between the variety of ESG metrics and financial performance in the public real estate market. For equities in general, reports show that ESG metrics between different providers of data do not correlate highly, suggesting that there are different interpretations of ESG attributes. It is therefore interesting to look at one specific sector with a material and comparable exposure to ESG risks to explore the financial materiality in terms of stock performance. This can help investors to see how the initial additional costs of ESG investments can be recovered in addressing the long-term risk of unsustainable stranded real estate assets. Due to a lack of evidence, opinions continue to differ about the net effect of ESG in real estate performance. Given the urgency of the ESG themes, it is crucial that empirical evidence is added to these opinions.
Thus far, the academic literature on public real estate has focused on the hypothesized relationship between energy efficiency (as part of the broader ESG) and real estate asset performance. The bulk of the research on the asset level is aimed at the commercial private real estate sector, which arguably represents a more efficient market with more rational agents (see Eichholtz et al., 2010). In contrast, portfolio level analysis on the sustainability within the real estate sector is confined to a few papers in the finance literature. In particular, since data availability on the subject has grown tremendously in recent years, the literature is becoming dated quite quickly and warrants further investigation. Another aspect of interest is that most of the available literature is based on the U.S. Real Estate Investment Trust (REIT) market, whereas internationally the requirements in terms of transparency and reporting on ESG move at different speeds. [
2] studied the U.S. REIT market and discussed the link between energy efficiency and the sustainability of assets and the operating and stock performance of publicly listed REITs. Their study used building certification systems (e.g., Leadership in Energy and Environmental Design (LEED) and Energy Star) as a proxy for the greenness of a building. On the basis of this, they provided evidence that suggests that the level of greenness of the portfolio is positively correlated with three operating performance metrics, i.e., return on assets, returns on equity and the ratio of funds from operations to total revenues. Besides the operating performance, greener REITs also performed better in terms of stock performance.
In this paper, we broaden the analysis by focusing on ESG instead of environmental sustainability. Secondly, we revert to an international sample. We examine the unique database that underlies the newest ESG metric for European public real estate—the European Public Real Estate Association’s (EPRA) Sustainability Best Practices Recommendations (sBPR). Our results show that both ESG completeness and ESG performance covary across firms. In other words, firms that score high on ESG completeness also tend to score higher than average on ESG performance. We also find that both ESG scores are higher for the larger firms in our sample, and among the sBPR gold award winners. Our return regressions offer evidence for a positive and significant return effects for ESG completeness and ESG performance, especially regarding the ESG aspects energy and greenhouse gasses. Furthermore, ESG completeness also increases returns regarding energy certification, social impact and governance scores. The more firms report on these matters, the better their subsequent stock returns turn out. Moreover, in our final analysis, we find evidence of a sustainable premium as investors are willing to accept a reduction in returns when they can choose to invest in companies with better sustainable ratings (sBPR).
We contribute to the literature by converting detailed firm level ESG data into objective measures for ESG transparency and ESG performance, tailored to the public real estate market. We start our analysis with a clear expose on EPRA’s sBPR data, after we review the most relevant literature on ESG and ESG measurement. We then introduce and present the ESG metrics that we construct using the sBPR data, and we discuss the variation in these ESG scores within the European listed real estate market. The effects of these ESG scores on public real estate financial performance are studied both directly and indirectly through the sBPR ratings, and the most important results and their implications are summarized in our conclusions.
2. Literature Review
ESG refers to the three key factors for measuring the non-financial impact of a company. Including the impact on the environment and society at large into financial decisions has a long history, dating back to the 1950s and 1960s, when pension funds recognized the opportunity to affect their social environment using their capital assets, starting with smaller and more targeted initiatives such as affordable housing, and later extending into more ethical issues such as the condemnation of South African apartheid. Today, ESG has evolved into a wide collection of aims and goals, and at the same time a vast variety of means and manners have emerged to incorporate these issues into the investment process.
In the corporate finance literature, there have been various studies identifying the added value of ESG integration into financial decision-making. According to [
3], companies with good ESG scores perform better in terms of operations and are also considered less risky. [
4] also studied the impact of ESG issues in firm performance, especially in the case of engaging companies to improve their ESG scores via investor activism and reported evidence that active increases in ESG scores have been associated with enhanced operational performance. Regarding the link between ESG scores and stock returns, the literature is less conclusive. On the one hand, ESG criteria can reduce the investment universe and thereby increase the risk of ESG frontrunners. ESG efforts also introduce additional information and screening costs into the investment selection process. Costs have a clear footprint in the short-term profit and loss account, while many of the benefits of ESG practices are intangible, difficult to quantify, and materialize only in the longer term [
5]. Long-term benefits should eventually also result in superior stock returns. An earlier study by [
6] evaluated both the short- and long-term stock returns of US firms, using KLD Research & Analytics (from now on KLD) – a provider of environmental, social and governance (ESG) research and indexes for institutional investors – to distinguish between leaders and laggards. Their results show that while in the short term, low-scoring ESG firms outperformed, this return pattern does not persist in the longer run. In other words, enforcing high ESG standards may well weaken stock returns initially, but in the long run, these return differences vanish as high-ranking ESG firms tend to catch up. This result could be attributed to a learning curve of both the firm and the investor community. Moreover, a more recent study by [
7] found compelling evidence for a sample of Eurostoxx50 firms, suggesting that the stock return appreciation for ESG excellence has grown steadily over time.
The lack of conclusive academic evidence on ESG scores and stock returns may well be due to ongoing debates on ESG measurement. The number of ESG rating providers has grown exponentially. A recent analysis of the rate-the-raters-survey [
8] showed that the number of ESG rating providers increased five-fold from 2012 to 600 by the end of 2018. Rating providers often like to distinguish themselves by using self-developed criteria and weights for ESG factors. This situation translates into visible and hidden risks when relying only on one ESG rating provider for investment decisions. This is illustrated by research by [
9] on alternative weighting schemes and the combination of individual and aggregate ESG scores, as well as by [
10], demonstrating how subjective judgements within rating methodologies can lead to different portfolios and outcomes. This means that investors need to grasp the sometimes subtle differences between ESG scores and they need to be able to select ESG metrics that align with their corporate beliefs and ambitions.
Ref. [
11] identified three factors that cause inherit biases of ESG scores: company size (large score better), country or type of market (developed or emerging) and sector (high versus low tangibility and visibility). After studying a vast set of metrics and scores, they concluded that, on average, half of a company’s ESG score can be explained by these factors. This points out certain penalties that ESG raters might be imposing on highly profitable and sustainable but small companies that happen to be in an emerging market in a sector that has no ESG visibility. This is a concern which amplifies our interest in sector-specific ESG analysis. We focus our analysis on the European listed real estate market, which offers a sample of firms of similar midcap size, active in the same regions and industries.
Thus far, the available evidence on ESG scores is limited within the real estate literature. Instead, the underlying issues of E, -S and -G have been analyzed separately. Environmental sustainability has been studied frequently and internationally. For instance, [
12] studied the performance effects of GRESB ratings for REITs in North America, Asia and Europe for the period 2011–2014. Although data coverage was still weak during this early period, [
12] reported that high sustainability scores resulted in enhanced operational performance and lower stock market risks. [
13] focused on the European listed real estate markets, using LEED and certifications as metrics for REIT sustainability, and discovered that high percentages of certified building in the European REITs portfolios have had a negative impact on return on assets (ROA), return on equity (ROE) and stocks’ alphas, a finding that the authors account to the incremental costs related to the refurbishments needed to obtain the Building Research Establishment Environmental Assessment Method (BREEAM) and LEED certification.
Regarding the effects of corporate social responsibility (CSR)—the social aspects of ESG—the real estate literature is scarce. [
14] applied the MSCI’s Intangible Value Assessment (IVA) database to identify the voluntarily initiated aspects of CSR, and documented that CSR ratings are higher for companies with fewer agency problems. For real estate investments, [
15] offered evidence for a positive relationship between CSR ratings and Tobin’s Q, using the KLD data for a sample of US REITs. Although positive CSR scores had no effect on REIT returns, they documented that this Tobin’s Q spread was mainly due to the negative effects for low-scoring REITs.
As far as the governance factor of ESG is concerned, [
16] analyzed the performance effects of two competing governance structures in the market—the outperforming “self-administered” versus the underperforming “advisor” REITs. [
17] built on this work and used the Corporate Governance Quotient Index (CGQ)—a metric developed by Institutional Shareholder Services (ISS) that rates publicly traded companies in terms of the quality of their corporate governance. They uncovered a significant and positive relationship, but only for US REITs with lower dividend payout ratios.
In all cases, studies have focused on certain aspects of ESG, and have been limited by their choice of metrics and data sources—see also [
18]. In this study, we hope to profit from the emergence of EPRA’s sBPR scores that have become available recently.
3. The EPRA sBPR Database
In this project, we make good use of the EPRA sBPR database. In
Table 1, we give an overview of the different aspects of E, S, and G and how these are weighted across different metrics, including EPRA’s sBPR. This directly yields an interesting first finding, as the weights that these metrics use differ significantly. For instance, the Thomson Reuters measure assigns equal weights to the three categories of E, S and G scores, while GRESB overweights the environmental impact as this accounts for 57 percent of the overall score. Instead, KLD assigns more importance to governance, with a score weight of 58 percent. This shows that when having to choose between the aggregate ESG score of Thomson Reuters, GRESB and MSCI KLD, one needs to be wary of the underlying variations, since these can result in very different outcomes using the same set of raw data.
This issue is very different in EPRA’s sBPR database. EPRA’s sBPR was designed to raise the standards and consistency of sustainability reporting for listed real estate companies across Europe. First published in 2011, the third edition of the sBPR was published in September 2017 to align with established reporting initiatives in the real estate sector, and to establish common metrics to support companies with their reporting on wider social and governance issues as set out in Directive 2014/95/EU of the European Parliament and of the Council on the disclosure of non-financial and diversity information [For a full and detailed discussion of the EPRA sBPR Guidelines, we directly refer to:
https://www.epra.com/application/files/3315/0456/0337/EPRA_sBPR_Guidelines_2017.pdf]. The sBPR complement the existing and well-established EPRA Financial BPR. Each year, a panel of sustainability reporting experts scores each eligible company’s public disclosure against several areas of the EPRA sBPR Guidelines, including 28 different performance measures, consisting of environmental, social and governance items, and 10 overarching recommendations which underpin good quality disclosure and should be applied when reporting EPRA’s sBPR Performance Measures—please see
Appendix A for a full list.
EPRA has compiled a methodological framework that carefully assesses ESG transparency and yields an ESG disclosure score, which differs from other available ESG metrics in that it measures ESG transparency, not only ESG performance. Companies wishing to comply with EPRA’s sBPR standard must disclose their sustainability data against the 28 EPRA’s sBPR Performance Measures (16 on environmental, 9 on social, and 3 on governance) and a set of 10 guiding principles, i.e., the Overarching Recommendations which are the principles to apply to the disclosure of each performance metrics. Their disclosure must be made public in either their annual reports or corporate social responsibility report, or if preferred using a standalone documentation. The subsequent review of these sBPR data items occurs in a structured process, starting with a detailed primary review of annual reports, which is initiated by sustainability reporting experts at the end of the second quarter of the year, using a scorecard based directly on the EPRA sBPR. The total points are evenly distributed over the Performance Measures and the Overarching Recommendations (50%–50% weighting scheme). Within these two categories, different weighting schemes are applied, i.e., 70-20-10 weighting for the E, S and G impact categories within the Performance measures, while a 2.5%,10% range is used for the Overarching Recommendations. The score over the Performance Measures and the Overarching Recommendations is then aggregated into one ESG score at firm level. A second review by a different member of the team is then carried out to ensure data consistency. Any discrepancies between the primary and secondary review scores are double checked and addressed.
The increasing number of reporting companies and the progressing harmonization of them within the standard allowed EPRA to start a data collection exercise that became the sBPR database, launched in September 2019 and created with sBPR data of EPRA members reporting sBPR data since 2011. In order to be included in the sBPR database, companies must satisfy a threshold of quality disclosure, i.e., they must have been awarded a sBPR Award (Bronze, Silver or Gold). This principle has been set to ensure good quality and comparability of data of companies included in the scope of the database. Using the raw data on the sBPR data items collected for each company and included in the sBPR database, we define two measures of ESG compliance:
The sBPR ESG completeness score, which represents the percentage of data items for which data are available. Even if this measure does not directly relate to the effectiveness of compliance, it indicates the ability of the company to provide data on ESG compliance. Therefore, it also represents a proxy for the emphasis each company gives to these themes, also collating appropriate data.
The sBPR ESG performance score, which reflects the average percentage change in the data items. In particular, we firstly identify the following key items: energy efficiency (including energy intensity, proportion of renewables), greenhouse gas emissions (scope 1–3), water management, total waste by disposal route, energy performance certification (including BREAM, BRAVE and LEED), social impact score (including health and safety, diversity, employee turnover, and community engagement), and corporate governance impact score. We then count the number of items for which improvements (i.e., reduced energy intensity, increased proportion of renewable, etc.) have been achieved from year to the next. The percentage of improved data items forms our performance score.
For these public real estate firms, we collect firm characteristics (e.g., firm size, age, asset portfolio) from the Thomson Reuters and WRDS databases. For our analysis on real estate performance, we also collect time series on public real estate returns (both price and dividend) to assess any structural variations across our sBPR scores.
The sBPR database covers 64 different European listed companies, and we obtained data for the period 2011 to 2018. The sBPR panel is unbalanced both for companies—that entered and left the sample at different stages—, as well as for data items—with extension to S and G in 2017. Therefore, we limit our empirical analysis to the 2017 and 2018 data, when the panel is both consistent and balanced. In
Table 2, we present relevant summary statistics on the sampled firms, which show that their 2018 year-end market value equaled EUR 3.18 B., an average leverage of 40 percent, and an annualized sample return of just over 12 percent. These statistics are above the total universe of the European listed real estate market—with a market value and leverage of EUR 2.51 B. and 31 percent, respectively—hence it appears that the 64 firms covered in the sBPR are in general terms a representative random sample of the total population of companies, but do tend to be somewhat larger. Around 60 percent of our sampled firms has a property portfolio that is invested in one single property type. We classified these firms as property type focused, and we incorporate this focus in our subsequent ESG analysis. In addition, regarding the regional spread of the property portfolio, we gathered information, and discovered that 70 percent of the firms in our sample are regionally focused, investing in one (national) home market. Apart from these mean values,
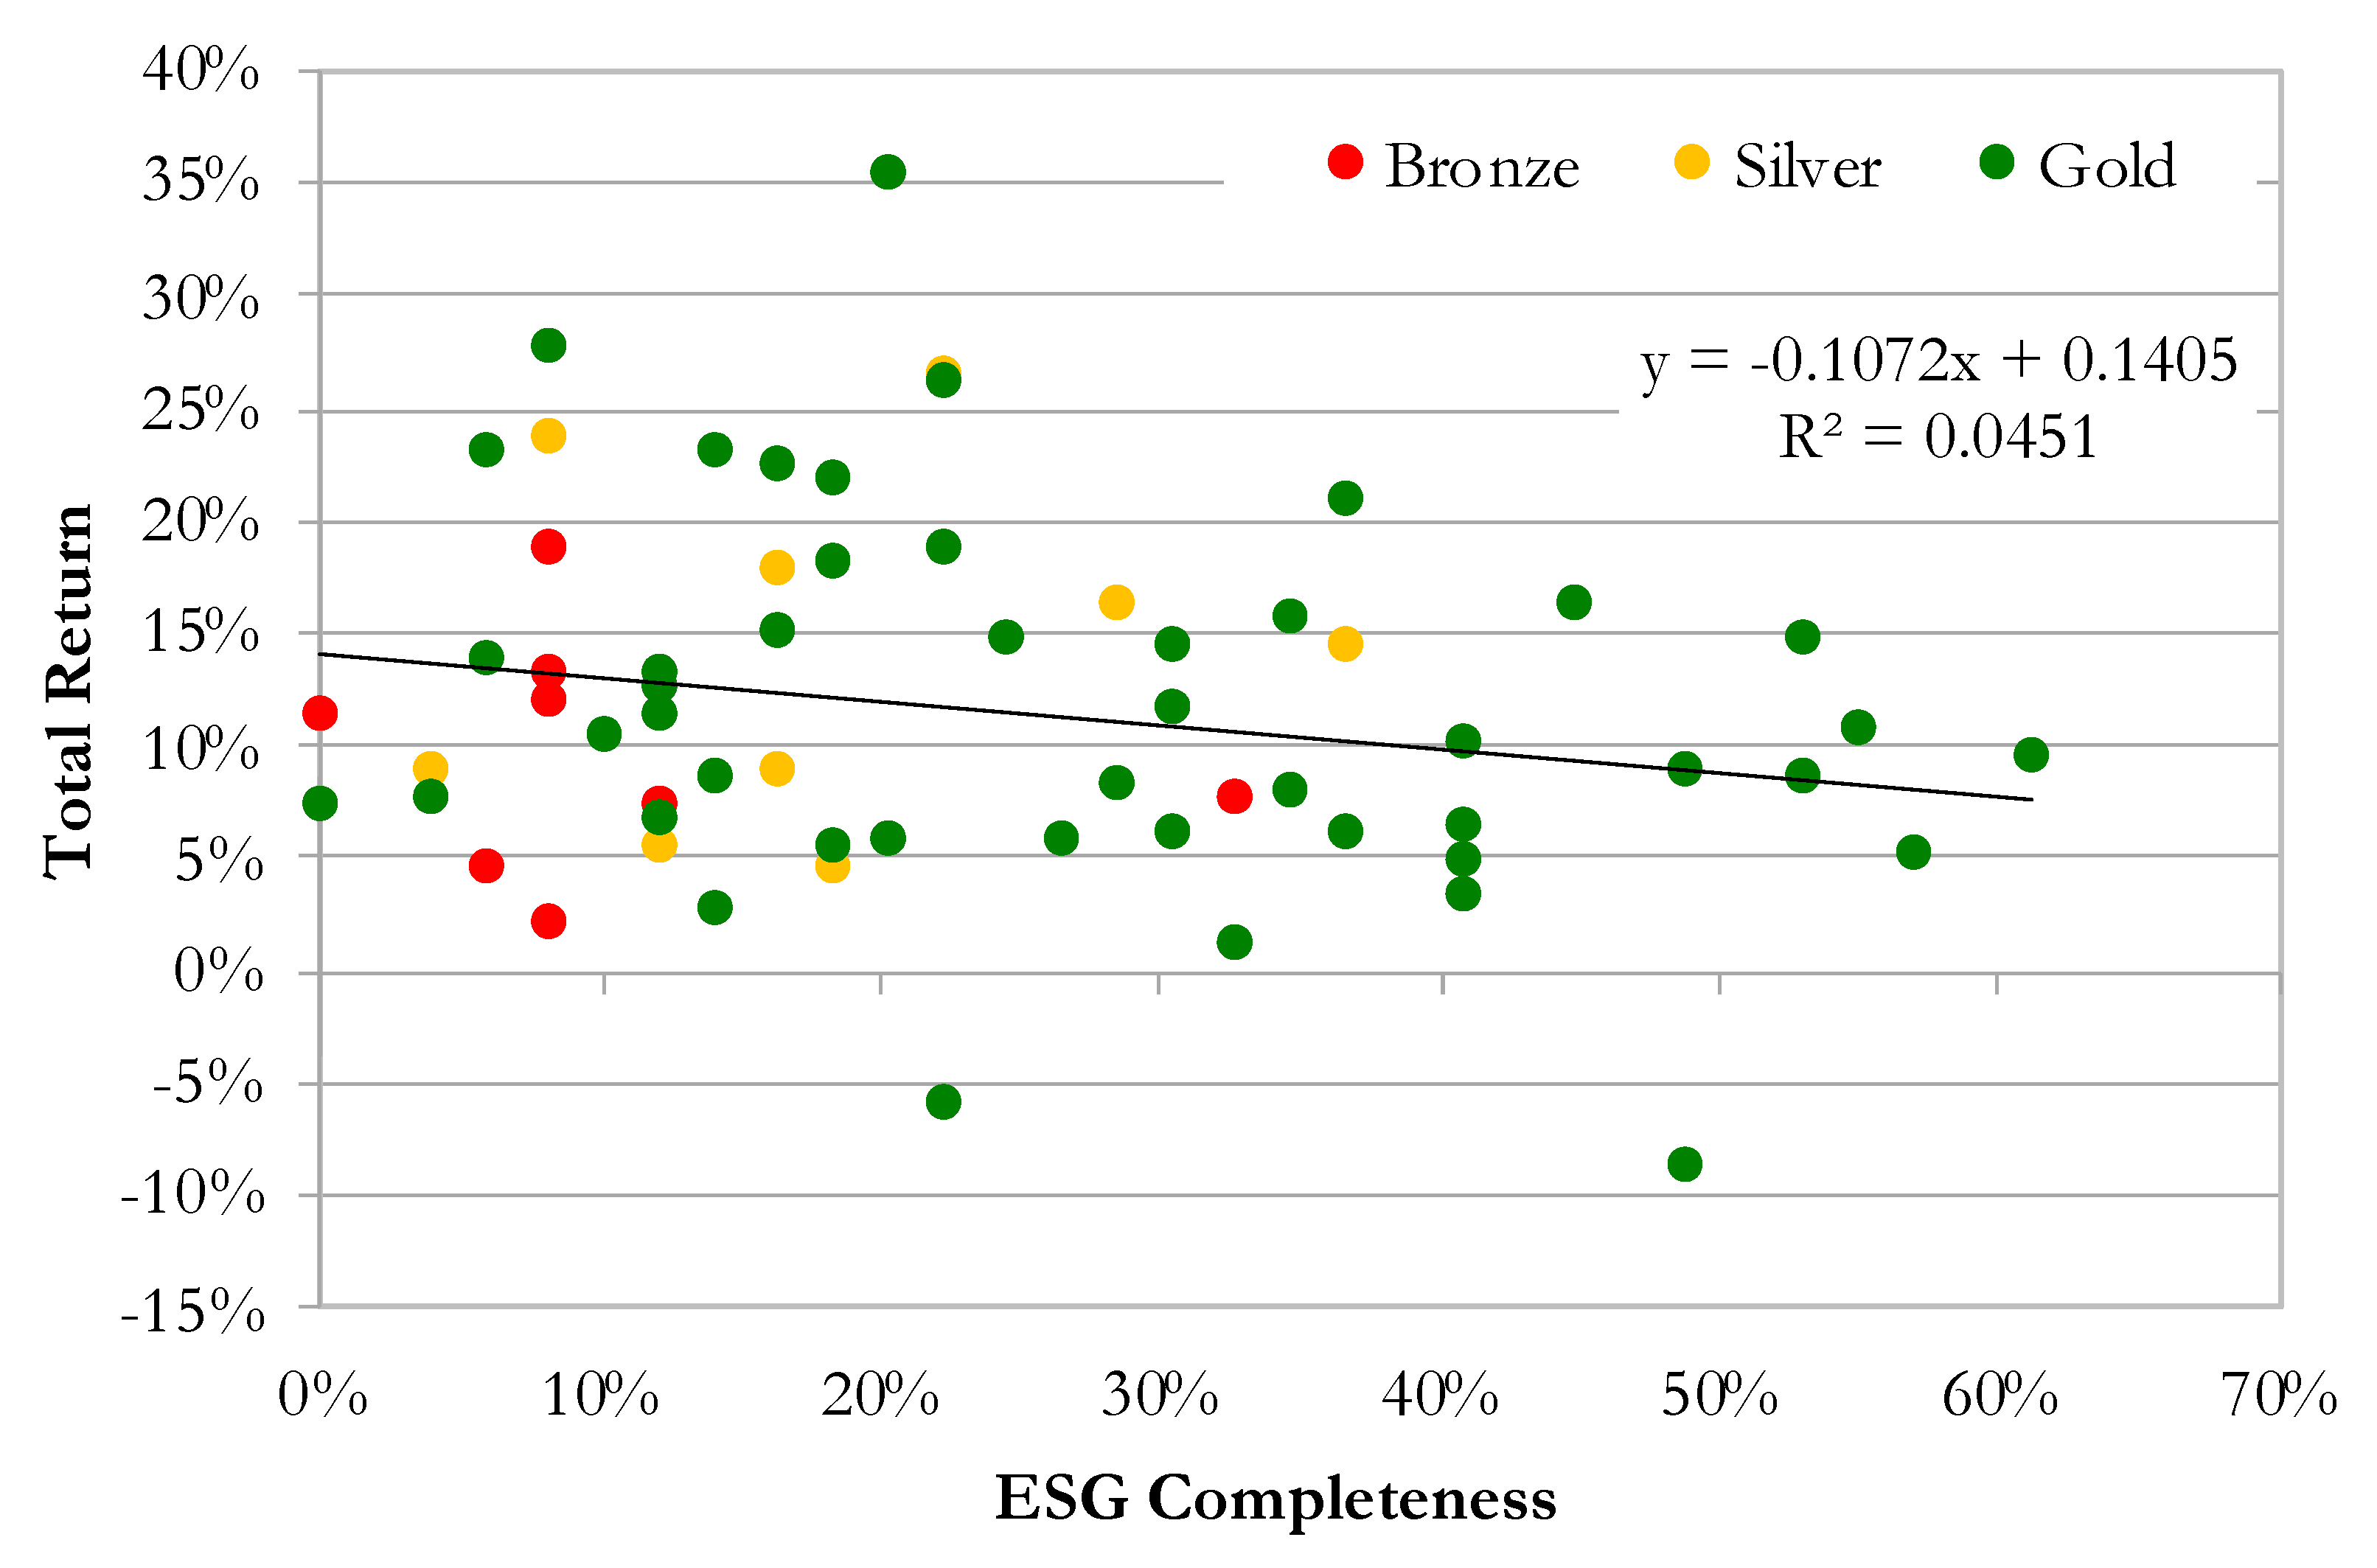
Table 1 shows some disparities within this sample. The average total returns ranged between almost −43 percent and +44 percent. One may wonder whether the ESG performance of firms has had any influence on their position within this range. Therefore, we start our descriptive analysis with a simple visualization of the ESG-Return relation.
Figure 1 plots the pair of the 2018 ESG completeness scores and the annualized total return for each firm in the sample. We use different colors to indicate the sBPR Award that was handed out to each firm in 2018; green for gold, yellow for silver, and red for bronze. Let us start with the observation that award colors cluster in line with ESG scores, the bronze awards are found to the left of the chart, where ESG completeness scores are lowest, while the golden awards dominate the right half of the scatter plot. On the vertical axis, we have the total returns of each firm, and the fitted trend line reveals a slightly downward sloping trend. In other words, higher ESG completeness scores are not associated with superior returns. The negative relation that is shown instead ought to be handled with caution as the explanatory power of the trend line falls short of 5 percent, indicating that other omitted determinants are relevant and should be considered in the modelling part of the study.
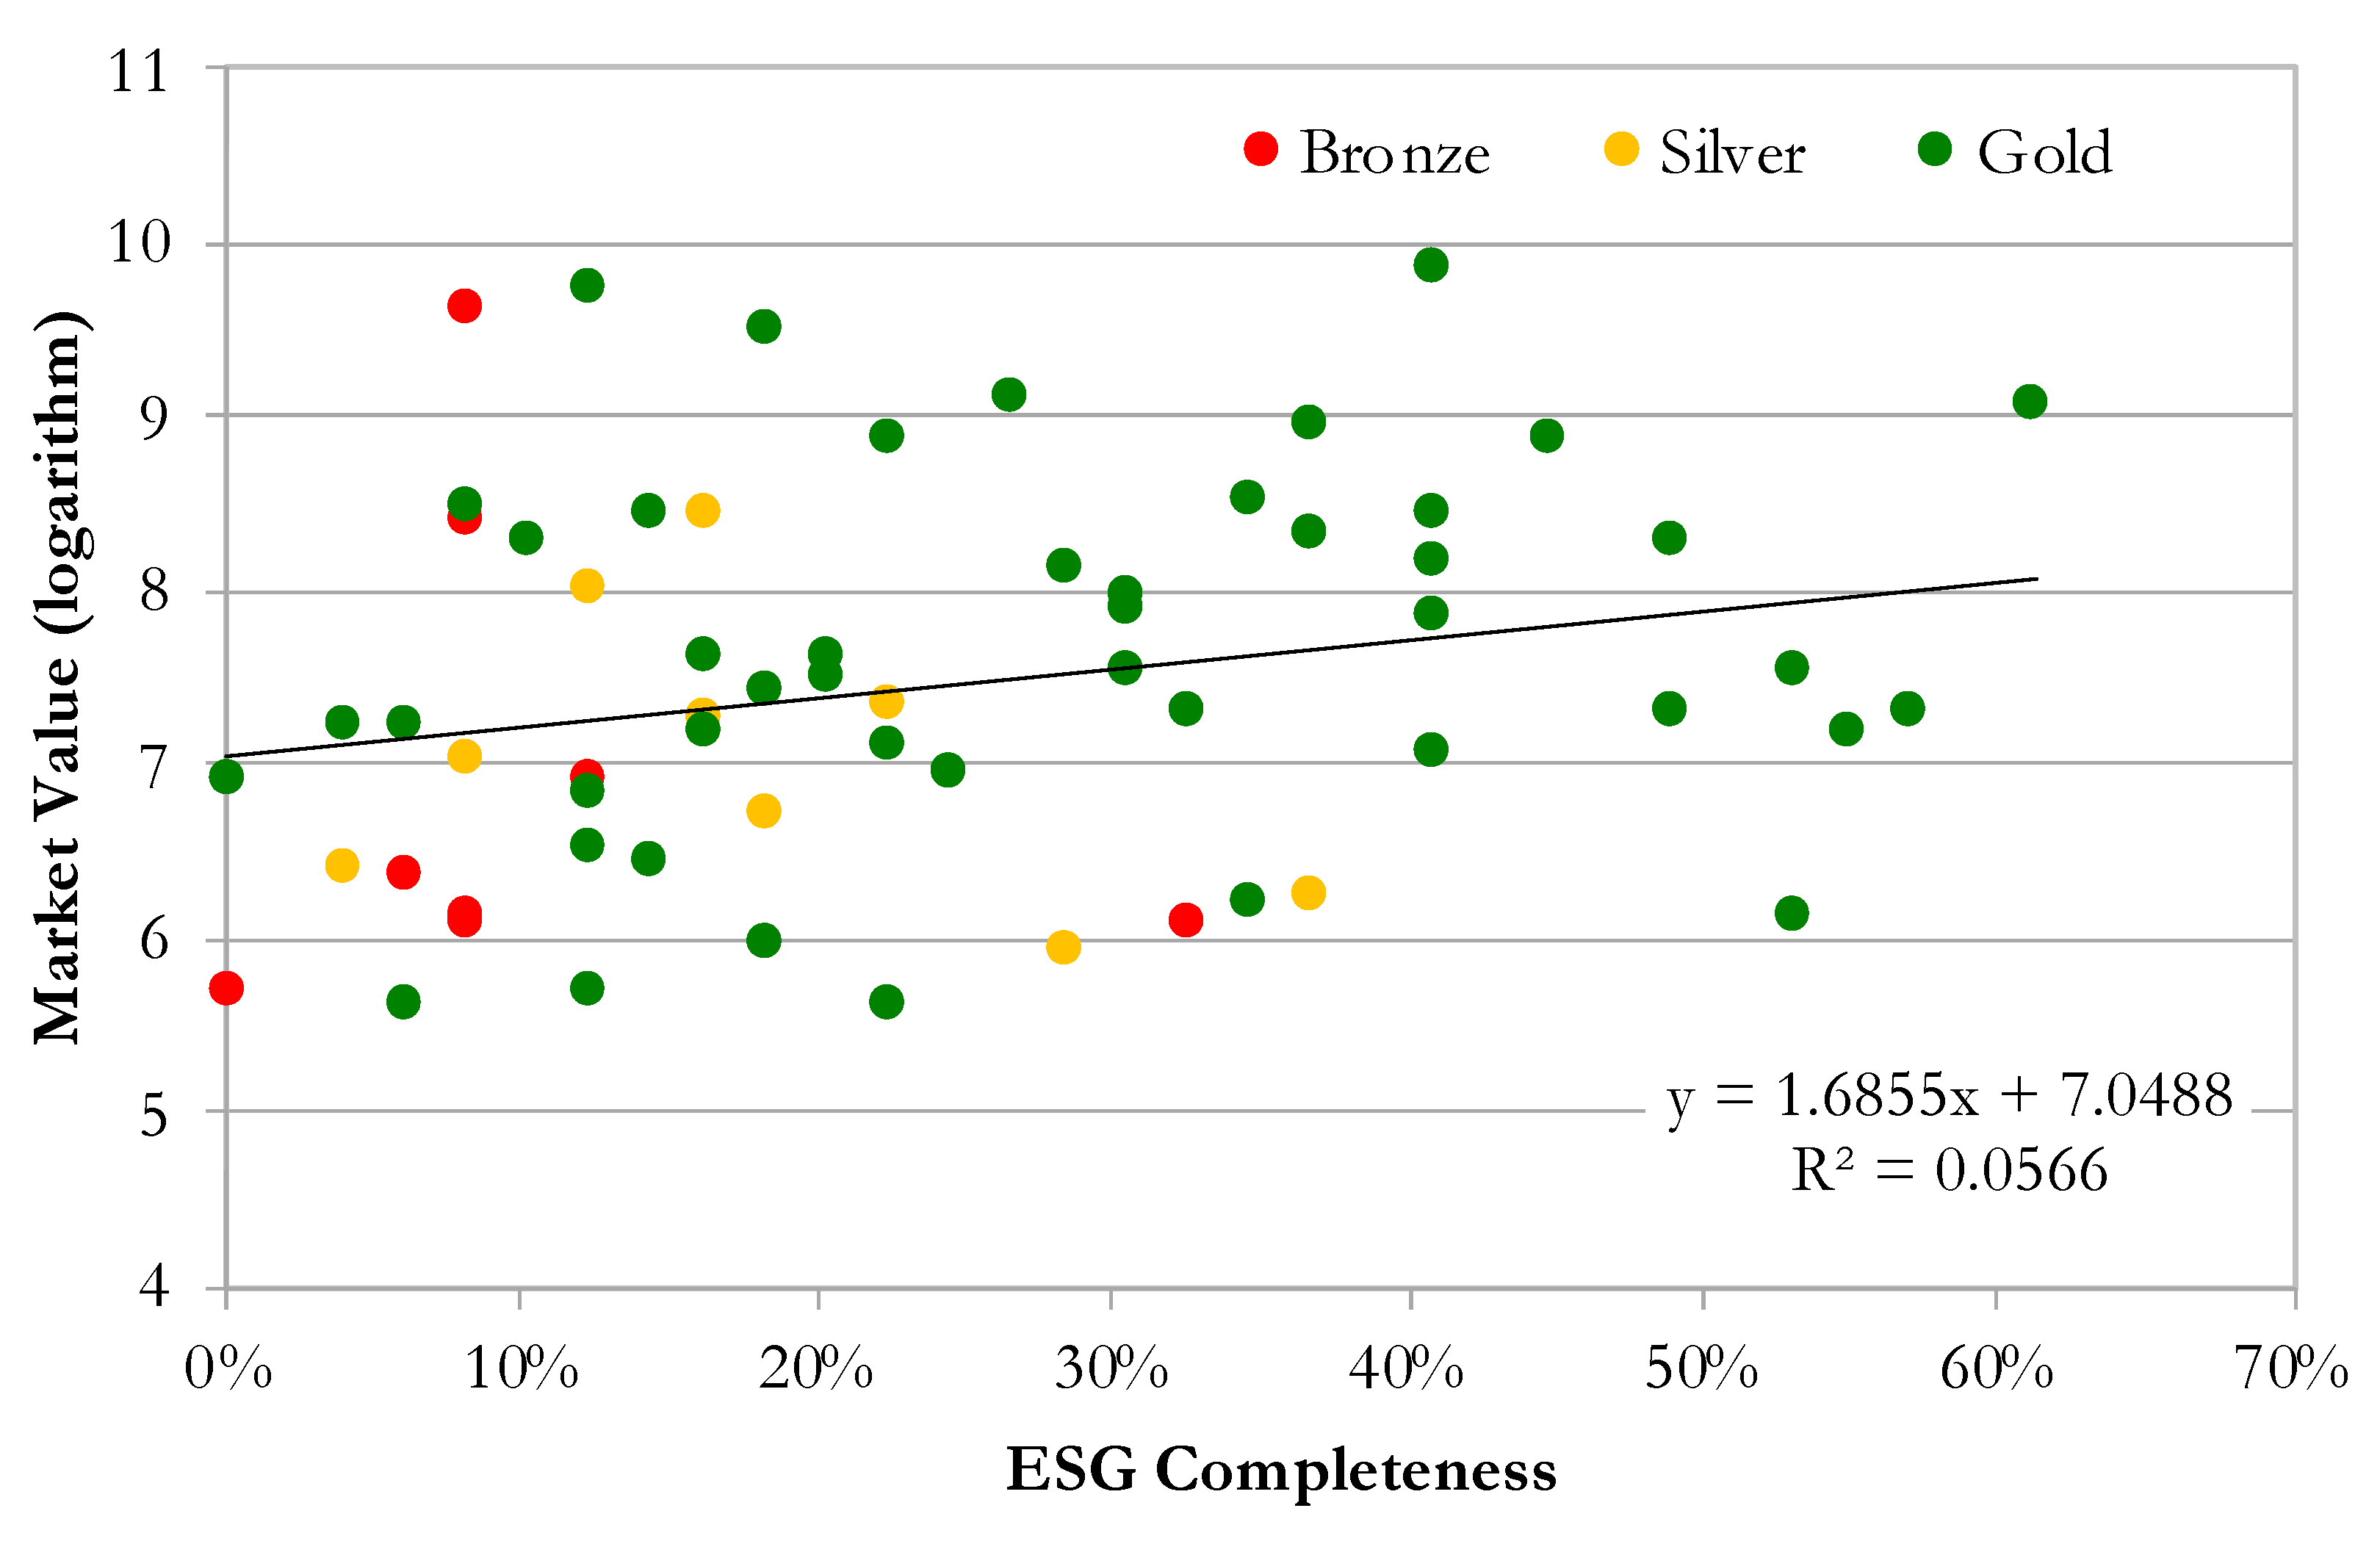
Figure 2 plots the pair of the 2018 ESG performance scores and the size (logarithm of market value to rescale the dimension to a more homogeneous measure) of each firm in the sample. Again, we continue to use a different color to indicate the 2018 sBPR Award. Awards cluster in line with ESG scores; the bronze awards (with some exceptions) tend to belong to smaller sized firms, while silver awards show a slightly bigger dimension. Gold awards show a wide spread of sizes, even if the biggest companies in our sample tend to receive the highest award. Overall, the fitted trend line shows a slightly upward sloping trend, revealing a positive association between ESG score and company size. In other words, the bigger the company size, the higher the ESG completeness score tends to be. In this case too, the slightly positive relation ought to be handled with caution as the explanatory power of the trend line is just above 5 percent, indicating that other omitted determinants are relevant.
Therefore, we continue our descriptive analysis in
Table 3 with a clustered overview of the key summary statistics across the three sBPR award categories. Although the debt-to-asset ratios and the fraction of closely held shares show little consistence, we do find evidence that market values covariate with sBPR awards—gold award winners are twice as large as bronze awards. This variation is meaningful as it suggests that companies need to have significant resources at their disposal to provide the transparency tested. This could either signal slack resources on the part of the firms that report or better governance. In the former case, it should have a negative relationship with financial performance, and in the latter, it should have a positive relationship. Given that the available finance literature has shown that firm size and other characteristics matter for return dynamics, we need to correct for these variations in a regression analysis of stock performance.
Above, we present the estimation of our regression models. However, we must also compare our sBPR scores of completeness versus performance. The first counts the number of completed data cells across all 51 sBPR ESG items, while performance refers to the number of items recording an ESG improvement. In
Table 4, we show that these scores align very well with each other and with the sBPR 2018 awards. Gold award winners score highest on both accounts, while bronze awards have been granted to the lowest ends of both metrics.
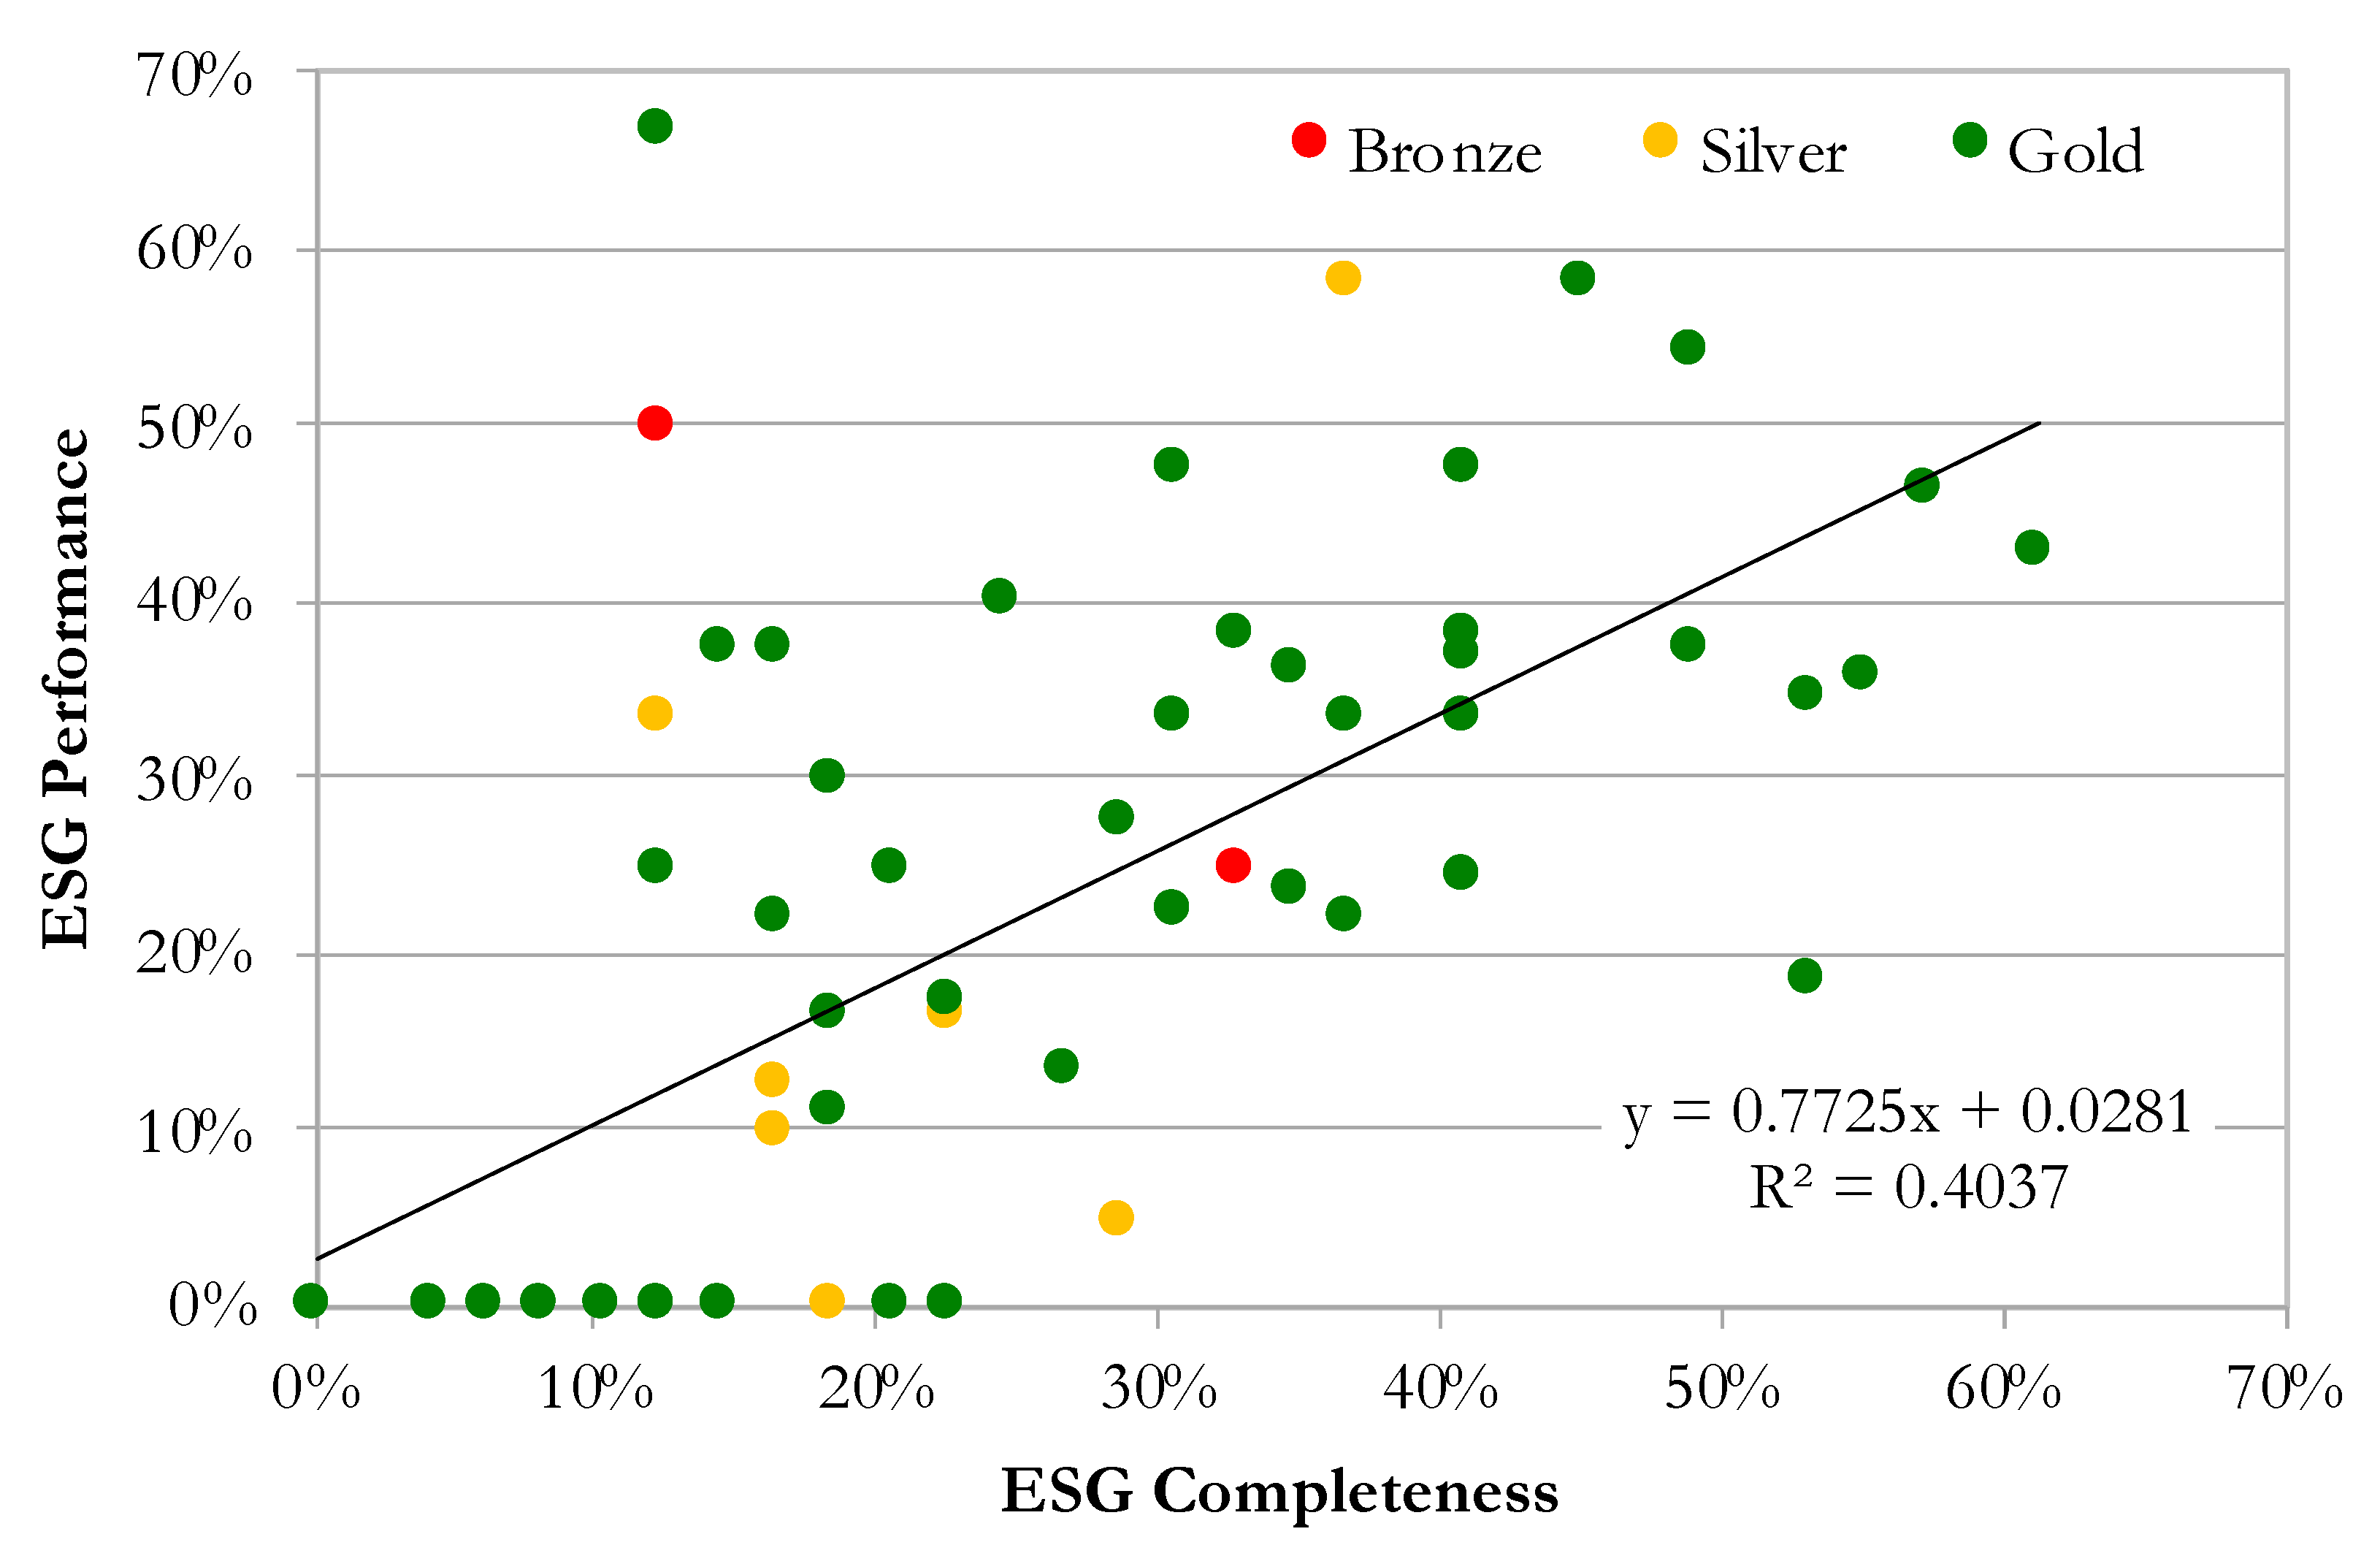
Figure 3 also shows the scatter plot of the two ESG scores, which reveals a positive relationship, explaining more than 40 per cent of its variation. This finding suggests that a more complete questionnaire is normally associated with companies that are improving their ESG scores. Furthermore, this outcome reinforces our conjecture to measure ESG compliance via the completeness of the EPRA questionnaire as companies that are more aware and engaged in ESG activities also tend to monitor their position through data collection (and analysis).
4. Return Analysis
Our pricing analysis starts with examining firm-specific returns using multivariate OLS regressions. These regressions are estimate on total returns for firm
i (
returni) for the year 2018. We explain the cross-sectional variations in these returns using different combinations of factors as follows. In Equation (1), we estimate the pricing by evaluating firm characteristics (
Xji) including size, LTV, ownership structure and portfolio, and fixed effects (
Zki) including property type (specialized sector vs. diversified) and portfolio location (national vs. international exposure):
In Equation (2), we then add the sBPR (completeness or performance) score information (
scoreshi) to model specifications as follows:
Besides these return regressions, we also estimate the same model for return to risk (return over standard deviation) to assess the integral effects of sBPR scores on the risk adjusted stock returns. Earlier results by [
16] demonstrated that SRI and ESG can differ depending upon the measure of return. To follow up on these findings we also control for risk by analyzing return to risk ratios as dependent variable, a method and metric discussed by [
17].
In
Table 5, we present the results of these multivariate regressions for the sBPR completeness scores. The regressions were executed and reported for key items within the sBPR framework, starting with ‘energy‘ and ‘greenhouse gasses’, all the way to ‘social impact’, and ‘corporate governance’. Before we discuss the results on the sBPR completeness scores, it is worth noting that control variables yield coefficients that are in line with expectations. Stock returns of the sampled listed real estate firms are higher for smaller (log total assets) companies, with a lower debt ratio (LTV) and larger real estate portfolios (log sqm). This confirms the common notion that investors prefer and appreciate investment firms in commercial real estate (higher square meters) with low leverage and a potential for growth. The fraction of closely held shares by inside investors appears to have no pervasive effect on stock returns.
Regarding the sBPR completeness score, we find positive and significant coefficients, indicating that firms more aware and active in sustainability issues (hence reporting more sBPR data) are associated with higher returns. This positive result is strongest for the data on social impact performance, but also statistically significant for other measures: energy usage, greenhouse gasses, energy performance certification and corporate governance. For the data categories water and waste management, results lack statistical significance. Therefore, we conclude that investors currently care most about the realized momentum regarding social impact, energy efficiency and corporate governance.
The same set of models are also estimated with the sBPR performance scores replacing completeness scores. In
Table 6, we present our results, which confirm the main predictions of control variables but also tell a slightly different story as far as the sustainable measure is concerned.
Contrary to sBPR completeness, which is a monotonically increasing variable that is expected to have a positive effect on stock returns, sBPR performance requires more nuances. In the performance score, we count the number of reported data items for which an increase over the years has been reported. However, while an increase in one data item should be interpreted as a positive accomplishment—as for example the percentage of energy performance certification (column 5) within the property portfolio—the same increase in energy usage (column 1) or greenhouse gas emissions (column 2) reflects an ESG deterioration. Therefore, we include an expected coefficient sign at the top of each column in
Table 6 to assist in the proper interpretation of results. In particular, we find significant results for energy usage and greenhouse gas emissions. In both cases, the coefficients are negative as expected, because a reduction should be interpreted as a positive ESG change, which will be rewarded by higher stock returns.
As far as other ESG performance measures are concerned, they do not seem to affect stock returns and coefficients lack statistical significance to allow for a proper economic interpretation. The fact that the results are strong and compelling for energy use and greenhouse gas emissions might indicate that investors currently care most about these ESG performance measures, which are also more prominent in the climate change debates and more prone to regulation. At the same time, we should note that the lack of significance among the other performance measures may well be due to the lack of data. We are estimating these effects on a small sample, which limits our degrees of freedom. It may well be that other ESG elements will also become more material for real estate stock performance in the near future, when more observations become available. Finally, even if other omitted factors in our modelling exercise may lead to a higher goodness of fit, the low R-squared is generally in line with results in the mainstream finance literature on asset pricing. They particularly reveal the attention investors give to the actual measurement of energy usage and gas emissions, where 20 to 30 percent of the variability in returns is explained with our models using performance scores.
This combination of regression results tells us that sBPR transparency pays off. Overall, investors reward sBPR data completeness with a return premium, which can be justified as a reward for data transparency that helps them to better select listed real estate firms within their own ESG framework. As sBPR performance—measured as the percentage of data items that shows increasements over time—is only recognized and awarded when it relates to energy usage and greenhouse gas emissions, this can be part of a learning curve in the market, in which more investors need to recognize sBPR data opportunities, also for ranking and selecting listed real estate firms based on other ESG aspects.
In line with [
16], we also want to control our return results for variations in risk. Hence, we also estimated model (2) with a return to risk ratio as dependent variable, and we present a succinct overview of our results in
Table 7. Here we find results which are fairly similar to the main analysis using returns. While controlling for firm size, leverage, closely held share fraction, portfolio size, property- and location-fixed effects, we find a significantly positive net effect for sBPR completeness for energy, GhG, and social scores, and significantly negative effects for sBPR performance for energy and GhG. In other words, the effects on returns are associated with proportional returns on stock risk.
As a final step in our analysis, we consider the sBPR ratings assigned by EPRA and test whether better rated companies deliver higher returns. The underlying information used for the ratings allows us to avoid endogeneity issues and we estimate our model using a two-stage approach. In the first stage estimation, we regress the sBPR rating against the underlying measure of completeness and performance scores as follows:
We subsequently use the fitted values of the first stage regression (
)—i.e., sBPR rating explained by a combination of completeness score h (
Completeness scorehi) and performance score p
(Performance scorepi)—to explain company performance in the second stage. We replace the direct completeness/performance score in Equation (2) with
as follows:
As the previous analysis reported in
Table 6 shows that greenhouse gas emissions (GHG) and energy consumption (Energy) are the only significant performance scores to explain company returns, in the first stage regression—Equation (3)—we use a combination of each completeness score with each of the two aforementioned performance scores. As a robustness test, we also present the results of the second stage regression—Equation (4)—obtained by combining in the first stage regression each of the completeness scores with the GHG performance score (
Table 8) and with the energy performance score (
Table 9), which were found to be significant in the previous analysis.
Table 8 shows a negative relationship between sBPR rating (fitted value from the first stage) and company returns, with better ratings associated with worse performing companies. This result is consistent across all completeness scores used in the first stage, with slightly stronger economic impact (−0.13 vs. −0.08) and explanatory power (c.ca 35% vs. 25%) when social and governance underlying scores are used in the first stage. Therefore, we find evidence that investors are willing to pay a sustainability premium (i.e., to accept a reduction in returns) to access more sustainable companies (i.e., companies with higher sBPR ratings). These results align with earlier findings by [
5,
6], and are most likely due to investment universe restrictions, sBPR costs, and, according to [
7], because of a learning curve among investors.
Even though it has a slightly lower statistical significance and explanatory power,
Table 9 generally confirms our findings when, alongside a completeness score, we use energy as the performance score in the first stage regression. The results still show a consistently negative coefficient of similar magnitude for sBPR rating, even if the statistical significance is slightly weaker if we exclude certification, social and governance as completeness scores in the first stage, in the last three columns.
As a final robustness test, we estimate the same two-stage model as from Equations (3) and (4), but this time using return to risk ratios as the dependent variable. Overall, we find similar, albeit weaker, outcomes as reported in
Table 10. We show a negative coefficient for sBPR ratings in the second stage regression as for the results using returns. Either using the GHG or energy performance data does not affect our findings, and the fitted sBPR coefficient is significant only when we include waste and governance as completeness scores. This outcome may suggest that investors targeting less risky real estate companies may decide to invest in more ESG compliant firms which tend to be more conservative and allow them to reduce their overall risk exposure.
5. Conclusions
ESG has become a standard for modern investment management. In an era where the literature on factor investing has inspired institutional investors around the world to tilt their portfolios towards small growth firms with stock momentum, the empirical evidence on the return effects of ESG performance is scarce. Yet, many investors consider and increasingly are required to consider ESG metrics when screening their investments.
In this paper, we add to this empirical literature by analyzing EPRA’s sBPR database for the listed European real estate market. This is a database that covers a wide variety of ESG aspects and allows us to disentangle the return effects of each. In our analysis, we construct two ESG measures based on the sBPR data: ESG completeness—a measure of ESG transparency in which we report the fraction of filed data field—and ESG performance—the fraction of ESG data fields that shows an improvement of the years. Both are computed for a sample of 64 European listed real estate firms.
Our results show that both ESG measures covary across firms. In other words, firms that score highly on ESG completeness, also tend to score higher than average on ESG performance. There is perhaps a case of reverse causality, in which poorly performing firms shy away from reporting their ESG completely. Furthermore, we find that both ESG scores are higher for the larger firms in our sample, and among the sBPR gold award winners. The latter does not come as a surprise, because the sBPR awards are partially based on ESG completeness scores. The fact that ESG scores covary with firm size is important, as this means that we need to control for firm characteristics when properly examining the effects of ESG scores on listed real estate returns. We analyze this issue in a set of multivariate regressions on firm stock returns in which controls for firm size, leverage, ownership, and property portfolio size are added. In these regressions, we find a positive and significant effect for ESG completeness and ESG performance for the ESG aspects energy and greenhouse gasses. Apparently, stock investors already identify and appreciate the progress that European listed real estate firm make when it comes to their reduction in energy usage and greenhouse gas emissions. Moreover, ESG completeness also increases returns regarding energy certification, social impact and governance scores. The more firms that report on these matters, the better these subsequent returns evolve. Regarding whether the actual performance on the ESG measures is also related to to stock outperformance, it is still too soon to tell, as our data limitations do not allow for any significant estimations on these factors at this point in time. However, we find initial evidence of investors willing to pay a sustainable premium to access companies with better sustainability ratings (sBPR).
Our results are important for investors and fund managers, as we show that ESG not only matters, but also that thanks to EPRA’s sBPR, it is swiftly evolving into a transparent quality of listed real estate firms. The extent to which firms cooperate in initiatives like the sBPR database can help them to improve their return profile. Given the successful but short history of EPRA’s sBPR database, our analysis is still limited. We are certain that more data will soon become available and help to identify and measure the merits of ESG efforts within the European public real estate market. We therefore encourage future research on the matter and on this new and unique database.


