4.1. Study 1: Scale Validation
The aim of the first study was to assess the validity and reliability of the scale for measuring purpose implementation. Eight Spanish companies participated in the study (three technology providers, two industrial factories, a building company, an agricultural company and a medical equipment supplier); 672 completed questionnaires were collected from a total of 862 employees (77.95%).
Table 1 provides a detailed account of the sample.
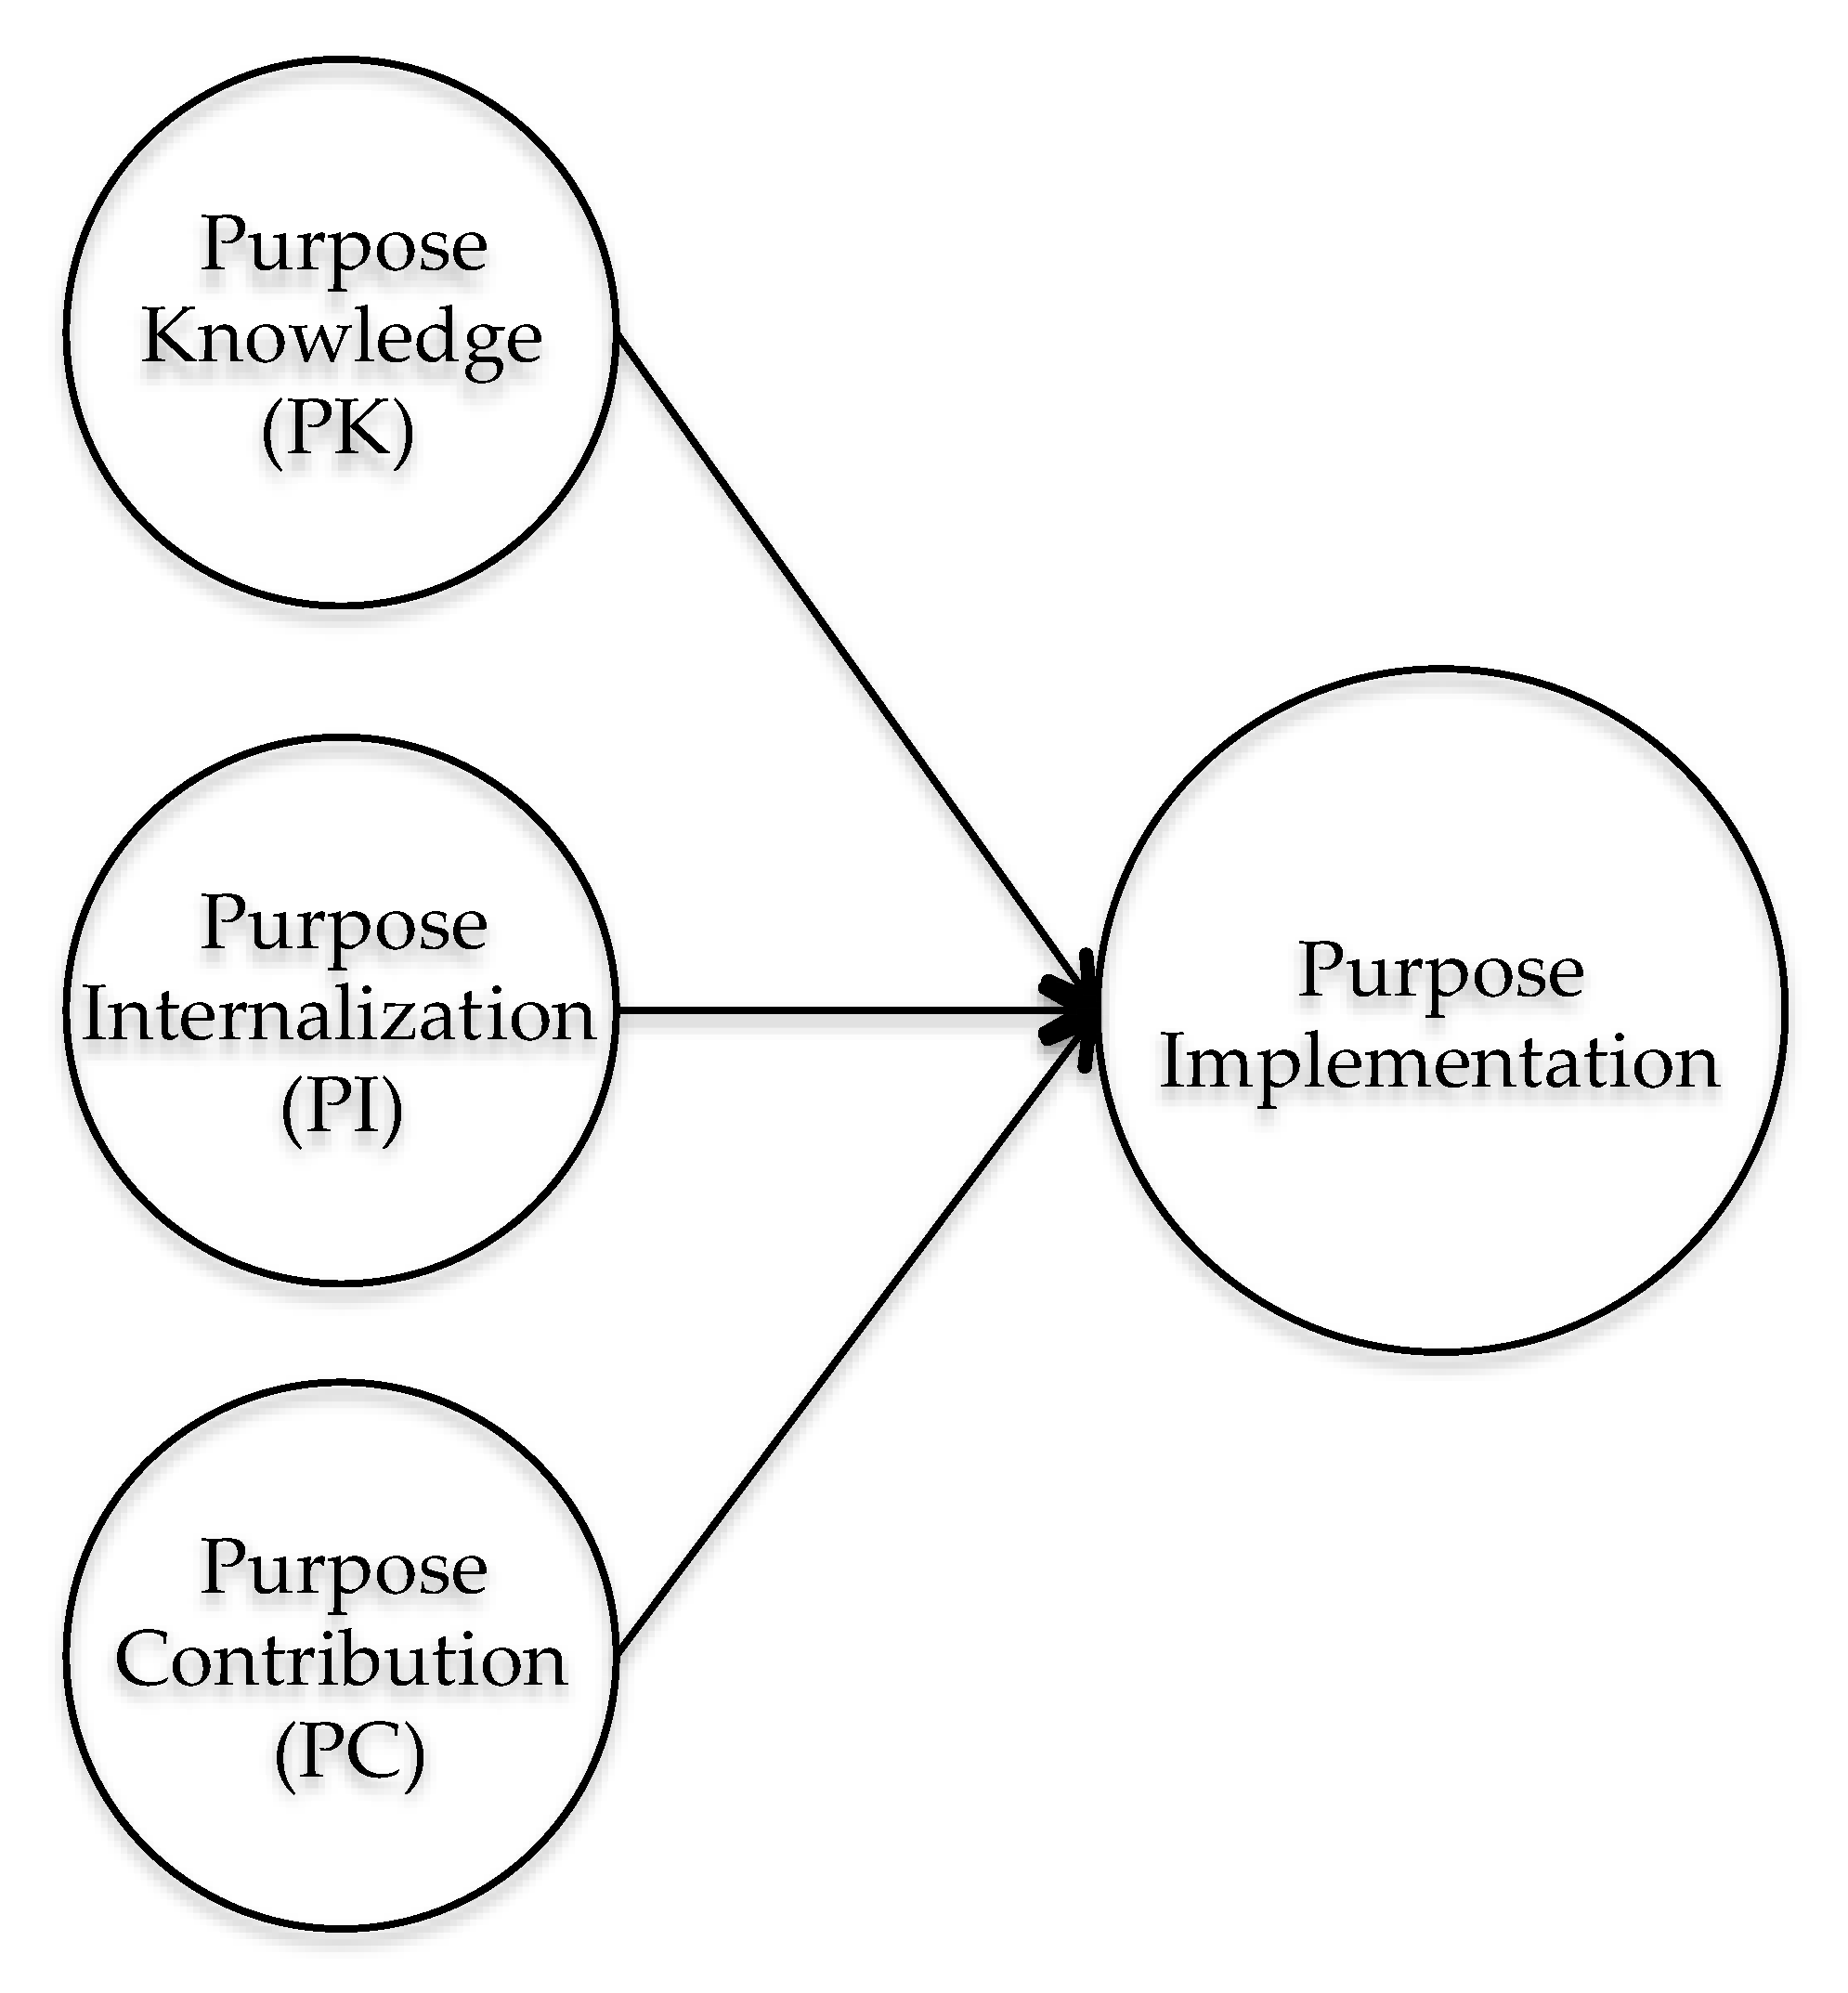
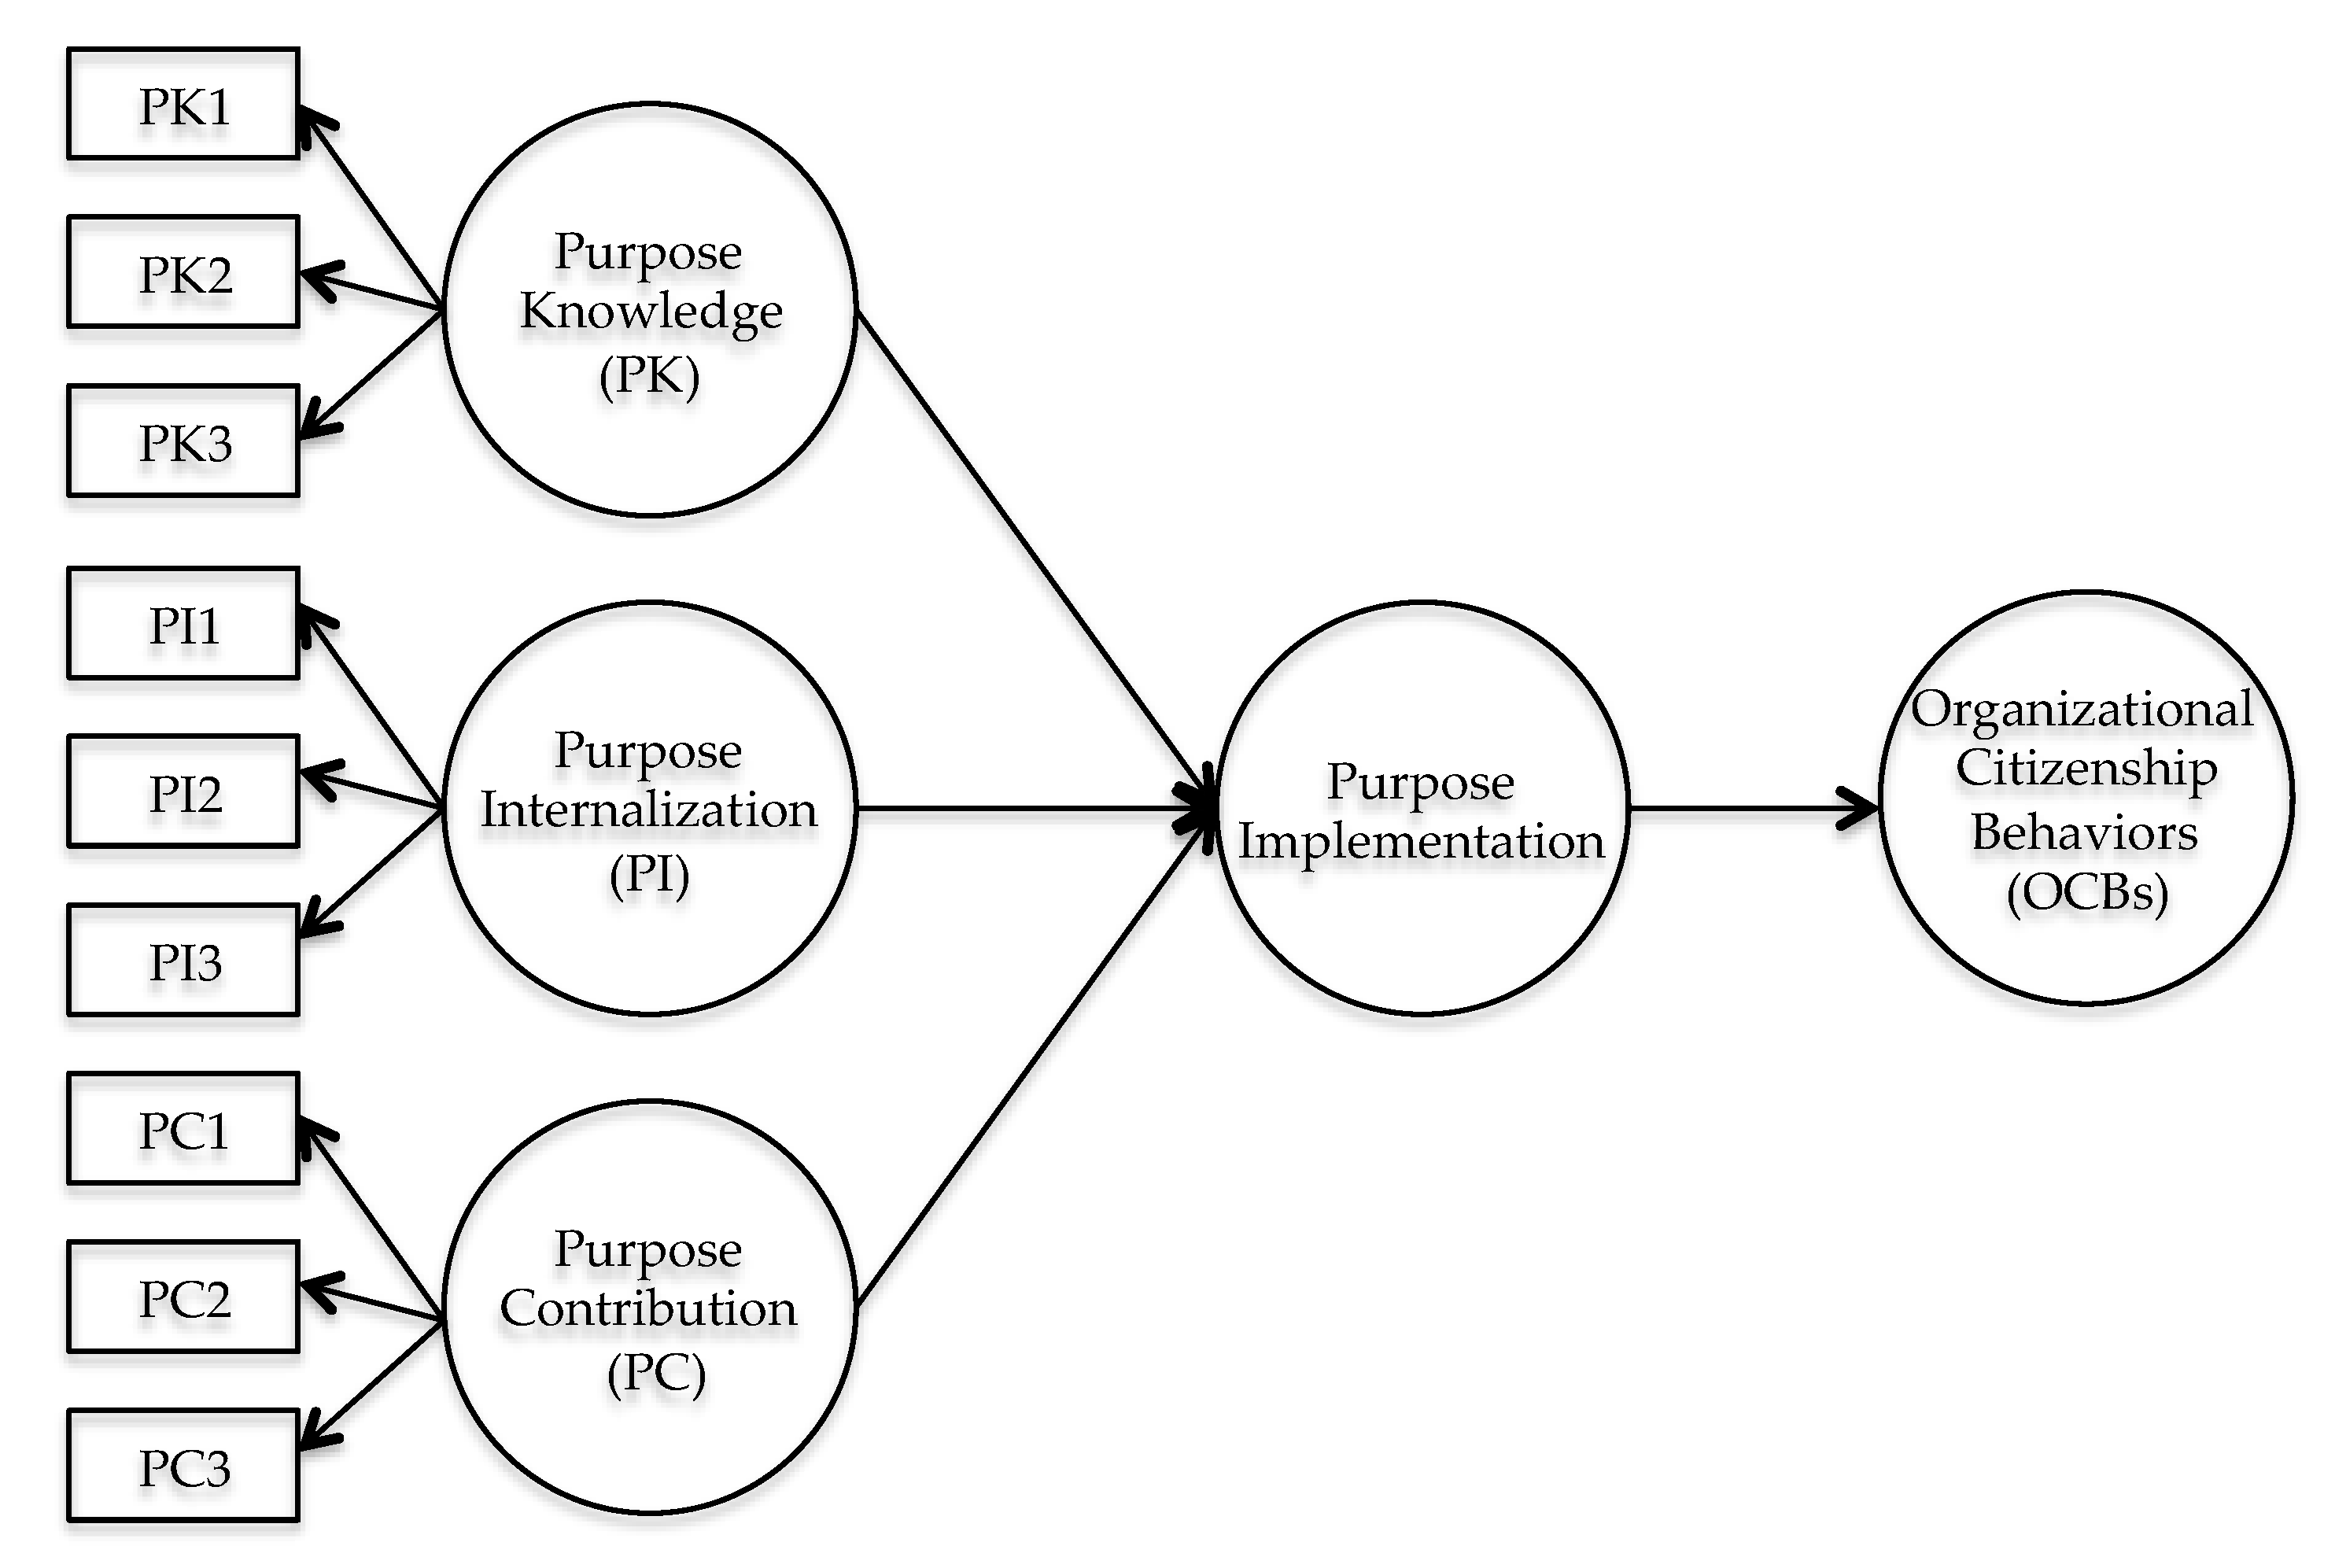
The model illustrated in
Figure 3 was analyzed with PLSPM using the SMART-PLS 3 software package [
56]. The power of the test with the sample size of 672 is 100% [
57]. In addition, a bootstrapping process using 5000 resamples of the same size as the study sample was used to generate standard errors and t-statistics, as recommended by Henseler et al. [
58].
We followed the process described by Sarstedt et al. [
59] and Hair et al. [
60] to validate the scale of the second-order formative construct.
The first assessment was used to validate the reflective indicators [
61]. To do so, we measured item reliability, Cronbach’s alpha and composite reliability index (CRI). The average variance extracted (AVE) was used to measure the convergent validity, and the Heterotrait-Monotrait ratio of correlations criterion (HTMT) was used for the discriminant validity [
52].
As
Table 2 shows, all the loadings are significant (
p-value < 0.001) with values over 0.708, attesting to the reliability of the items [
52]. Moreover, both the Cronbach’s alpha and CRI values were between 0.7 and 0.95 [
62,
63], proving the reliability of the scales. Finally, the convergent validity of the first-order variables was proven as all the AVE values exceeded 0.5 [
64].
The discriminant validity was verified using the Heterotrait-Monotrait ratio of correlations criterion (HTMT). As
Table 3 shows, all values are below 0.9, and thus there is discriminant validity [
52,
65].
Once the first-order variables have been assessed, Sarstedt et al. [
59] suggest the formative relationships between the first-order and higher-order dimensions be analyzed in three stages: the convergent validity assessed, the collinearity tested and the significance and relevance of their respective weights evaluated.
The convergent validity was assessed by redundancy analysis [
53]. Four questions were formulated in the questionnaire to set a reflective measure of purpose implementation ((i) I feel involved in the company’s mission, vision, values, (ii) The company’s mission and vision guide me in my daily work, (iii) The company’s vision is internally known, and it raises people’s hopes, and (iv) There is a high degree of commitment with the company’s mission and goals) and analyze the correlation between purpose implementation conceived as a formative higher-order construct and purpose implementation conceived as a reflective lower-order construct. The redundancy analysis yielded a point estimate of 0.698 (
p-value < 0.001), which was very close to the 0.7 value put forward by Sarstedt et al. [
59].
Regarding the collinearity of the formative items, the variance inflator factors (VIFs) were all below 3 (VIF of purpose knowledge = 1.84; VIF of purpose internalization = 2.23; VIF of purpose contribution = 2.25), and the criterion was met [
61].
The significance and relevance of formative constructs were evaluated using the outer weight obtained by bootstrapping [
66]. The outer weights—presented in
Table 4—are significant except in the case of purpose knowledge. However, following Hair et al. [
52], as the outer loading of purpose knowledge (0.742) is significant with a value over 0.50, the formative construct can be said to be significant and relevant, and, in turn, the measurement instrument used in this model can be deemed reliable and valid.
We were therefore able to prove that the scale for measuring purpose implementation is valid and reliable.
Finally, we examined the predictive relevance of the analysis and checked the goodness of fit of the structural model (
Table 5). Besides looking at the R
2 values, we supplemented the predictive relevance analysis using the blindfolding sample re-use technique proposed by Stone [
67] and Geisser [
68]. An omission distance of five was used, and Q
2 values above zero were obtained [
69], which, together with the fact that the R
2 was 0.175, indicate good power and the predictive relevance of the relationship or path model. Thus, it can be concluded that the overall fit of the model is adequate.
4.2. Study 2: Scale Cross-Validation and Hypothesis Testing
Following Mackenzie et al. [
51], we cross-validated the psychometric properties of the scale using a new sample. In addition, we used the sample of the new study to test the proposed hypothesis.
Fourteen companies from the USA, Lithuania, Italy and Israel took part in the second study (three industrial plants, one agricultural company, one medical supplier, four tech companies and five service sector companies (consultancies, legal firms, etc.)). Out of a total of 3460 employees, 2491 completed the questionnaires (71.99%).
Table 6 provides a detailed account of the analyzed sample.
As for Study 1, the model shown in
Figure 3 was analyzed using PLSPM for the Study 2 sample. The power of the test with a sample size of 2491 was 100% [
57]. A bootstrapping process using 5000 resamples of the same size as the study sample was used to generate standard errors and t-statistics following the same steps as in Study 1.
The results for item reliability, internal consistency and convergent validity of purpose knowledge (PK), purpose identification (PI), purpose contribution (PC) and organizational citizenship behavior (OCB) are presented in
Table 7.
As stated in Study 1, the fact that all Cronbach’s alpha and CRI values are between 0.7 and 0.95 evidence that the first-order scale is reliable [
62,
63]. Moreover, all AVE values are above 0.5, and thus we can confirm the convergent validity [
64].
Table 8 shows the values of the HTMT criterion were all below 0.9, thus proving the discriminant validity of the first-order scales [
52,
65].
In order to analyze the formative relationships between the first-order and higher-order (purpose implementation) dimensions, the three steps proposed by Sarstedt et al. [
59] were followed as for Study 1. The convergent validity was calculated through redundancy analysis, which yielded a point estimate of 0.719 (
p-value < 0.001) between the higher-order construct and the reflective lower-order construct, thus exceeding the proposed value of 0.7 [
59]. Regarding the collinearity of the formative items, the variance inflator factors (VIFs) were all below 3 (VIF of purpose knowledge = 1.741; VIF of purpose internalization = 2.438; VIF of purpose contribution = 2.505) [
61]. Finally, the outer weights—presented in
Table 9—were significant except for purpose knowledge. However, following Hair et al. [
52] indications as the outer loading of purpose knowledge (0.653) was significant with a value of over 0.50, the formative construct can be deemed significant and relevant, and, in turn, the measuring instrument used in this model can be considered reliable and valid [
59].
Finally, regarding predictive relevance,
Table 10 shows the path coefficient between purpose implementation and OCB. It also shows the analysis of the goodness of fit of the structural model by combining the R
2 values with the Q
2 values after using the blindfolding sample re-use technique with an omission distance of five. The values concluded that the overall fit of the model is adequate.
Regarding the possibility that control variables may have an impact, we took the characterization of the sample and reconverted them into numerical variables. With this, gender was converted into a dummy variable (0 = male; 1 = female), and the other three were converted into Likert scales by assigning numbers to the categories presented in
Table 6. Thus, company size ranges from 1 to 3, and age and seniority range from 1 to 4.
Once this was done, we simulated three analyses similar to the study by Ruiz-Palomino and Linuesa-Langreo [
70]. In the first analysis, we related all the control variables and purpose implementation to OCB; in the second, we related only those with significant relationships (gender, age and seniority) and purpose implementation to OCB; and thirdly, we used the model presented in
Table 10. In comparison, there was no change in the confidence intervals, and there were almost imperceptible changes in the loadings. Therefore, following the advice of Bernerth and Aguinis [
71], we can state that the control variables do not have a large enough impact on the dependent variable to be considered in the study.
Testing the Hypothesis
A method for calculating the consistency of purpose implementation was needed in order to test the hypothesis of the study.
Malbašić et al. [
72] proposed a formula for calculating the degree of equilibrium in the organization’s values. We adjusted this formula to calculate the degree of equilibrium between the three purpose implementation dimensions:
Equation (1): Purpose consistency formula
where M is the maximum value on the Likert scale used (5, in this case), and PK, PI and PC are calculated as the average of their respective items.
Multi-group analysis (MGA) can be used to see whether there is a significant difference in the relationship between purpose implementation and OCB when highly intense and consistent purpose and low-intensity and consistent purpose are differentiated (H1).
To do this, we followed the three steps outlined by Matthews [
73]. Firstly, a new variable (intensity × consistency) was defined as the multiplication of purpose intensity by purpose consistency, as explained previously, for the entire sample. The sample was then divided into four quartiles from higher to lower values, and we tested the high purpose consistency versus the low purpose consistency. The high purpose consistency group consisted of 609 valid responses, and the low purpose consistency group gave 652 valid responses. Both responses include participants from all the surveyed companies and have similar characteristics to the one presented in
Table 6.
The measurement invariance of the model was assessed to check the reliability of the metrics when tested under dissimilar conditions. This was carried out using the measurement invariance of composite models (MICOMs) approach, which involves three steps: configural invariance, compositional invariance and full measurement model invariance [
74,
75]. To achieve configural invariance, we made sure that the constructs were set with the same items per construct, and we treated the data identically with the same algorithm setting.
In addition, the compositional invariance was assessed based on the MICOMs procedure by running a two-tailed permutation test for the latent variables at a 5% significance setting with 5000 permutations to ensure that differences in the path coefficients were not due to differences in the way the constructs had been formed across the groups. Hair et al. [
74] established that the correlation between the composite scores was computed, and the null hypothesis that the correlation was equal to 1 was tested. The resulting non-significant permutation
p-values for each measurement model indicated the compositional invariance of the constructs.
With respect to the invariance assessment of the full measurement model, the equality of composite means and variances were examined [
74,
75]. The results of the MICOMs (
Table 11) showed that the means and variances of composites across the two groups do not differ, and thus a full measurement invariance criterion could be established. Thus, meeting the three requisites, we can establish that the two groups are suitable for analysis using the MGA method [
75,
76].
Concerning the reliability of both models, the Cronbach’s alpha and the CRI of the OCB variable when testing the high purpose implementation group were 0.841 and 0.904, respectively [
62,
63]. When testing the low purpose implementation group, these values were 0.804 and 0.879. The convergent validity was assured since the AVE values were higher than 0.5 for both high and low purpose consistency [
64]. In addition, all OCB indicators in both models were above the proposed 0.7 value threshold [
52].
Finally, we calculated the results of the pair-wise comparisons of the high-intensity, consistent purpose implementation group with the lower-intensity, consistent implementation group. The results of the permutation-based multi-group analysis are presented in
Table 12. The magnitude of the path running from purpose implementation to OCB was statistically different between the two groups. The path coefficient for the highly intense, consistent purpose implementation was higher (path coefficient difference = 0.296,
p < 0.001). In other words, the influence of purpose implementation on OCB was considerably greater for the highly intense, consistent implementation group than for the low-intensity, consistent implementation group, thus confirming the proposed hypothesis.


