Abstract
The aim of this evaluation is to verify the telling value of the Cost and Benefits Analysis (CBA) of regional roads modernisation based on an ex-post evaluation of the investments and their impacts on the incidence of traffic accidents. A set of 144 projects were the subject of evaluation. The analysis of the actual investment costs confirmed the assumption that the majority of projects were planned with a sufficient provision. When compared with the costs foreseen for the entire set of projects, the total reduction of actual costs spent was over 11%. The investigation of project impacts on traffic accidents was based on an analysis done prior to and after construction by using the Czech Police database. The measurement results show only minimum changes in the incidence of traffic accidents in the scenario prior to and after project completion. This however strongly contradicts the project goals declared, because the projects were anticipating almost zero accidents with a fatality and a 50% reduction of accidents with health consequences. However, a slight increase in road fatalities and in light and serious injuries was measured. These facts have a significant impact on the Net Present Value (NPV) and the weighted profitability index for the entire set of projects dropped from 16.7% to −2.8%. The key recommendation is to eliminate the impact on traffic accidents in the case of project evaluations processed ex-ante for projects focused only on a reconstruction or modernisation of existing roads.
1. Introduction
Ex-post evaluation of projects in the public sector does not currently enjoy much popularity. The money was spent and any possible discrepancy between the project impacts declared and quantified and the reality can have a negative impact on the institutions (or individuals) responsible for project preparation and implementation. When making decisions about whether a project, supported by a CBA, shall be implemented or not, there is actually no argument against the verification of costs and benefits even through ex-post CBA. Boardman, Mallery and Vining state that the primary benefit of an ex-post CBA is the possibility of defining the actual socio-economic value of the project evaluated and the benefits of major experience for the evaluation of similar projects [1].
Odeck and Kjerkreit mention a systematic approach to ex-post project evaluation in the UK (referred to as POPE—Post Opening Project Evaluation) or New Zealand [2]. Ex-post evaluation based on a sample of large projects has been also adopted by the European Commission [3]. A systematic approach to ex-post project evaluation is presently lacking in the Czech Republic. The assessment of project impacts is almost always based on the monitoring of compliance with project indicators (programmes) for projects financed from European Structural and Investment Funds (particularly the European Regional Development Fund (ERDF) and the Cohesion Fund (CF)) in the sustainability phase (usually five years since formal project completion).
CBA ex-ante evaluations are however often an integral part of the decision-making process on whether to implement a project or not. Integrating the CBA into the decision-making process for the spending of public or private resources only makes sense if its results are highly reliable. This evaluation shall assess whether (and how) CBA results change and whether this fact should affect the decision-making process regarding relevant projects.
The analysis rests upon a relatively homogeneous set of regional road modernisation projects in the Czech Republic. All ex-ante evaluations were prepared in the uniform programme environment eCBA 1.0 [4]. The investment volume, residual value, operating cash flow gap and anticipated socio-economic impacts including their valuation are among key inputs for the evaluation.
In ex-ante evaluations investments are usually entered based on the civil design and itemised budget and/or building volume, construction budget and other related expenditure. Ex-post verification of investment volumes is usually quite easy, because sufficient data is available for projects financed from operational programmes. The costs actually spent are usually part of the final report of any project. On the contrary, it is problematic to determine the residual value already for ex-ante project applications. The linear loss of value method and/or estimation of operating cash flow since evaluation completion until the end of the service life are usually adopted [5]. Ex-post analyses after several years of operation can improve the precision in determining the residual value only to a very limited degree. The ability to verify the operating cash flow usually depends on the type of the project. If a new civic amenities project is to be measured (e.g., construction of a new school building, sports stadium, etc.), the ex-post identification of operating income and expenses is usually easy, because the investor monitors the income and expenses in detail. It is however problematic to identify operating expenses in such projects as road infrastructure modernisation and this requires a detailed identification of the costs spent on the respective road sections.
Time savings, lower costs for vehicle owners and fewer external negative factors in transport are among the key inputs for the socio-economic analysis of road infrastructure modernisation projects (particularly less noise, lower emissions and higher safety). The ex-post verification of most such inputs is very problematic. Time measurements prior to construction and other road traffic data, allowing for speed measurements prior to modernisation, are not easy to obtain. Speed can have a significant impact on the incidence of traffic accidents, because the higher the speed the faster the driver must react to a risk stimulus. The central traffic intensity and flows monitoring system based on “floating car data” is only now being introduced in the Czech Republic. The use of other systems (e.g., data from navigation service providers or mobile phone operators could not be obtained due to the higher number of projects investigated, start of construction of the first projects dating back to 2008 and 2009 and construction only on regional roads) cannot be achieved. Similarly, accurate measurements of emissions from transport and noise are not available. Given the specifics of the pool of projects evaluated (modernisation of regional road infrastructure during the period 2008–2015) in the Czech Republic, the only impact that can be at least partly qualified is the change in the incidence of traffic accidents.
These facts define the objective of this article. The main aim of this evaluation is to verify the impacts of the road infrastructure modernisation projects on the incidence of traffic accidents. And subsequently together with the ex-post verification of the investment cost to analyse the impact on CBA results. The findings should be helpful to decision-making process concerning the regional road maintenance and modernisation.
The importance of ex-post evaluations of investments has been repeatedly stressed in the applicable literature. Boardman says that without an ex-post evaluation the benefits of the CBA for the decision-making process cannot be evaluated either [1]. The ability to verify whether the benefits declared actually materialised answers many important questions regarding the telling value of the CBA. He uses the example of the Coquihalla Highway to demonstrate the size of the deviation in the resulting evaluation from expected development and highlights assumptions that can significantly affect preliminary evaluation results.
Anguera followed up on Boardman’s study with an ex-post economic assessment of the Channel Tunnel connecting France with the UK and says that the British economy would be doing better without the tunnel than with the tunnel [6]. He says that the total cost invested in the tunnel is higher than the benefits arising from the tunnel’s operation. He identifies lower transport demand, which does not correspond to the rather optimistic assumptions when making the decision about the infrastructure project, as one of the main causes. Other ex-post evaluations stated in the literature include the Stockholm metro analysis where—contrary to the previous example—it is little surprise that significant socio-economic benefits were demonstrated, including urbanisation impacts [7].
The significance of the ex-post evaluation for the decision-making process is also confirmed by Odeck and Krejkreit [2]. They perform an ex-post analysis of a set of 27 road infrastructure projects in Norway. He then benchmarks the results of ex-post analyses done after five years since the opening date against the ex-ante results used for decision-making. The comparison shows an undervaluation of the NPV results by an average of more than 50% in absolute terms and 0.14% on the profitability index level. i.e., the Net Present Value constituting the investment unit. Traffic intensity and the traffic intensity growth index were among the undervaluated inputs. The positive impact of growing traffic volumes on CBA indicators was partly compensated by higher investment costs, but this effect was low enough not to significantly affect the undervaluation of the preliminary NPV.
An ex-post evaluation of a set of 10 projects financed from ERDF and CF resources was carried out by Jong, Vignetti and Pancotti [8]. The aim of this evaluation was to verify the investment costs and to estimate the demand and expected benefits. The largest deviations were identified mostly in monetised benefits. One half of the projects had to be marked as underachieving, but none of the projects dropped below the failure level. The study brought an interesting proposal: to categorise projects based on the ex-ante and ex-post comparison in six classes bearing the name of an object in space—from clear stars to black holes.
Besides the impacts of CBA, Welde also introduces other factors that affect the decision-making process in project selection [9]. Besides inaccuracies and deviations from inputs, he also mentions the limited capabilities of the CBA in covering key impacts (monetised or non-monetised) that must be taken into account in decision-making. The effectiveness in reaching the goals declared can be more important than the economic efficiency of the projects evaluated. What he sees as a separate item in ex-post evaluations is also the cost performance comparing investment cost estimations with actual, real-world compliance. Long-term project impacts are taken into account as strategic success, composed of the Relevance criterion (project impact on economic development and national trends in the incidence of traffic accidents), the Other Impacts criterion (e.g., insufficiently monetised negative traffic impacts on the environment) and the Sustainability criterion (robust infrastructure with respect to future transport volumes). Welde and Meunier & Welde also adopt this method [10,11].
Nicolaisen and Driscoll mention the absence of a uniform approach to ex-post evaluations of transportation projects [12]. According to these findings, a missing standard methodology for retrospective evaluations is the major issue making it hard to draw mutual comparisons of results and having negative impacts on feedback for future evaluations.
2. Materials and Methods
To ensure a correct evaluation, the aspects leading to correct quantification and accounting for a change in the incidence of traffic accidents in the CBA must be correctly defined as well. This includes the definition of a reference scenario and estimated increments/changes resulting from project implementation (or planned project), consideration of time impacts and valuation (quantification) of impacts on the incidence of traffic accidents based on shadow prices.
It is also important to note that negative CBA results (both ex-post and ex-ante) do not automatically mean that the projects implemented are bad projects and/or that their costs are not compensated by possible socio-economic benefits. This analysis does not aim to question the decision-making process as such. According to Sudiana the possible loss of trust of the public in the decision-making process in the public sector can invalidate this process for the future [13]. Therefore, the analysis aims to improve the telling value of the costs and benefits.
The crucial data for the evaluation is the list of the projects collected in the eCBA 1.0 system and the database of the accidents in the Czech Republic [4,14]. The accident database makes it possible to verify the change in accidents on modernized sections of regional roads and to determine the mean percentage error. Subsequently, using the standard methodology for project evaluation, it is possible to calculate the impact on the CBA results.
2.1. Identification of Reference Scenario and Impact Value Estimation
The reference scenario (zero variant—no project implemented) was defined in accordance with the considerations of Florio et al. and the European Commission as “business as usual” [5,15]. The change in the number of traffic accidents was observed by comparing the situation prior to and after project opening. The statistics of Czech Police, summarised in the Uniform Traffic Vector Map, were used to determine the number of accidents [14]. Due to data availability, 1 January 2007 was set as the starting point for the measurements. The monitoring period prior to project implementation is also limited from the other side by the date directly preceding the commencement of physical construction (i.e., usually the site handover day) for each individual project. The incidence of traffic accidents during construction is not followed. The incidence of traffic accidents after project implementation, i.e., since the day directly following the day of construction completion (site handover day) until the present (namely data processing as of 31 December 2019) is determined in a similar manner. Figure 1 and Figure 2 show the incidence of traffic accidents of a selected project.
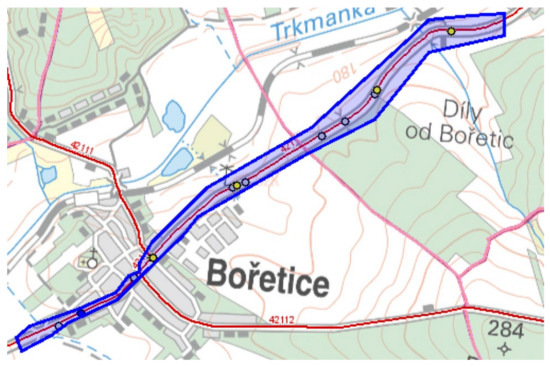
Figure 1.
Example of the incidence of traffic accidents prior to construction (II/421 Bořetice through road—Kobylí, 1 January 2007 until 28 February 2012). Inputs from Czech Republic Police map and data [14], the authors’ own method.
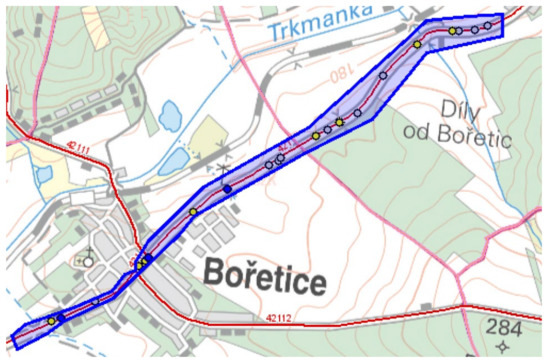
Figure 2.
Example of the incidence of traffic accidents after construction (II/421 Bořetice through road—Kobylí, 1 September 2015 until 31 December 2019). Inputs from Czech Republic Police map and data [14], the authors’ own method.
The inputs allow—besides the incidence of traffic accidents—the identification of fatalities (within 24 h), seriously injured persons (within 24 h) and lightly injured persons (within 24 h). Given the usual issues with statistics tracking the incidence of traffic accidents and the potential impact of external and internal factors, for example Lord and Mannering say that this method is highly simplified [16]. But when considering the goal followed (i.e., to identify the deviation in NPV estimation), it appears to be acceptable. For the sake of complexity, the national trend in the development of road accidents and their impacts was identified (Figure 3).
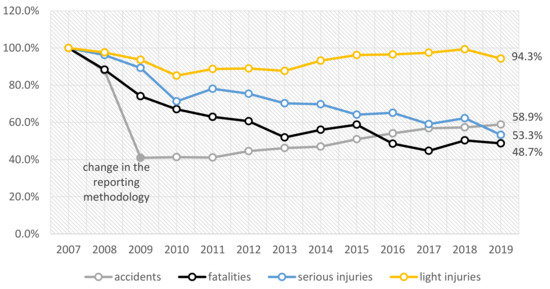
Figure 3.
National trend of traffic accidents (2007 = 100%). Input data from Czech Republic Police [17], authors’ own method.
According to the statistics of the Czech Republic the general trend in road fatalities, seriously and lightly injured persons has been positive, i.e., declining, since 2007 [17]. According to the Czech Statistical Office ČSÚ the following are the main factors causing the positive traffic accident trends in the Czech Republic: gradual car fleet improvements, more safety features in vehicles, development of transport infrastructure, traffic education and awareness campaigns in media, demographic changes (significant demographic groups become more responsible) and introduction of the penalty-points system [18].
The national component goes in the same direction as the projects evaluated (less injured and fewer fatalities). An adjustment for the national trend is theoretically possible, e.g., based on the shift-share analysis [19,20], but highly problematic due to a change in the traffic-accident reporting methodology. Also Figure 3 shows a significant drop in traffic accidence between 2008 and 2009, caused by the change in legislation and reporting since 1 January 2009. This drop is therefore probably only formal. Also with regard to these conclusions (minimum impact of the projects investigated on the incidence of traffic accidents), the shift-share analysis is not applied on the data measured.
2.2. Inaccuracy Measurement
To measure the inaccuracy of the estimation, the percentage error (PE) is used, expressing the percentage deviation of the estimation from the reality measured as of the ex-post analysis date. The mean percentage error (MPE) and mean absolute percentage error (MAPE) are also defined on the entire pool of projects. Indicators were defined according to Odeck and Kjerkerit [2].
To determine the deviation of the variables followed (number of accidents and change in investment costs), their impacts on NPV changes must be identified. The variables followed track the change in investment costs and incidence of traffic accidents (fewer fatalities, seriously and slightly injured persons and lower material damage). The resulting impact on NPV changes can be defined as follows.
The data from the set of projects however contain the investment value prior to construction and after completion. To duly calculate ∆NPV(I), its spreading in time (in years) must be defined as well. The taxable supply date on invoices issued during construction is the main criterion of investment classification in time. As these data are not available for the set of projects, the investment was equally spread in time during construction depending on the number of days of construction during the different calendar years. The change in investment (i.e., difference between ex-post and ex-ante) in a year (t) is therefore calculated according to the formula shown below.
If we know the investment during the different years, we can calculate, i.e., measure the change in the NPV (ex-ante vs. ex-post) in a standard manner.
To determine the impact of the incidence deviation on the change of the NPV in the project, shadow prices must be defined, making it possible to determine their socio-economic value in money. The ex-ante evaluation was based on unit prices on the 2008 price level and no changes in prices were assumed for the 2007–2015 period. All evaluations were counting with real prices valid at the time of the evaluation (2008–2013) and prepared by valuating impacts on the incidence on the 2008 price level. Given that there were only marginal changes in prices during this period, the method appears to be acceptable. Identical valuation as in the case of the ex-ante evaluation was used for the ex-post evaluation. For a comparison, the current method used in the Czech Republic for infrastructure project evaluations was applied for the change in incidence [21]. The valuation available in the current methodology was converted (for the sake of comparison with the ex-ante methodology) to the 2008 price level (Table 1).

Table 1.
Valuation of impacts on the incidence of traffic accidents Data [4,21,22], authors’ own method.
The evaluation parameters primarily involving the discount date (r), evaluation period and conversions of price levels are preserved in line with the ex-ante evaluation. The discount rate is determined in real terms as 5.5% p.a. and the valuation period is 25 years. No testing of changes to the discount rate was applied [14]. Conversion factors were not used for the ex-ante and ex-post evaluations.
All projects with a positive NPV (i.e., when the net present value of benefits exceeds the net present value of costs) are suitable for implementation and, if a choice shall be made, such a combination of projects shall be chosen which maximises net benefits [22]. Since the CBA is not perfect (impact valuation, non-quantifiable impacts), this principle and potential externalities (e.g., political will) are not always reflected in practice. The projects were supported from the resources of the European Structural and Investment Funds (ESIF) under the Regional Operational Programme South-East. The CBA results were taken into account in the evaluation criteria in the section dealing with project quality in terms of benefits and adequacy in the criterion “adequacy of the investment in terms of the outputs achieved, the socio-economic outputs and the standard situation”. The criterion was defined as a point criterion (possible gain: 0 to 12 points out of 100) and negative NPV led to a zero point gain in this criterion [23]. The influence of the ex-post change in NPV was therefore only investigated based on whether NPV drops below zero tolerance where the non-quantifiable benefits associated with implementation must be proven [24]. The actual change in points with regards to the limited number of authorised applicants in this field of support (only two regional road administration units) had only a marginal impact on project selection.
2.3. Set of Projects Evaluated
A set of 144 projects implemented between 2008 and 2015 within the regions of South Moravia and Vysočina in the Czech Republic with the support of resources from the Regional Operational Programme South-East was processed. All projects apply to category II and III roads and primarily involved the reconstruction and modernisation of the road surface, increase in load-bearing capacity, restoration of horizontal and vertical traffic signs, road shoulder adjustments, drainage, bridge and turn-off lane upgrades. Adjacent pedestrian pavements, bus stops, safety islands, parking and long-term parking areas and other local road connections were also usually built as part of these project activities. The direction and elevation of the road changed only in very few projects. Roads were relocated only in exceptional cases (only four projects). In some projects (mostly in the Vysočina region) the road was widened, usually to category S9.5. The total length of the sections modernised was 564.6 km and the total investment was CZK 8.1 billion (actual costs spent). Given the marginal representation of new roads (relocated roads) in the set of projects, no conclusions can be made regarding the impact of new construction on a change in the incidence of traffic accidents.
Higher safety and smoother traffic, time savings, less noise and dust and lower emissions, higher travel convenience and lower operating costs (lower fuel consumption and slower wear) are among the most frequent project goals. A project list can be found in Appendix A.
3. Results
When considering the arguments mentioned in this analysis, the ex-post evaluation aims at a change of investment costs, project impacts on the incidence of traffic accidents and their impacts on evaluation results.
3.1. Ex-Post Evaluation of Investment Costs
The main source of data for the ex-post identification of investment costs are final reports on project implementation and sustainability control reports and/or summary of data from investors in the system of the control body of the programme [25]. Ex-ante values come from eCBA 1.0 [4]. The project units were evaluated—due to system deployment only during 2008—only in the final phase of construction. The minimum 0.0% deviation is also from this period when investment costs were entered in the economic evaluation only after signing the contract with the contractor and the financial limit of the contract was met without any changes.
The results (Table 2) indicate a relatively large drop in investment costs during tendering and construction. The average size of the project decreased from CZK 63.1 million to CZK 56.1 million after implementation, which corresponds to a decrease of approximately 11.2%. The average value decreased from CZK 54.5 million to CZK 45.9 million, the maximum size of the project increased slightly from CZK 199.7 million to CZK 201.4 million.
Table 2.
Investment cost deviation (amounts in million CZK).
3.2. Ex-Post Evaluation of the Incidence of Traffic Accidents
Increased safety was one of the major decision-making factors. The ex-ante evaluation quantified a positive impact on safety in 123 projects (86%) and fewer injuries were quantified in 4 projects (63%). No negative impact on safety was mentioned for any of the projects evaluated. A reduction in fatalities in traffic accidents of 5.9 persons p.a., a reduction in the number of seriously injured of 15.0 persons p.a., a reduction in the number of light injuries of 100.2 persons p.a. and a reduction in the number of traffic accidents total of 300.7 were assumed for the entire pool of projects. The ex-ante estimates were verified based on Czech Republic Police data [14] and measurements done prior to project commencement and after project completion. The average incidence monitoring period prior to project commencement was 1795 days (i.e., 4.9 years) and the average incidence monitoring period after project completion was 2573 days (i.e., 7.0 years). The average monitoring time therefore exceeded the time (3 years) recommended by Ambros for determining the long-term mean value [26]. Separate analyses were done for the reduction of fatalities, serious injuries, light injuries and incidence of traffic accidents as such. The results are shown in Table 3.
Table 3.
Summary values prior to and after project and ex-ante target values (all figures are p.a.).
The analyses show no significant impact on the incidence of traffic accidents. The average annual number of accidents total dropped by 10.4%, but when taking the change in the reporting method in 2009 into account (see above), the change is absolutely marginal. The number of fatalities and heavy injuries remained unchanged. The slight growth in fatalities by 4.8% and decrease in serious injuries by 0.4% (comparison of all annual values) lies within statistical errors. The total number of light injuries saw a more distinct growth by 17.8%. It is obvious based on the summary data that ex-ante target values regarding lower incidence of traffic accidents as a result of project implementation could not be reached. The CBAs assumed almost complete elimination of fatalities, but this did not happen—their number has not changed after project completion. The deviation in the original estimation therefore reaches 900%. The target value in serious and light injuries was about one half of the original volume. Even this goal was missed, because the number of serious injuries did not change and now there are even more light injuries than before. The deviation in estimation was therefore 94.6% for heavy injuries and 105.2% for light injuries. The reduction in the number of traffic accidents did not materialise, even with a big help in the form of the change in accident reporting methodology. The status quo or even a slight increase of the existing numbers shall be assumed without the methodical impacts.
A breakdown of the comparison of ex-ante estimates and ex-post measurements for light injuries, serious injuries an fatalities is shown in Figure 4, Figure 5 and Figure 6. There is a graphic representation of ex-ante estimates and ex-post measurements (actual values recorded). Axis (x) shows the anticipated decrease in the number of injuries/fatalities after project completion. The estimation of the reduction of injuries for all projects was negative, i.e., all projects sit to the left from axis (y). The actual changes, as measured (i.e., difference between injuries prior to project commencement and after project completion), often go to negative values, i.e., the number of injuries/fatalities go up rather than down after project completion. These projects are shown in the figures below the line representing positive impact on incidence of traffic accidents, i.e., below axis (x). The portion of projects where injuries grew at least little when compared with the original situation exceeds 55%, 32% for serious injuries and 20% for fatalities.
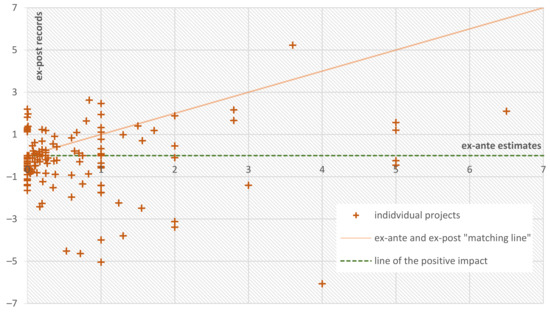
Figure 4.
Comparison of ex-ante and ex-post values representing the reduction in the number of light injuries (p.a. values).
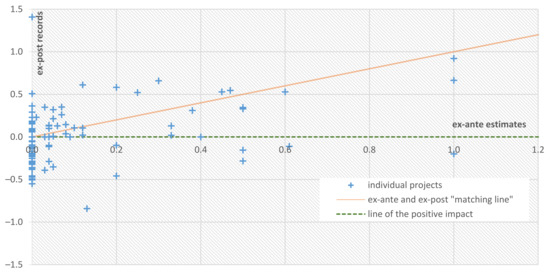
Figure 5.
Comparison of ex-ante and ex-post values representing the reduction in the number of serious injuries (p.a. values).
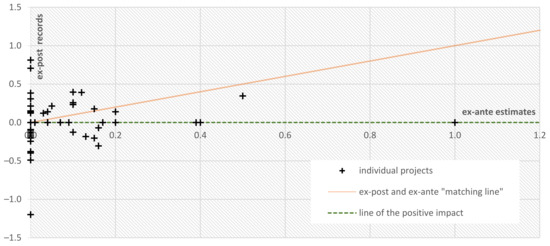
Figure 6.
Comparison of ex-ante and ex-post values representing the reduction in the number of deadly injuries (p.a. values).
The correlation between ex-ante estimate and ex-post measurement is shown in the so-called “matching line”. Projects lying close to this line show no or minimum deviations, meaning that the original estimate was accurate. Projects lying below this line show how overstated the expected positive impact on the incidence was (75% of the projects evaluated). In projects lying above this line the expected positive impact on light injuries was understated (20% of the projects evaluated). The evaluation for serious injuries (Figure 5) and fatalities (Figure 6) is represented in the same manner.
3.3. Impact on NPV and Decision-Making about Project Implementation
The positive NPV as a criterion was only a part of the decision-making process—it was not a pre-condition for project delivery. The total net present value (ex-ante) of all projects was CZK 1081.2 million and the profitability index (weighted average according to investment volume) reached 16.7% (Table 4). One half of the projects (50.0%) achieved positive NPV. The other half reached negative NPV values. As required for this methodology, the investment volume and impact on incidence of traffic accidents according to reality were corrected.
Table 4.
NPV error.
The ex-post correction of the NPV calculation resulted in significantly worse results of all projects. The NPV total for all projects dropped below zero to CZK −256 million. The summary profitability index (weighted average for the entire set) dropped below zero to −2.8%. The average positive NPV in the amount of CZK 7.5 million dropped to −1.7 million. The mean percentage error (MEP) of the NPV is 3.8%. Very high values of minimum and maximum changes were mostly observed in projects with an ex-ante NPV close to zero (i.e., even a small change in NPV can lead to huge changes in the percentage indicator).
The comparison of ex-ante and ex-post NPV shows that the revision of the investment volume and of the negative impact on the incidence of accidents according to reality (and/or ex-post data) had no significant impact on 52 projects (i.e., 36%)—their NPV remained positive. The NPV revision had a critical impact only on 20 projects (14%) where NPV dropped below zero. These projects were partly compensated by 15 projects (10%) where negative NPV increased to positive NPV and their positive impact on the society could be proven only ex-post. Most projects remained in negative values (40%).
The correlation between the ex-ante and ex-post evaluation is represented in the Figure 7 where the profitability index was applied (social rate of return per one investment unit). Projects meeting the conditions of a positive evaluation in the design phase and after construction are shown in the top-right segment (to the right of axis y and at the same time above axis x). Projects where their positive impact on the society could only be proven ex-post lie in the bottom-left segment (to the left of axis y and at the same time above axis x). For projects below axis x, no positive CBA results were proven through quantification (valuation).
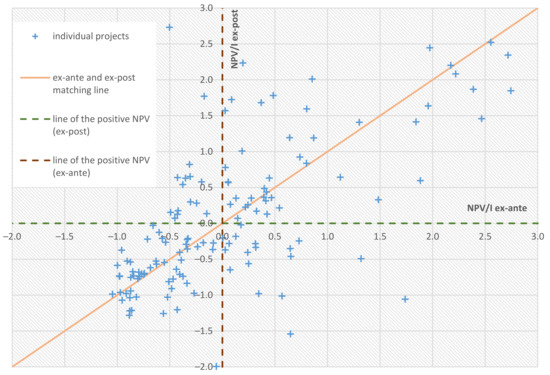
Figure 7.
Comparison of ex-ante and ex-post profitability index (NPV/I).
The change in NPV (and/or the profitability index) would therefore have an impact on project evaluation. Contrary to the NPV/I shift towards the bottom, the points rating grew. The average point gain per one project increased from 3.3 to 3.8 points (Table 5). This fact was due to the way the point system is set up: projects with negative NPV/I results gain zero points (except for a few ratings assigned manually). In the 0–100% range the evaluation is linear and projects with NPV/I over 100% are already evaluated equally, with the same full rating.
Table 5.
Change in NPV results and the points rating.
4. Discussion
The obtained results clearly demonstrate the importance of ex-post CBA for the decision-making process in accordance with the experience described in the literature [1,2,3,6,7,8,9,10,11,12]. The results of the evaluation indicate a reduction in investment costs, a slight negative impact on the incidence of traffic accidents, especially in the number of light and severe injuries and fatalities. The most significant impact on the NPV values is presented by the unfulfilled ex-ante expectations of the reduction of the injuries and fatalities in the traffic accidents.
The average decrease in investment costs by 11.2% contradicts the results published earlier. In Odeck and Kjerkreit an average cost increase of 9.3% on a set of 27 transportation projects in Norway was given, past investigations in Norway showed an average increase of 7.9% [2,27]. Odeck further introduces a meta-analysis of 21 studies investigating the change in investment costs and none of them comes to a negative change (i.e., no investment cost saving) [28]. Flyvbjerg investigated the correlation between the cost increase depending on the size and time of construction and the type of investor [29]. This dependence was confirmed only for construction duration: every year that passed between the moment of decision to build the project and the actual construction increased the investment by 4.64%. On the contrary, Subramani sees the cause of the investment cost increase primarily in project management [30]. The likely cause of the drop in investment costs is corresponding control by the investor and control bodies and/or the impact of the economic cycle (a considerable portion of the projects were tendered at a time when supply was exceeding demand on the building market between 2010 and 2012), as indicated by the negative trend in construction work prices [21,31].
Huge ex-ante expectations of reduction in the number injuries and fatalities remained unfulfilled. The reason can be found in the sense of the modernization. After modernization, the road has a homogenized width dimensions, in many cases the road has been widened. The new pavement is designed with corresponding centripetal cross fall and skid resistance. As part of the modernization, the sight distance is improved, e.g., by reducing road vegetation. The new traffic signs and road marking have a higher retroreflection and are complemented by delineator posts. These facts create a feeling of greater comfort and safety in the drivers, which leads to smoother traffic, but also an increase in average speed. It is the higher speed that brings a higher risk of an accident and it probably compensates the construction benefits. Another factor that could have affected the incidence of traffic accidents may be the increase of traffic volume due to the induction effect, when a newer, higher quality route of the road takes vehicles from the surrounding network. Unfortunately, we are not able to verify this for the evaluated sample of regional roads, because the ongoing data of traffic volume are available in the Czech Republic only for the superior network (highways).
However, we can say that if the incidence of traffic accidents remained the same after project completion but traffic is now more smooth, the project would have a positive impact. The fact that speed/smooth traffic can have an impact on the number of accidents prior to and after project completion can be seen in the different values of the mean incidence values p.a. where the numbers are broken down into rural areas (undeveloped land) and urban areas (developed land). The number of accidents decreased in urban areas by 1.74 p.a., while it grew by 0.6 in out-of-town areas.
These findings can be supported by the evaluation of correlation between relative number of The Figure 8 shows the positive effect of modernized crossroads on the number of people with injuries. A parameter of the number of crossroads per 1 km was created for each modernized road. It is obvious that in sections with a larger number of crossroads there is a reduction in the number of injuries and fatalities.
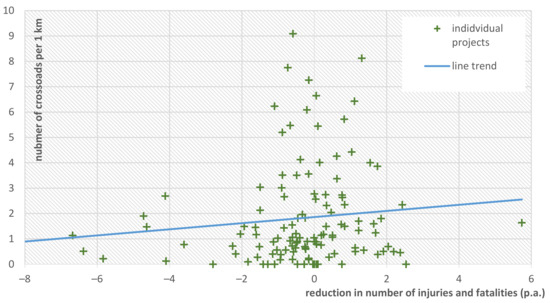
Figure 8.
Reduction in number of injuries and fatalities in correlation to relative number of crossroads.
In accordance with the study results, positive impact on the incidence of traffic accidents should not be used as a general argument for the implementation of regional road modernization projects. The consideration of the anticipated accident reduction in the assessment (CBA) should be conditional on a safety audit of a specific section, including a specific assessment of the possible effects on incidence of traffic accidents and taking into account the real conditions at the site. In general, it can be assumed that a positive effect on incidence of traffic accidents can be expected mainly in connection with the elimination of the spot defects (unsatisfactory crossroads etc.).
A similar study conducted on a set of 27 road projects in Norway shows an opposite trend in the incidence of traffic accidents [2]. This fact is probably due to the structure of projects. While the evaluated set only includes projects for the modernization of regional roads, the study in Norway included mainly large road projects such as sub-sea tunnels, bypasses and trunk roads. This question may be further investigated. Further investigation should focus on the changes in the incidence of traffic accidents in connection with the implementation of the modernization of the national roads and highways. Alternatively, it would be relevant to make a comparison with the construction of new roads.
5. Conclusions
The ex-post CBA was prepared for a set of 144 regional road modernisation projects in the Czech Republic. The main objective of the evaluation was to verify the real impact of the implemented projects in comparison to its ex-ante goals. The verification was aimed at the investment costs and the incidence of traffic accidents. The ex-post data was used to rectify the ex-ante CBA results. The purpose of the study is to improve the decision-making process concerning the regional roads maintenance and modernisation.
The ex-post verification of the incidence of traffic accidents was performed with use of the Czech Republic Police database and was based on an analysis prior to and after project completion. Ex-post values of injuries and fatalities were measured slightly higher prior to project completion, although the aim of the project was to increase the degree of safety. The improvement of the technical condition of the infrastructure may result in increase in speed with negative effects on incidence of traffic accidents. This argument is also supported by the results of evaluation depending on the implementation of projects in urban and rural areas and the results of projects evaluation in relation to the relative number of crossroads in the individual projects. The goals declared for the project were an almost complete elimination of all accidents with a fatality and accidents with serious or light injuries, but these goals were missed.
The ex-post verification of investment costs brought very surprising results, and these results were different than in past investigations. Contrary to all expectations, the actual investment cost was lower in total terms by 11%.
The impact on the CBA result is significant, the weighted profitability index for the entire set of projects dropped from 16.7% to −2.8%. However NPV did not change dramatically in 75% of the projects. The results bring a clear recommendation for the reconstruction and modernisation of existing regional roads: impact on the incidence of traffic accidents shall not be taken into account in the CBA. The exceptions should be fully justified by safety audit or similar assessment.
In general, the results demonstrate the importance of ex-post evaluation of projects in order to improve the decision-making process in the future. At the application level, it was not possible to prove the positive effect of the modermisation of regional roads on the reduction of accidents, although this impact was ex-ante widely expected.
The potential users of the evaluation results are mainly local and regional authorities responsible for the maintenance and modernisation of the regional roads. An important group of users of the results of the evaluation are also the managing authorities responsible for the implementation of national and international resources in the field of road infrastructure development or regional development in general. The methodology could also be adapted for the evaluation at the national level and can provide a stimulus for further research on the correlation between road infrastructure modernization and number of accidents. The research could be applied in the national or general methodologies for the evaluation of investment projects in the field of transport infrastructure. The findings can improve the telling value of CBAs, make the decision-making process easier and improve the efficiency of road maintenance and modernisation cost.
Author Contributions
Conceptualization, P.H. and M.R.; methodology, P.H., R.M. and M.R.; validation, P.H., R.M. and M.R.; formal analysis, P.H.; investigation, resources, data curation, P.H., R.M. and M.R.; writing—original draft preparation, P.H.; writing—review and editing, R.M. and M.R.; visualization, P.H.; supervision, R.M. and M.R.; project administration, R.M. All authors have read and agreed to the published version of the manuscript.
Funding
This research received no external funding.
Acknowledgments
We would like to thank the Regional South-East Cohesion Government Office for their data.
Conflicts of Interest
The authors declare no conflict of interest.
Appendix A
Table A1.
List of projects evaluated.
Table A1.
List of projects evaluated.
| Project | Section Length (km) | NPV, Ex Ante (CZK Million) | NPV, Ex-Post (CZK Million) | MPE (NPV) | MAPE (NPV) |
|---|---|---|---|---|---|
| III/3657 Letovice, bridge 3657-3 | 0.01 | 0.0 | −1.9 | −5521.2% | 5521.2% |
| III/4135 Rybníky bridge 4135-3 | 0.01 | −11.7 | −12.9 | 10.6% | 10.6% |
| II/379 Lipůvka—Blansko, bridge 379-023 | 0.03 | −29.7 | −18.8 | −36.7% | 36.7% |
| III/3771 Předklášteří bridge 3771-3 | 0.03 | −42.3 | −42.5 | 0.4% | 0.4% |
| II/129 Humpolec—bridge 129-011 | 0.06 | 52.5 | 55.4 | 5.5% | 5.5% |
| III/4206 Pouzdřany, bridge 4206-2 | 0.07 | −43.5 | −10.8 | −75.1% | 75.1% |
| II/408 roundabout Kuchařovice II/399 | 0.10 | 2.2 | 9.8 | 355.8% | 355.8% |
| II/397 and III/3974, roundabout Čejkovice | 0.10 | 34.4 | 21.4 | −37.7% | 37.7% |
| II/130 Miletín—bridge 130-011 | 0.10 | 14.5 | 21.2 | 46.5% | 46.5% |
| III/13035 Hořice—bridge 13035-2 | 0.10 | −13.9 | −3.4 | −75.2% | 75.2% |
| II/398 Horní Dunajovice, bridge 398-009 | 0.12 | −7.9 | −9.8 | 24.7% | 24.7% |
| III/3993 Naloučany—bridge | 0.14 | −10.1 | −5.3 | −47.4% | 47.4% |
| III/15280 Modřice bridge | 0.18 | −74.5 | −34.7 | −53.4% | 53.4% |
| II/421 Zaječí bridge 421-010 | 0.25 | −47.8 | −40.1 | −16.2% | 16.2% |
| III/00221 Ladná, bridge 00221-2 | 0.26 | −16.1 | −13.3 | −17.5% | 17.5% |
| II/430 Vyškov through road, bridge 430-017 | 0.27 | −2.5 | −8.8 | 253.6% | 253.6% |
| II/391 Žďárec bridges 391-003, 391-004 | 0.28 | −8.9 | 2.2 | −124.8% | 124.8% |
| II/399 Stropešín—bridge 399-002 | 0.30 | −47.7 | −103.0 | 116.1% | 116.1% |
| II/380 Sokolnice roundabout | 0.33 | −9.8 | 4.5 | −145.9% | 145.9% |
| II/602 hr.kraje—Pelhřimov, 5. phase | 0.35 | −64.0 | −68.7 | 7.4% | 7.4% |
| II/409 Panské Dubenky—bridge 409-016 | 0.38 | 14.9 | 6.7 | −55.2% | 55.2% |
| II/602 Veselka roundabout | 0.40 | −18.5 | −19.0 | 3.1% | 3.1% |
| II/430 Podolí, roundabout | 0.47 | 35.2 | 44.3 | 26.0% | 26.0% |
| II/373 Ochoz through road 2. phase | 0.49 | 3.5 | 4.7 | 33.8% | 33.8% |
| III/03810 Hesov—bridges 03810-006, 007, 008 | 0.53 | 136.6 | 134.9 | −1.2% | 1.2% |
| II/374 Cetkovice through road | 0.55 | −5.0 | 4.4 | −187.6% | 187.6% |
| II/379 Lipůvka through road | 0.56 | −5.4 | 0.7 | −112.4% | 112.4% |
| II/408 Dyje through road | 0.57 | −8.1 | 7.8 | −196.4% | 196.4% |
| II/387 Bořínov—Nedvědice, border bridge 387-012 | 0.65 | −30.3 | −35.6 | 17.7% | 17.7% |
| II/399 Tavíkovice bridge 399-006 | 0.66 | −18.6 | −19.1 | 2.8% | 2.8% |
| II/400 Chlupice bridge 400-007 | 0.66 | −14.7 | −16.1 | 9.6% | 9.6% |
| Lužice through road IV. and V. phase | 0.77 | 30.3 | 12.7 | −58.1% | 58.1% |
| II/413 Prosiměřice bridge 413-014 | 0.80 | −19.5 | −0.6 | −97.2% | 97.2% |
| II/412 Znojmo, bridge 412-001, 412-002 | 0.85 | −55.2 | −43.7 | −20.9% | 20.9% |
| II/431 Vyškov—through road | 0.92 | 9.4 | 22.1 | 133.8% | 133.8% |
| II/422 Čejkovice through road III. phase | 0.94 | 4.3 | 3.5 | −18.7% | 18.7% |
| II/377 Brťov through road | 0.94 | −15.3 | −21.4 | 40.1% | 40.1% |
| II/602 Domašov bridge 602-013 | 0.97 | −33.4 | −20.6 | −38.2% | 38.2% |
| Connection I/38 Znojmo | 1.11 | 25.6 | 41.7 | 62.9% | 62.9% |
| III/37418 Boskovice, Chrudichromská | 1.12 | 1.4 | −11.4 | −909.5% | 909.5% |
| II/427 Moravský Písek II. and III. phase | 1.15 | −33.9 | −53.2 | 57.2% | 57.2% |
| III/4133 Moravský Krumlov through road | 1.17 | −22.2 | 35.5 | −260.3% | 260.3% |
| II/394 Neslovice through road | 1.19 | 27.7 | 12.9 | −53.5% | 53.5% |
| II/405 Zašovice—through road | 1.26 | 0.6 | −7.5 | −1355.1% | 1355.1% |
| II/394 Tetčice through road | 1.28 | 1.6 | 18.1 | 1059.7% | 1059.7% |
| II/422 Čejkovice—through road, phase 1 | 1.40 | 7.2 | 7.9 | 9.8% | 9.8% |
| Reconstruction of road III/4301 Bukovany—through road | 1.46 | 15.1 | 4.5 | −70.5% | 70.5% |
| II/398 Vranov nad Dyjí through road—Onšov | 1.55 | 81.0 | −42.2 | −152.1% | 152.1% |
| II/393 Oslavany—II. and IV. phase | 1.60 | 19.2 | 29.5 | 53.6% | 53.6% |
| II/416, 417 Křenovice through road | 1.61 | −18.6 | −39.4 | 111.5% | 111.5% |
| II/602 Ostrovačice 1. phase | 1.62 | 36.0 | −20.0 | −155.6% | 155.6% |
| II/381 Velké Němčice through road | 1.65 | 12.0 | 26.9 | 124.1% | 124.1% |
| II/432 Ratíškovice through road | 1.66 | 12.5 | 12.5 | 0.2% | 0.2% |
| II/421 Kobylí through road | 1.70 | 9.0 | 7.8 | −12.7% | 12.7% |
| II/408 Dyjákovice through road | 1.73 | −40.6 | −20.2 | −50.4% | 50.4% |
| III/01926, III/01928, III/01929 in Nová Cerekev | 1.75 | −46.3 | −45.9 | −0.9% | 0.9% |
| II/400 Hostěradice—Višňové, I. phase | 1.76 | 9.7 | −10.2 | −205.5% | 205.5% |
| II/360 Štěpánovice—Vacenovice | 1.78 | 6.4 | −10.6 | −266.1% | 266.1% |
| II/425 Nosislav through road | 1.78 | −6.9 | 13.9 | −301.0% | 301.0% |
| II/152 Jamolice—border of the region Vysočina | 1.79 | −3.8 | −7.7 | 102.7% | 102.7% |
| II/398 Mikulovice through road | 1.80 | −51.9 | −53.5 | 3.0% | 3.0% |
| II/150 Havlíčkův Brod—Okrouhlice | 1.81 | 7.2 | 22.5 | 213.5% | 213.5% |
| II/405 Zašovice—Okříšky | 1.85 | −124.9 | −138.0 | 10.5% | 10.5% |
| II/383 Pozořice—Sivice | 1.88 | −15.9 | −22.3 | 39.9% | 39.9% |
| II/360 ul. Rafaelova—Pocoucov | 1.88 | −60.3 | −62.4 | 3.5% | 3.5% |
| II/379 Tišnov—Lipůvka, section Nuzířov—Lipůvka | 1.90 | −0.6 | −34.4 | 5261.7% | 5261.7% |
| II/405 Příseka—Brtnice | 1.92 | −48.8 | −142.9 | 193.1% | 193.1% |
| II/385 Kuřim through road | 1.92 | 102.8 | 111.0 | 7.9% | 7.9% |
| II/152 Jamolice—Polánka up to crossroad III/15250 | 2.00 | −10.6 | −12.5 | 17.7% | 17.7% |
| II/353 D1—Rytířsko—Jamné, 2. phase | 2.02 | 22.7 | 11.2 | −50.5% | 50.5% |
| II/422 Svatobořice—Mistřín, phase 1 | 2.07 | 56.7 | 83.8 | 47.7% | 47.7% |
| II/602 Říčany-Říčky | 2.10 | 0.5 | 15.8 | 3231.4% | 3231.4% |
| II/432 Hodonín roundabout | 2.18 | 29.5 | 13.1 | −55.7% | 55.7% |
| III/42117 Bulhary through road | 2.19 | −6.8 | 35.4 | −620.9% | 620.9% |
| II/422 Svatobořice—Mistřín through road, II. phase | 2.20 | 3.0 | 42.6 | 1311.0% | 1311.0% |
| II/416 Pohořelice through road | 2.21 | 65.4 | 54.6 | −16.6% | 16.6% |
| III/4194 Vážany n/Litavou—Hrušky | 2.26 | −30.4 | −27.9 | −8.3% | 8.3% |
| II/345 Chotěboř—through road, 2. phase | 2.28 | 17.7 | −6.1 | −134.3% | 134.3% |
| II/374 Blansko through road | 2.30 | 283.6 | 303.2 | 6.9% | 6.9% |
| II/379 Lažánky through road | 2.41 | 80.7 | 70.9 | −12.1% | 12.1% |
| II/431, III/4301 Ždánice, Nechvalín through roads | 2.55 | −20.4 | 29.8 | −246.5% | 246.5% |
| II/380 Těšany through road | 2.87 | 14.8 | 80.7 | 444.7% | 444.7% |
| III/3773 Brumov—Bedřichov, bridge 3773-17 | 2.88 | −18.3 | −10.8 | −40.7% | 40.7% |
| III/40819 Hradiště through road | 2.89 | −15.2 | −46.6 | 206.0% | 206.0% |
| II/425 Hustopeče through road, roundabout | 3.00 | 142.3 | 135.1 | −5.1% | 5.1% |
| II/405 Příseka bypass | 3.09 | 60.4 | 63.4 | 4.9% | 4.9% |
| II/421 Bořetice through road—Kobylí | 3.34 | 1.6 | 27.0 | 1599.1% | 1599.1% |
| II/400 Přeskače—through road | 3.36 | −15.5 | 15.7 | −201.3% | 201.3% |
| II/152 Modřice bridges | 3.53 | 55.2 | 72.1 | 30.5% | 30.5% |
| II/395 Zastávka u Brna—border of the region, III. section | 3.58 | 4.8 | 15.1 | 212.6% | 212.6% |
| II/422 Čejč—Čejkovice | 3.67 | −18.4 | −72.3 | 293.9% | 293.9% |
| II/377 Rájec—Bořitov | 3.76 | −34.3 | −52.3 | 52.5% | 52.5% |
| II/347 Světlá n. S.—D1, 2. phase, section 1 | 3.76 | −69.2 | −54.9 | −20.7% | 20.7% |
| II/395 Odrovice through road | 3.84 | 9.0 | 3.7 | −58.5% | 58.5% |
| II/425, III/4217 Hustopeče—Horní Bojanovice | 3.96 | −16.7 | 80.2 | −579.3% | 579.3% |
| II/425 Hustopeče roundabout—Horní Bojanovice | 3.96 | 5.2 | 40.3 | 673.1% | 673.1% |
| II/602 border of the region—Pelhřimov, 4. phase, section 1 | 4.08 | −88.6 | −105.2 | 18.7% | 18.7% |
| II/602 border of the region—Pelhřimov, 7. phase, section 1 | 4.09 | 45.5 | −102.0 | −323.8% | 323.8% |
| II/385 Tišnov—Hradčany—Čebín | 4.10 | 165.1 | 182.0 | 10.2% | 10.2% |
| II/420 Hustopeče—Kurdějov | 4.15 | −18.2 | 10.9 | −160.0% | 160.0% |
| II/432 Ratíškovice—Hodonín, I/55 rural area | 4.28 | 31.6 | −15.6 | −149.5% | 149.5% |
| II/365 Letovice—Horní Poříčí, residential area | 4.45 | −10.1 | 14.5 | −242.8% | 242.8% |
| III/39613 crossroad Pasohlávky—Drnholec | 4.49 | −29.5 | −12.1 | −59.1% | 59.1% |
| II/402 Třešť—crossroad I/38 | 4.50 | 3.1 | −28.8 | −1019.0% | 1019.0% |
| III/4301 Ždánice—Bukovany, phase 1 | 4.77 | −35.7 | −25.6 | −28.3% | 28.3% |
| II/602 border of the region—Pelhřimov, 6. phase | 4.89 | −57.6 | −45.5 | −20.9% | 20.9% |
| II/347 Světlá n. S.—D1, 1. stavba | 5.00 | −145.2 | −203.2 | 39.9% | 39.9% |
| II/602 Popůvky—Ostrovačice | 5.03 | 64.1 | 84.5 | 31.9% | 31.9% |
| II/408 Suchohrdly u Znojma—Přímětice—I/38 (rural areas) | 5.07 | 21.4 | 20.3 | −5.3% | 5.3% |
| II/152 Ivančice—Polánka | 5.26 | 66.6 | 67.4 | 1.2% | 1.2% |
| II/398 Podmyče—Šafov | 5.36 | −21.6 | −29.2 | 35.5% | 35.5% |
| II/402 Batelov—Třešť | 5.50 | −9.8 | −33.9 | 245.7% | 245.7% |
| II/365 Horní Poříčí—Letovice, rural areas | 5.55 | 13.1 | −28.2 | −315.1% | 315.1% |
| II/430 Rousínov—Tučapy | 5.55 | 169.3 | 202.0 | 19.4% | 19.4% |
| II/373, III/37357 Benešov—Žďárná rural area | 5.69 | 7.3 | −33.0 | −552.4% | 552.4% |
| III/3783 Holštejn, bridge 3783-1 | 5.73 | −10.8 | 29.1 | −370.4% | 370.4% |
| II/408 Vranov nad Dyjí—Znojmo, rural area | 5.87 | 14.3 | −158.6 | −1211.5% | 1211.5% |
| II/425 Rajhrad—Židlochovice | 5.97 | 28.5 | 150.6 | 427.7% | 427.7% |
| II/374 Adamov—Bílovice nad Svitavou | 6.97 | −25.1 | −60.4 | 140.5% | 140.5% |
| II/413 Prosiměřice—Suchohrdly, extravilány | 7.23 | 17.0 | −49.9 | −393.4% | 393.4% |
| II/422 Čejkovice—Velké Bílovice | 7.35 | −42.8 | −45.9 | 7.3% | 7.3% |
| II/339 Ledeč nad Sázavou—border of the region | 7.61 | 12.7 | −13.4 | −205.3% | 205.3% |
| II/380 Těšany—Borkovany—Kašnice | 7.89 | 126.8 | 143.6 | 13.3% | 13.3% |
| II/602 hr. kraje—Pelhřimov, 3. phase | 7.91 | −66.3 | −143.0 | 115.6% | 115.6% |
| II/150 Boskovice—Valchov—Žďárná | 8.13 | 37.7 | −21.8 | −157.8% | 157.8% |
| II/424 Mor.Nová Ves—Tvrdonice—Lanžhot | 8.53 | 4.2 | 28.0 | 572.2% | 572.2% |
| II/523 Jihlava—Větrný Jeníkov | 9.19 | −32.5 | −238.0 | 632.7% | 632.7% |
| II/348, II/131 Štoky—Petrovice—Větrný Jeníkov | 9.40 | 231.0 | 11.8 | −94.9% | 94.9% |
| II/523 Větrný Jeníkov—Humpolec | 9.95 | −36.9 | 7.1 | −119.4% | 119.4% |
| II/398 Horní Dunajovice—Mikulovice—Pavlice rural zone | 10.66 | −53.6 | −82.0 | 52.8% | 52.8% |
| II/425 Nosislav—Velké Němčice—Starovičky | 10.73 | 210.7 | 169.3 | −19.6% | 19.6% |
| II/411 Moravské Budějovice—border of the region | 10.94 | −12.5 | −52.4 | 320.1% | 320.1% |
| III/03810 Havlíčkův Brod—Přibyslav | 11.36 | 23.4 | 28.5 | 21.6% | 21.6% |
| II/430 Vyškov through road | 11.41 | 333.4 | 276.3 | −17.1% | 17.1% |
| II/152 Jaroměřice—Hrotovice | 11.58 | −65.3 | −111.7 | 71.0% | 71.0% |
| II/410 from I/23—Želetava | 12.60 | −48.5 | −89.3 | 84.2% | 84.2% |
| II/639 Horní Cerekev—Kostelec | 12.95 | 81.1 | 50.3 | −38.1% | 38.1% |
| II/133 Horní Cerekev—crossroad II/602 | 14.59 | −67.3 | −85.8 | 27.5% | 27.5% |
| II/151, III/15113 from I/38—Budeč+Štěpkov-Budkov | 15.81 | −48.9 | −9.7 | −80.1% | 80.1% |
| II/379 Podomí—Drnovice | 16.16 | 73.7 | 61.9 | −16.0% | 16.0% |
| II/354 Nové Město na Moravě—Svratka | 16.51 | 29.6 | −26.2 | −188.7% | 188.7% |
| II/129 Cetoraz—Jiřičky | 19.71 | −77.1 | −143.7 | 86.3% | 86.3% |
| II/351 from II/602—Třebíč | 22.88 | 68.0 | −126.0 | −285.2% | 285.2% |
| II/360 Jimramov—Moravec | 23.76 | 24.3 | −2.8 | −111.7% | 111.7% |
| total | 564.62 | 1081.2 | −245.0 | 3.8% | 267.2% |
References
- Boardman, A.E.; Mallery, W.L.; Vining, A.R. Learning from ex ante/ex post cost-benefit comparisons: The Coquihalla highway example. Socio-Econ. Plan. Sci. 1994, 28, 69–84. [Google Scholar] [CrossRef]
- Odeck, J.; Kjerkreit, A. The accuracy of benefit-cost analyses (BCAs) in transportation: An ex-post evaluation of road projects. Transp. Rev. Part A Policy Pract. 2019, 120, 277–294. [Google Scholar] [CrossRef]
- European Commission. Transport/Task 3—Major Project Case Studies Work Package 5/Ex Post Evaluation of Cohesion Policy Programmes 2007–2013, Focusing on the European Regional Development Fund (ERDF) and the Cohesion Fund (CF). Available online: https://ec.europa.eu/regional_policy/sources/docgener/evaluation/pdf/expost2013/wp5_task3_en.pdf (accessed on 10 February 2020).
- eCBA s.r.o. Regional South-East Cohesion Government Office. System for Financial and Economic Evaluation of Regional Development Projects. 2008. Available online: https://cba.jihovychod.cz/ login.aspx?ReturnUrl=%2f (accessed on 1 December 2019).
- European Commission, Directorate-General for Regional and Urban Policy. Guide to Cost-Benefit Analysis of Investment Projects—Economic Appraisal Tool for Cohesion Policy 2014–2020. Available online: https://ec.europa.eu/regional_policy/sources/docgener/studies/pdf/cba_guide.pdf (accessed on 10 December 2019).
- Anguera, R. The Channel Tunnel—An ex post economic evaluation. Transp. Rev. Part A Policy Pract. 2006, 40, 291–315. [Google Scholar] [CrossRef]
- Börjesson, M.; Jonsson, R.; Lundberg, D. An ex-post CBA for the Stockholm Metro. Transp. Rev. Part A Policy Pract. 2014, 70. [Google Scholar] [CrossRef]
- Jong, G.; Vignetti, S.; Pancotti, C. Ex-post evaluation of major infrastructure projects. Transp. Res. Procedia 2019, 42, 75–84. [Google Scholar] [CrossRef]
- Welde, M.; Volden, G. Measuring efficiency and effectiveness through ex-post evaluation: Case studies of Norwegian transport projects. Res. Transp. Bus. Manag. 2018. [Google Scholar] [CrossRef]
- Welde, M. In search of success: Ex-post evaluation of a Norwegian motorway project. Case Stud. Transp. Policy 2018, 6, 475–482. [Google Scholar] [CrossRef]
- Meunier, D.; Welde, M. Ex-post evaluations in Norway and France. Transp. Res. Procedia 2017, 26. [Google Scholar] [CrossRef]
- Nicolaisen, M.; Driscoll, P. An International Review of Ex-Post Project Evaluation Schemes in the Transport Sector. J. Environ. Assess. Policy Manag. 2016, 18. [Google Scholar] [CrossRef]
- Sudiana, I.P. How Effective is Cost-Benefit Analysis in Assisting Decision Making by Public Sector Managers? Case Studies of Two Australian Departments. 2010. Available online: http://www.crawford.anu.edu.au/degrees/pogo/discussion_papers/PDP10-01.pdf (accessed on 12 February 2020).
- Czech Republic Police, Centrum Dopravního Výzkumu V.V.I.; Czech Statistical Office. Statistical Evaluation of Accidents in the Map. Available online: http://maps.jdvm.cz/cdv2/apps/nehodyvmape/Search.aspx (accessed on 28 January 2020).
- Florio, M.; Vignetti, S. The Use of Ex Post Cost-Benefit Analysis to Assess the Long-Term Effects of Major Infrastructure Projects. SSRN Electron. J. 2013. [Google Scholar] [CrossRef]
- Lord, D.; Mannering, F. The statistical analysis of crash-frequency data: A review and assessment of methodological alternatives. Transp. Rev. Part A Policy Pract. 2010, 44, 291–305. [Google Scholar] [CrossRef]
- Czech Republic Police. Statistics of the Incidence of Traffic Accidents. 2019. Available online: https://www.policie.cz/clanek/statistika-nehodovosti-900835.aspx?q=Y2hudW09MTE%3d (accessed on 16 February 2020).
- Czech Statistical Office. Traffic Accidents and Their Consequences in the Czech Republic in the Long Term. 2014. Available online: https://www.czso.cz/documents/10180/20534694/32025414a.pdf/57d484eb-1939-47ad-8fef-f38d6dd2c19e?version=1.0 (accessed on 16 February 2020).
- Knudsen, D.C. Shift-Share Analysis: Further Examination of Models for the Description of Economic Change. Socio-Econ. Plan. Sci. 2000, 34, 177–198. [Google Scholar] [CrossRef]
- Střeleček, F.; Zdeněk, R.; Lososová, J. Shift-Share Analysis of Labour Productivity. In Inproforum 2009; University of South Bohemia in České Budějovice: České Budějovice, Czech Republic, 2009; ISBN1 978-80-7394-173-4. Available online: http://ocs.ef.jcu.cz/index.php/inproforum/INP2009/paper/viewFile/240/233 (accessed on 15 January 2020)ISBN2 978-80-7394-173-4.
- Ministerstvo dopravy ČR a SUDOP PRAHA a.s. Methodology for the Economic Effectiveness Evaluations of Transportation Projects. 2017. Available online: https://www.sfdi.cz/soubory/obrazky-clanky/metodiky/2017_02_rezortni_metodika-komplet.pdf (accessed on 20 November 2019).
- Centrum Dopravního Výzkumu, v.v.i. What Was the Total Cost of Traffic Accidents in 2015? 2016. Available online: https://www.czrso.cz/clanek/dopravni-nehody-nas-v-roce-2015-staly-68-miliard-zemrelo-737-osob/?id=1664 (accessed on 1 December 2019).
- Regional South-East Cohesion Government Office. Evaluation Tables ROP JV Support Area 1.1 Regional Infrastructure Development—Roads. 2010. Available online: http://www.jihovychod.cz/pro-prijemce/aktualni-vyzvy/dokumentace-k-vyzve-1-1/1-1-vyzva-k-20-12-2010 (accessed on 10 February 2020).
- European Commission. Directorate General Regional Policy. Guide to Cost-Benefit Analysis of Investment Projects. 2008. Available online: https://ec.europa.eu/regional_policy/sources/docgener/guides/ cost/guide2008_en.pdf (accessed on 26 February 2020).
- Regional South-East Cohesion Government Office. Form R17—Funding Draw-Down Projection; Regional South-East Cohesion Government Office: Brno, Czech Republic, 2019. [Google Scholar]
- Ambros, J. Jak měřit bezpečnost?—2. část [How to measure road traffic safety?—Part 2]. Road Superv. 2012, 73, 103–105. [Google Scholar]
- Odeck, J. Cost overruns in road construction—What are their sizes and determinants? Transp. Policy 2004, 11, 43–53. [Google Scholar] [CrossRef]
- Odeck, J. Do reforms reduce the magnitudes of cost overruns in road projects? Statistical evidence from Norway. Transp. Rev. Part A Policy Pract. 2014, 65. [Google Scholar] [CrossRef]
- Flyvbjerg, B.; Skamris Holm, M.K.; Buhl, S.L. What Causes Cost Overrun in Transport Infrastructure Projects? Transp. Rev. 2004, 24, 3–18. [Google Scholar] [CrossRef]
- Subramani, T.; Sruthi, P.S.; Kavitha, M. Causes of Cost Overrun In Construction. IOSR J. Eng. 2014, 4. [Google Scholar] [CrossRef]
- Czech Statistical Office. Míra růstu reálného HDP. 2020. Available online: http://apl.czso.cz/pll/eutab/html.h?ptabkod=tec00115 (accessed on 26 February 2020).


Publisher’s Note: MDPI stays neutral with regard to jurisdictional claims in published maps and institutional affiliations. |
© 2021 by the authors. Licensee MDPI, Basel, Switzerland. This article is an open access article distributed under the terms and conditions of the Creative Commons Attribution (CC BY) license (http://creativecommons.org/licenses/by/4.0/).