Article

Rice Husk Compost Production and Use in Mitigating Ammonia Volatilization from Urea

by
Latifah Omar
1,2,*,
Osumanu Haruna Ahmed
1,2,3,
Mohamadu Boyie Jalloh
4 and
Nik Muhamad Abdul Majid
5
1
Department of Crop Science, Faculty of Agriculture and Forestry Sciences, Universiti Putra Malaysia Bintulu Sarawak Campus, 97008 Sarawak, Malaysia
2
Institut Ekosains Borneo (IEB), Faculty of Agriculture and Forestry Sciences, Universiti Putra Malaysia Bintulu Sarawak Campus, 97008 Sarawak, Malaysia
3
Institute of Tropical Agriculture, Universiti Putra Malaysia (ITAFoS), Selangor 43400, Malaysia
4
Faculty of Sustainable Agriculture, Universiti Malaysia Sabah, Sabah 90509, Malaysia
5
Institute of Tropical Forestry and Forest Product (INTROP), Universiti Putra Malaysia, Selangor 43400, Malaysia
*
Author to whom correspondence should be addressed.
Sustainability 2021, 13(4), 1832; https://doi.org/10.3390/su13041832
Submission received: 14 January 2021 / Revised: 30 January 2021 / Accepted: 1 February 2021 / Published: 8 February 2021
(This article belongs to the Section Sustainable Agriculture)

Abstract

:
Using value-added products such as compost in farming systems could enable optimization of nitrogen (N) fertilizers whose world-wide demand is on the increase. The objectives of this study were to: (i) produce compost through co-composting rice husk (RH) with chicken dung slurry (CDS), chicken feed, and molasses, (ii) determine the effects of optimum rate of urea and RH compost on minimizing ammonia (NH3) volatilization, and (iii) determine total N, exchangeable ammonium (NH4+), and available nitrate (NO3) retained in soil following co-application of urea and RH compost. Compost was produced for 60 days by mixing RH, CDS, chicken feed, and molasses at a ratio of 20:1:1:1. The color of RH compost was dark brown and had significant amounts of major nutrients such as N (1.15%), phosphorus (3101 mg kg−1), potassium (2038 mg kg−1), calcium (863 mg kg−1), magnesium (276 mg kg−1), organic matter (OM) (60.67%), organic carbon (35.17%), and humic acids (5.87%). The C/N ratio of the RH compost was 30. The electrical conductivity and pH of the RH compost were 2.79 µS cm−1 and 6.55, respectively, and they were not phytotoxic because paddy seeds were successfully germinated in all of the RH compost extractants. The high cation exchange capacity (CEC) of the RH compost (100.67 cmolc kg−1) at the end of composting was one of the determinant factors that controlled NH3 loss from urea. The effectiveness of the RH compost in minimizing urea-N loss was determined using a close-dynamic air flow system. The RH compost significantly minimized NH3 volatilization because of the high affinity of the RH compost for NH4+. An attestation of this reaction was that the high negative charges due to high CEC and OM of the RH compost temporarily protected NH4+ from being transformed into NH3 gas. Further evidence is the higher soil total N and exchangeable NH4+ for the treatments with RH compost than with urea alone. High quality compost can be produced from RH to reduce urea-N from being lost from urea. For the optimum rate, co-application of 60 g RH compost and 2.9 g urea per trough is recommended to mitigate NH3 volatilization instead of the existing practice (7.3 g urea alone per trough).

1. Introduction

Increases in population and food consumption result in an increase in agro-industrial wastes [1]. According to Wang et al. [2], waste generated from agricultural activities increases approximately 5–10% annually. Agricultural wastes are non-product outputs derived from production and processing of various agricultural materials, including rice husk (RH) and chicken manure. Rice is the second most widely grown crop in the world with a global demand of 477 million tons year−1 and an average per capita consumption of 57 kg year−1 [3,4]. Apart from rice wastes, chicken production from year 2017 to 2018 in Malaysia increased; total production volume of broiler grew from 1664.9 million metric tons to 1707.6 million metric tons [5]. Composting is an important approach to transform agro-waste fractions into useful products such as compost [6] and is generally considered one of the useful methods to sustainably recycle agricultural wastes [7]. The use of co-composting technology has become a preferred method for recycling many agricultural wastes by-products into safer and more stable materials as soil amendment because matured compost reduces the negative effects of unprocessed agricultural wastes [8,9,10]. Compost production using unwanted agricultural wastes is considered green technology that improves plant nutrition, food security, sustainable agriculture, besides minimizing poverty in most developing countries [10]. Thus, to ensure high quality of composts is achieved, it is important to determine the maturity, biological, physical, and chemical properties of composts. The co-composting process involves converting solid organic wastes into humus-like materials that have reduced odor, phytotoxic chemicals, weed seeds, and pathogens [11]. The basic information on suitability of composts before application is found by determining the maturity and stability of composts through a phytotoxicity test [12]. Evaluation of the feasibility and efficacy of composts derived from agricultural wastes not only serves as means of managing the wastes, but also serves as one of the means of improving chemical manufactured nitrogen (N) fertilizers.
Nitrogen contains organic and inorganic N fractions that are readily transformed to reactive N compounds such as nitrous oxide (N2O), nitrate (NO3), nitrite (NO2), ammonia (NH3), and ammonium (NH4+) [13]. Gaseous N emitted from excessive use of urea pollutes the environment, impacts public health, and degrades ecosystems. However, urea has been widely used as the main N fertilizer because its use had contributed to enhancing agricultural productivity in addition to reducing hunger worldwide. Global urea use was heavily concentrated in the United States and Western Europe after which it expanded to regions in Asia and Latin America [14]. Since 2000, new areas of increased urea use in East and South Asia have emerged [15]. United Nations Environment Programme (UNEP) highlighted the importance of managing pollution from urea application apart from biodiversity loss and climate change [16]. Pollution from excessive urea application includes air contamination, soil acidification, soil degradation, water eutrophication, and crop yield reduction [17]. In addition, urea is an expensive input in crop production, whereas reactive N compounds such as nitrogen oxides (NOx) and NH3 are estimated to be major threats to global biodiversity [17]. Research on sustainable N management has expanded, from understanding aspects of the N cycle and specific effects of reactive N to improving efficient uses of N fertilizer and technologies in farming practices [18]. To this end, initial expert communities consisting of agricultural and environmental scientists such as soil, plant nutrition, or biochemistry specialists, have expanded to integrate a broader range of policy and social sciences scholars [19]. The adverse effects of N pollution called for new research questions, including factors of behavioral change among farmers, consumers, and industries, and the need to develop approaches that consider socioeconomic factors and global food chains [20]. Application of urea is related to the need to achieve high crop production that could sustainably feed the increasing world population [21]. Therefore, the goal of farmers is that the target crop takes up the applied urea-N with the maximum efficiency and recovery.
In our previous study on estimating N mineralization from rice husk (RH) compost tested in maize production, retention of soil total N and exchangeable NH4+ were significantly higher in urea amended with RH compost than in urea alone. Also, combined application of urea with RH improved plant N recovery, uptake, use efficiency, and yield of maize grown in tropical acid soils [9]. Based on these premises, it is expected that co-application of RH compost with conventional urea could minimize NH3 volatilization by retaining N in the form of NH4+. Despite being applied as a soil amendment and complement to chemical N fertilizers, there is scanty information on the use of RH compost on mitigating NH3 volatilization from different rates of urea. Our goals in this study are to address the research questions such as: (i) how much RH compost should be used to mitigate NH3 volatilization from urea? (ii) how frequently should RH compost be used to reflect the optimum rate of urea and RH compost on NH3 volatilization? and (iii) how should RH compost be used to accumulate soil total N, exchangeable NH4+, and available NO3 following co-application of urea and RH compost?
In this study, the approach was to produce compost from co-composting of RH with chicken manure, chicken feed, and molasses, after which the RH compost was tested in a NH3 volatilization study. The high sources of organic based N from CDS coupled with high carbon from RH, chicken feed, and molasses reacted during co-composting to produce good quality compost which when applied with urea improves N retention by mitigating N loss via NH3 volatilization. Ammonia volatilization from the excessive use of urea would contaminate the atmosphere through rapid hydrolysis which catalyzes through the enzyme urease to form NH3 and carbonic acid. One of the common practices to reduce NH3 formation is the application of urease inhibitors as additives to urea-based synthetic fertilizers. However, most of the urease inhibitors are acidic, highly corrosive, and expensive. An attempt to produce compost from agricultural wastes is considered a lucrative way to produce cheaper soil organic amendment compared with synthetic urea which has been implicated in environmental pollution. The approach of using RH compost for mitigating N loss from urea via volatilization was because of the acidic nature of the compost (from humic acids formation), besides serving as a source of organic matter (OM). Humic acids (HA) in composts have high cation exchange capacity (CEC) to retain N in the form of NH4+. In addition, NH3 volatilization is higher when the soil pH is above pH 7 because of the equilibrium of NH3 + H2O ⇌ NH4+ + OH as justified by Sigurdarson et al. [22]. Rapid hydrolysis of urea could be mitigated using RH composts because of their high CEC, OM, and HA content.
The focus of the study was on minimizing N loss via NH3 volatilization by amending different rates of urea with different rates of RH compost to improve N availability in soil. The N which will hydrolyze from urea in the form of NH4+ is expected to be attracted to the negative charges of the RH compost and this reaction will prevent NH4+ from being converting into NH3. It is hypothesized that RH compost derived from co-composting RH with chicken dung slurry (CDS), chicken feed, and molasses could be used to prevent urea-N from being volatilized. This hypothesis is based on the assumptions that temporary retention of NH4+ is expected to mitigate NH3 volatilization and leaching of NO3. To confirm the afore-stated hypothesis, this study was carried out to: (i) produce compost through co-composting RH with CDS, chicken feed, and molasses, (ii) determine the effects of optimum rate of urea and RH compost on NH3 volatilization, and (iii) determine accumulations of soil total N, exchangeable NH4+, and available NO3 following co-application of urea and RH compost.
The implications of using RH compost as supplemental material for N retention from urea application is an attempt to delay urea hydrolysis from urea in addition to minimizing formation of NH3 and carbonic acid in soil systems. In our previous work, we confirmed that N in soil is predominantly in the form of organic fractions, which are stored in OM, with less than 5% present in the inorganic forms (NH4+ and NO3), and are available for crop uptake [9]. Owing to the aforementioned findings, our approach was not only limited to determining the effectiveness of the RH compost in mitigating NH3 volatilization, but was also focused on nourishing soil with OM with its application. We also confirmed that the use of RH compost restored and rejuvenated soil N fertility instead of providing essential nutrients directly to the plants. Balanced used of RH and urea have been achieved by determining the optimum rate of RH compost in mitigating NH3 volatilization from different rates of urea. With the reduction of N added from conventional urea application and the inclusion of RH compost at optimum amount, dissolution rate of urea could be prevented by providing negative surface charges from OM complexes of the RH compost to capture N in the form of exchangeable NH4+. Retention of N in the form of exchangeable NH4+ will retard rapid volatilization of N in the form of NH3 and NH4+ will be retained in soil for crop uptake. N will then be released gradually from the urea due to it being temporarily fixed in the form of exchangeable NH4+, which enables synchronization of N supply with crop requirement. The novelty of our research contributes to the scientific literature because incorporation of RH compost with urea at optimum rate provides opportunities for N fertilizer management to accomplish the task of mitigating N loss through NH3 volatilization. Considering that farmers may not be able to afford the high cost of urea, the use of RH compost or the combination with urea could form a major complement to replenish N deficiencies and ensure N availability in soil. Including RH compost in N fertilizer management in a manner that is environmental friendly, abundantly available, and easily degradable in soils to prevent N loss from urea is considered a way to conserve public health, improve the quality of the environment, and promote sustainable agriculture, all at a low cost. Consistent with an increase in the population growth and unprecedented lockdown over the world due to COVID-19 pandemic, incorporation of RH compost in N fertilization management could increase food crop production. The benefits of N management for sustainable development goals are supporting livelihoods by improving N fertilizer efficiency and reducing N loss, using N fertilizer efficiency and biological N fixation to sustain food production, improving public health through better N air and water quality, educating and training in sustainable N management, decreasing NO3 contamination of drinking water and rivers, and decreasing NH3 and NOx emissions to help protect terrestrial biodiversity [16]. This study will also provide information on the mechanism of N releases from different rates of urea amended with different rates of RH compost over conventional urea.

2. Materials and Methods

2.1. Materials for Co-Composting and Their Characterizations

Dry RH was collected from Rumah Belayong Bintulu, Sarawak, Malaysia. The RH was air dried for ten days at a drying yard of the Horticulture Unit of Universiti Putra Malaysia Kampus Bintulu (UPMKB), Malaysia. Air drying was carried out to reduce moisture content and to also ensure that the weight of the RH was uniform. Chicken manure was obtained from Taman Pertanian Universiti, UPMKB, Malaysia to prepare a slurry from it. The CDS was used to adjust the C/N ratio of the compost medium by diluting the chicken manure with distilled water, and this was based on the required moisture content (65%) of the co-composting process. Chicken feed and molasses were included in the co-composting of RH and CDS as sources of energy for microbes and to also fasten the degradation process. The pH of the CDS was determined directly from filtered samples [23]. The method described by Sasaki et al. [23] was used to determine pH of the RH using a ratio of 1:10 (w/v) RH: water. A digital pH meter was used to determine the pH of the RH.
The dry ashing method [24] was used to extract P, K, Ca, and Mg in the RH and CDS. One gram of oven-dried (at 60 °C for 24 h) sample was weighed into a porcelain crucible. The sample was ashed at 300 °C for 1 h, then the temperature was increased to 520 °C and continued for 5 h using a muffle furnace. After ashing the samples, a few drops of distilled water were added to the sample followed by the addition of 2 mL concentrated HCl. The samples were evaporated to dryness in a fume hood using a hotplate. Later, 10 mL of 20% HNO3 was added into the crucible with the sample and placed on a hotplate until the sample’s volume was reduced by half of the initial volume. The sample was filtered using Whatman filter paper No. 2 into a 100 mL volumetric flask and distilled water was added to made up the volume. Exchangeable K, Ca, and Mg were determined using Atomic Absorption Spectrophotometry (AAS) (Analyst 800, Perkin Elmer, Norwalk, CT, USA) and the total was calculated using the formula given:
Exchangeable   cation   ( mg / kg ) = ( AAS   reading ) × ( A / Wt ) × DF
where, AAS = concentration of the extract shown by atomic absorption spectrophotometer, A = initial volume of extractant, Wt = weight of sample used for extraction, and DF = dilution factor.
The molybdenum blue method [24] was used to determine total P. Acid molybdate stock solution (Reagent A) and ascorbic acid stock solution (Reagent B) were prepared for blue color development procedure. A standard P solution (standard solution 1) and standard solution 2 were prepared and used to prepare working solutions ranging from 0 to 0.6 ppm. 0, 1, 2, 3, 4, 5, and 6mL of standard solution 2 were pipetted into 50mL volumetric flasks using a micropipette and added with 8mL of Reagent B to develop the blue color. Then, 4mL of the supernatant was pipetted into a 50mL volumetric flask. Reagent B of 8mL was added to develop the blue color. The solution was diluted to mark with distilled water until the blue color was developed [24]. The absorbance was measured at 840 nm. Standard curve was prepared by pipetting 0, 1, 2, 3, 4, 5, and 6mL of the P standard solution into 7 series of 50mL volumetric flasks. The color adsorption was determined using a UV/Vis spectrometer (Lambda 25, PerkinElmer) at 882 nm wavelength. The concentration of P in solution was determined using the following formula:
P   ( mg / kg ) = ( UV   reading ) × ( 50   mL / A ) × ( B / Wt )
where, A = volume of extractant used for blue color development, B = initial volume of extractant, and Wt = weight of sample used for extraction.
Total C and OM of the RH were determined using the loss-on-ignition method [24]. The sample was placed in an oven to be dried at 60 °C for 24 h and cooled in a desiccator. The initial mass of the sample and porcelain crucible was taken. The sample was placed in a muffle furnace and initially ashed at 300 °C for 1 h. Then, the temperature was raised to 550 °C and ashing was continued for 8 h. The sample was left to cool down and the total of organic matter and organic carbon were calculated as follows:
Total   OM   ( % ) = A B / A × 100
Total   C   ( % ) = Total   OM   ( % ) × 58 / 10
where A = initial weight of sample before ashing and B = weight of sample after ashing.
The loss of weight represented the weight of C and OM content was estimated by multiplying organic matter value; whereby 58% of OM is C [24].
Total N was determined using Kjeldhal method [25]. A 0.1 g the sample was placed in a digestion tube and moistened with three drops of distilled water followed by 5 mL concentrated H2SO4. One tablet of Kjeldahl catalyst was added and the sample was shaken and equilibrated for 30 min. The sample was heated in a digestion block at 180 °C for 1 h before continuing with the digestion for 4 to 5 h at 320 °C until the sample was colorless. The sample was left to cool. Afterwards, 30 mL of distilled water were added to the sample, transferred into a 100 mL volumetric flask, and made up to volume using distilled water. Ten mL of aliquot were pipetted into a distillation flask. Then, 10 mL of 40% NaOH were added to the aliquot. The solution was distilled for 5 to 10 min and the distillate was collected in a 50 mL conical flask containing 10 mL 2% boric acid-indicator solution. If the sample had N, the color of the boric acid would change from purple to green during distillation. The 50 mL conical flask containing the distillate was removed when twice the original volume (20 mL) was obtained. The distillate was titrated using 0.01 M HCl until the color changed from green to purple. The volume of the acid used in the titration was recorded. Total nitrogen was calculated based on the following equation:
Total   N   ( % ) = [ ( V B ) × M × R × 14.01 ] / ( Wt × 1000 ) × 100
where, V = volume of acid used for samples titration, B = volume of acid used for blank titration, M = molarity of acid used for titration, R = ratio of volume of initial sample to the volume of sample used for distillation, Wt = weight of air-dried soil/sample, and 14.01 = atomic weight of N.
The method described by Keeney and Nelson [26] was used to extract exchangeable NH4+ and available NO3 after which the ions were determined using steam distillation [25]. A 5 g of sample was weighed into a 100 mL plastic vial. Then, 50 mL of 2 M KCl solution were added and shaken at 180 rpm for 1 h using an orbital shaker. The supernatant was filtered using Whatman filter paper No. 2 into a plastic vial. Then, 20 mL of the filtrate was pipetted into the distillation flask and 0.2 g magnesium oxide (MgO) was added. The distillation flask was connected to a distillation unit to distillate the sample. About 10 mL of 2% boric acid plus indicator solution was pipetted into a 50 mL conical flask and placed at the end of the condenser in the distillation apparatus. This was to receive the NH3 gas released. The distillate was titrated using 0.01 M HCl solution. The amount of titration acid used was recorded and exchangeable NH4+ calculated. After the distillation of NH4+-N, the similar sample was used for the available NO3-N determination. Then, 0.2 g of the Devarda alloy was added into the sample. Another 50 mL conical flask was used as a receiving flask which was filled with 10 mL of 2% boric acid plus indicator solution. The distillate was titrated using 0.01 M HCl solution. The amount of titration acid used was recorded and the available NO3 calculated as followed:
NH 4 + + / NO 3 ( mg / kg ) = ( V × M × 14.01 / Vd ) × 100 % × 10 , 000
where, V = Volume of 0.01 M HCl used for titration (mL), M = Molarity of HCl solution, 14.01 = Atomic mass of N, and Vd = Volume of filtrate used for distillation (mL).
Cation exchange capacity (CEC) was determined using the ammonium acetate (NH4OAc) method [24]. The leaching tube was filled with Whatman ashless floc and covered with filter paper Whatman No. 2. Next, 10 g of air-dried sample was placed in the tube and covered with filter paper Whatman No. 2. The sample was leached using 100 mL of 1 M NH4OAc for 6 h. The leachate was discarded after collection. Afterwards, a similar sample was leached with ethanol (95%) to remove the excess amount of NH4+ in the sample. The ethanol leachate was discarded after collection. Then, the sample was leached with 0.1 M potassium sulphate (K2SO4). Distilled water was used to make up the volume. Steam distillation of the leachate was carried out to determine the CEC. Next, 10 mL of leachate was pipetted into a distillation flask followed by the addition of 10 mL 40% NaOH. The solution was distilled for 5 min and the distillate was collected in a 50 mL conical flask containing 10 mL 2% boric acid-indicator solution. The 50 mL conical flask containing the distillate was removed when twice the original volume (20 mL) was obtained. The distillate was titrated using 0.01 M HCl until the color changed from green to purple. The volume of the acid used for titration was recorded. The CEC was calculated as follows:
CEC ( cmol ( + ) ) kg 1 = V × M × R × ( 1000   kg 1 / Wt ) / 10
where, V = volume of HCL used for titration, M = molarity of HCL used for titration, R = ratio of volume of initial leachate to the volume of leachate used for distillation, and Wt = weight of air-dried sample.

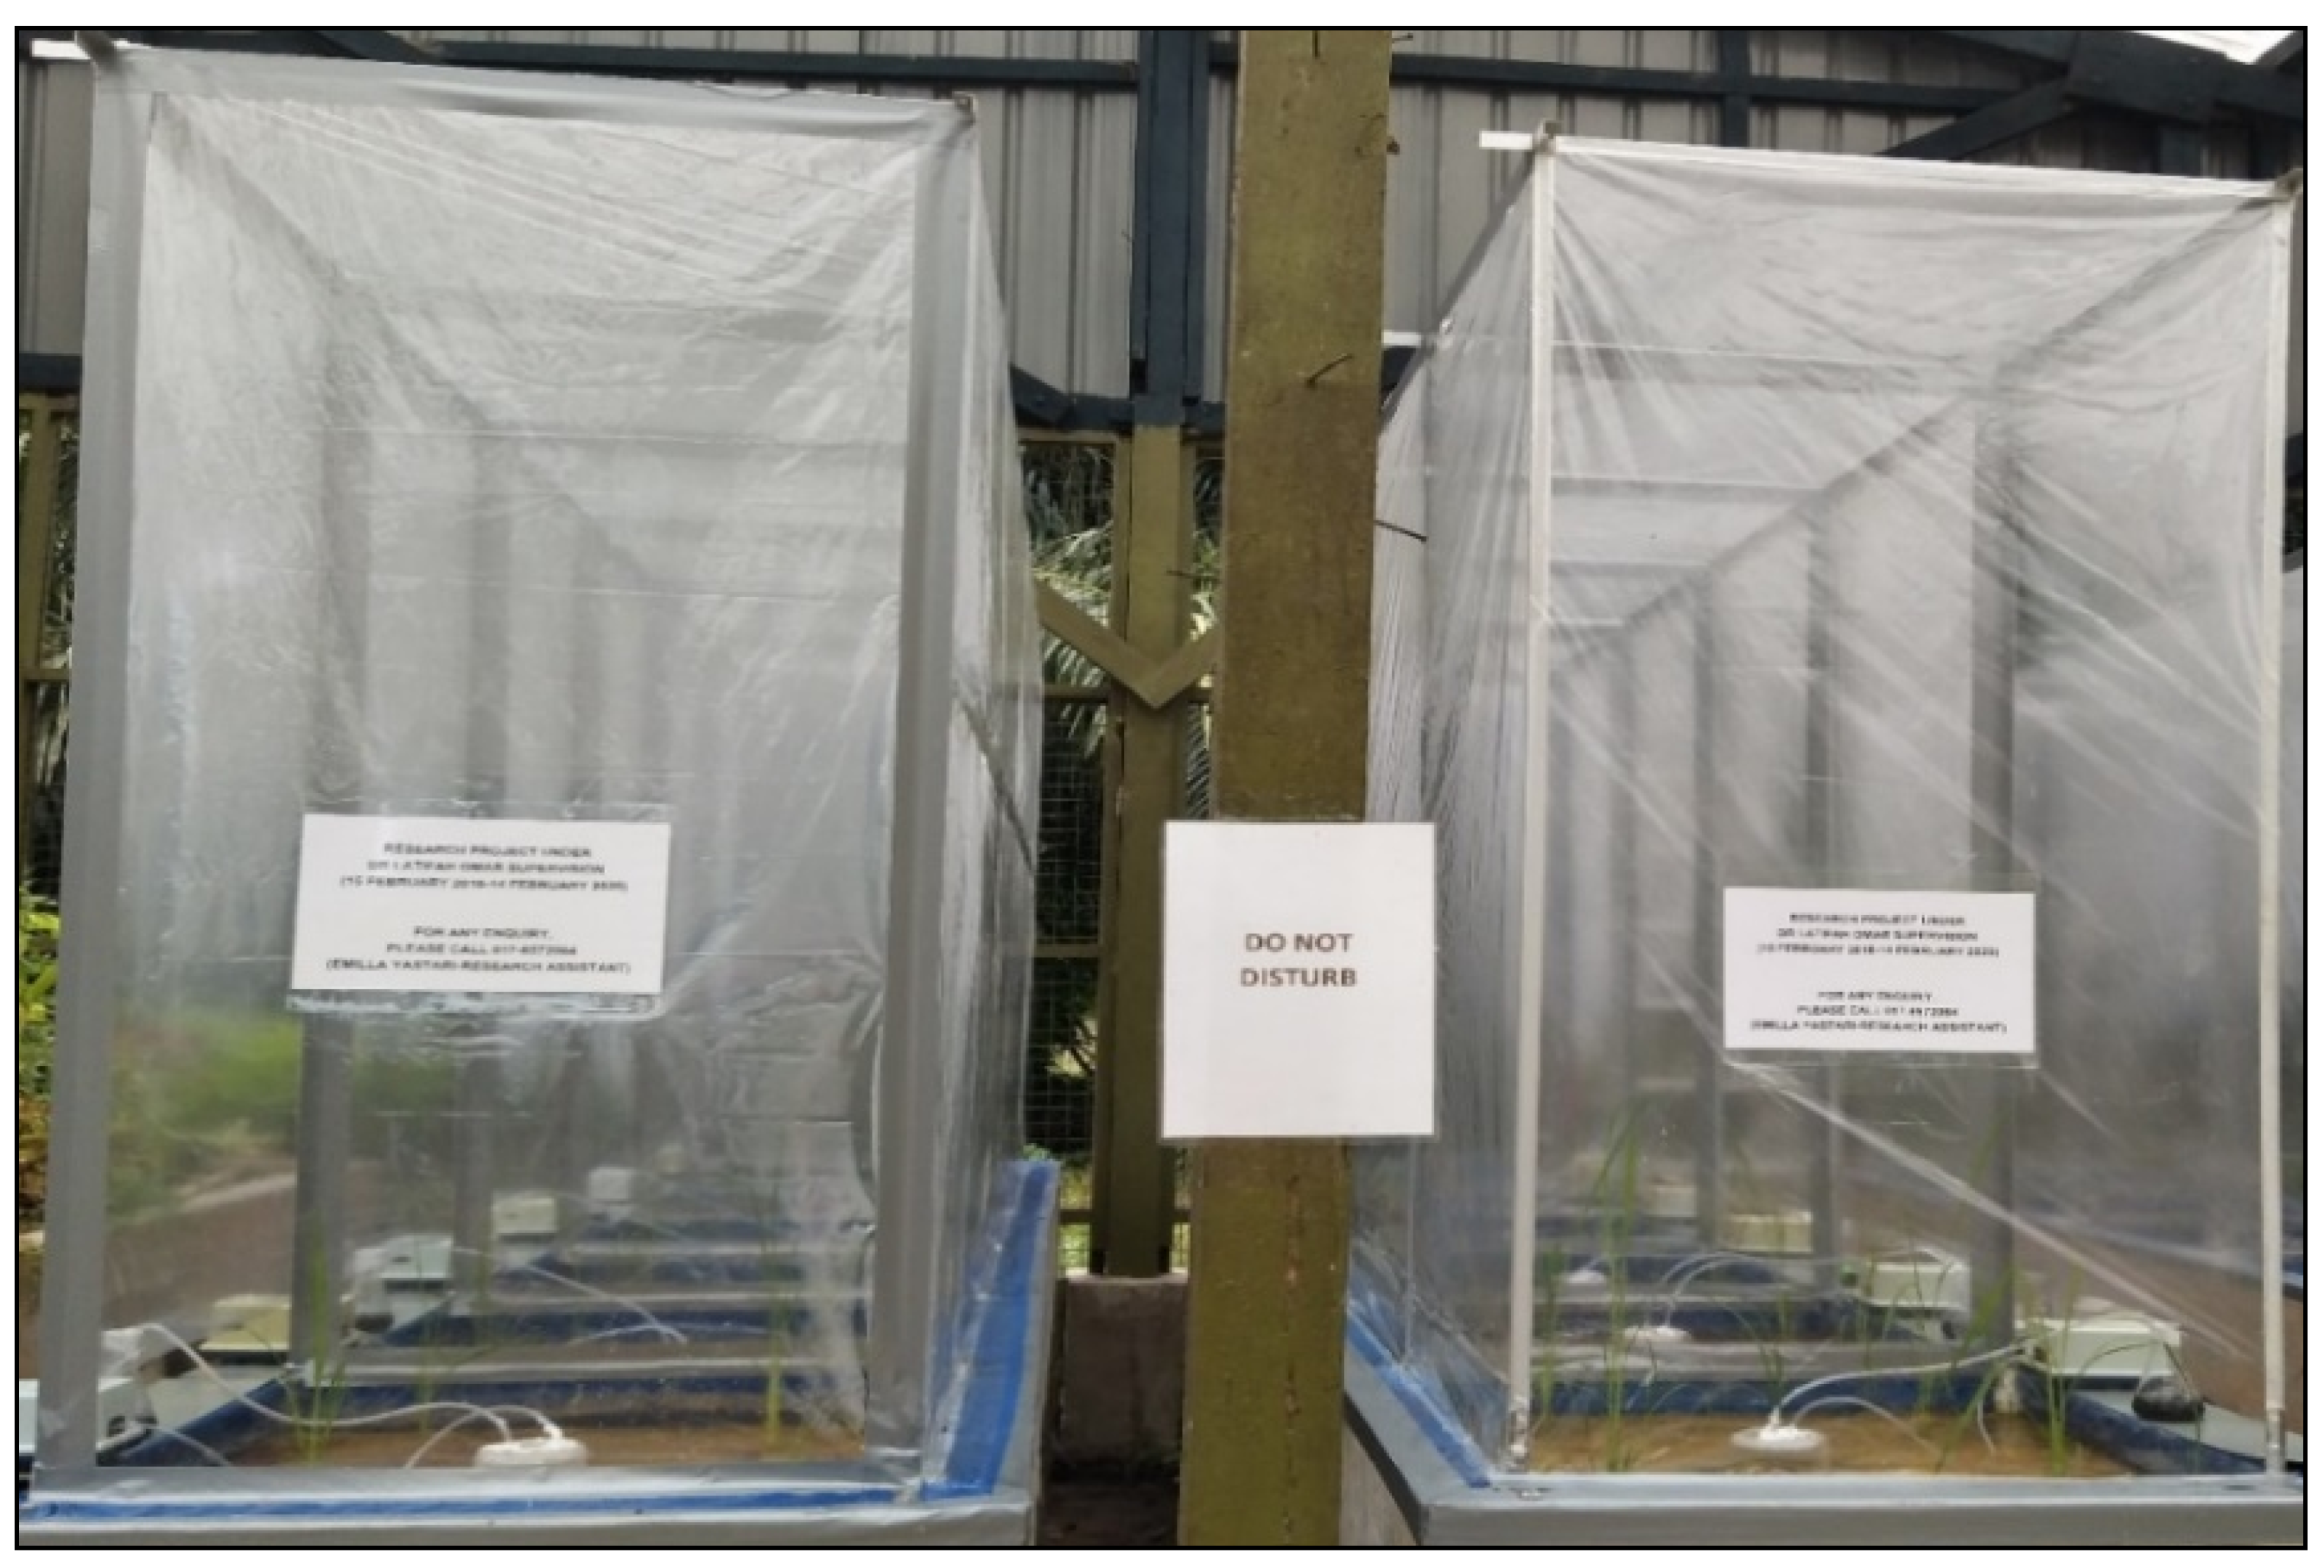
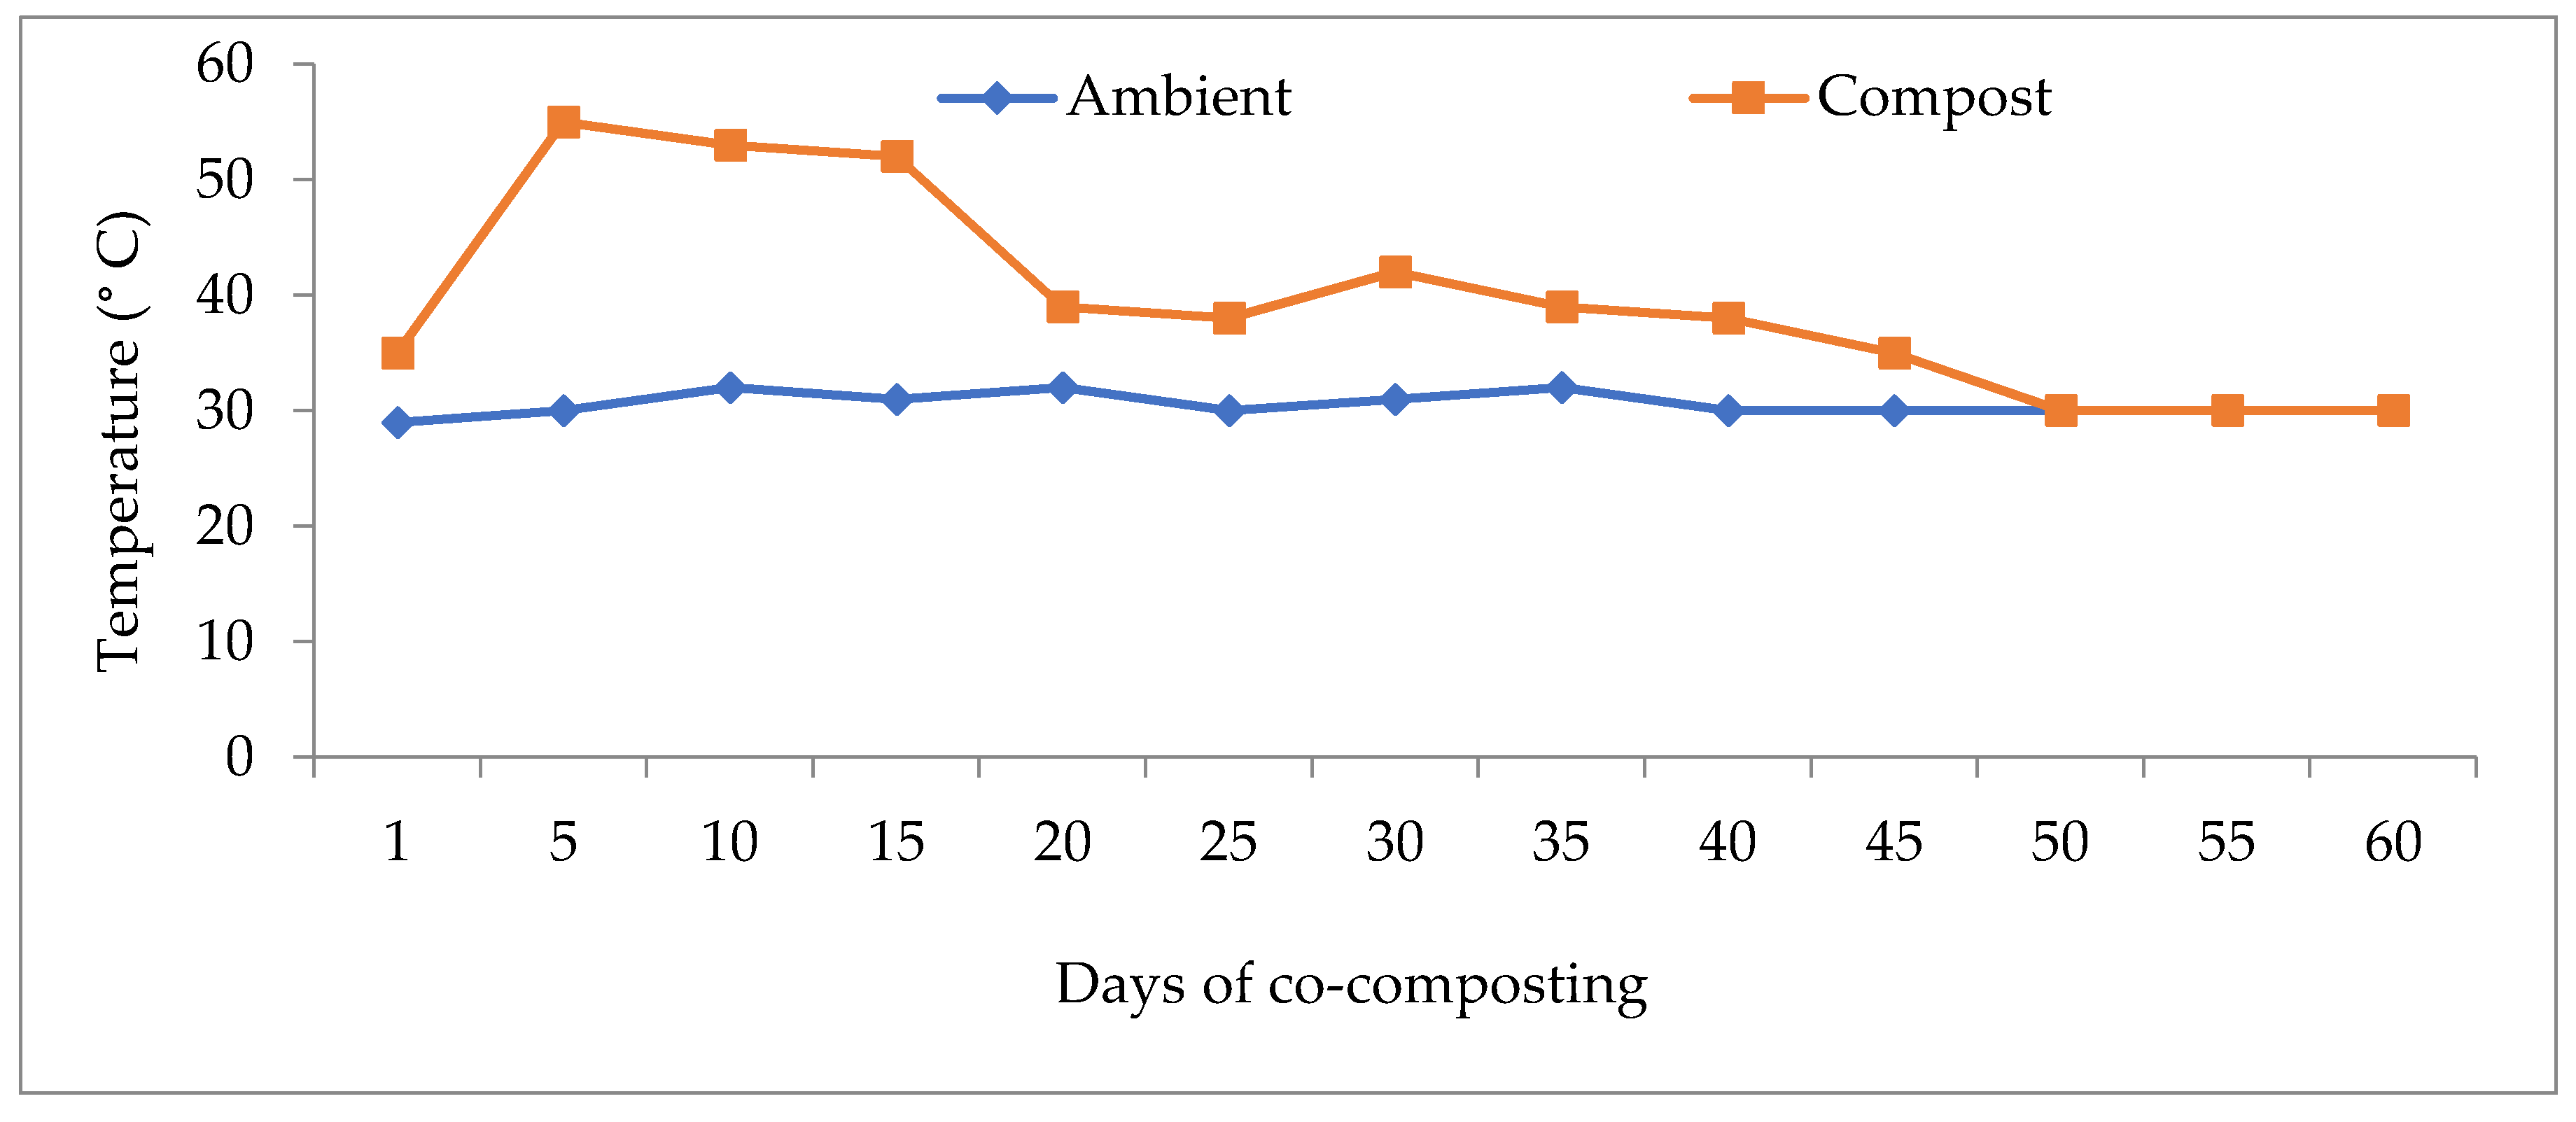
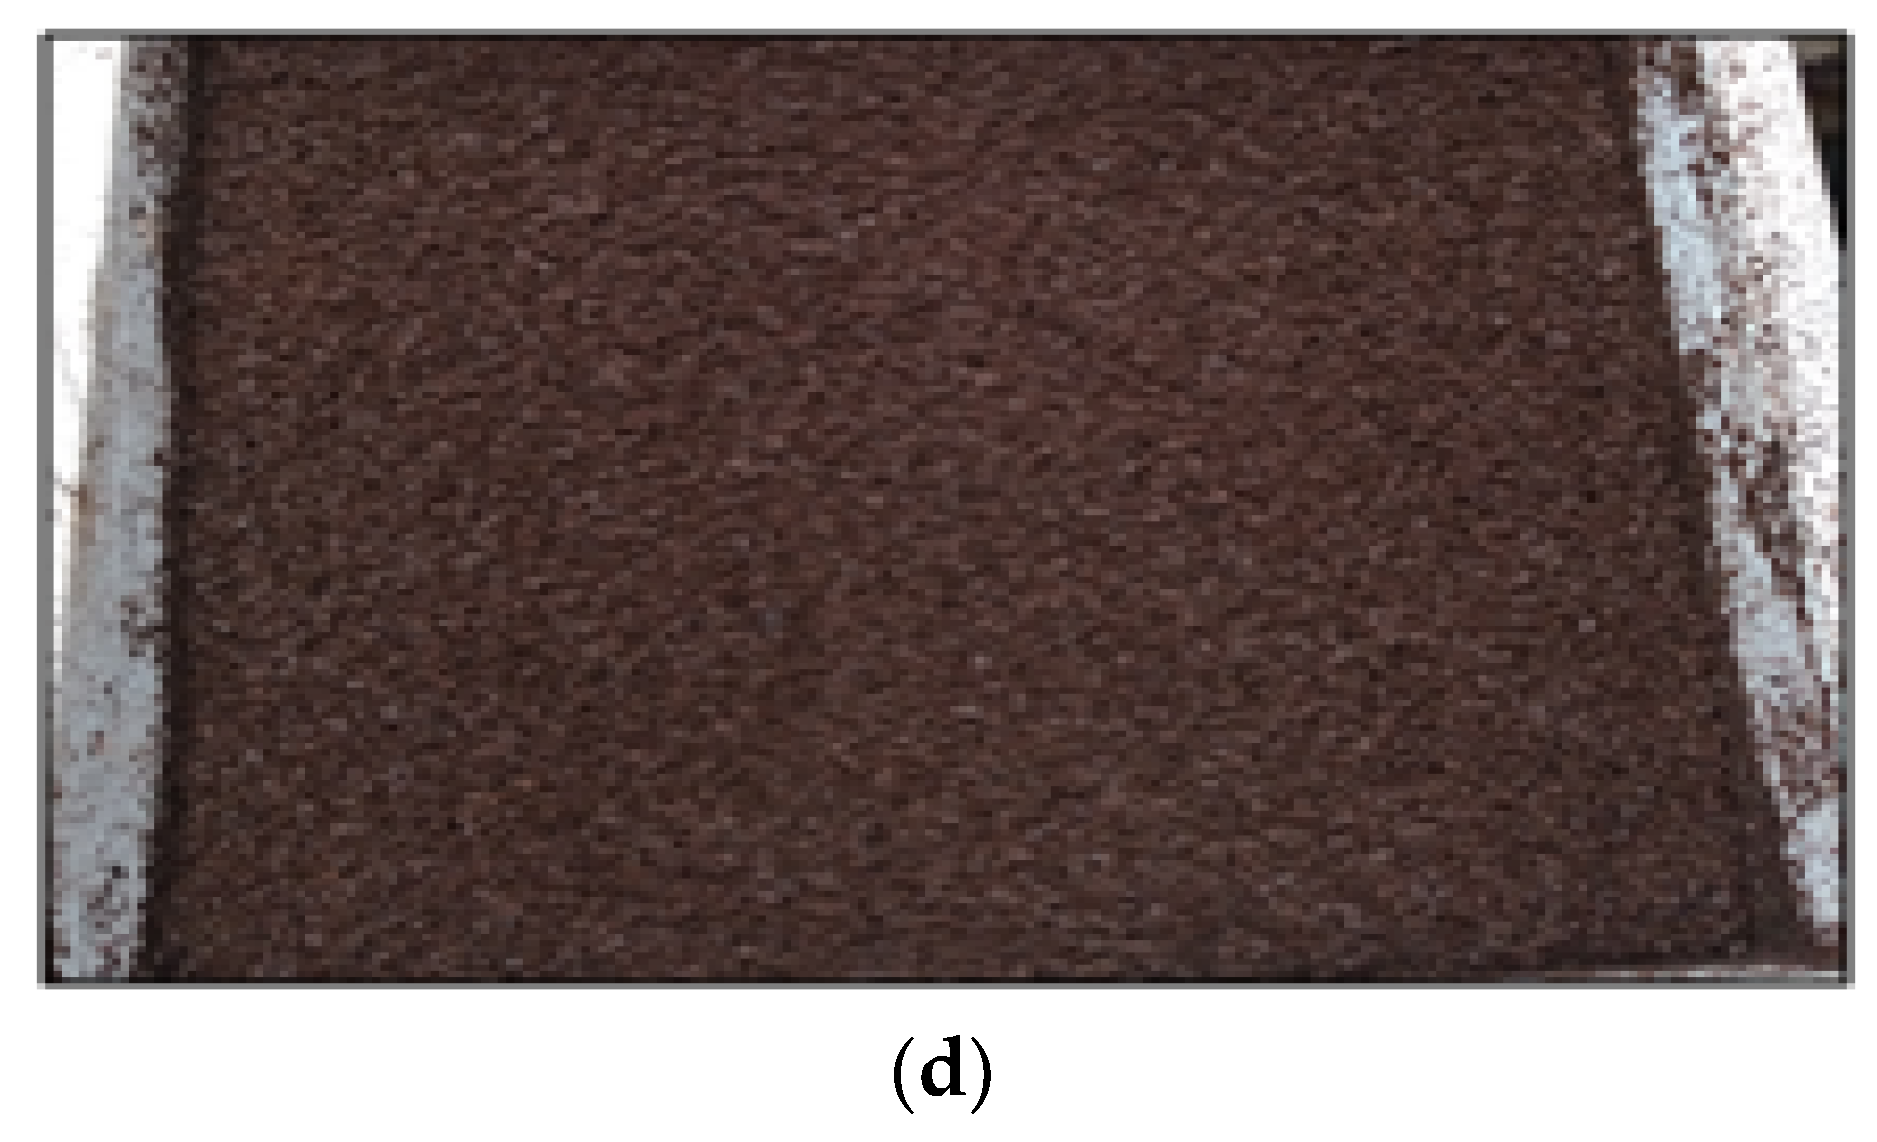
2.2. Co-Composting of Rice Husk and Chicken Dung Slurry

Co-composting of RH and CDS was carried out at Block C, Horticulture Unit, Taman Pertanian Universiti of UPMKB, Sarawak, Malaysia. Approximately 8 kg of air-dried RH, 0.4 kg of chicken feed, and 0.4 kg of molasses were thoroughly mixed in a white polystyrene box. Afterwards, the mixture was sprinkled with 0.4 kg of CDS diluted in a 4.2 L of water. The amounts of the chicken feed, molasses, and CDS used were based on 5% of 8 kg of the RH used. The co-composting of RH and CDS in this present study is almost similar to our previous study [11] but with a modification in the use of additives. In the work of Latifah et al. [11], clinoptilolite zeolite was used for retention of N ions from urea whereas these two materials were excluded in this study. When necessary, turning of the compost was done to maintain adequate moisture and temperature of the compost. Fifteen polystyrene boxes with a length of 38 cm, width of 36 cm, and height of 32 cm were used for the co-composting study. The co-composting was carried out in fifteen replications to minimize error. Ten holes with 2 cm-diameters were drilled on the sides of the boxes to enable good aeration during co-composting. A sample of the mixture of RH, CDS, chicken feed, and molasses before co-composting was analyzed using the standard procedures previously outlined in Section 2.1 (Pages 4–6).

2.3. Characterization of Physico-Chemical Properties of Rice Husk Compost

The RH compost temperature and ambient temperature were recorded from the beginning until the end of the co-composting process. The physical and chemical properties of the compost produced after the co-composting process were determined using standard method as previously outlined (Section 2.1, Pages 4–6). The colors of mixed feedstock (before composting) and the matured compost were compared using the Munsell Color Chart [27]. The samples were moistened with water. The hue of the sample was determined by comparing with the pages in the Munsell color book. The Munsell color notation was recorded and the color name of the sample was identified [27]. The contents of soluble inorganic salts before and after the co-composting process were also determined [24], using the standard method as previously outlined (Section 2.1, Pages 4–6). Then, pH and electrical conductivity (EC) were determined at ratio of 1:2.5 (sample:water (w:v) [24]. A 10 g sample was weighed in a plastic vial and 25 mL of distilled water was added. Afterwards, the plastic vial was tightly closed and shaken for 15 min using an orbital shaker at 180 rpm. Then, the suspension was left for 24 h before the pH was determined using a digital pH meter (SevenEasy pH, Mettler–Toledo GmbH, Bern, Switzerland). After the pH determination, the same sample was used to determine EC using a digital EC meter (SevenEasyTM Conductivity Meter S30, Wellington, New Zealand). Nutrients (total N, P, K, Ca, Mg, NH4+, and NO3), pH, and EC of the RH compost were determined using the methods outlined in Section 2.1., pages 4–6. Carbon to N ratio of the RH compost was calculated by dividing percentage of C with percentage of N.
Humic acid content of the compost was determined using a method described by Palanivell et al. [28]. A 10 g sample and 100 mL of 0.1M KOH solution were placed into a centrifuge bottle at a ratio of 1:10 (w:v). The suspension was shaken at 180 rpm for 24 h at room temperature (about 25 °C). The mixture was then centrifuged for 15 min at 10,000 rpm. The dark–colored supernatant liquid (mixture of crude HA and FA) was decanted. The supernatant liquid was acidified to pH 1 using 6 M HCl and left at room temperature (about 25 °C) for 4 h. Then, it was transferred into a centrifuge bottle and centrifuged at 10,000 rpm for 15 min. The liquid portion (crude fulvic acid) was discarded. The solid portion (residue) in the centrifuge bottle (HA) was purified 5 times using distilled water and centrifuged at 10,000 rpm for 10 min to reduce mineral content and HCl during acidification. Afterwards, the HA was oven–dried at 40 °C until a constant weight was obtained. The yield of HAs was expressed as percentage of the weight of sample used as given:
HAs   ( % ) = [ weight   of   HA   ( g ) / Weight   of   sample   ( g ) ] × 100

2.4. Germination and Plant Bioassay Test of The Rice Husk Compost

Phytotoxicity test was carried out using the germination bioassay method described by Zucconi [29]. Next, 10 g of the RH compost was weighed and mixed with 100 mL of distilled water in triplicates. The samples were shaken for 24 h after which they centrifuged for 20 min at 10,000 G. The supernatant was filtered using Whatman No. 42 filter paper. The extract was diluted three times (10×, 100×, and 1000×) and distilled water prepared as control. Three petri dishes were filled with five mL of each diluted extract and another three petri dishes were filled with five mL of distilled water (control). Ten paddy seeds were placed in each petri dish lined with a Whatman No. 42 filter paper. The petri dishes were kept in the dark. Results were reported as means of the 10 paddy seedlings in triplicates (three petri dishes). Seed germination and measurement of length of roots and shoots were carried out on day seven of germination. The descriptions of the RH compost extractants are given as follows:
  • C: Control (distilled water)
  • E1: Initial extract
  • E2: Initial extract diluted 10×
  • E3: Initial extract diluted 100×
  • E4: Initial extract diluted 1000×
The percentage of germination index (GI), germination (G), relative shoot growth (RSG), relative root growth (RRG) was calculated using given formula:
Germination   Index   ( % ) = ( G × RRG ) × 100
where, G (%) = (Number of seeds germinated in the extract/Number of seeds germinated in the control) × 100%
RRG (%) = (Mean root length in extract/Mean root length in control) × 100%
RSG (%) = (Mean shoot length in extract/Mean shoot length in control) × 100%

2.5. Soil Sampling and Characterizations

The effectiveness of the RH compost produced in controlling urea-N loss via NH3 volatilization was conducted in a close-dynamic air flow system. The soil used in this NH3 volatilization study was sampled at 0–20 cm depth from an uncultivated area at Universiti Putra Malaysia Bintulu Campus Sarawak, Malaysia. The soil was air dried and ground to pass a 2 mm sieve for initial characterization using the standard procedures described by Tan [24] and previously outlined in Section 2.1., Pages 4 to 6.

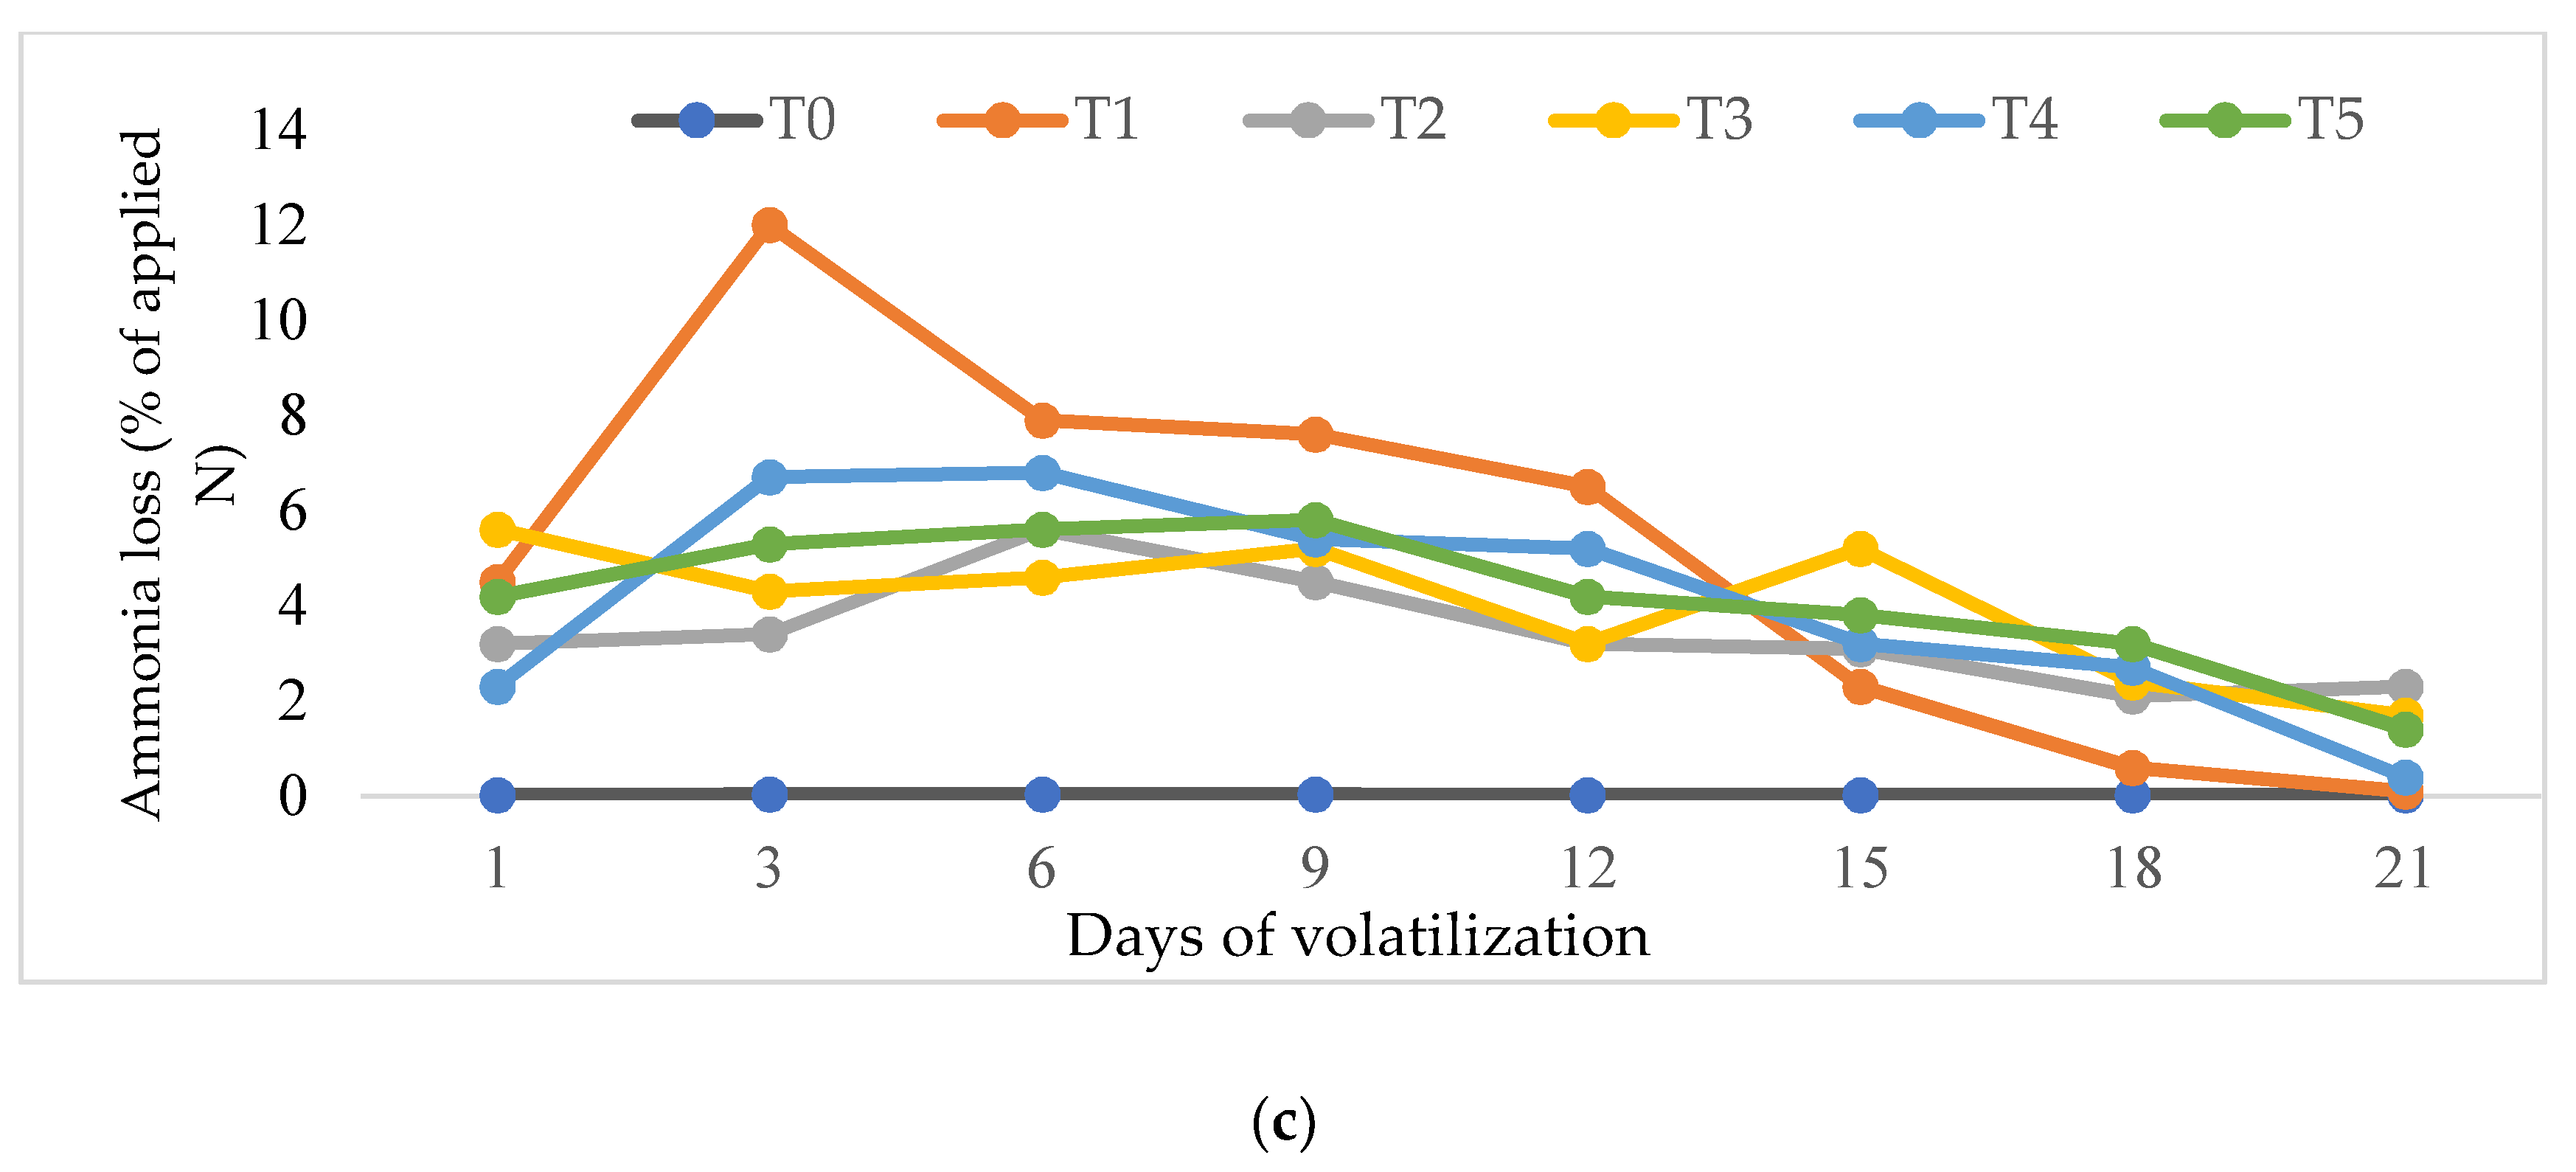
2.6. Ammonia Volatilization Study

The NH3 volatilization study was conducted using a close-dynamic air flow system with a modification (Figure 1) [30]. This system consisted of an exchange chamber (chamber A) with a trough size of 171 cm × 68 cm × 20 cm and a trap chamber (chamber B) with a 500 mL conical flask containing 250 mL of 2% boric acid-indicator solution. These chambers were stoppered and fitted with an inlet and an outlet. The inlet of exchange chamber (chamber A) was connected to an air pump and the outlet was connected by polyethylene tubing to the trap chamber (chamber B) containing boric acid solution to trap NH3 gas emitted from soil water in the trough with swamp rice plants. The NH3 volatilization study was conducted in a semi-closed block at Horticulture Unit of Universiti Putra Malaysia Bintulu Sarawak Campus, Malaysia which had an average temperature of 32.6 °C (ranges from 31.8–34.9 °C) and an average relative humidity of 75% (ranges from 60–85%) (Figure 1).
During the NH3 volatilization study (92 days), water level was maintained at five cm from the soil surface and the chamber was continuously aerated with an aquarium air pump (3.5W Quiet Air Bubbles Pump Kit Oxygen Pump Aquarium Air Pump, Guangzhou, China). Fifteen troughs were used and covered with transparent plastic after which each trough was filled with 60 kg air-dried soil and puddled with 20 L tap water for each of the trough. The treatments evaluated in the NH3 volatilization study per 60 kg soil were:
  • Soil only (T0)
  • Soil + 7.3 g urea (standard recommendation at 100%) (T1)
  • Soil + 7.3 g urea (standard recommendation at 100%) + 20 g compost (T2)
  • Soil + 5.8 g urea (80% of standard recommendation) + 20 g compost (T3)
  • Soil + 4.3 g urea (60% of standard recommendation) + 40 g compost (T4)
  • Soil + 2.9 g urea (40% of standard recommendation) + 60 g compost (T5)
The RH compost for each trough (T2, T3, T4, and T5) was applied 28 days earlier prior to first application of urea (before planting basis). The application of RH compost was based on the recommended rates of 5, 10, and 15 t ha−1 and these were equivalent to 20, 40, and 60 g trough−1, respectively [31]. The rate of urea applied was based on the recommended fertilizer for rice by Muda Agricultural Development Authority, Malaysia [32] which is 151 kg ha−1 N. Urea was applied in the troughs three times throughout 92 days of volatilization study [33] to simulate the practices of paddy cultivation which requires three times fertilization during the cultivation period. First application of urea was carried out at 28 days after planting (DAP), followed by the second and third applications which were 50 DAP and 70 DAP, respectively [33]. It must be noted that the application of RH compost at different rates as complement to urea was done once throughout 92 days of the NH3 volatilization study.
The NH3 captured in a trapping solution, which contained 250 mL of boric acid with bromocresol green and methyl red indicator, was titrated with 0.1 M HCl to estimate the amount of NH3 released in each trough. The boric acid indicators which were used to capture NH3 were replaced every 24 h during the volatilization study for 21 days; a period when NH3 loss was less than 1% [30], particularly in the urea only trough (T1). The daily amount of NH3 loss through volatilization was calculated as follows:
Ammonia   loss   ( % ) = [ ( V × M × 14.01 ) / ( Soil + T ) × ( U × 0.46 ) ] × 100 %
where, V = Volume of 0.01 M HCl used for titration (mL), M = Molarity of HCl solution, 14.01 = Atomic mass of N, T = Treatment added in the soil (g), and 0.46 = % of urea
Temperature and pH of the soil water in the troughs were recorded during the NH3 volatilization study. At 92 DAP (considering the panicle stage of paddy), the soil samples were air-dried and analyzed for pH, total N, available NO3, and exchangeable NH4+ using standard method described by Tan [24].

2.7. Experimental Design and Statistical Analysis

The troughs were arranged in a completely randomized design (CRD) with three replications. Analysis of variance (ANOVA) was used to compare the treatment effects and Tukey′s test was used to compare treatment means at p ≤ 0.05 using the Statistical Analysis System software version 9.4.

3. Results

3.1. Selected Physico-Chemical Characteristic of Raw Rice Husk and Chicken Slurry

The unprocessed RH and CDS used in co-composting were alkaline. Also, the unprocessed RH and CDS were high in TOC, OM, and C/N ratio but low in N, P, K, Ca, Mg, humic acids, NH4+, NO3, and EC (Table 1). The CEC of unprocessed RH was high, but the CEC of CDS was not detectable (Table 1).

3.2. Selected Physico-Chemical Characteristic of Rice Husk Compost

At 60 days of co-composting, temperature of the RH compost demonstrated four common phases which were mesophilic, thermophilic, cooling, and curing. The average ambient temperature was 30 °C throughout the co-composting period (Figure 2). Temperature of the RH compost reached mesophilic phase on the first day and remained constant until day four of co-composting (Figure 2). From day 5 to day 15 of co-composting, temperature of the RH compost increased to the thermophilic phase (48–55 °C). The RH compost temperature gradually decreased to below 40 °C from day 20 to day 25 with a slight increase to 42 °C at day 30. Thereafter, the RH compost temperature continued to decrease from day 35 to day 50, after which it entered the cooling phase. The cooling phase was followed by the curing phase, a stage where the RH compost temperature ranged between 31 °C and 32 °C from day 55 until stabilized at day 60 of co-composting (Figure 2).
The mixture of RH compost showed four different profiles of colors from day one of co-composting to day 55 of the stabilization phase (Figure 3).
Electrical conductivity of the RH compost decreased from 2.79 µS cm−1 to 2.75 µS cm−1 (Table 2). The pH of the RH compost decreased from 7.15 before co-composting to 6.55 after co-composting (Table 2). Cation exchange capacity increased from 79.33 cmol kg−1 before co-composting to 100.67 cmolc kg−1 after co-composting while humic acids (HA) increased from 5.13% to 5.87% (Table 2). Total OC and OM were decreased from 81.33% to 60.67% and 47.17% to 35.19%, respectively (Table 2). The considerable amount of primary plant nutrients such as N (1.15%), P (3101.18 mg kg−1), and K (2038 mg kg−1) and secondary nutrients such as Mg (276 mg kg−1) and Ca (863 mg kg−1) were observed in the RH compost. Carbon to N ratio of the RH compost decreased at the end of the co-composting process whereas, NH4+ and NO3 increased to 128.5 and 83.7 mg kg−1, respectively (Table 2).

3.3. Phytotoxicity Test

Paddy seeds germinated in the RH compost extractants (E1, E2, E3, and E4) and distilled water (control) demonstrated no significant difference in root length, shoot length, seed germination, and relative seed germination of paddy (test crop) (Table 3). Whereas, for the germination index, the values were greater than 90% in all RH compost extractants (E1, E2, E3, and E4) and distilled water (control), suggesting that RH compost is not toxic and safe to be used as germination media (Table 3).

3.4. Soil Characteristics

The soil used in this present study was Bekenu Series (Typic Paleudults) and it is fine loamy, siliceous, isohyperthermic, and red-yellow to yellow. It has an argillic horizon with fine sandy clay loam texture [34]. The argillic horizon is a subsurface horizon B reflected by the illuvial accumulation of silicate clay [35]. The pH of the Bekenu Series soil extracted in water was acidic and low in CEC and OM. The Bekenu Series (Typic Paleudults) soil is considered as an infertile soil with a lack of essential nutrients such as total N, P, and K, and the cations such as Ca, Mg, and NH4+ (Table 4).

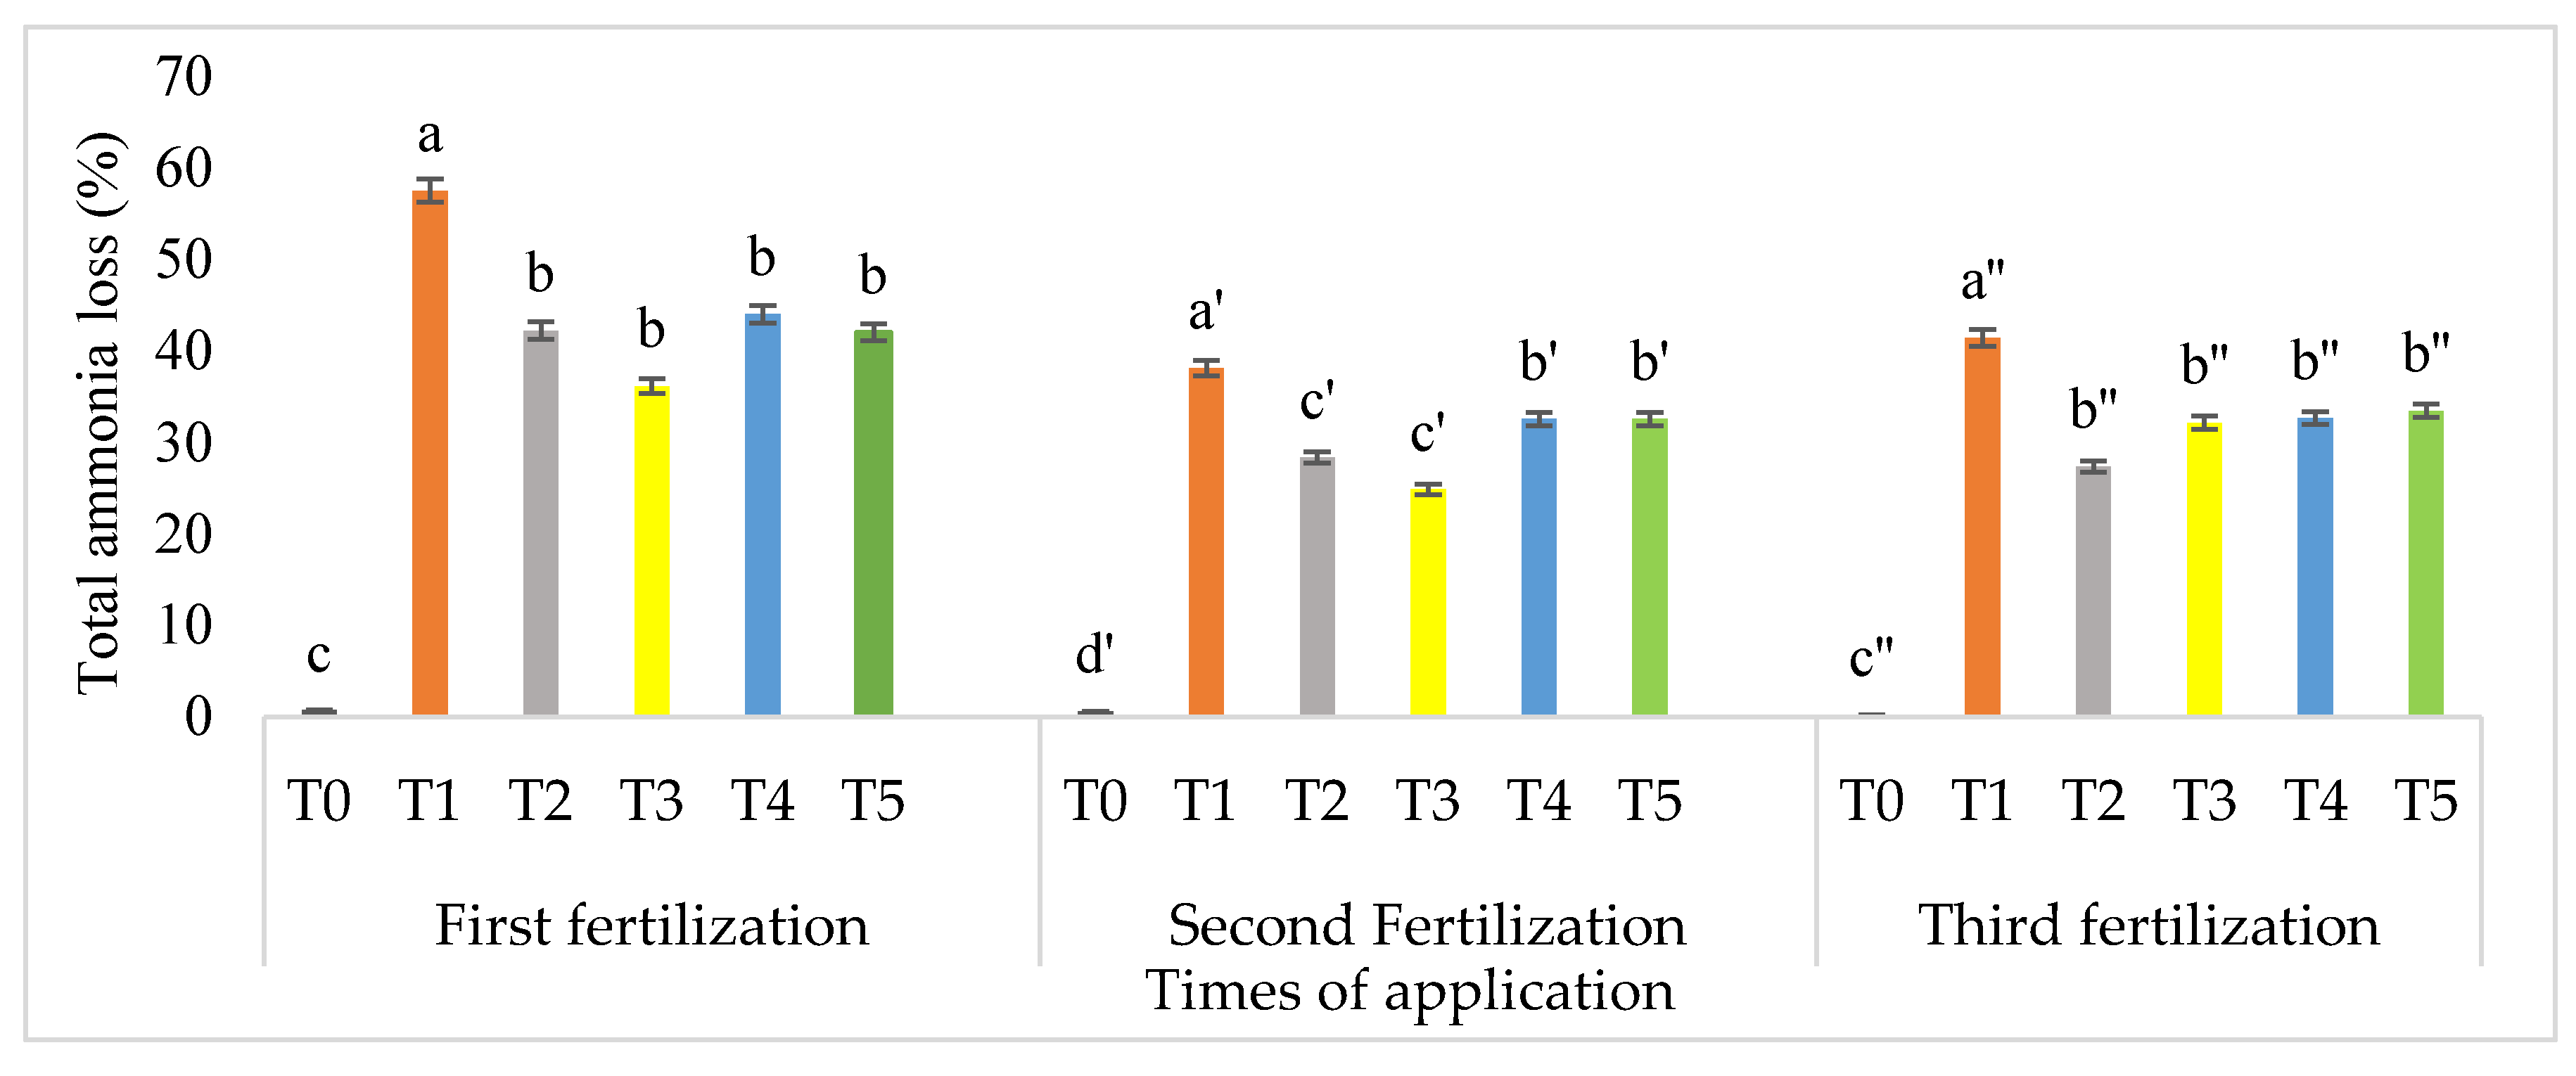
3.5. Amounts of Ammonia Volatilization at Three Different Times of Application

The soil without any fertilization (T0) did not emit NH3 throughout the incubation period regardless of urea application times (Figure 4a–c). Irrespective of application time (28 DAP, 50 DAP, and 70 DAP), similar duration of NH3 emission from the trough with urea alone (T1) occurred for 21 days of the incubation study compared with the troughs with the combined urea and RH compost (T2, T3, T4, and T5) (Figure 4a–c). Ammonia was emitted from day 1 to day 6 from the troughs with urea alone (T1) compared with the troughs with urea and RH compost at different rates (T2, T3, T4, and T5) for 28 DAP, 50 DAP, and 70 DAP, respectively (Figure 4a–c). It must be stressed that T1 and T2 consist of similar amounts of urea which were applied at 100% recommendation, however, higher emission of NH3 occurred with T1 (urea only) compared with T2, although urea was also applied at 100% (similar to T1) but amended with 20 g of RH compost. The highest amount of the daily NH3 loss in most of the troughs occurred during the first application (28 DAP) of urea at different rates than during the second (50 DAP) and third (70 DAP) applications (Figure 4a–c). The amounts of daily NH3 loss were lower in the troughs with co-application of urea and RH compost (T2, T3, T4, and T5) compared with troughs with urea only (T1) regardless of urea application times (28, 50, and 70 DAP) (Figure 4a–c).
Irrespective of urea application time, the cumulative amounts of NH3 loss over 21 days of volatilization was higher in troughs with urea alone (T1) compared with the troughs with co-application of urea and RH compost (T2, T3, T4, and T5) (Figure 5).
The total amounts of NH3 lost from urea in T1 at the first, second, and third applications were 57.60, 38.25, and 41.52%, respectively (Table 5). Although all of the urea added with RH compost showed significant effects in minimizing NH3 loss regardless of application time, T5 (urea added at 40% of standard recommendation but added with highest amount of RH compost) was more effective in minimizing NH3 loss throughout fertilizations based on subtraction values of 42.10, 32.17, and 33.50% of NH3 loss from total lost from urea only (Table 5).

3.6. Temperature and pH at Three Different Timing and Rates of Urea Application

Regardless of time and rate of urea application, temperature and pH (in water) had no significant effects on NH3 volatilization (Figure 6 and Figure 7). The temperature of the troughs ranged from 31.4 to 31.7 °C for the three different time of urea application (Figure 6). The pH of the waterlogged soil in this present study ranged from 6.22 to 6.84 (Figure 7) regardless of time and rate of urea application. The pH determines the equilibrium between NH4+ and NH3.

3.7. Soil Total Nitrogen, Exchangeable Ammonium, Available Nitrate, and pH

At 92 days after the volatilization study, the amounts of soil total N and exchangeable NH4+ were higher in the troughs with RH compost (T2, T3, T4, and T5) than in the trough with urea alone (T1) (Table 6). Regardless of the treatment, soil available NO3 and pH were similar (T1, T2, T3, T4, and T5) (Table 6).

4. Discussion

4.1. Physico-Chemical Characteristics of Unprocessed Rice Husk and Chicken Slurry

Despite the low content of Ca, Mg, and K of the raw RH and CDS, the high pH of both wastes is preferable for microbial activities during co-composting (Table 1). Low HA content in raw RH and undetectable content in CDS are attributed to the high pH contents of raw RH and CDS. The TOC, OM, and C/N ratios in RH and CDS (Table 1) are suitable for compost production and could be used in soil N fertility management. When applied to soil, RH compost builds soil C and soil N, returning valuable nutrients to the soil ecosystem [36]. Murimi and Gbedemah [37] confirmed that RH and chicken droppings, when used as substrates for organic fertilizer production, contained a significant amount of plant essential nutrients.

4.2. Selected Physical, Chemical, and Biological Properties of the Rice Husk Compost

The higher ambient temperature (30 °C) throughout co-composting RH than the typical ambient temperature (26–27 °C) was due to the semi-closed environment of the co-composting site which was not under full shade where the temperature would be under control. The Mesophilic stage of co-composting at day four in this study (Figure 2) was related to mesophilic bacteria that consumed C and oxygen (O2), after which they converted them into carbon dioxide (CO2) and energy. Part of the energy was used by the mesophilic bacteria to proliferate while the rest was used to assist in the decomposition of readily degradable compounds, such as the decomposition of cellulose into glucose [36]. This can be observed in the reduction of TOC and OM of the RH compost, as shown in Table 2. When the temperature of the compost medium exceeded 40 °C and reached the thermophilic phase, the environment was less favorable for mesophilic bacteria. However, it was good for the lignin decomposition of RH. The high temperature in the thermophilic phase for 10 days in co-composting RH with CDS, as observed in this study, accelerated decomposition of RH by loosening the composted organic materials. The decrease in temperature during co-composting occurred from day 30 to day 50, suggesting that the microbial activity decreased because of the low amount of TOC and OM (Table 2). Thus, the microbial activity stopped and reached the cooling stages [12]. The slight increase in temperature of the RH compost medium (42 °C) from day 25 to day 35 during co-composting was due to the turning process, which enabled aeration supply towards the compost medium [12].
The dark brown color of the compost medium at 55 days after co-composting (Figure 3d) indicated proper aeration and absence of anaerobic decomposition, as agreed by Haug et al. [38]. Besides, there were no unpleasant odors of the RH compost at 55 days of co-composting, suggesting that the compost medium had reached maturity [39]. According to Ahmad et al. [40], matured compost should be odorless (slight earthy and inoffensive smell) and dark brown to black due to formation of humic substances. Electrical conductivity of the RH compost is at a permissible level (2.75 µS cm−1) (Table 2). Thus, regardless of the RH compost concentration, E1 (undiluted), E2 (10× dilution), E3 (100× dilution), and E4 (1000× dilution), the compost was not toxic to paddy seed germination. The EC of the compost is an important measure of soluble salt content where the optimum value should be less than 4 µS cm−1 for composts to be used as part of growing media or soil amendment. It has been reported that if the EC of the composts higher than 4 µS cm−1, the soluble salts in the compost may harm germinating seed and plants growth [39]. Irrespective of the RH compost extractant (E1, E2, E3, and E4), lower EC of the RH compost partly contributed to the insignificant effects of the RH compost on root and shoot length, seed germination, relative seed germination, and the germination index of paddy seed compared with distilled water (C) (Table 3). The lower EC of the RH compost suggests that the RH compost was low in electrolyte concentration irrespective of their concentration (E1, E2, E3, and E4) and corroborated the successful paddy seed germination which ranged from 93 to 97% (Table 3).
Lower pH of the RH compost at 55 days after co-composting could be due to the formation of organic acids that released hydrogen ions [41]. Organic acids such as fulvic acids and HA are formed during composting. The slight increase in HA before and after composting (from 5.13 to 5.87%) (Table 2) of the RH compost was due to the humification of OM at the curing stage. The lower content of OM and TOC of the RH compost (Table 2) confirmed that the RH compost was stabilized. Increased Mg and Ca in the RH compost might have caused a decrease in the compost pH. It has been proven that humic acids and base precipitating salts lower pH [39,41]. Although pH of the RH compost decreased, it was still relatively under optimum range for matured compost, which is in the range of 6.5–7.5 [42]. The increased CEC and HA of the RH compost after co-composting indicates that the organic materials in matured compost had been humified as agreed by Sullivan and Miller [42]. Mineralization of OM through microbial activity [41] affects the lower content of TOC and OM of the RH compost in this study (Table 2), whereas increased of N (1.15%), P (3101.18 mg kg−1), K (2038 mg kg−1), Mg (276 mg kg−1), and Ca (863 mg kg−1) in the RH compost attest decomposition of organic material during co-composting (Table 2).
Decomposition of organic material also related to the lower C/N ratio of the RH compost. The C reduction was caused by the active degradation of microbial cellulolytic and proliferation of microbes which immobilize N [43]. Although C decreased throughout the co-composting process, the C/N ratio of the RH compost in this study exceeded the suitable compost C/N ratio which typically ranged between 10–15. High C/N ratio of the RH compost (30) (Table 2) in this study, due to the enzymes produced from microbes, had difficulties breaking down hemicellulose and lignin in RH, which protects cellulose from further degradation [44]. Mineralization of OM in RH compost medium did not only affect the lower content of C and OM, but they also affect the increased total N, NH4+, and NO3 of the RH compost (Table 2). Besides, increases of total N, NH4+, and NO3 also related to the C/N ratio. According to Haug [38], when the C/N ratio is higher than 40, it is likely to immobilize the availability of N in the compost, whereas, if the C/N ratio less than 25, excess production of inorganic N led to N loss through volatilization in the form of NH4+ or by leaching in the form of NO3 [45]. In this study, although C/N ratio of the RH compost is 30, total N, NH4+, and NO3 in the compost increased (Table 2). According to Bernal et al. [12], compost with a C/N ratio of 25 could lose 32% of N, whereas compost with C/N ratios greater than 50 lost less than 10% of N in compost.
The GI values (>90%) of paddy sown in different compost extractants (E1, E2, E3, and E4) indicated that the RH compost is stabilized, matured, and not toxic to paddy seed germination (Table 3). The GI values between 80–100% had been reported by Zucconi [29] as free from plant toxicity. Similar findings were observed in germination, relative root growth, and relative shoot germination of paddy seeds sown in different RH compost extractants substantiates that the RH compost was free from toxicity and viable for paddy seed germination. In addition, the presence of adequate amounts of plant nutrients in RH composts extracts could have partly contributed to the high GI values obtained in paddy seed germination in all RH compost extractants (E1, E2, E3, and E4) (Table 3).

4.3. Selected Chemical Properties of Bekenu Series (Typic Paleudults)

The low content of major nutrients of the Bekenu Series (Typic Paleudults) are typical characteristics of sandy clay loam which share similar properties with the adjacent area, namely the Nyalau Series (Table 4). Argillic horizon with the fine sandy clay loam texture of the Bekenu Series (Typic Paleudults) was attributed to the translocation of clay particles from eluvial horizons to illuvial horizons and transformation of primary minerals in the subsurface horizons [35]. According to Soil Survey Staff [35] for a subsurface horizon to be considered an argillic horizon, it must have two clay films and a specific content of clay compared to the overlying horizons. The Bekenu Series (Typic Paleudults) soils are typically deep and well drained but are categorized as infertile soil [34]. Low major nutrient content of the Bekenu Series (Typic Paleudults) was attributed to it being highly weathered with high rainfall and temperature throughout the year, which results in leaching of cations and accumulation of sesquioxides; thus, the soils become acidic [34].
Use of fertilizer N for crop production is important to improve soil fertility and the addition of soil amendments, for example RH compost, could provide OM content, enhance microbial activities, and neutralize soil acidity of the Bekenu Series (Typic Paleudults). The application of RH compost at an optimum level, whereby high maize yields were achieved compared with the standard fertilization, have been reported in our previous finding [11]. We confirmed that apart from being sufficient supplies in major nutrient contents, the RH compost applied in maize cultivation resulted in the build-up of soil OM and microbial biomass, thus promoting maize growth and improving high yield of maize ears. In contrast, when fertilizer N was applied at rates more than the optimum, increased residual inorganic N accelerated the loss of soil OM through its mineralization. Hence, in this study an attempt was made to reduce the N losses through NH3 volatilization by balancing soil N availability through combined application of urea and RH compost at an optimum level.

4.4. Effects of Rice Husk Compost on Ammonia Volatilization

A similar duration (21 days of incubation) of NH3 volatilized in T1 irrespective of application times (28 DAP, 50 DAP, and 70 DAP) advocates that shorter period taken for urea-N loss via NH3 volatilization in T1 (urea only) compared with all troughs with RH compost (T2, T3, T4, and T5) (Figure 4a–c). In addition, the exceeded time of NH3 released through combined application of the RH compost and urea (T2, T3, T4, and T5) was partly owed to the effects of RH compost on urea and not NH3 from the RH compost. The higher amount of NH3 that was volatilized in T1 compared with T2, despite having similar urea content, was added in both troughs (T1: 100% of urea based on standard recommendation and T2: 100% of urea based on standard recommendation but amended with 20 g of RH compost) suggesting that the higher volatilized NH3 was not necessarily due to the higher amount of N applied in those troughs (T1 and T2) (Figure 4a–c). Although, in a related study, Fan et al. [46] reported that NH3 volatilization increased proportionately with the content of urea in the applied N fertilizer product. The lower the amount of NH3 volatilized in T2 as compared with T1 suggests that the co-application of RH compost in T2 might have delayed the emission of NH3 from 100% of urea applied in T2 (Figure 4a–c).
The highest amount of daily NH3 volatilized from the trough with urea alone (T1) (Figure 4a–c) is common; as stated by Fan et al. [46], urea undergoes hydrolysis after it is added to soil and forms NH4+. Without good retention, NH4+ is subject to loss via NH3 volatilization which is reflected by the trough under urea alone (T1) (Figure 4a–c). With the addition of different rates of RH compost in all troughs (T2, T3, T4, and T5) although they were applied prior to the first, second, and third application of urea, the daily NH3 loss in those troughs (T2, T3, T4, and T5) was hindered owing to the high CEC (100.67 cmolc kg−1) and OM (60.67%) of the RH compost (Figure 5). In our previous study on NH4+ adsorption using RH compost, retention of NH4+ onto RH compost surface area was possible because the porous and irregular morphological surfaces of the RH compost have large interfaces which serve as bio-adsorbents for NH4+ adsorption [9,11]. The retention of NH4+ due to RH compost was also attributed to high content of cations such as Ca, Mg, and K which were 8630, 2761, and 2038 mg kg−1, respectively (Table 2). Jauberthie et al. [47] reported that the chemical compositions, such as being high in cations of organic amendments, are essential, as they reflected organic fibers with high external surface area which have the ability of NH4+ adsorption.
The lower NH3 emission in all troughs with RH compost (T2, T3, T4, and T5) suggests that it is recommended to co-apply urea with RH compost as evidence in troughs with addition of the RH compost, particularly when urea is reduced by 40% from the standard recommendation but amended with 60 g of RH compost (T5). Without the inclusion of RH compost in T1 (urea alone), NH4-N was lost through NH3 volatilization, whereas for the troughs with co-application of urea and RH compost (T2, T3, T4, and T5), NH4+ was retained by clay minerals of soil due to high CEC of RH compost or temporarily adsorbed by the soil OM of the troughs with RH compost (Table 5). It must be stressed that the application of RH compost at different rates as complements to urea in T2, T3, T4, and T5 were carried out before urea application regardless of the application times.

4.5. Soil Water Temperature and pH

The insignificant difference in soil temperature and pH of all troughs (T0, T1, T2, T3, T4, and T5) (Figure 6 and Figure 7) could not provide much information on the effects of soil water temperature and pH on NH3 volatilization in this study, although it is widely known that temperature and pH have important effects on NH3 volatilization in soil fertilized with N fertilizers [48]. According to Cai et al. [49], the rate of NH3 volatilization was greater during the summer because N fertilizers are applied in high temperature. In our previous studies on using sago wastewater to mitigate NH3 volatilization, when temperature increased up to 45 °C, the amount of NH3 was also increased due to the temperature effects on NH4+ absorption, NH4 + and NH3 equilibrium, and conversion of NH4 + into NH3, which, thus, increased NH3 diffusion rate [50].
However, in this current study, the highest NH3 volatilized was occurred in the trough with urea only (T1) although there was similarity in temperature and pH of soil water to the other troughs with added urea and RH compost (T2, T3, T4, and T5) (Figure 6 and Figure 7). High soil temperature and pH increases the rate of NH3 volatilization because they increase NH3 concentration in the soil water. The similar soil water temperature in all troughs with urea and urea with RH compost (T1, T2, T3, T4, and T5), including soil only (T0), could be partly due to the waterlog in all troughs, coupled with the semi-closed environment, which affects temperature and relative humidity. The insignificance of pH in all troughs is seemingly because of the acidic nature of the Bekenu Series (Typic Paleudults) soil used in this study which is 4.6 (Table 4). Besides, the increase of soil water pH during urea hydrolysis is temporary and not permanent.

4.6. Soil Total Nitrogen, Exchangeable Ammonium, and Available Nitrate

The higher accumulation of total N and exchangeable NH4+ in all troughs with RH compost (T2, T3, T4, and T5) in soil at 92 days after planting compared with the trough with urea alone (T1) (Table 6) corroborated the higher NH3 volatilization in trough without addition of RH compost (T1) (Figure 4a–c and Figure 5). According to Fan et al. [46], N in most of synthetic organic N (urea) and chemical manufactured N fertilizer (ammonium sulphate, sodium nitrate, ammonium phosphate, ammonium thiosulfate, and calcium ammonium nitrate) without good retention when surface-applied are readily converted to or forms NH4+, which is subject to loss through NH3 volatilization. In the present study, the delayed in NH3 volatilization in all troughs with the addition of RH compost (T2, T3, T4, and T5) at different times of application and the higher accumulation of total N and exchangeable NH4+ in soil at 92 DAP suggested that the addition of RH compost might have effects on the slow release of soil hydrolyzable organic N from OM of the compost.
In our previous study on estimation of decomposable of soil hydrolyzable organic N from RH compost, we confirmed the conversion of available N (NH4+ and/or NO3) explained by the higher total amount of hydrolyzable N, after which followed hydrolyzable NH4-N, amino sugar-N, and amino-acid-N [7]. Thus, the decomposition of polymers of organic N fractions into monomers, and organic N gradually forms NH4+, which has further become a potential source for NH3 loss if it is not well retained in soil [7]. No significant difference in soil available NO3 at 92 days after planting in troughs with urea (T1) and urea with RH compost (T2, T3, T4, and T5) suggests that most of the N are in the form of exchangeable NH4+, particularly in troughs with RH compost (T2, T3, T4, and T5) (Table 6). In this NH3 volatilization study, which was carried out in waterlogged troughs to simulate swamp rice cultivation, flooding an oxidized soil affects utilization of both the soil N and exchangeable NH4+. In contrast with aerobic conditions, NH4+ is rapidly oxidized to NO3; this, in part, explains the lower amount of soil available NO3 in soil at 92 DAP (Table 6). In addition, under flooded conditions, organic N from the addition of RH compost in T2, T3, T4, and T5 continues to be mineralized and remains available as NH4+ for plant use rather than being volatilized, nitrified, and lost via denitrification. The similar soil pH of troughs with T1, T2, T3, T4, and T5 at 92 DAP were consistent with the similar pH in soil water regardless of urea application times because the increase in pH when urea hydrolyzed was temporary and limited to the microsites of urea application.

5. Conclusions

The color of RH compost was dark brown and had significant amounts of major nutrients such as N (1.15%), phosphorus (3101 mg kg−1), potassium (2038 mg kg−1), calcium (863 mg kg−1), magnesium (276 mg kg−1), organic matter (OM) (60.67%), organic carbon (35.17%), and humic acids (5.87%). The C/N ratio of the RH compost was 30. The electrical conductivity and pH of the RH compost were 2.79 µS cm−1 and 6.55, respectively, and they were not phytotoxic because paddy seeds were successfully germinated in all of the RH compost extractants. The high cation exchange capacity (CEC) of the RH compost (100.67 cmolc kg−1) at the end of composting was one of the determinant factors that controlled NH3 loss from urea. The RH compost significantly minimized NH3 volatilization because of the high affinity of the RH compost for NH4+. An attestation of this reaction was that the high negative charges due to high CEC and OM of the RH compost temporarily protected NH4+ from being transformed into NH3 gas. Further evidence is the higher soil total N and exchangeable NH4+ for the treatments with RH compost than with urea alone. High quality compost can be produced from RH to reduce urea-N from being lost from urea. For the optimum rate, co-application of 60 g RH compost and 2.9 g urea per trough is recommended to mitigate NH3 volatilization instead of the existing practice (7.3 g urea alone per trough).

Author Contributions

L.O. was responsible for supervising, conceptualization, investigation, writing and original draft preparation as well as for data analysis, funding acquisition, and visualization. O.H.A. was responsible for project administration, experimental methodology, editing, reviewing, and revising the paper for publication. M.B.J. was involved in experimental methodology, editing, and reviewing. N.M.A.M. was also involved in funding acquisition and project administration. All authors have read and agreed to the published version of the manuscript.

Funding

The authors gratefully acknowledge the financial support from the Ministry of Higher Education Malaysia and Universiti Putra Malaysia for the collaborative research through a Research Grant IPM vote number 9622100.

Institutional Review Board Statement

Not applicable.

Informed Consent Statement

Not applicable.

Data Availability Statement

Data available in a publicly accessible repository.

Acknowledgments

The authors gratefully acknowledge the financial support from the Ministry of Higher Education Malaysia, Universiti Putra Malaysia, and Universiti Malaysia Sabah for the collaborative research through a Research Grant IPM vote number 9622100.

Conflicts of Interest

The authors declare that there is no conflict of interest regarding the publication of this manuscript.

References

  1. Kapanen, A.; Itävaara, M. Ecotoxicity tests for compost applications. Ecotoxicol. Environ. Saf. 2001, 49, 1–16. [Google Scholar] [CrossRef]
  2. Wang, H.Y.; Liu, S.; Zhai, L.M.; Zhang, J.Z.; Ren, Y.Z.; Fan, B.Q.; Liu, H.B. Preparation and utilization of phosphate biofertilizers using agricultural waste. J. Integr. Agric. 2015, 14, 158–167. [Google Scholar] [CrossRef]
  3. Nakhshiniev, B.; Biddinika, M.K.; Gonzales, H.B.; Sumida, H.; Yoshikawa, K. Evaluation of hydrothermal treatment in enhancing rice straw compost stability and maturity. Biores. Tech. 2014, 151, 306–313. [Google Scholar] [CrossRef]
  4. Food and Agriculture Organization of the United Nations (FAO). Trade and Markets Division. 2012. Available online: http://www.fao.org/economic/est/publications/rice-publications/ricemarket-monitor-rmm/en/ (accessed on 1 May 2020).
  5. Obi, F.O.; Ugwuishiwu, B.O.; Nwakaire, J.N. Agricultural waste concept, generation, utilization and management. Niger. J. Tech. 2016, 35, 957–964. [Google Scholar] [CrossRef]
  6. Ishola, T.M.; Ishola, E.T. Composting and Sustainable Development. In Encyclopedia of Sustainability in Higher Education; Leal Filho, W., Ed.; Springer: Cham, Switzerland, 2019; pp. 21–22. [Google Scholar] [CrossRef]
  7. Latifah, O.; Ahmed, O.H.; Majid, N.M.A. Paddy husk compost addition for improving nitrogen availability. Indian J. Agric. Res. 2019, 387, 1–7. [Google Scholar] [CrossRef] [Green Version]
  8. Ch’ng, H.Y.; Ahmed, O.H.; Majid, N.M.A. Minimizing phosphorus sorption and leaching of a tropical acid soil by amending Egypt rock phosphate with organic amendments. Acad. J. Agric. Res. 2015, 3, 276–288. [Google Scholar]
  9. Omar, L.; Ahmed, O.H.; Jalloh, M.B.; Nik Muhamad, A.M. Soil nitrogen fractions, nitrogen use efficiency and yield of Zea mays L. grown on a tropical acid soil treated with composts and clinoptilolite zeolite. Appl. Sci. 2020, 10, 4139. [Google Scholar] [CrossRef]
  10. Dias, J.; Gil, B.; Reidsma, P.; Giller, K.; Todman, L.; Whitmore, A.; van Ittersum, M. Sustainable development goal 2: Improved targets and indicators for agriculture and food security. Ambio 2019. [Google Scholar] [CrossRef] [Green Version]
  11. Latifah, O.; Ahmed, O.H.; Susilawati, K.; Majid, N.M.A. Compost maturity and nitrogen availability by co-composting of paddy husk and chicken manure amended with clinoptilolite zeolite. Waste Manag. Res. 2015, 33, 322–331. [Google Scholar] [CrossRef]
  12. Bernal, M.P.; Sommer, S.G.; Chadwick, D.; Qing, C.; Guoxue, L.; Michel, F.C., Jr. Current approaches and future trends in compost quality criteria for agronomic, environmental, and human health benefits. Adv. Agron. 2017, 144, 143–233. [Google Scholar]
  13. San Martín, W. Global Nitrogen in Sustainable Development: Four Challenges at the Interface of Science and Policy. In Encyclopedia of the UN Sustainable Development Goals; Leal Filho, W., Azul, A., Brandli, L., Lange Salvia, A., Wall, T., Eds.; Springer: Cham, Switzerland, 2020. [Google Scholar] [CrossRef]
  14. Swarbreck, S.M.; Wang, M.; Wang, Y.; Kindred, D.; Sylvester- Bradley, R.; Shi, W.; Varinderpal, S.; Bentley, A.R.; Griffiths, H. A roadmap for lowering crop nitrogen requirement (report). Trends Plant Sci. 2019, 24, 892. [Google Scholar] [CrossRef]
  15. Lu, C.; Tian, H. Global nitrogen and phosphorus fertilizer use for agriculture production in the past half century: Shifted hot spots and nutrient imbalance. Earth Syst. Sci. Data. 2017, 9, 181. [Google Scholar] [CrossRef] [Green Version]
  16. United Nations Environment Programme (UNEP). Resolution Adopted by the United Nations Environment Assembly on 15 March 2019 on Sustainable Nitrogen Management; UNEP/EA.4/Res.14. 2019; United Nations Environment Programme: Nairobi, Kenya, 2019. [Google Scholar]
  17. Stevens, C. Nitrogen in the environment. Science 2019, 363, 578–580. [Google Scholar] [CrossRef] [PubMed] [Green Version]
  18. Galloway, J.N.; Leach, A.M.; Erisman, J.W.; Bleeker, A. Nitrogen: The historical progression from ignorance to knowledge, with a view to future solutions. Soil Res. 2017, 55, 417–424. [Google Scholar] [CrossRef] [Green Version]
  19. International Nitrogen Management System (INMS). Fourth Meeting of the International Nitrogen Management System (INMS-4); Full Report of the Highlevel Segment; UN Environment HQ: Nairobi, Kenya, 2019. [Google Scholar]
  20. Kanter, D.R.; Bartolini, F.; Kugelberg, S.; Leip, A.; Oenema, O.; Uwizeye, A. Nitrogen pollution policy beyond the farm. Nat. Food 2020, 1, 27–32. [Google Scholar] [CrossRef] [Green Version]
  21. Houlton, B.Z.; Almaraz, M.; Aneja, V.; Austin, A.T.; Bai, E.; Cassman, K.G.; Compton, J.E.; Davidson, E.A.; Erisman, J.W.; Galloway, J.N.; et al. A World of cobenefits: Solving the global nitrogen challenge. Earth’s Future 2019, 7, 865–872. [Google Scholar] [CrossRef] [Green Version]
  22. Sigurdarson, J.J.; Svane, S.; Karing, H. The molecular processes of urea hydrolysis in relation to ammonia emissions from agriculture. Rev. Environ. Sci. Bio/Tech 2018, 17, 241–258. [Google Scholar] [CrossRef] [Green Version]
  23. Sasaki, N.; Suehara, K.I.; Kohda, J. Effects of C/N ratio and pH of raw materials on oil degradation efficiency in a compost fermentation process. J. Biosci. Bioengin. 2003, 96, 47–52. [Google Scholar] [CrossRef]
  24. Tan, K.H. Soil Sampling, Preparation, and Analysis, 2nd ed.; CRC Press: Boca Raton, FL, USA, 2005; p. 672. [Google Scholar]
  25. Bremner, J.M. Total Nitrogen. In Methods of Soil Analysis; Black, C.A., Evans, D.D., Ensminger, L.E., White, J.L., Clark, F.F., Dinauer, R.C., Eds.; American Society of Agronomy: Madison, WI, USA, 1965; pp. 1149–1178. [Google Scholar]
  26. Keeney, D.R.; Nelson, D.W. Nitrogen-inorganic forms. In Methods of Soil Analysis, Part 2, 2nd ed.; Page, A.G., Keeney, D.R., Baker, D.E., Miller, R.H., Rhoades, J.D., Eds.; American Society of Agronomy: Madison, WI, USA, 1982; pp. 643–698. [Google Scholar]
  27. Brewer, L.J.; Sullivan, D.M. Maturity and stability evaluation of composted yard trimmings. Comp. Sci. Util. 2003, 11, 96–112. [Google Scholar] [CrossRef]
  28. Palanivell, P.; Ahmed, O.H.; Susilawati, K.; Majid, N.M.A. Compost and crude humic substances produced from selected wastes and their effects on Zea mays L. nutrient uptake and growth. Sci. World J. 2013, 2013, 276235. [Google Scholar] [CrossRef] [PubMed] [Green Version]
  29. Zucconi, F.D. Evaluating toxicity of immature compost. Biocycle 1981, 22, 54–57. [Google Scholar]
  30. Ahmed, O.H.; Aminuddin, H.; Husni, M.H.A. Ammonia volatilization and ammonium accumulation from urea mixed with zeolite and triple superphosphate. Acta Agric. Scand. Sec. B Soil Plant Sci. 2006, 58, 182–186. [Google Scholar]
  31. John, N.M.; Uwah, D.F.; Iren, O.B.; Akpan, J.F. Changes in maize (Zea mays L.) performance and nutrients content with the application of poultry manure, municipal solid waste and ash compost. J. Agric. Sci. 2013, 3, 270–272. [Google Scholar] [CrossRef] [Green Version]
  32. Muda Agricultural Development Authority. Rice Check. 2014. Available online: http://www.mada.gov.my/semakan-tanaman-padi (accessed on 1 May 2020).
  33. Palanivell, P.; Ahmed, O.H.; Susilawati, K.; Majid, N.M.A. Improving lowland rice (O. sativa L. cv. MR219) plant growth variables, nutrients uptake, and nutrients recovery using crude humic substances. Sci. World J. 2015, 2015, 906094. [Google Scholar] [CrossRef] [Green Version]
  34. Paramananthan, S. Soil of Malaysia: Their Characteristics and Identification; Academy of Sciences Malaysia: Kuala Lumpur, Malaysia, 2000; Volume 1, pp. 11–125. [Google Scholar]
  35. Soil Survey Staff. Keys to Soil Taxonomy, 12th ed.; USDA-Natural Resources Conservation Service: Washington, DC, USA, 2014.
  36. Tateda, M.; Trung, L.D.; Hang, H.T.M.; Ike, M.; Fujita, M. The role of compost pile turning for improving performance of composting. Jpn. J. Water Treat. Biol. 2008, 44, 21–28. [Google Scholar] [CrossRef] [Green Version]
  37. Murimi, S.M.; Gbedemah, S.F. Suitability of Rice Husk and Chicken Droppings as Organic Fertilizer for Sustainable Agriculture in Ghana. J. Environ. Issues Agric. Dev. Ctries. 2019, 10, 63–78. [Google Scholar]
  38. Haug, R.T. The Practical Handbook of Compost Engineering; Routledge: Abingdon, UK, 2018; pp. 2–4. [Google Scholar]
  39. McCrory, D.F.; Hobbs, P.J. Additives to reduce ammonia and odour emissions from livestock wastes. J. Environ. Qual. 2001, 30, 345–355. [Google Scholar] [CrossRef] [Green Version]
  40. Ahmad, R.; Jilani, G.; Arshad, M.; Zahir, Z.A.; Khalid, A. Bioconversion of organic wastes for their recycling in agriculture: An overview of perspectives and prospects. Ann. Microbiol. 2007, 57, 471–479. [Google Scholar] [CrossRef]
  41. United States Department of Agriculture. National Engineering Handbook; Part 637; Composting: Washington, DC, USA, 2000; Chapter 2; pp. 2–8.
  42. Sullivan, D.M.; Miller, R.O. Compost quality attributes, measurements, and variability. Comp. Util. Horti. Crop. Syst. 2001, 95–120. [Google Scholar] [CrossRef]
  43. Tong, J.; Sun, X.; Li, S.; Qu, B.; Wan, L. Reutilization of green waste as compost for soil improvement in the afforested land of the Beijing Plain. Sustainability 2018, 10, 2376. [Google Scholar] [CrossRef] [Green Version]
  44. Wong, M.T.F.; Nortcliff, S.; Swift, R.S. Method for determining the acid ameliorating capacity of plant residue compost, urban waste compost, farmyard manure, and peat applied to tropical soils. Commun. Soil Sci. Plant Anal. 1998, 29, 2927–2937. [Google Scholar] [CrossRef]
  45. Kithome, M.; Paul, J.W.; Bomke, A.A. Reducing nitrogen losses during simulated composting of poultry manure using adsorbents or chemical amendments. J. Environ. Qual. 1999, 28, 194–201. [Google Scholar] [CrossRef]
  46. Fan, S.C.; Lin, C.S.; Hsu, P.K.; Lin, S.H.; Tsay, Y.F. The Arabidopsis nitrate Transporter NRT1.7, expressed in phloem, is responsible for source-to-sink remobilization of nitrate. Plant Cell. 2009, 21, 2750–2761. [Google Scholar] [CrossRef] [PubMed] [Green Version]
  47. Jauberthie, R.; Rendell, F.; Tamba, S.; Cisse, I. Origin of the pozzolanic effect of rice husks. Construc. Build. Mater. 2000, 14, 419–423. [Google Scholar] [CrossRef]
  48. Liu, G.; Li, Y.; Alva, A.K. High-water regime can reduce ammonia volatilization from soils under potato production. Commun. Soil Sci. Plant Anal. 2007, 38, 1203–1220. [Google Scholar] [CrossRef]
  49. Cai, G.X.; Chen, D.L.; Ding, H.; Pacholski, A.; Fan, X.H.; Zhu, Z.L. Nitrogen losses from fertilizers applied to maize, wheat, and rice in the North China Plain. Nutr. Cycl. Agron. 2002, 63, 187–195. [Google Scholar] [CrossRef]
  50. Latifah, O.; Ahmed, O.H.; Majid, N.M.A. Reducing ammonia loss from urea and improving soil exchangeable ammonium and nitrate in non-waterlogged soils through mixing zeolite and sago (Metroxylon sagu) wastewater. Int. J. Phys. Sci. 2011, 6, 866–870. [Google Scholar]
Figure 1. Troughs covered with chambers to accommodate ammonia released which was trapped with boric acid to estimate daily ammonia volatilized.
Sustainability 13 01832 g001
Figure 2. Temperature profiles of co-composting of rice husk and chicken slurry.
Sustainability 13 01832 g002
Figure 3. Color profiles of co-composting rice husk and chicken slurry. (a) Light yellowish compost mixture at day 1 of co-composting; (b) Light brownish compost mixture at day 31 of co-composting; (c) Dark brown compost mixture at day 44 of co-composting; (d) Dark and earthy smell compost mixture at 55 of co-composting.
Sustainability 13 01832 g003aSustainability 13 01832 g003b
Figure 4. (ac) Daily ammonia volatilization from urea applied at three different times (twenty-eight, fifty, and seventy days after planting) and rates (100, 80, 60, and 40%). (a) Daily ammonia volatilization over twenty-one days of incubation from first fertilization (twenty-eight days after planting); (b) Daily ammonia volatilization over twenty-one days of incubation from second fertilization (fifty days after planting); (c) Daily ammonia volatilization over twenty-one days of incubation from third fertilization (seventy days after planting).
Sustainability 13 01832 g004aSustainability 13 01832 g004b
Figure 5. Cumulative amount of ammonia loss over twenty-one days of incubation from different times (twenty-eight, fifty, and seventy days after planting) and rates (100, 80, 60, and 40%) of urea application. Means with the same letter are not significantly different by Tukey’s test at p ≤ 0.05. Letters without prime represent first fertilization, single prime superscript (‘) represents second fertilization, and double prime superscript (“) represents third application of urea in plot study.
Sustainability 13 01832 g005
Figure 6. Temperature in plots from different timing (twenty-eight, fifty, and seventy days after planting) and rates (100, 80, 60, and 40%) of urea application.
Sustainability 13 01832 g006
Figure 7. pH of soil water in pots at different times (twenty-eight, fifty, and seventy days after planting) and rates (100, 80, 60, and 40%) of urea application.
Sustainability 13 01832 g007
Table 1. Selected physico-chemical properties of unprocessed rice husk and chicken dung slurry.
ParametersRice HuskChicken Slurry
pHwater7.32 ± 0.057.37 ± 0.18
Total organic carbon (%)42.92 ± 13.3647.94 ± 1.80
Organic matter (%)74.11 ± 3.5082.67 ± 1.04
Total nitrogen (%)0.84 ± 1.411.15 ± 0.62
C/N ratio51.09 ± 1.8041.68 ± 7.88
CEC (cmolc/kg)79.33 ± 0.42n.d
Total phosphorus (mg kg−1)2270.40 ± 108.281008.15 ± 105.88
Ammonium (mg kg−1)22.15 ± 2.1226.9 ± 3.67
Nitrate (mg kg−1)18.10 ± 2.10n.d
Humic acids (%)3.33 ± 0.09n.d
Potassium (mg kg−1)1612.45 ± 0.11234.14 ± 8.36
Calcium (mg kg−1)76.67 ± 0.0157.23 ± 13.88
Magnesium (mg kg−1)561.00 ± 0.0284.66 ± 16.17
EC (µS cm−1)1528.33 ± 61.164.33 ± 0.88
CEC is cation exchange capacity, EC is electrical conductivity, n.d is not detectable.
Table 2. Selected physico-chemical properties of before and after co-composting of rice husk.
ParametersBefore Co-Composting (Mean ± S.E.)After Co-Composting (Mean ± S.E.)
EC (µS cm−1)2.75 ± 0.102.79 ± 0.17
pHwater7.15 ± 0.076.55 ± 0.05
Organic material (%)81.33 ± 6.0460.67 ± 26.99
Total organic carbon (%)47.17 ± 3.5035.19 ± 15.65
Total nitrogen (%)0.89 ± 0.051.15 ± 0.62
Carbon to nitrogen ratio53 ± 3.2630.60 ± 2.87
Humic acids (%)5.13 ± 0.215.87 ± 0.08
CEC (cmolc kg−1)79.33 ± 0.42100.67 ± 0.23
Total phosphorus2639.18 ± 175.883101.18 ± 302.97
Total potassium1859.33 ± 0.522038 ± 0.31
Total magnesium (mg kg−1)113 ± 0.01276 ± 0.04
Total calcium662 ± 0.04863 ± 0.22
Ammonium44.5 ± 2.66128.5 ± 7.87
Nitrate34 ± 1.6683.7 ± 6.34
Value followed by ± is standard error. S.E. is standard error; EC is electrical conductivity; CEC is cation exchange capacity.
Table 3. Plant bioassay test for different extractants of a rice husk compost.
TreatmentRoot Length (cm)Shoot Length (cm)Seed Germination (%)Relative Seed Germination (%)Germination Index (%)
C9.8 ± 0.551.2 ± 0.03100100100
E19.2 ± 0.281.3 ± 0.0610010093.4 ± 5.21
E29.2 ± 0.271.4 ± 0.1010010094.1 ± 5.09
E39.2 ± 0.261.5 ± 0.0510010094.3 ± 5.08
E49.5 ± 0.311.2 ± 0.0710010097.3 ± 4.78
Value followed by ± is standard error. No standard error included in the percentage of seed germination, relative seed germination, and germination index because of consistent reading reflected by each replication which equal to zero deviation.
Table 4. Selected chemical properties of Bekenu Series (Typic Paleudults).
PropertyValue ObtainedStandard Data Range [34]
Mean ± S.E
pHwater4.67 ± 0.254.6
CEC11.67 ± 0.218.0–24
Exchangeable calcium(cmolc kg−1)23.10 ± 0.010.01
Exchangeable magnesium33.33 ± 0.020.21
Exchangeable potassium28.83 ± 0.170.19
Total Nitrogen0.37 ± 0.420.04–0.17
Organic matter (%)5.03 ± 1.04n.d
Total carbon2.91 ± 0.600.57–2.51
Total phosphorus110.88 ± 9.07n.d
Exchangeable ammonium (mg kg−1)12 ± 2.49n.d
Available nitrate5.20 ± 1.01n.d
Value followed by ± is standard error. S.E. is standard error. Standard data range reported by Paramanathan [34]. CEC is cation exchange capacity. n.d is not determined.
Table 5. Total ammonia lost over twenty-one days of incubation and the subtraction from ammonia loss lost in urea alone (T1).
TreatmentNH3 Loss (% of Urea-N)Subtraction in Total NH3 Lost as Compared with T1 (%)
1st fertilization (28 days after planting)
T00.71 cNone
T157.60 aNone
T234.44 b40.21
T332.76 b43.12
T430.17 b47.63
T542.10 b26.91
2nd fertilization (50 days after planting)
T00.62 cNone
T138.25 aNone
T228.43 b25.68
T324.93 b34.83
T432.17 b15.90
T532.17 b15.90
3rd fertilization (70 days after planting)
T00.22 cNone
T141.52 aNone
T227.47 c33.84
T332.22 b22.40
T432.77 b21.08
T533.50 b19.32
Means with the different letters (a,b,c) are significantly different by Tukey’s test at p ≤ 0.05.
Table 6. Soil total nitrogen, exchangeable ammonium, available nitrate, and pH at ninety-two days after planting.
TreatmentTotal N (%)Ammonium (mg kg−1)Nitrate (mg kg−1)pH
T00.02 d ± 0.00121.12 e ± 0.0510.18 b ± 0.014.18 b ± 0.01
T10.14 c ± 0.0166.28 d ± 9.8025.19 a ± 0.056.77 a ± 0.05
T20.67 b ± 0.01548.14 b ± 11.5424.58 a ± 4.906.16 a ± 0.02
T30.64 b ± 0.05386.24 b ± 6.9925.24 a ± 2.406.37 a ± 0.05
T40.79 a ± 0.01658.34 a ± 7.0524.16 a ± 5.886.22 a ± 0.01
T50.76 a± 0.01342.18 c ± 7.0525.77 a ± 1.906.31 a ± 0.01
Means between columns with different letters (a,b,c,d,e) indicates significant difference tested by Tukey′s test p ≤ 0.05
Publisher’s Note: MDPI stays neutral with regard to jurisdictional claims in published maps and institutional affiliations.

