Abstract
Along with industry upgrading and urbanization, the agricultural industry in China has been experiencing a stage of rapid development, on the bright side. On the other side, ecological environment deterioration and resource scarcity have become prevalent. Called by the current situation, circular agriculture arises as a direction for the industry to achieve sustainable development. This study develops an evaluation indicator system for circular agriculture using an entropy method, and evaluates factors that could drive the Chinese agricultural industry to achieve better performance. We employ the method using provincial data collected from the province of Henan, in which around 10% of the total grain in China is produced. It was found that agricultural technology and water resources per capita are positively related to circular performance in agriculture. In contrast, urbanization and arable land per capita are negatively related to circular performance. This article provides support to the government in policy-making related to the improvement of circular agricultural performance.
1. Introduction
Growing industrialization in agriculture enormously increases the outputs of grain, contributing to the alleviation of the grain supply crisis globally. In 2019, nearly 690 million people suffered to varying degrees of starvation worldwide, accounting for 8.9% of the populace. Grain shortage was the main reason for starvation. The largest number of undernourished people was in Asia, with 381 million [1]. Globally, around 14% of food produced is lost from the post-harvest stage up to, but excluding, the retail stage [2]. Agricultural waste is a huge pool of untapped biomass resources that may represent economic and environmental burdens [3]. Therefore, an effective agricultural development path must be adopted to facilitate the food supply and improve the nutrition of the global population. The development of circular agriculture is an important way to ease starvation, reduce grain cost, and promote the sustainability of the global grain supply chain. Apart from starvation, another stimulator for circular agriculture is the reduction of the environmental impact of modern agriculture. The industry has become the second-largest contributor of greenhouse gas emissions globally, accounting for 50 and 60% of the total emissions of CH4 and N2O from human activities, respectively [4]. To solve the increasingly serious problems of environmental pollution, governments have been exploring sustainable agricultural models to maintain grain outputs, and meanwhile reduce the pollution impact by methods such as leverages, financial supports, and regulations. For example, since the 1990s, the Japanese government has set a goal of creating a recycling-oriented society, and issued a series of acts related to circular agriculture, including the Basic Law for Promoting the Creation of a Recycling-Oriented Society in 2003 and the Regulations for Agricultural Production Activities in Harmony with the Environment in 2003 [5]. The American government enacted laws to promote sustainable agricultural production, including the Farm Security and Rural Investment Act in 2002 and the New Farm Bill in 2014. It also provided subsidies, assistance, and insurance to farmers to guarantee the capacity for agro-ecological compensation [6].
In China, circular agriculture is promoted as a top-down national political goal [7]. In 2015, the Chinese government promulgated the National Sustainable Agriculture Development Plan (2015–2030). It proposed to promote the “rice–fish symbiosis”, “pig and biogas fruit”, and forest economies, as well as other ecological circular agricultural models according to local conditions. By 2020, the national modern agricultural demonstration zone and the main grain-producing counties were expected to basically realize the recycling of agricultural resources in the region. By 2030, the country will achieve zero discharge of agricultural waste. In 2016, the Ministry of Agriculture of China promulgated the Guidelines for Ecological Circular Agriculture Projects in Comprehensive Agricultural Development Areas (2017–2020), further proposing to improve the quality and safety of agricultural products, the level of standardized production, and the level of circular agricultural development [8]. Presently, China’s per capita grain possession has maintained a level above the world average, and grain yields have been steadily increasing to assure self-sufficiency. Though China is the most populous agricultural country, it also faces a series of challenges in the transition from traditional to modern agriculture. For example, the overuse of pesticides, chemical fertilizers, and agricultural films, which not only cause soil infertility and contamination, but also lead to food safety concerns, such as the presence of harmful substances in agricultural products. These challenges hinder sustainable development in the agricultural industry. One way to address the issue is turning to a more circular form of agriculture in China. The Food Security White Paper notes that China actively exchanges grain with the world’s major grain-producing countries. In 2018, total grain imports, including soybeans and other oilseeds and feedstuffs, amounted to 115.55 million tons and total exports to 3.66 million tons, increasing by 944.8% and 171.1%, respectively, from 1996. Furthermore, the total imports of soybeans, grains, and grain flour were 88.03 and 20.47 million tons, respectively, in 2018, accounting for 4.9% of the world’s grain trade. Therefore, developing circular agriculture is of great value not only to China’s food capacity and security, but also to the prosperity of the global food trade market.
As one of the major grain-producing provinces, Henan’s agricultural production played an important role in securing China’s agricultural development and social stability for a long time. Although the agricultural economy of Henan has developed rapidly in recent years, there are still many problems. For example, white pollution has led to reduced soil organic matter and less fertility, and the waste of water resources and harsh living conditions in rural areas has continued. All of these issues seriously restrict circular agriculture. In the context of developing circular agriculture, this article takes Henan, a major agricultural province in China, as an example to construct an evaluation index system and empirically analyze the main factors affecting the development of circular agriculture. Through the research, we hope to provide support to the government in policy-making related to the improvement of circular agricultural performance.
The remainder of this article is organized as follows: Section 2 is the literature review for related studies of circular agriculture performance. Section 3 is the evaluation of circular performance in agriculture. Section 4 is an empirical analysis of the influencing factors of circular agriculture development in Henan. Section 5 contains the conclusions, suggestions, and limitations.
2. Literature Review
There are mainly two aspects related to this article: one is the connotation and development mode of circular agriculture, and the other is the evaluation of circular agriculture.
2.1. Connotation and Development Mode of Circular Agriculture
Circular agriculture is a new type of agriculture with low investment, high circulation, high efficiency, high technology, and high industrialization [9]. Circular agriculture focuses on material and energy circularity combined with natural resources [10]. The circular approach can help achieve ecological, economic, and social goals together [8]. The essential characteristics of circular agriculture are the industrial chain and saving of resources [11]. Sayadi-Gmada et al. [12] pointed out that the concept of the circular economy mainly includes the three pillars of designing out waste and pollution, keeping products and materials in use, and regenerating natural systems. Therond et al. [13] believed that, according to the differences in ecosystem services and external inputs, it could be divided into chemical inputs, biological inputs, and biodiversity-based farming systems. Based on different national conditions, scholars put forward the feasibility of sustainable agricultural development modes in different countries [14,15,16,17,18]. Ramtin et al. [19] proposed a sustainable planting model that considers economic, environmental, and social goals simultaneously. Empirical evidence shows that economic, self-sufficiency, environmental, and social goals have significantly different effects on the performance of planting models. Cattaneo et al. [20] proposed that, from the perspective of the circular bio-economy, the agrarian sector has gone worse hand in hand with the landscape functional structure. Toop et al. [21] proposed that, in the context of the agri-food chain, the circular economy aims to reduce waste while also making the best use of the wastes produced by using economically viable processes and procedures to increase their value. Vega-Quezada et al. [22] analyzed the synergy between agriculture and bio-energy, and pointed out that it is economically feasible to establish a systematic and circular agricultural development model. Aznar-Sanchez et al. [23] pointed out that Almeria (southeast Spain) can become a model of a high-yield agricultural system because of its focus on waste management, preventing product waste, and improving water and energy use efficiency. Duque-Acevedo et al. [24] analyzed the management of agricultural waste biomass in the framework of a circular economy, and pointed out a sustainable development model that makes it possible to produce more food and energy with fewer fossil fuels, low pollutant gas emissions, and minimal solid waste. Collivignarelli et al. [25] reviewed the possible alternatives to reuse bio-solids, and explored the application of bio-solids with soil fertilizer in agriculture. Theuerl et al. [26] pointed out a vision of agricultural biogas production in Germany, which works mainly with residues. It is flexible about feed stocks, digester operation, microbial communities, and biogas output. Jiang [6] comparatively analyzed the differences in the implementation modes of circular agriculture in Germany, the United States, and Japan, and pointed out that China’s development of circular agriculture should build a collaborative system that enhances the development momentum of ecological circular agriculture. Yin et al. [11] pointed out that China’s circular agriculture development model is mainly divided into three categories, the partial circular mode based on the promotion and integration of an ecological agriculture model, the internal circular mode that aims at the multi-level recycling of agricultural waste resources, and the overall circular mode oriented towards the circular agricultural park. The goals of circular agriculture are in the same line as the circular economy. The circular economy aims to improve resource utilization efficiency, with special attention to urban and industrial waste, in order to achieve a better balance between the economy, environment, and society [7]. Therefore, circular agriculture not only pays attention to development in the rural area, but also pays attention to the circular development between the city and the countryside [27]. Recovering human-derived nutrients can advance circular economies by linking increasingly urban global populations with local cropland, offsetting unsustainable fertilizer use and improving access in low-income countries [28]. Due to the serious waste of resources in the production and transportation of food in rural areas, urban agriculture has been an important way to improve the development of circular agriculture in recent years. Martellozzo et al. [29] pointed out that urban agriculture would require roughly one-third of the total global urban area to meet the global vegetable consumption of urban dwellers. The variations in the space required across countries are derived mostly from variations in urban population density, and much less from variations in yields or per capita consumption. Moreover, scholars believe that, in order to reduce waste and increase resource utilization, the supply chain in the development of circular agriculture must be improved [30,31].
2.2. Evaluation of Circular Agriculture
A circular economy intends to turn waste into resources that can be reintroduced into the production process, eliminating the negative externalities [32]. The reasonable evaluation of circular agriculture has become the key problem of sustainable agriculture development [33,34]. On the one hand, it comprehensively evaluates the development of circular agriculture in countries and regions from the macro-level. Di Maio et al. [35] indicated that the key point of a circular economy is keeping resources within the economy when products no longer serve their functions, so that materials can be used again, and therefore generate more value. They proposed a new value-based indicator to assess the performance of actors in the supply chain in terms of resource efficiency and the circular economy. Feng and Song [36] established an indicator system that characterized the level of circular economy in agricultural development based on the theory of circular economy, and made a principal component analysis for the 17 districts in the providence of Shandong in China. The results indicated that the level of the circular economy in agricultural development does not match the gross developmental level in each district. Xia and Ruan [37] identified critical barriers for the government, farmers, and enterprises in developing circular agriculture. Mechthild et al. [38] pointed out the key success and risk factors of ecological innovation business models, promoting a circular economy by charging for the inevitable waste or by-products of agriculture. Qin et al. [39] analyzed the impact of technology lock-in and substitution on the circular agro-ecological compensation. They found that the promotion of circular agriculture may effectively enhance the utilization rate of biomass energy and reduce the consumption potential of fossil energy by over 50%. On the other hand, it evaluates the development of circular agriculture in different industries, different enterprises, and different practice modes from the micro-level. Scholars have already evaluated issues, such as food wastes [40], water management, and agriculture [41], in mulberry–dyke and fish–pond systems [42]. Recent research on the driving factors of circular agriculture development is from the perspective of farmers to explore factors that influence farmers’ participation in circular agricultural projects [43,44,45,46]. Xing et al. [47] pointed out that the environmental awareness of farmers who are not involved in recycling agriculture is still relatively weak. At the same time, entrepreneurship plays a vital role in promoting the circular model of emerging economies; entrepreneurship is key to turning government initiatives into an economically viable and sustainable circular operations [8]. Fan et al. [48] used the life cycle assessment method to analyze the circular agriculture industry company of Xingyuan, Fuqing. They pointed out that the framework of recycling agriculture should be actively adjusted from the perspective of reducing environmental impact. Moreover, Fan et al. [49] pointed out that a longer industrial chain of circular agriculture is not better. At different evaluation angles, different optimal combinations of the industrial chain models of circular agriculture can achieve the minimum environmental load or the highest environmental benefit. Wu et al. [50] evaluated a certain circular agricultural project in Jiangjiazhuang, a typical agricultural village in China. They pointed out that circular agriculture is a sustainable agricultural system that could improve environmental conditions in rural areas.
3. Evaluation of Circular Agriculture Performance
3.1. Construction of the Evaluation Index System
This article follows the 3Rs principle of reduce, reuse, and recycle in circular agriculture, and builds a comprehensive evaluation index system for circular agricultural development. Circular agriculture emphasizes the material efficiency and energy conversion efficiency of the agricultural system, the effective control of harmful substances and greenhouse gas emissions, and the innovation of agricultural economic development models [11]. Sustainability is a key issue coined in the circular economy [51]. According to [10], the agricultural wastes are analyzed from three aspects: social impact, environmental impact, and economic impact. According to [33], circular agriculture can be analyzed from four aspects: economic and social performance, input resource reduction, resource reuse, and resources and environmental safety. Realizing the win–win of agricultural economy and eco-environmental benefits is the overall goal of circular agriculture. Agriculture circular economy practices can be advantageous when using bioenergy in the agro-industrial sector. The circular economy (grow–make–use–restore) aims to influence material and energy flows to increase environmental gains and avoid costs [52]. The evaluation of circular agriculture development can be investigated in conjunction with agricultural production behavior and corresponding results. The agricultural eco-economic system has a circular total, and the circular total depends on the input outside of the system and the consumption within the system. Therefore, the evaluation of circular agriculture development can start from the agricultural production behavior and the results, and fully consider the input, process, and output of the system [34]. There have been studies that have tried to give a comprehensive analysis of renewable resources’ effect on agricultural circular economy [53]. Based on [33,34,53], the measurements cover four categories of indicators:(1) economic and social performance indicators that measure the social benefits brought by the development of circular agriculture. From C1 to C4, we mainly measured the agricultural output value, farmers’ income, per capita grain output, and total power of agricultural machinery.(2) Input resource reduction indicators reflect the reduce principle, which measure the input of material and energy and the reduction of resource consumption in agricultural production processes. The reduce principle in circular agriculture refers to the reduction of material use in the processes of plant cultivation and production [33]. We hence measure the reduction of the most commonly used materials, such as fertilizers, pesticides, and agricultural membranes, which are the indicators corresponding to C5, C6, and C7. Taking the utilization of agricultural membrane as an example, circular agriculture requires using less membrane per unit area of crops to reduce the negative impact of membrane on land productivity [54]. (3) Resource reuse indicators reflect the reuse principles, and they evaluate the degree to which the waste is turned into reusable resources, as well as waste reduction in agricultural production processes. The reuse principle is first measured by the level of the effective utilization of fertilizers (C8), and a high level means that more biogas fertilizers are used as reusable resources to be put into agricultural development [53]. Second, we incorporated the reuse of land as an indicator (C9) to measure circular performance, which is reasonable, because land reuse significantly improves the planting efficiency in circular agriculture. (4) Resources and environmental safety indicators consider the ecological and environmental benefits while pursuing economic benefits in the processes of agricultural production. From C10 to C12, we mainly measured forest resources, arable land resources, and land irrigation to illustrate the environmental status and resource potential of circular agriculture development. The low level of agricultural waste utilization tends to have a negative impact on the environment [55]. A total of 12 indicators based on the four categories of indicators are developed and shown in Table 1.

Table 1.
Comprehensive evaluation index system for circular agriculture performance.
3.2. Calculation of Comprehensive Evaluation Index
In the comprehensive evaluation index system, the attributes of each indicator are divergent, and the scales of features in different dimensions have large inconsistencies, which leads to low comparability of data. Therefore, to ensure the reliability of data, it is necessary to standardize the collected data to make the values of each indicator at the same level for further comparative analysis. We used the extreme value method to perform a dimensionless conversion for each metric. The index standardization formula method is as follows.
If there are n samples and m indicators, Xij is the j-th indicator value of the i-th sample (i = 1, …, n; j = 1, …, m).
To facilitate the calculation, the standardized data Xij′ will still be recorded as Xij in the future calculations. The original data after standardized processing are shown in Table 2.
Table 2.
Standard values of various indicators of the circular agriculture development level in Henan from 2000 to 2018.
3.3. Determination of Index Weight
In Table 1, indicators do not have an equal weight of importance. This article adopts the entropy weight method to assign weights to various indicators, and calculates the weight of each indicator. Compared to principal component analysis [36], including the Grey-Dematel approach [37] and life cycle assessment [48], the entropy weight method is an objective weighting method with high credibility and accuracy, which can deeply reflect the distinguishing ability of indicators, and then determine the weight.
- Step 1:
- Calculate the proportion of the j-th index value of the i-th sample.
- Step 2:
- Calculate the information entropy of the j-thindex.
- Step 3:
- Calculate the difference coefficient of the j-th index.Dj = 1 − Ej, 1 ≤ j ≤ m
- Step 4:
- Calculate the weight of the j-th index.
According to the above method steps, the weight of each specific index in the evaluation index system of circular agriculture development in Henan was calculated, as shown in Table 3.
Table 3.
Weights of comprehensive evaluation indicators for circular performance in agriculture in Henan.
3.4. Calculation of the Comprehensive Performance Evaluation of Circular Agriculture
Based on Section 3.2 and Section 3.3, this article calculates the comprehensive performance of circular agriculture as follows.
In the formula, Si is the comprehensive evaluation score of the n-th sample, Wj is the weight of the j-th index, and Xij is the standardized value of each evaluation index. Based on the above method, the corresponding data can be processed to obtain a comprehensive performance score of circular agriculture in Henan from 2000 to 2018.
According to Figure 1, from 2000 to 2018, the development level of circular agriculture in Henan continued to increase as a whole, which was a fluctuating and rising process. The comprehensive evaluation index for the development of circular agriculture in Henan in 2000 was 0.4283, and in 2018, it was 0.7301, an increase of about 70% in 19 years. According to the characteristics of different stages, the development process of circular agriculture from 2000 to 2018 can be divided into three stages: the first stage is 2000–2009, the stagnant development stage. The average comprehensive evaluation index at this stage was 0.4032, and the evaluation value of each year was lower than 0.4283 in 2000. Henan’s circular agriculture is in a low-level fluctuation stage, and the degree of development is relatively low. At this stage, the traditional agricultural production mode was still the mainstay. In the agricultural production process, high input and high consumption were used to obtain high output, and the conservation and recycling of agricultural resources were ignored. The second stage is 2009–2013, a period of slow fluctuations and rising. The average comprehensive evaluation index at this stage was 0.4557, and the evaluation index for circular agricultural development in each year was greater than the evaluation value in 2000. It was 0.4613 in 2013, a slight increase in fluctuations. The third stage is from 2013 to 2018, the rapid development stage. Although there was a small drop in 2016, the overall impact on the development of circular agriculture was relatively small. In general, circular agriculture deepened rapidly at this stage, and the growth rate accelerated, from 0.4613 in 2013 to 0.7301 in 2018, and the average comprehensive evaluation index was 0.5987.
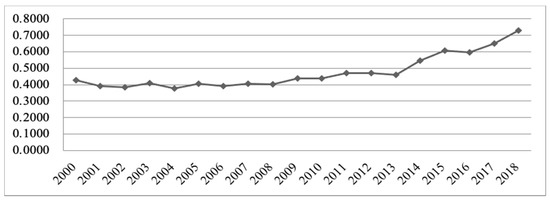
Figure 1.
Comprehensive performance value of circular agriculture in Henan.
4. Empirical Analysis on the Driving Factors of Circular Agriculture Performance
4.1. Selection and Description of Indicators
According to [56], this article identifies six types of driving factors: economic development, urbanization, technology, government support, arable land resources, and water resources.
(1) The level of economic development (X1). The development of circular agriculture requires a certain amount of capital investment, and there is often a mismatch between economic benefits and economic investment. The size of the regional capital investment capacity has an important impact on the development of circular agriculture. At the same time, farmers in economically developed areas have stronger environmental awareness and stronger motivation to develop circular agriculture [4].
Hypothesis 1 (H1).
Economic development has a positive impact on the performance of circular agriculture. This article uses the variable of per capita GDP as the indicator of the economic development level.
(2) The level of urbanization (X2). In the context of circular agriculture, farmers, professional cooperatives, and leading enterprises coexist. Urbanization is accompanied by the optimization and upgrading of the industrial structure, which enables enterprises to play a better role in promoting the development of circular agriculture [44]. Broadly, locations with high cropland density, nutrient-intensive crops, and a compact urban area may find agricultural nutrient reuse particularly impactful and achievable, creating opportunities to boost productivity by coupling urban water and regional agriculture systems [47]. Urbanization will also cause more urban waste to be produced and transferred to rural areas, causing serious water pollution and degrading soil quality.
Hypothesis 2 (H2).
Urbanization is a double-edged sword regarding the development of rural areas. This article measures the level of urbanization by the proportion of the urban population in the total population.
(3) Technology level (X3). As a new type of modern agriculture, circular agriculture requires a higher level of technical support. Technology is often a prerequisite for the development of circular agriculture [39]. A higher level of technology means a higher chance of realizing the principle of reduce, reuse, and recycle, and the better development of circular agricultural performance.
Hypothesis 3 (H3).
The level of technological development has a positive impact on the development of circular agriculture. This article uses the variable of R&D expenditures of universities and R&D specialized institutions to measure the level of technological development.
(4) Government support(X4). The government plays a vital role in the development of circular agriculture. In the initial stage of the circular economy, the government’s role in promoting is necessary. The development of circular agriculture should be guaranteed by policy support using an analytical framework [56]. On the one hand, from the perspective of the scale of circular agriculture development, circular agriculture is developing from a decentralized cycle to a large-scale cycle. The government needs to connect farmers, enterprises, and rural intensive transformation. On the other hand, government financial support can directly reduce the cost of farmers’ disposal of agricultural waste and the cost of developing cleaner production [11]. In practice, whether the government has the awareness and ability to develop circular agriculture directly affects circular agriculture in a region.
Hypothesis 4 (H4).
The government support for agriculture has a positive impact on the performance of circular agriculture. The proportion of financial support for agriculture to the total financial expenditure is used to measure government support for agriculture.
(5) Arable land per capita (X5). In China, arable land per capita is scarce and limited [11], which is also an important reason why the concept of the circular economy emerges.
Hypothesis 5 (H5).
The arable land per capita has a negative impact on the performance of circular agriculture. The richer the arable land per capita, the stronger the inclusiveness of the ecosystem and the greater the environmental capacity, and the government and farmers will be relatively less motivated to develop circular agriculture.
(6) Water availability of water withdrawal per capita (X6). Generally, a region with abundant water resources is more environmentally diverse [16], and has a higher ability to explore a variety of circular agricultural development.
Hypothesis 6 (H6).
The water resource per capita has a negative impact on the performance of circular agriculture.
4.2. Data Source and Data Processing
The data used in this article are mainly from the 2000–2018 Henan Province Statistical Yearbook, Henan Province Rural Statistical Yearbook, and China Rural Statistical Yearbook, which is shown in Table 4. The dimensions of the data are not uniform. This article standardizes the data, and the original data after standardizationare shown in Table 5.
Table 4.
Variable descriptive statistics.
Table 5.
Standardized data of various variables from 2000 to 2018.
4.3. DrivingFactors Stationarity Test
(1) Unit root test. According to [20], this article used the augmented Dickey−Fuller test method, which is mainly used to verify the stationary hypothesis of time series. It can be seen from Table 6 that, at the significance level of 1%, the first-order difference series of X1, X4, X5, and X6 were stationary; at the 5% level of significance, the first-order difference series of Y, X2, and X3 were stationary, which satisfied the premise of the co-integration test of the same-order single integration. Therefore, a co-integration test can be performed.
Table 6.
Unit root test of the factors influencing the development level of circular agriculture.
(2) Co-integration test. This article adopts the EG two-step method. After checking the stationarity of each variable, it is necessary to check the stationarity of the residual after regression to ensure the existence of the co-integration relationship. The first step is to calculate the unbalanced error (et) of the co-integration regression equation, and the second step is to test its single integration. It can be seen from Table 7 that the augmented Dickey−Fuller test value was 3.3685 at the significance level of 1%, which was less than the corresponding McKinnon critical value of 2.6998. Therefore, the null hypothesis should be rejected at the significance level of 1%. Therefore, the null hypothesis should be rejected at a significance level of 1%. The residual sequence et is a stationary sequence, and there is a long-term equilibrium co-integration relationship between the variables, and a regression model can be constructed.
Table 7.
Unit root test of residual series.
4.4. Model Construction and Estimation
To estimate the effects of the six driving factors on the performance of circular agriculture, this article constructs the following regression model.
Y represents the comprehensive performance score of circular agriculture, X1 represents the increase in per capita GDP, X2 represents the proportion of the urban population to the total population, X3 represents the R&D expenditures of universities, X4 represents financial expenditures, X5 represents arable land resources per capita, X6 represents water resources per capita, α0 is a constant term, α1~α6 are regression parameters, and ui is a random error term. As shown in Table 8, X1 and X4 were not significant. Given the significance level α=0.01, because F=33.7129>Fα(4,14) = 3.11, the F test is significant. Checking the DW statistics table shows that dL = 0.859, dU = 1.848, DW = 1.36, so it was impossible to decide whether there was an autocorrelation. Then, we used the BG test for the autocorrelation test, LM = TR2 = 3.5207 (p-value of 0.1720), indicating that the model did not have autocorrelation, and the overall fit of the model was good. Therefore, the linear relationship between the explanatory variables X2, X3, X5 and X6 was significant.
Table 8.
Regression result.
4.5. Analysis of Empirical Results
(1) The level of economic development. The result shows that Hypothesis 1 is not true. The development mode of circular agriculture is different from traditional agriculture. The implementation of circular agriculture has higher requirements for related technologies and talents. It also requires a large amount of capital investment in the early stage of development. The higher the level of regional economic development, the more it can provide for the implementation of circular agriculture. At the same time, the higher the level of economic development, the stronger the awareness of relevant subjects to participate in circular agricultural projects, which is more conducive to circular agriculture [44,45].
(2) The level of urbanization. The result shows that the level of urbanization has a significant negative impact on the development level of circular agriculture. At the 5% level of significance, each increase in the proportion of the urban population in the total population by one unit will reduce the development level of circular agriculture by 1.0614 units. On the one hand, the increase in the level of urbanization can provide technical and financial support for the development of circular agriculture. On the other hand, urbanization leads to reduced rural arable land and soil quality, as well as serious water pollution. In general, the increase in the level of urbanization has more negative effects than positive effects on the development of circular agriculture. One explanation may be due to the rapid development of urbanization in China, and rapid urbanization has increased the cost of agricultural products’ transportation and reuse [29], and the efficiency of supply chain management in urban and rural areas is relatively low.
(3) Technology level. The result shows that the level of technological development has a significant positive impact on circular agriculture in Henan. Similar to [11], the level of technological development has the highest degree of influence on the development level of circular agriculture. Advanced science and technology is an important support for circular agriculture. At the 1% significance level, for every additional unit of technological development, the development level of circular agriculture will increase by 2.0958 units.
(4) Government support. The result shows that Hypothesis 4 is not valid. Contrary to [11,56], the government does not play a role in the development of circular agriculture. This may be related to the development stage of circular agriculture in Henan. The development of circular agriculture requires the government to increase its participation in the development of circular agriculture, build infrastructure to promote the development of circular agriculture, and provide necessary financial and technical support. Therefore, the government should strengthen its participation intensity and scope in the development of circular agriculture, and improve corresponding subsidy measures.
(5) Arable land per capita. The result shows that per capita arable land resources have a significant negative impact on the development level of circular agriculture. At the 5% level of significance, for every increase in per capita arable land resources, the development level of circular agriculture will decrease by 0.1926 units. When per capita arable land resources are sufficient, farmers lack the motivation to increase land unit output and establish an effective circular agricultural development system.
(6) Water availability of water withdrawal per capita. The result shows that water resources per capita have a positive and significant impact on the development level of circular agriculture. At a significant level of 10%, each increase in per capita water resources will increase the development level of circular agriculture by 0.1720 units. The amount of water resources per capita has the least impact on the development level of circular agriculture.
5. Conclusions and Suggestions
5.1. Conclusions
This article develops an evaluation system for circular agriculture performance using the entropy weight method, and constructs a regression model to analyze the critical factors affecting the performance of circular agriculture. Based on provincial data from 2000 to 2018 in Henan, this article empirically measures the comprehensive performance values of circular agriculture each year in Henan, and further analyzes the main factors that affect the level of circular agriculture performance in Henan. The main conclusions are as follows.
(1) Overall, circular agriculture performance in Henan has shown an upward trend from 2000 to 2018, and, especially after 2013, the development level of circular agriculture in Henan has improved rapidly.
(2) Circular agriculture in Henan is mainly affected by urbanization, technological advancement, and natural resources per capita. Agricultural technology and water resources per capita are positively related to the circular performance in agriculture. In contrast, urbanization and arable land per capita are negatively related to circular performance in agriculture.
5.2. Suggestions
(1) Reduce the material input and improve resource utilization. Strengthen the supervision of the agricultural production process and strictly prohibit agricultural production factors, such as pesticides and fertilizers, that do not meet the specifications from entering the market. Adopt advanced irrigation technology to further increase the utilization rate of water resources and reduce water waste.
(2) Treat the development of circular agriculture in urban and rural areas with caution. Urbanization is conducive to improving resource utilization efficiency, but the rapid development of circular agriculture in urban and rural areas must first reduce transportation costs and improve supply chain management efficiency.
(3) Increase investment in recycling agricultural technology and technology promotion. In the development of circular agriculture, it is necessary to fully integrate production, education, and research, and to work closely with local universities and scientific research institutions to improve the level of agricultural technology and improve the efficiency of agricultural resource utilization.
5.3. Limitations
This article uses Henan provincial data to measure the development performance of China’s circular agriculture. However, considering data availability, the indicator of recycling performance is not reflected in our study. The development mode of circular agriculture in Henan is mainly based on the partial circular mode and the internal circular mode. The overall circular mode in the direction of circular agricultural parks is relatively rare. In the future, the research will further collect data at the provincial level in China, evaluate the development performance of China’s circular agriculture more comprehensively, and compare the models of various countries to promote a model for more effective circular agricultural development in China.
Author Contributions
Conceptualization, B.L.; methodology, X.X. and Y.F.; formal analysis, B.L.; writing—original draft preparation, Y.F.; writing–review and editing, M.F.; supervision, X.X. All authors have read and agreed to the published version of the manuscript.
Funding
This research was funded by the National Natural Science Foundation of China (71702174, 71703122,71703123) and the Fundamental Research Funds for the Central Universities (2232018H-09).
Data Availability Statement
Data available in a publicly accessible repositories of the Statistics Bureau of Henan Province, China. Specifically, data are from the 2000–2018 Henan Province Statistical Yearbook, Henan Province Rural Statistical Yearbook, and China Rural Statistical Yearbook.
Acknowledgments
This research was supported by Business School of Zhengzhou University in China (101-32610255).
Conflicts of Interest
The authors declare no conflict of interest.
References
- FAO; IFAD; UNICEF; WFP; WHO. The State Of Food Security And Nutrition In The World 2020. In Transforming Food Systems For Affordable Healthy Diets; FAO: Rome, Italy, 2020. [Google Scholar]
- FAO. The State Of Food And Agriculture 2019. In Moving Forward On Food Loss And Waste Reduction; FAO: Rome, Italy, 2019. [Google Scholar]
- Gontard, N.; Sonesson, U.; Birkved, M.; Majone, M.; Bolzonella, D.; Celli, A.; Angellier-Coussy, H.; Jang, G.W.; Verniquet, A.; Broeze, J.; et al. A Research Challenge Vision Regarding Management Of Agricultural Waste In A Circular Bio-Based Economy. Crit. Rev. Environ. Sci. Technol. 2018, 6, 614–654. [Google Scholar] [CrossRef]
- Hu, Z.; Hu, H. Low-Carbon Agriculture: An Inevitable Choice In Line With The Laws Of Agricultural Development. Inquiry Econ. Issu. 2015, 9, 169–172. [Google Scholar]
- Liu, J. Development and Enlightenment of Japan’s Agricultural Circular Economy. Issues Agric. Econ. 2015, 36, 105–109. [Google Scholar]
- Jiang, G. The 332 Model Of Ecological Circular Agricultural Development In The United States, Japan, Germany And Other Countries And Its “Systematization” Enlightenment. Sci. Mana. Res. 2018, 36, 108–111. [Google Scholar]
- Ghisellini, P.; Cialani, C.; Ulgiati, S. A Review On Circular Economy: The Expected Transition To A Balanced Interplay Of Environmental And Economic Systems. J. Clean. Prod. 2016, 114, 11–32. [Google Scholar] [CrossRef]
- Zhu, Q.; Jia, R.; Lin, X. Building Sustainable Circular Agriculture In China: Economic Viability And Entrepreneurship. Manag. Decis. 2019, 57, 1108–1122. [Google Scholar] [CrossRef]
- Zhou, Z.; Wang, J.; Zhou, Y.; Sun, Y. Thoughts On The Development Of Circular Agriculture. Res. Agric. Moder. 2004, 5, 348–351. [Google Scholar]
- Czikkely, M.; Olah, J.; Lakner, Z.; Fogarassy, C.; Popp, J. Waste Water Treatment With Adsorptions By Mushroom Compost The Circular Economic Valuation Concept For Material Cycles. Int. J. Eng. Bus. Manag. 2018, 10, 1–13. [Google Scholar] [CrossRef]
- Yin, C.; Tang, H.; Zhou, Y. The Connotation, Development Approaches And Policy Recommendations Of Circular Agriculture. Chin. J. Agric. Res. Reg. Plann. 2006, 1, 4–8. [Google Scholar]
- Sayadi-Gmada, S.; Rocio Rodriguez-Pleguezuelo, C.; Rojas-Serrano, F.; Parra-López, C. Inorganic Waste Management in Greenhouse Agriculture in Almeria (SE Spain): Towards a Circular System in Intensive Horticultural Production. Sustainability 2019, 14, 3782. [Google Scholar] [CrossRef]
- Therond, O.; Duru, M.; Roger-Estrade, J.; Richard, G. A New Analytical Framework Of Farming System And Agriculture Model Diversities. A Review. Agron. Sustain. Dev. 2017, 3, 21. [Google Scholar] [CrossRef]
- Yuichiro, A. Rethinking Sustainable Agriculture in Thailand. A Governance Perspective. J. Sus. Agric. 2010, 34, 389–416. [Google Scholar]
- Prince, O.; Enoch, A.K.; David, F. Facts Behind the Myth of Conservative Rurality. Major Determinants of Rural Farmers’ Innovation Adoption Decisions for Sustainable Agriculture. Geo. J. 2016, 82, 1051–1066. [Google Scholar]
- Johan, R.; John, W.; Gretchen, D.; Andrew, N.; Nathanial, M.; Line, G.; Hanna, W.; Fabrice, D.; Mihir, S.; Pasquale, S.; et al. Sustainable Intensification of Agriculture for Human Prosperity and Global Sustainability. J. Hum. Environ. 2017, 46, 4–17. [Google Scholar]
- Evelien, M.; Henrik, M.; Fleur, M.; Richard, W.M.; Catriona, J.M.; Marion, S.; Stephan, H.; Andrew, B.; Jayson, B.; Christian, B.; et al. When Experts Disagree. The Need to Rethink Indicator Selection for Assessing Sustainability of Agriculture. Environ. Dev. Sustain. 2017, 19, 1327–1342. [Google Scholar]
- Djagba, J.F.; Zwart, S.J.; Houssou, C.S.; Tente, B.H.A.; Kiepe, P. EcologicalStainability and Environmental Risks of Agricultural Intensification in Inland Valleys in Benin. Environ. Dev. Sustain. 2019, 21, 1869–1890. [Google Scholar] [CrossRef]
- Ramtin, J.; Ahmad, A.S.; Fatemeh, T.; Steven, V.P.; Hossein, A. Sustainable Cropping Pattern in North Iran. Application of Fuzzy Goal Programming. Environ. Dev. Sustain. 2017, 19, 2199–2216. [Google Scholar]
- Cattaneo, C.; Marull, J.; Tello, E. Landscape Agroecology. The Dysfunctionalities of Industrial Agriculture and the Loss of the Circular Bioeconomy in the Barcelona Region, 1956–2009. Sustainability 2018, 12, 4722. [Google Scholar] [CrossRef]
- Toop, T.A.; Ward, S.; Oldfield, T.; Hull, M.; Kirby, M.E.; Theodorou, M.K. Agrocycle—Developing A Circular Economy In Agriculture. Energy Procedia 2017, 123, 76–80. [Google Scholar] [CrossRef]
- Vega-Quezada, C.; Blanco, M.; Romero, H. Synergies Between Agriculture And Bioenergy In Latin American Countries: A Circular Economy Strategy For Bioenergy Production In Ecuador. New Biotech. 2017, 39, 81–89. [Google Scholar] [CrossRef]
- Aznar-Sanchez, J.A.; Velasco-Munoz, J.F.; Garcia-Arca, D.; Lopez-Felices, B. Identification of Opportunities for Applying the Circular Economy to Intensive Agriculture in Almeria (South-East Spain). Agronomy 2020, 10, 1499. [Google Scholar] [CrossRef]
- Duque-Acevedo, M.; Belmonte-Urena, L.J.; Plaza-Ubeda, J.A.; Camacho-Ferre, F. The Management of Agricultural Waste Biomass in the Framework of Circular Economy and Bioeconomy: An Opportunity for Greenhouse Agriculture in Southeast Spain. Agronomy 2020, 4, 489. [Google Scholar] [CrossRef]
- Collivignarelli, M.C.; Canato, M.; Abba, A.; Miino, M.C. Biosolids: What Are The Different Types of Reuse? J. Clean. Prod. 2019, 238, 117844. [Google Scholar] [CrossRef]
- Theuerl, S.; Herrmann, C.; Heiermann, M.; Grundmann, P.; Landwehr, N.; Kreidenweis, U.; Prochnow, A. The Future Agricultural Biogas Plant in Germany: A Vision. Energies 2019, 3, 396. [Google Scholar] [CrossRef]
- Wielemaker, R.C.; Weijma, J.; Zeeman, G. Harvest To Harvest: Recovering Nutrients With New Sanitation Systems For Reuse In Urban Agriculture. Resour. Conserv. Recycl. 2018, 128, 426–437. [Google Scholar] [CrossRef]
- Trimmer, J.T.; Guest, J.S. Recirculation Of Human-Derived Nutrients From Cities To Agriculture Across Six Continents. Nat. Sustain. 2018, 8, 427–435. [Google Scholar] [CrossRef]
- Martellozzo, F.; Landry, J.S.; Plouffe, D.; Seufert, V.; Rowhani, P.; Ramankutty, N. Urban Agriculture: A Global Analysis Of The Space Constraint To Meet Urban Vegetable Demand. Environ. Res. Lett. 2014, 6, 064025. [Google Scholar] [CrossRef]
- Liu, X.; Xiao, X. The Optimization Of Cyclic Links Of Live Pig-Industry Chain Based On Circular Economics. Sustainability 2016, 1, 26. [Google Scholar] [CrossRef]
- Judit, O.; Peter, B.; Zoltan, L.; Jozsef, P. Processes to Minimize Raw Materials Inventory Level in the Supply Chain. Inf. Tarsad. 2016, 4, 61–84. [Google Scholar]
- Molina-Moreno, V.; Leyva-Diaz, J.C.; Llorens-Montes, F.J.; Cortes-Garcia, F.J. Design of Indicators of Circular Economy as Instruments for the Evaluation of Sustainability and Efficiency in Wastewater from Pig Farming Industry. Water 2017, 9, 653. [Google Scholar] [CrossRef]
- Han, Y.; Long, P.; Chen, Y.; Sui, P.; Gu, S. Research Progress Of Evaluation System For China Circular Agriculture Development. Chin. J. EcoAgric. 2013, 21, 1039–1048. [Google Scholar] [CrossRef]
- Ma, Q.; Huang, X.; Peng, B.; Zhai, W.; Liu, L. A Positive Study of The Evaluation on the Development of Regional Agricultural Recycling Economy. J. Nat. Resour. 2005, 20, 291–299. [Google Scholar]
- Di Maio, F.; Rem, P.C.; Balde, K.; Polder, M. Measuring Resource Efficiency And Circular Economy: A Market Value Approach. Resour. Conserv. Recycl. 2017, 122, 163–171. [Google Scholar] [CrossRef]
- Feng, H.; Song, Z. Evaluation on Development of the Agriculture Circular Economy in Shandong Province. China Popul. Resour. Environ. 2008, 4, 94–98. [Google Scholar]
- Xia, X.; Ruan, J. Analyzing Barriers for Developing a Sustainable Circular Economy in Agriculture in China Using Grey-DEMATEL Approach. Sustainability 2020, 16, 6358. [Google Scholar] [CrossRef]
- Mechthild, D.; Anne, V.; Jan, B.; Katrin, K.; Hugo, D. Critical Success And Risk Factors For Circular Business Models Valorizing Agricultural Waste And By-Products. Resour. Conserv. Recycl. 2021, 165, 105236. [Google Scholar]
- Qin, X.; Liu, Y.; Wang, J.; Jiang, L.L. Evaluation of Ecological Compensation Benefits of Jiangsu Circular Agriculture. Stat. Decis. 2018, 34, 69–72. [Google Scholar]
- Lee, I.B.; Kim, P.J.; Chang, K.W. Evaluation Of Stability Of Compost Prepared With Korean Food Wastes. Soil Sci. Plant. Nutr. 2002, 1, 1–8. [Google Scholar] [CrossRef]
- Butler, D.; Ward, S.; Sweetapple, C.; Astaraie-Imani, M.; Diao, K.; Farmani, R.; Fu, G.T. Reliable, Resilient And Sustainable Water Management: The Safe & Sure Approach. Glob. Chall. 2017, 1, 63–77. [Google Scholar]
- Liu, S.; Min, Q.; Jiao, W.; Liu, C.; Yin, J. Integrated Emergy and Economic Evaluation of Huzhou Mulberry-Dyke and Fish-Pond Systems. Sustainability 2018, 11, 3860. [Google Scholar] [CrossRef]
- Wang, Z.; Lv, J.; Xi, F. Circular Agricultural Engineering. Analysis of Farmers’ Cognition, Behavior and Determinants—Taking Liaoning Province as an Example. Ecol. Econ. 2015, 31, 108–113. [Google Scholar]
- Wang, Y.; Dou, X.C. Study on the Behavioral Response and Influencing Factors of Farmers in Hexi Oasis Irrigation District to Circular Agricultural Engineering. J. Arid Land Resour. Environ. 2015, 29, 25–30. [Google Scholar]
- Huang, W.; Qi, Z.; Wu, L.; Hu, J. The Decision Of Farmers’ Willingness And Behavior To Engage In Ecological Recycling Agriculture. Market Benefits Or Policy Incentives? Chin. J. Popul. Resour. Environ. 2017, 27, 69–77. [Google Scholar]
- Lu, P.; Li, L. Analysis Of The Key Factors Affecting The Development Of Modern Circular Agriculture—Based On The Perspective Of Different Types Of Farmers Adopting Circular Agricultural Technology. Rural Econ. 2018, 12, 93–99. [Google Scholar]
- Xing, M.; Zhang, J.; Huang, G. Perception Of Environmental Protection Of Farmers’ Households Not Participating In Circular Agriculture And An Analysis Of The Causal Factors Based On Surveys In Shanxi And Hubei Provinces. Chin. Rural Econ. 2009, 4, 72–79. [Google Scholar]
- Fan, W.; Zhang, P.; Xu, Z.; Wei, H.; Lu, N.; Wang, X.; Weng, B.; Chen, Z.; Wu, F.; Dong, X. Life Cycle Environmental Impact Assessment of Circular Agriculture: A Case Study in Fuqing, China. Sustainability 2018, 6, 1810. [Google Scholar] [CrossRef]
- Fan, W.; Dong, X.; Wei, H.; Weng, B.; Liang, L.; Xu, Z.; Wang, X.; Wu, F.; Chen, Z.; Jin, Y.; et al. Is It True That The Longer The Extended Industrial Chain, The Better The Circular Agriculture? A Case Study Of Circular Agriculture Industry Company In Fuqing, Fujian. J. Clean.Prod. 2018, 189, 718–728. [Google Scholar] [CrossRef]
- Wu, G.; Cheng, D.; Li, L.; Li, C.; Jiang, G.; Zheng, Y. Biomass Energy Utilisation And Soil Carbon Sequestration In Rural China: A Case Study Based On Circular Agriculture. J. Renew. Sustain. Energy 2018, 10, 013107. [Google Scholar] [CrossRef]
- Song, C.F.; Zhang, C.; Zhang, S.C.; Lin, H.; Kim, Y.; Ramakrishnan, M.; Du, Y.Q.; Zhang, Y.; Zheng, H.B.; Barcelo, D. Thermochemical liquefaction of agricultural and forestry wastes into biofuels and chemicals from circular economy perspectives. Sci. Total Environ. 2020, 749, 141972. [Google Scholar] [CrossRef]
- Barros, M.V.; Salvador, R.; de Francisco, A.C.; Piekarski, C.M. Mapping of research lines on circular economy practices in agriculture: From waste to energy. Renew. Sust. Energ. Rev. 2020, 131, 109958. [Google Scholar] [CrossRef]
- Li, J.; Duan, N.; Guo, S.; Shao, L.; Lin, C.; Wang, J.H.; Hou, J.; Hou, Y.; Meng, J.; Han, M. Renewable resource for agricultural ecosystem in China: Ecological benefit for biogas by-product for planting. Ecol. Inform. 2012, 12, 101–110. [Google Scholar] [CrossRef]
- Landaburu-Aguirre, J.; Garcia-Pacheco, R.; Molina, S.; Rodriguez-Saez, L.; Rabadan, J.; Garcia-Calvo, E. Fouling prevention, preparing for re-use and membrane recycling. Towards circular economy in RO desalination. Desalination 2016, 393, 16–30. [Google Scholar] [CrossRef]
- Muradin, M.; Joachimiak-Lechman, K.; Foltynowicz, Z. Evaluation of Eco-Efficiency of Two Alternative Agricultural Biogas Plants. Appl. Sci. 2018, 11, 2083. [Google Scholar] [CrossRef]
- Wei, B.; Han, J. Research on the Influencing Factors of Urban Circular Agriculture—Taking Beijing as an Example. Chin. J. Agric. Res. Reg. Plann. 2012, 33, 31–39. [Google Scholar]

Publisher’s Note: MDPI stays neutral with regard to jurisdictional claims in published maps and institutional affiliations. |
© 2021 by the authors. Licensee MDPI, Basel, Switzerland. This article is an open access article distributed under the terms and conditions of the Creative Commons Attribution (CC BY) license (http://creativecommons.org/licenses/by/4.0/).