Abstract
Sustainable municipal solid waste (MSW) management is a critical issue that requires planning in accordance with population growth, urbanization, and living standards. An evaluation that integrates system dynamics (SD) is newly built for identifying the interactions between social activities to predict future MSW generation. In this study, SD-based greenhouse gas (GHG), energy, and economic evaluations were conducted for MSW management in the Southern Tai Lake Watershed (STWL) area in China. The considered SD factors include the gross domestic product (GDP) growth, total population, population growth, MSW generation per capita, and MSW generation charges. The results indicate that the current MSW strategy (S1) does not perform well in GHG, energy, and cost evaluation, and the current landfill capacity will be depleted in 2022. Co-processing the landfilled waste with fresh MSW in incineration plants (S7) is the most favorable strategy, which indicates the current landfill capacity will be sufficient for the ash generated from incineration over the next decade. S7 also emits 1.5–3 times less GHG, recovers 2–3.2 times more energy, and obtains 1.3–2.0 times more economic benefits than S1 during 2020–2030. This study offers valuable insights regarding the dynamics of MSW generation and an approach to determine an optimal MSW management strategy for the future.
1. Introduction
Increasing population, urbanization, and living standards have become major environmental challenges to the sustainable management of municipal solid waste (MSW), which affects people worldwide [1]. The latest World Bank report states that 2.01 billion tons of MSW are generated globally each year, and this value is predicted to reach 3.4 billion tons by 2025 [2,3]. Appropriate MSW management is therefore a crucial matter not only for environmental and human health concerns but also in terms of remaining a step ahead with regard to waste sustainability and circular economy [4,5].
Landfilling is by far the most common waste disposal method adopted worldwide because of its easy execution and low operation expenditures [6]. However, leachate leaks are inevitable and can contaminate the surface water, groundwater, and soil [7]. Moreover, CH4 generated through the decomposition of organic matter in landfills accounts for the third largest anthropogenic source of global CH4 emissions, which are strongly positively correlated with climate change [8]. Composting is a viable alternative to landfilling because the decomposed organic portions of MSW can improve soil properties through compost applications, help to avoid manufactured mineral fertilizer treatments, and achieve environmental and economic benefits. Even though, incineration offers advantages with regard to land consumption and energy recovery, its application remains in its infancy in developing countries due to high construction and operation costs and professional management needs [9,10]. MSW management strategies using single or integrated approaches normally depend on the individual situations. Life cycle assessment (LCA) and life cycle cost (LCC) are used to systematically evaluate the environmental and economic feasibility and identify optimal MSW management strategies.
LCA and/or LCC have been widely applied to compare alternative MSW management approaches and/or to analyze existing management policies in terms of environmental and economic sustainability [8]. Some previous studies focused on the potential of incineration to replace landfills in the form of mixed MSW management [11,12]. Organic matter separation, such as food waste (FW), has also been suggested for digestion or composting, and the remaining MSW is incinerated or landfilled [3,10]. The integration of MSW management with sewage treatment is also considered feasible where FW is treated with sewage at a sewage treatment plant [13,14] or co-digested with sewage sludge for resource recovery [15]. These studies were mainly conducted using current MSW data, in which the optimal MSW management strategies were only accessed from the current situation. However, the purpose of an MSW management strategy is to analyze and determine policies for use in the following decades or beyond. The total generated MSW increases with growth in the population, urbanization, and living standards, and MSW compositions also tend to change. The increased amount of MSW will influence the use of current treatment works, such as decreasing the landfill lifespan and requiring alternative treatment facilities. The use of current treatment facilities to the ends of their lifespans or the direct switching from current to alternative facilities is the key issue to be considered. Additionally, the proportion of FW (organic matters) in MSW decreases with increasing urbanization and living standards, which supports the application of incineration [16]. Variations in the generation of MSW affect the uses of the current and proposed waste treatment facilities; therefore, the best MSW management plan based on the current situation may not be the most feasible option when considering the numerous interlinked factors that will affect MSW management strategies in the future. Previous studies have not yet considered the dynamic nature of MSW generation and the interactions between major variables that affect the environmental and economic sustainability of MSW management over the long term.
System dynamics (SD), which was originated by Forrester [17], is defined to address large-scale and complex systems and understand the inter-relationships between behaviors within a specific system over time and the underlying structure and decision rules [18]. SD models have been used to forecast MSW generation and plan sustainable MSW management schemes by qualifying the aspects of MSW separation and recycling at the source [19] from the costs of produced and disposed MSW [20]. SD has been used to simulate changes in the amounts of MSW under different policies by determining the dynamic interactions in the MSW management process [21]. The comparison of reviewed publications is listed in Table 1. The total MSW generation and composition are influenced by variables that are interlinked within social and economic activities, and these affect feasible disposal approaches using the SD model and influence environmental and economic sustainability. However, the mechanisms by which dynamic interactions influence economic and environmental sustainability in MSW management remain poorly understood. To address this issue, SD is used here to forecast the generation and composition of MSW, identify the long-term interactions between various activities, and evaluate the environmental and economic performance based on various activities using LCA/LCC models. To the best of our knowledge, this is the first study to analyze the environmental and economic sustainability of MSW management strategies involving dynamic interactions among various activities over time.

Table 1.
The comparison of the surveyed studies.
The newly developed LCC/LCA + SD model was conducted for MSW management in the South Tai Lake Watershed (STLW) in China. The current MSW strategy in the STLW includes 50% incineration, 40% landfilling, and 10% composting for use in land applications. To identify more sustainable MSW management strategies, five alternative scenarios are proposed to consider the optimal use of the current MSW treatment facilities. The environmental and economic sustainability of the proposed scenarios were evaluated using LCA and LCC approaches that involve the dynamic interactions of various activities affecting MSW generation and composition in an SD model between 2007 and 2030. This study provides new insights for policymakers regarding the optimal MSW management scenarios that involve dynamic interactions among social activities in the future.
2. Materials and Methods
2.1. Study Background of the Southern Tai Lake Watershed
Given the data availability and accessibility for the evaluations, this study focused on STLW, located in Yangtze River Delta in China. STLW contains 2,682,000 inhabitants in an area of 5820 km2 [22]. The MSW generation per capita increased rapidly from 0.5 kg/day/cap in 1980 to 1.1 kg/day/cap in 2010, with an annual increase of 3–10% [23]. In 2018, the total amount of MSW was 1,213,000 tons, with 0.45 ton/cap/year and a recycling rate of 8% [24]. In terms of the MSW composition, the largest contributor in 2018 was organic FW (62.63%), followed by plastic (18.59%); paper (10.89%); and glass, textiles, or miscellaneous (7.89%) [24].
The historical waste management strategies in the STLW are shown in Figure 1. Prior to 2008, the majority of MSW was disposed in unmanaged or sanitary landfills. The first incineration plant was built in 2009, after which the amount of MSW disposed in the incineration plant increased annually from 1.66 × 10⁵ tons in 2009 to 3.61 × 10⁵ tons in 2018. The MSW proportion for composting remained stable, accounting for 3.8 × 10⁴ ton per year from 2007 to 2019.
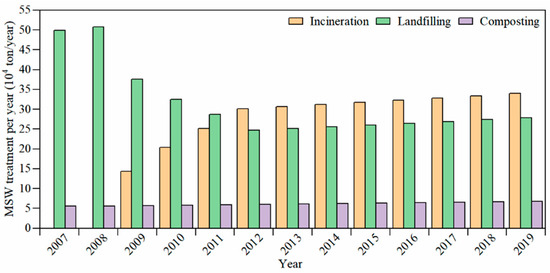
Figure 1.
Historical MSW management strategies in Southern Tai Lake Watershed (STLW).
2.2. Life Cycle Assessment and Life Cycle Cost Evaluation
2.2.1. Goal, Scope, and Description of Waste Management Strategies
The goal of this study is to assess the GHG, energy, and economic feasibilities of different MSW management alternatives in the STLW, while considering the dynamic interactions of MSW generation over the long term. The functional unit (FU) for this study is set as the annually generated MSW in the STLW. The system scope is defined to consider the operational phase of MSW treatment, including sludge transport, material input, and energy consumption in Figure 2. Construction processes are excluded from the system boundary in the environmental evaluation because of their minimal contributions relative to operational processes, whereas both construction and operational processes are included in the economic evaluation [25].
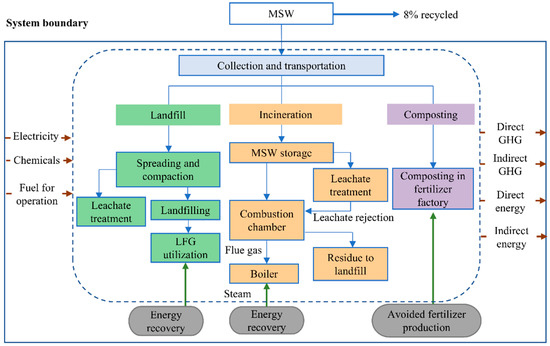
Figure 2.
System boundary for MSW management.
To analyze the sustainability of the current and proposed MSW management schemes with dynamic interactions over the next decade, seven scenarios were developed that consider the MSW treatment approaches of incineration, landfilling, and composting. S1 is the current MSW management strategy (business-as-usual), consisting of 10% by composting, 40% in landfill, and the remaining 50% in incineration. Given the best use of the current MSW treatment facilities, S2–S6 were defined either to fully use the existing composting facility (S2), existing incineration facility (S3, S4), or enhance incineration use to conserve land (S5, S6). S7 intends to co-processes the undecomposed MSW in landfill with fresh MSW in incineration plants in 2020, and only fresh MSW is incinerated between 2021 and 2030. The definition of the proposed scenarios can be found in Table 2.
Table 2.
MSW treatment components for the proposed scenarios.
2.2.2. Greenhouse Gases and Energy Consumption for Waste Management
In terms of the environmental evaluation for this study, the LCA was conducted based on ISO 14044 [26]. The software Simapro 9.0 was used to analyze the environmental results, and the ReCiPe Midpoint (H) method was used for data processing and to assess greenhouse gas (GHG) emissions. Energy consumption was measured using the ecoinvent 3.0 method. The background inventory for the GHG and energy consumption calculation was extracted from the ecoinvent 3.0 database. A detailed description of the MSW treatment techniques is explained as follows.
Landfilling
A sanitary landfill was installed in the STLK for the proper management of leachate treatment, CH4 collection, and energy recovery. The LCA inventory was mainly accessed from a local landfill (Yang Jia Bu, YJB) The landfill and landfill gas inventories of Doka [27] are provided in Supplementary Materials. In the YJB landfill, the CH4 collection rate is 60% for heating and energy recovery, and the remaining 40% is uncollected and released into the air [28]. An electricity conversion efficiency of 42% is considered for the gas turbine [29]. An additional 20.6% of the recovered energy is used for onsite leachate treatment and other uses, and the rest is exported to an electricity network. In scenario 7, the undecomposed waste in landfill is calculated using the first-order decay method [30], the accumulated undecomposed waste in landfill from 2007 to 2019 is calculated to be 18.42 × 10⁴ tons. The detailed estimation of undecomposed waste in landfill and foreground inventory for the landfill are presented in Supplementary Materials.
Incineration
The foreground inventory used for incineration was obtained from the Wangneng incineration plant in the STLW. The leachate generation is 25% of the amount of the disposed MSW, 80% of which is treated by a membrane bioreactor process; the remaining 20% is injected into the incinerator to adjust the incinerator temperature and assist with toxic gas emission control. Ca(OH)2, ammonia, and activated carbon are used to absorb toxic gases such as HCl and H2S, and the emission discharge requirement follows EU standards [31]. Electricity and heat are recovered during MSW combustion and heating, and part of the electricity is used onsite for MSW drying, leachate treatment, and tail gas treatment. The remainder is exported to the electricity networks for other uses. The slag and ash residues are generated as 2% of the treated MSW and disposed in the landfill. More details are given in Table S4 of Supplementary Materials.
Composting
A composting plant is used to decompose organic matter for agricultural use as a replacement for mineral fertilizer. The inventory related to the operation process was accessed from the local composting plant in the STLW, and other necessary supplementary data were obtained from Cao [32], who studied a composting plant in the North Tai Lake Watershed area. The produced fertilizer from composting is used for gardening in China, ammonium nitrate is the most used mineral fertilizer. Other mineral fertilizers containing phosphorus and potassium were not considered in this study due to their lesser contribution than nitrogen as fertilizer for gardening. The production efficiency of the composter is 48%; i.e., 0.48 tons of fertilizer are produced from 1 ton of organic matter [33]. The reduced GHG and energy consumption from ammonium nitrate production, transport, and application are accessed from the ecoinvent 3.0 database. The foreground composting inventory is listed in Table S5 in Supplementary Materials.
Transportation
In the STLW, the landfill, incineration plant, and composting sites are located in the city suburbs. A transport distance of 40 km (round trip) from the MSW collection point to the sludge disposal destinations was assumed. The emission factors for a heavy-duty diesel lorry with a 21-ton load from ecoinvent 3.0 were used in the calculation.
2.2.3. LCC Evaluation for Waste Management
The LCC evaluation for the proposed scenarios includes the construction costs, operation costs, income from selling the recovered electricity to the electricity network, government subsidies, and the avoided mineral fertilizer usage. The construction and operation costs for the landfill are estimated as 80 and 150 CNY/ton MSW, respectively. The landfill income is mainly derived from selling electricity to the grid at a generation of 185 kWh/ton MSW and a price of 0.65 CNY/kWh. The estimated incineration investments are 100 CNY/ton MSW for site construction and 160 CNY/ton MSW for the operation cost. Income is accessed by selling 460 kWh/ton MSW, at a price of 0.65 CNY/kWh, and 90 CNY/ton MSW of government subsidies to support the incineration applications. The LCC for the composting site includes construction costs of 80 CNY/ton MSW and operational costs of 160 CNY/ton MSW. The income from composting is mainly generated from the avoided use of ammonium nitrate at a price of 800 CNY/ton. For the operational costs, transportation fees of 2.75 CNY/ton MSW·km are used to calculate the transportation cost from the city center to the MSW treatment destinations.
2.3. System Dynamics
SD deals with linear and non-linear interactions between complex activities in a particular situation over time [34]. These interactions include a group of interacting or interdependent entities that form an integrated SD model with the ability to understand the relationships between social behavior and the underlying structures and decision rules for long-term impacts.
2.3.1. Interaction Loop Diagram and SD Modeling Development
Stock-Flow Diagram in SD
An evaluation of the long-term environmental and economic impacts of MSW management requires a thorough investigation of the major variables that affect the assessment. This was carried out using Vensim® PLE, which can visualize the relationships between the variables and feedback effects of a system. A stock-flow diagram was formulated to reveal the dynamic processes in which chain effects are traced through related variables throughout the entire system, as shown in Figure 3. This diagram identifies the inherent feedback mechanisms in long-term MSW generation, where arrows represent the connections between variables. Each arrow indicates the influence of one element on another and indicates either a positive or negative effect.
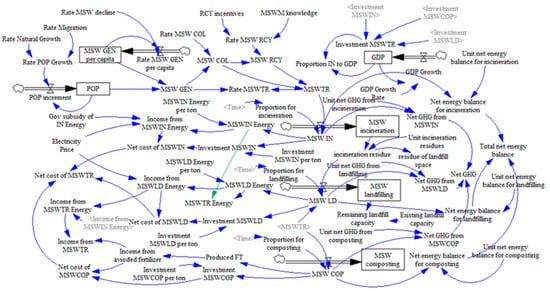
Figure 3.
Stock-flow diagram for the study system. MSW: municipal solid waste; GEN: generation; COL: collection; RCY: recycling; SEP: separation; TR: treatment; IN: incineration; LD: landfilling; COP: composting; IF: influence factor; POP: population; P: proportion; EC: energy consumption.
SD Model Development
The SD model developed here incorporates the complexity of the total MSW generation, MSW composition, and management processes to form a whole system with interrelated variables. The SD model was set to run for 20 years, from time t = 2011 to t = 2030. To predict and identify the interlinked interactions of MSW generation, appropriate regression equations were derived through time-series and cross-sectional data to obtain the final generation results in the assessment year. The changing processes of the city status were thus captured over time to make a prognosis of the dynamic nature. The long-term dynamic analysis for MSW generation was based on the socioeconomic and demographic conditions that affect the amount and composition of MSW in the STLW. When choosing the influencing parameters, constraints were introduced to focus on those with a significant influence [35]. The factors selected for this study include the total population, infant mortality rate, life expectancy at birth, population migration, gross domestic product (GDP), GDP per capita, income per capita, waste type, recycling ratio, MSW treatment approach, and MSW treatment facility capacity. MSW composition is predicted by using gray model for the next decade, the prediction is conducted based on the historical data from 2011 to 2019. The MSW generation in the next decade is calculated by using time-series and regression analysis considering the population and MSW generation per capita. The gray model is used to predict the MSW composition. Furthermore, model validation was also conducted to assess the prediction accuracy. A detailed description of the selected variables and their mathematical relationships in the model and validation are presented in Supplementary Materials.
3. Results and Discussion
3.1. Predicted MSW Generation (2020–2030)
As shown in Figure 4, the total amount of MSW increases from 701,540 tons in 2020 to 831,450 tons in 2030, with an annual increase of 1.7%. There is an exception in S7 in 2020, because the undecomposed waste in existing landfill is co-processed with fresh MSW at an incineration plant in 2020. The increase from 2020 to 2030 is positively interlinked with the increase in the population growth and living standard, and the total MSW generation is proportional to the population and MSW per capita. Improved public environmental awareness decreases total MSW generation and enhances MSW recycling and reduction. Although public environmental awareness increases with urbanization, the total generated MSW also increases annually, as predicted for the next decade in Table 3. The proportion of FW decreases annually from 62.63% in 2019 to 58.74% in 2030, consistent with other studies that showed that urbanization growth decreases the proportion of FW in the total generated MSW [16]. The contributions from paper, wood, textiles, garments, and glass increase annually. Variations in the MSW composition may influence the sustainability of MSW management. For instance, moisture contained within FW consumes more energy during self-incineration, as the water content must be reduced, and this inevitably reduces the energy recovery efficiency and ultimately decreases the environmental and economic sustainability. Urbanization of the STLW, therefore, decreases the FW proportion of the total MSW, which facilitates the improvement of MSW management using incineration.
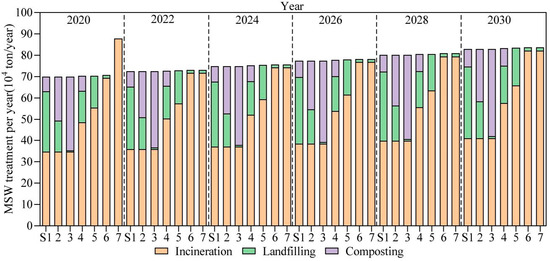
Figure 4.
MSW composition in the proposed scenarios from 2020 to 2030 (in S7, the landfilled waste in existing landfill is co-processed with fresh MSW at incineration plant).
Table 3.
Historical and predicted MSW composition in STLW.
3.2. Remaining Landfill Capacity
The remaining landfill capacity is affected by the amount of MSW disposed in the landfill. The current landfill space for the STLW was reported to be 7.7 × 10⁵ m3 in 2019 [24], and the space used for the disposed MSW accounted for 118.65 kg MSW/m3 [36]. The remaining landfill capacity was calculated considering dynamic influences using the SD model from 2019 to 2030, as shown in Figure 5.
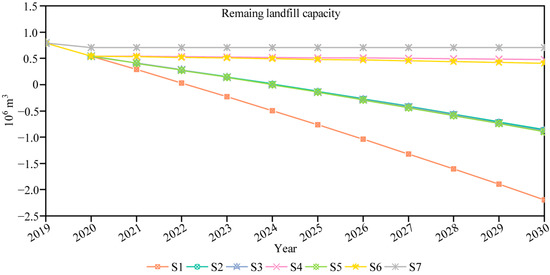
Figure 5.
Simulation of remaining landfill capacity in Southern Tai Lake Watershed.
The remaining landfill capacity decreases slightly in S4, S6, and S7, and significantly in S1–S3 and S5. For the current MSW strategy in the STLW (S1), the existing landfill will be completely depleted by 2022, and a new landfill site should be built to accept more MSW after this time. Planning for a new landfill site should therefore be put on the agenda as soon as possible. Using the current MSW strategy in the STLW for the next decade, a landfill site with a capacity of at least 2.2 × 10⁶ m3 will be required in 2030, and this will compete with the increasing space demands for residential and commercial development. To alleviate this space occupation stress, alternative strategies (S2–S7) are recommended. Of these, S7 uses the least space with 7 × 10⁵ m3 because the landfilled waste in landfill is co-processed with fresh MSW at incineration plant, thus, it saves more space than other scenarios. In S4 and S6, the remaining land space in 2020 was 5 × 10⁵ m3, and there is sufficient space for residual incineration ash over the next decade when using scenarios S4, S6, and S7. In S2, S3, and S5, the current landfill will be completely depleted in 2024, and a new landfill site with a capacity of 8 × 10⁵ m3 will be needed in 2030. However, space occupation is not the only criteria used to evaluate the optimal MSW management strategies. Incineration will also introduce high construction and operational costs, as well as tail gas treatment [6], and composting recovers less energy than incineration and landfilling. The comprehensive evaluation is explained in the following sections.
3.3. Environmental Impacts of GHG and Energy
3.3.1. GHG Emissions
The GHG emissions and composition are illustrated in Figure 6. The current MSW management strategy, S1, generates the highest net GHG emissions at a trend that will continue from 2020 to 2030. There are two main reasons for the higher net GHG emissions from S1. First, the GHG generated using S1 is higher than the emissions generated using the other alternatives because it is mainly derived from CH4 produced by organic matter decomposition, which accounts for more than 90% of the total GHG generation (Figure 6d). The CH4 collection efficiency in landfills is 40%, and the remaining 60% of CH4 is emitted into atmosphere, resulting in high GHG emissions. Second, the avoided GHG is the second lowest among the proposed alternatives because 40% of the MSW is landfilled, which produces less energy than incineration (Figure 6c) [11]. The high net GHG emissions indicate the need to seek alternative management strategies.
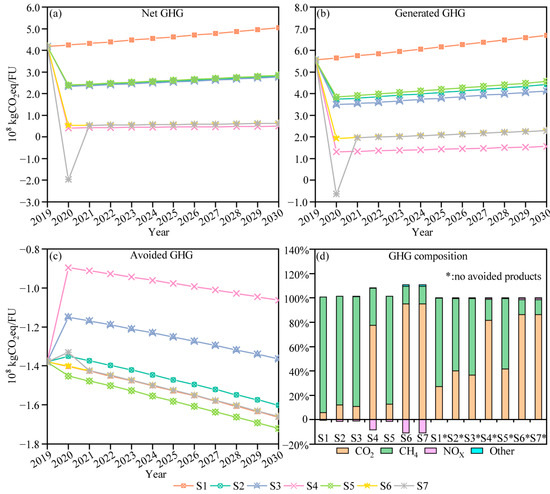
Figure 6.
Simulation results of annual GHG emission production in 2020–2030 for the Southern Tai Lake Watershed, (a) net GHG; (b) generated GHG; (c) avoided GHG; (d) GHG composition (* without avoided products, others are sulfur hexafluoride, ethane, hydrocarbons, chloroform, and propane from the recipe midpoint (H) method).
Among the alternatives, S7 produces the lowest net GHG emissions in 2020, after that S7 performs the same as S4 and S6. The net GHG emissions remain stable from 2021 to 2030, which mainly results from the minimal GHG generation (Figure 6b). Incineration and/or composting are the main MSW disposal approaches in S4, S6, and S7, and these generate less CH4 than landfilling. GHG from composting is emitted for land applications as fertilizer, where most of the carbon is converted to CO2 and released into the air [37]. However, 0.05% of carbon in the composter is emitted as CH4 [38], and the emitted CH4 from composting is higher than that from incineration (Figure 6d). The time frame is also considered for the GHG emission generated on the land based on the total time and carbon content in the fertilizer. More GHG is avoided in S7 and S6 than S4 due to higher energy recovery in the incineration process than in composting [3]. The net GHG emissions for S4, S6, and S7 are stable, at approximately 5 × 10⁷ kg CO2 eq/FU from 2021 to 2030. Even though the generated GHG increases from 2019 to 2030 (Figure 6b), the avoided GHG also increases (Figure 6c), which results in relatively steady net GHG emissions over time.
The net GHG emissions from S2, S3, and S5 are similar; the net GHG emission performances of these strategies are better than that of S1 but worse than those of S4 and S6. The GHG emissions are highly associated with landfilling, rather than incineration or compositing [3]. A higher proportion of MSW disposal in the landfill would therefore produce higher GHG emissions. In S2, S3, and S5, 20% of the MSW is landfilled; this is 40% less than in S1 and 20% higher than in S4 and S6, which do not use landfilling. The results in Figure 6a–c indicate that the current MSW management strategy is not favorable in terms of GHG emissions, whereas S4 and S6 produce the lowest GHG emissions.
3.3.2. Energy Consumption Performance
The simulated energy consumption with dynamic behavior over the next decade is shown in Figure 7. The net energy balance demonstrates that the current MSW management yields the worst performance. Although the net energy balance of S1 performs slightly better over time, its performance remains worse than that of the other scenarios, mainly because of the low energy recovery in S1. The recovered energy from S1 is 3.3 × 10⁹ MJ/FU in 2020 and increases to 3.8 × 10⁹ MJ/FU in 2030, which is less than the other alternatives. Even though the energy consumption is not the highest in S1, its low energy recovery results in the worst performance in terms of the net energy balance. In this context, the alternatives with higher energy recoveries and lower energy consumption are recommended.
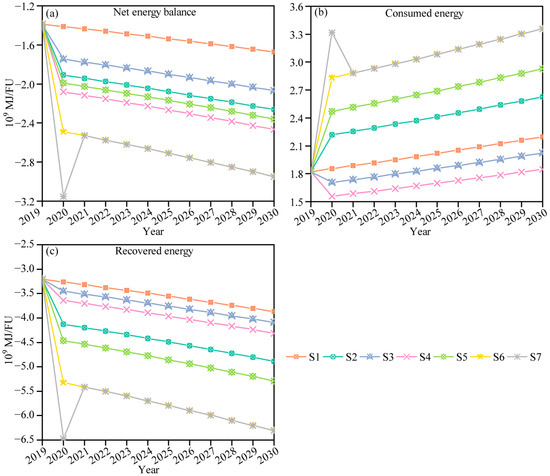
Figure 7.
Energy balance in 2020–2030 for (a) net energy balance; (b) consumed energy; (c) recovered energy.
Among the alternatives, S7 yields the best performance. Regarding energy consumption, S7 uses the most energy with 3.3 × 10⁹ MJ/FU in 2020 because it incinerated both undecomposed landfilled waste and fresh waste in 2020. In 2021, the consumed energy for S7 is sharply decreased and increased again to 3.3 × 10⁹ MJ/FU in 2030 in Figure 7b. The performance of S7 is the same as that of S6 during 2021 to 2030. The higher energy consumption is used for drying processes to reduce moisture content. The optimum moisture content of MSW for self-incineration is 15% [39], and additional energy is needed to reduce the moisture from approximately 57% (Table S5) to the required 15%. Even though the energy consumption is high in S6 and S7, the gained energy totally recovers this consumption, and the surplus can be exported to the public electricity network. Other studies have reported that approximately five times more energy is gained than consumed by incineration [3]. The variable ratio for energy recovery and consumption is due to different system boundaries and MSW compositions. For instance, excluding transportation from the system boundary and a lower FW proportion in the MSW will increase the energy recovery efficiency. The advantage of incineration in terms of energy recovery increases over time, from −2.5 × 10⁹ MJ/FU in 2021 to −2.9 × 10⁹ MJ/FU in 2030.
The net energy balances of S2–S5 are in the medium range, as illustrated in Figure 7a. Besides incineration, MSW is also disposed in landfills or used for composting, which recover less energy than MSW via incineration alone. S4 produces the lowest GHG emissions; however, the net energy balance is not optimal (Figure 6a). Because 50% of the MSW is composted and the rest is incinerated, the energy recovery of S4 is less than that of the fully incinerated approach in S6 and S7. Overall, the environmental impacts of GHG emissions and energy consumption indicate that the current MSW management strategy S1 generates the most GHG and gains the least net energy, making it environmentally unsustainable. The alternative S7 is recommended. Replacing S1 with S7 will reduce the GHG emissions to 6.1 × 10⁸ kg CO2 eq/FU in 2020, and the reduction will progress to 4.5 × 10⁸ kg CO2 eq/FU in 2030. Considering the energy balance, using S7 will provide 3.2 × 10⁹ MJ/FU of surplus energy to the public electricity network in 2020 and 2.9 × 10⁹ MJ/FU of surplus energy in 2030. In 2008, the energy consumed for residential purposes was 1.13 × 10¹⁰ MJ in the STLW [22], and this is expected to increase to 1.19 × 10¹⁰ MJ in 2020 and 1.84 × 10¹⁰ MJ in 2030. The recovered energy from S6 can support 27% and 16% of the energy used for residential needs in 2020 and 2030, respectively, which would significantly relieve the energy stress in competition with industrial demand.
3.4. Economic Impacts
Simulations of the economic impacts of S1–S7 are illustrated in Figure 8. For the net cost (Figure 8a), the current MSW management strategy, S1, receives a median ranking. A sharp increase is observed in 2022 because the remaining landfill capacity will be depleted, and additional investments will be required for the design, construction, and purchase of new facilities for the new landfill site. The net cost for S1 therefore increases from 0.38 × 10⁸ CNY/FU in 2020 to 0.9 × 10⁸ CNY/FU in 2022. The investment required to build a new landfill in S1 significantly increases to 2.36 × 10⁸ CNY/FU in 2022. S1 can obtain benefits from selling surplus energy to the electricity network (Figure 8c), avoiding fertilizer (Figure 8d), and using government surpluses to support the incineration applications (Figure 8e). However, this income does not overcome the investment required to build a new landfill site.
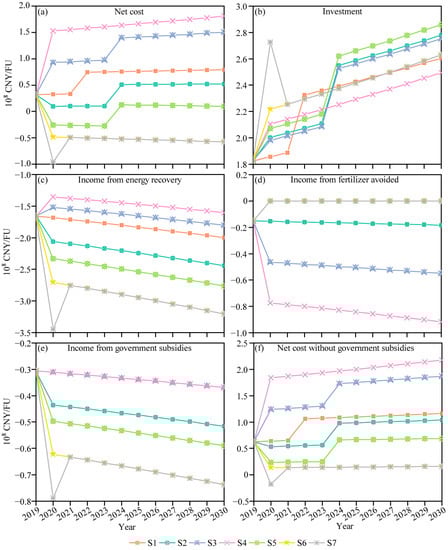
Figure 8.
Economic results for (a) net cost, (b) investment, (c) income from energy recovery, (d) income from fertilizer avoidance, (e) income from government subsidies, and (f) net cost without government subsidies during 2020–2030.
S7 performs the best among the alternatives with regard to net cost in 2020, and S7 performs the same as S6 between 2021 to 2030 (Figure 8a). The advantages of S6 and S7 are mostly attributed to the low investment and the achievement of the highest incomes from energy recovery (Figure 8c) and government subsidies (Figure 8e). In the STLW, government subsidies are provided at 90 CNY/ton MSW to facilitate incineration. These government subsidies are external costs that can be changed or canceled according to government policy. S7 economically remains the most attractive scenario, even in the worst-case scenario involving canceled government subsidies (Figure 8f). S7 can obtain benefits of 1.0 × 10⁸ CNY/FU in 2020. Between 2021 to 2030, S6 and S7 can save around 5.0 × 10⁷ CNY/FU per year with government subsidies (Figure 8a) and 1.0 × 10⁷ CNY/FU per year without government subsidies (Figure 8f).
S2 and S5 are also more economically attractive than S1 (Figure 8a) under similar investment conditions. However, S2 and S5 benefit from exporting recovered energy to the electricity network at rates of 2.1–2.4 × 10⁸ CNY/FU and 2.3–2.8 × 10⁸ CNY/FU between 2020 and 2030 for S2 and S5, respectively. S2 also obtains approximately 2.3–2.4 × 10⁷ CNY/FU from fertilizer avoidance between 2020 and 2030, and another 4.4–5.1 × 10⁷ CNY/FU from government subsidies. S5 obtains 5.0–6.0 × 10⁷ CNY/FU from government subsidies over this time period. S3 and S4 are more expensive than S1 because these generate less income from energy recovery (Figure 8c).
These economic findings are in contrast with some previous studies, which determined that landfills with recycling are the most economic MSW management strategy [40] or that integrated MSW management with landfills and anaerobic digestion is the most economic [41]. Others suggested an integrated MSW management system involving landfills, composting, and incineration as the most economic scenario [42]. The economic performances of the proposed MSW management schemes strongly depend on the expenditures of disposal options under their specific situations. In the STLW, the construction and operation expenditures for incineration are low, and government subsidies support the installation of incineration plants. In countries with high costs to install and operate incineration plants, such high investment expenditures would impede the application of this approach [9].
3.5. Cost with Carbon Trading Price
GHG emissions presently affect human safety and the environment and will continue to do so in the future. Carbon pricing is a method that quantifies the external costs of GHG emissions and ties these to their sources through a unit price. The carbon trading price (CTP) helps to shift the burden of GHG emissions back on those who generate them to achieve the most flexible and cost-effective approach for societies. Therefore, the CTP in China was incorporated in the calculations to evaluate the economic impacts. The influence of CTP was assessed at rates of 30 CNY/ton CO2 in 2020, 75 CNY/ton CO2 in 2025, and 115 CNY/ton CO2 in 2030 [43], and linear interpolation was used to estimate the CTP for the remaining years. S6 remains the most economic scenario (Figure 9). When considering CTP, the advantages of S7 are more than the private cost without CTP (Figure 8a) because less GHG is generated from S1 than from other scenarios. As time progresses from 2021 to 2030, S6 and S7 are the two scenarios in which benefits are increased, whereas S1–S5 obtain fewer benefits or generate increased expenses over time. The CTP is expected to increase in the future. A 50–100 US$/ton CTP has been proposed to achieve the temperature goal of the Paris Agreement [44]. S6 will achieve more benefits at this value than the other scenarios because it produces less GHG.
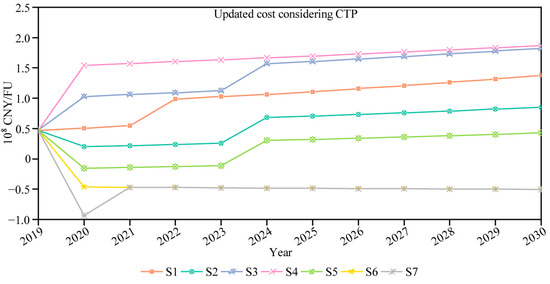
Figure 9.
Economic effects with respect to carbon trading price (CTP).
3.6. Environmental and Economic Impacts by Increasing Recycling Ratios
The environmental and economic impacts were varied by increasing the recycling ratios predicted for 2030, as shown in Figure 10. The recycling process only takes into account items that can be recycled (e.g., paper, plastic, metal, textiles, glass) and excludes putrescible materials. The results show that the GHG emissions decrease and expenditures are saved with increasing recycling ratios. However, this approach also reduces the energy recovery. The current recycling ratio in the STLW is only 8%, which is substantially lower than that for developed countries, including 20% in Japan, 26% in the USA, 27% in the UK, and 28% in Australia [45]. Approximately 16% of the GHG emissions or expenditures can be reduced or saved, respectively, if the recycling ratio is increased to 20% as in Japan. Even though less energy will be recovered, the energy is considered in transition and is ultimately expressed by the improved performance in GHG or the net cost when raising the recycling ratio. If the recycling ratio is increased to 28%, as in Australia, another 21% of GHG and expenditures will be reduced or saved, respectively.
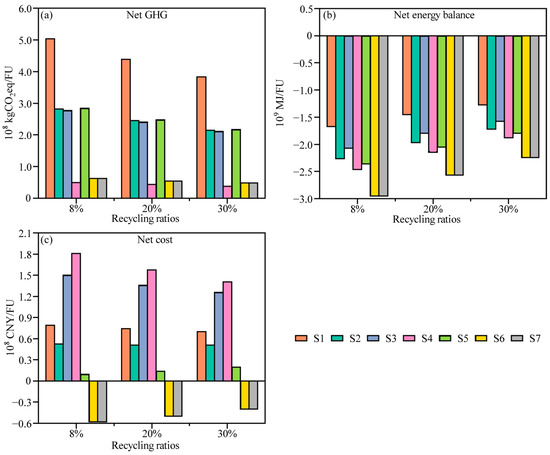
Figure 10.
Sensitivity analysis for variable recycling ratios of 8%, 20%, and 30% for (a) net GHG, (b) net energy balance, and (c) net cost in 2030.
Nevertheless, it is challenging for the STLW to increase the recycling ratio to as high a rate as that in Australia, and more efforts should be made to increase environmental awareness among the public. Education and economic penalties are approaches that encourage the public to participate in waste separation and recycling [21], and these will obtain both environmental and economic gains in regions with limited resources and economic problems, especially in developing countries. However, long-term efforts are required to achieve these goals.
3.7. Perturbation Analysis
Perturbation analysis is conducted to examine the sensitivity of the selected parameters related to the SD model. Sensitivity ratio (SR) represents the ratio of relative changes in the results to relative changes in the parameters [3]. Figure 11a indicates the most sensitive parameters for GHG are population and amount of MSW incineration/year with the same SR of 1.0. The amount of MSW generation/capita and impact factor of energy consumption (IF EC) in incineration also indicate an SR of 1.0 for net energy balance in Figure 11b. Meanwhile, Figure 11c indicates that electricity price and energy recovery in incineration are the most sensitive with the same SR of 2.5 for net cost, followed by population and amount of MSW incineration with the same SR of 1.0. These sensitive parameters illustrate that they will significantly influence the final results and should be carefully taken into account in the MSW management works.
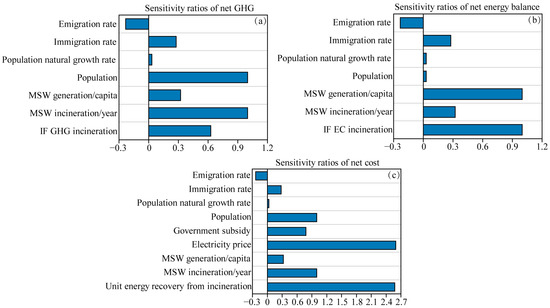
Figure 11.
Perturbation analysis by increasing 10% of the selected parameters’ inputs, (a) sensitivity ratios (SRs) for GHG, (b) SRs for net energy consumption and (c) SRs for net cost. IF GHG incineration: Impact factor of GHG from incineration; IF EC incineration: Impact factor of energy consumption for incineration.
3.8. Perspectives
This study comprehensively evaluates the GHG, energy, and economic performances of alternative MSW management strategies by considering the interactions between social variables from 2020 to 2030 in the STLW. The results show that the current MSW management strategy (S1) is less favorable than the alternatives. Additionally, the current landfill capacity will be depleted in 2022 and a new landfill site with a capacity of 2.2 × 10⁶ m3 will be required if the landfill is still relied upon in 2030, and this will inevitably be in high land competition with the commercial and residential sectors. More importantly, landfilling deteriorates the environment by generating more GHG, consuming more energy, and requiring more expenditures than the other alternatives.
In contrast, co-processing the landfilled waste with fresh MSW at incineration plants (S7) has the potential to resolve these problems. After incineration, the residual ash accounts for only 2% of the MSW, which significantly extends the landfill lifespan. Incineration also generates the lowest GHG emissions, with a reduction of up to 90% compared with landfilling. In terms of the energy balance, S7 can generate surplus energy of 3.2 × 10⁹ MJ in 2020 and 2.9 × 10⁹ MJ in 2030, or approximately twice the amount of surplus energy as S1 during 2021 to 2030. In terms of expenditure, S7 obtains the most benefits by exporting surplus energy to the electricity network and from government subsidies. Considering the CTP proposed for the future, the S7 yields the greatest economic benefits. Incineration also avoids the adverse effects of leachate generation. Even in a well-managed landfill, 5–10% of the leachate remains uncollected [46,47], and the contaminants (e.g., toxic metal, unbiodegradable organics) can pollute the soil and ultimately enter the aquatic environment. The circular economy and re-integration of by-products from MSW is considered as the eco-friendly strategy to enhance MSW management [48,49].
However, there are several limitations to the SD model integrated with GHG, energy, and economic analysis used in this study. The first limitation lies in the charges for MSW generation collected by households in the STLW, which cannot facilitate a reduction in the residential MSW generation. The more effective approach is to charge the MSW generation per capita; however, the model does not effectively reflect this issue. Second, the techniques used in this study follow the current disposal technics in the STLW. The development of new techniques will allow the current facilities to be upgraded, for example, to improve energy conversion efficiency. These advances cannot be predicted in the current SD model and are beyond the scope of this study. Third, only GHG and energy consumption are considered here, and other impacts with adverse effects on the environment and human health, such as particulate matter, ozone depletion, and acidification, should be considered in future studies to obtain a more comprehensive environmental evaluation. Overall, the combination of SD and the LCC/LCA analysis reveals the interactions between social activities to predict the MSW generation and composition over the upcoming decades, and the changes in MSW generation are evaluated using environmental and economic assessments to determine the optimal MSW management strategy. However, such limitations should not be overlooked in future studies.
4. Conclusions
This study used interlinked SD to evaluate the optimal MSW management strategy for GHG production and energy and economic performance from 2020 to 2030 in the STLW. The results indicate that, using the current MSW management strategy (S1), the landfill capacity will be depleted in 2022, and a new landfill site will be required. S1 also generates the most GHG, consumes the most energy, and requires the highest expenditure, and all these variables will increase from 2020 to 2030. S7, which co-processes the undecomposed waste in existing landfill with fresh MSW at incineration plant, performs best among the proposed scenarios. Compared to S1, the implementation of S7 saves 2.5 × 10⁵ and 3.0 × 10⁶ m3 greater space, reduces 6.1 × 10⁸ and 4.5 × 10⁸ kg CO2 eq/FU more GHG, recovers 1.8 × 10⁹ and 1.0 × 10⁹ MJ/FU more energy, and benefits 1.4 × 10⁸ and 1.1 × 10⁸ CNY/FU in cost in 2020 and 2030, respectively. Considering future carbon trading price, S7 benefits even more in terms of GHG, energy, and cost. Moreover, the advantages of S7 increase steadily from 2021 to 2030. S6 is the second-best scenario, which performs as well as S7 between 2021 to 2030. Perturbation analysis identified that the most sensitive factors are population size, MSW generation per capita, GHG/energy recovery in incineration, and electricity price. These parameters should get careful attention when performing GHG, energy, and cost evaluation. This study provides new insights regarding the involvement of social activity via SD and evaluates the sustainability of MSW management practices in the future.
Supplementary Materials
The following are available online at https://www.mdpi.com/2071-1050/13/4/1641/s1, Table S1: LCI for the landfill (Unit: based on 1 ton of MSW), Table S2: LCI for incineration (Unit: based on 1 ton of MSW), Table S3: LCI for composting (Unit: based on 1 ton of MSW); Table S4: Descriptions of major variables used in the SD model, Table S5: MSW composition (% weight) in STLW, Table S6. Checking the validity of POP and MSW GEN, Table S7. Environmental impacts for different MSW management options (Unit: 1 ton of MSW).
Author Contributions
Conceptualization, X.L. and D.L.; validation, A.I.; review and editing, F.Z.; supervision, G.C.; funding acquisition, D.L. All authors have read and agreed to the published version of the manuscript.
Funding
This research was funded by Soft Science Research Program of Zhejiang, grant number 2021C35007 and General Scientific Research Projects of Zhejiang Education Department, grant number Y201942455.
Institutional Review Board Statement
Not applicable.
Informed Consent Statement
Not applicable.
Data Availability Statement
Not applicable.
Conflicts of Interest
The authors declare that they have no known competing financial interests or personal relationships that could have appeared to influence the work reported in this paper.
References
- UNEP. Developing Integrated solid Waste Management Plan. Traning Manual Waste Characterization and Quantification with Projections for Future; UNEP: Nairobi, Kenya, 2009. [Google Scholar]
- Kaza, S.; Yao, L.C.; Bhada-Tata, P.; VanWoerden, F. What a Waste 2.0.; The World Bank: Washington, DC, USA, 2018. [Google Scholar]
- Iqbal, A.; Zan, F.; Liu, X.; Chen, G.H. Integrated municipal solid waste management scheme of Hong Kong: A comprehensive analysis in terms of global warming potential and energy use. J. Clean. Prod. 2019, 225, 1079–1088. [Google Scholar] [CrossRef]
- Tsangas, M.; Gavriel, I.; Doula, M.; Xeni, F.; Zorpas, A.A. Life cycle analysis in the framework of agricultural strategic development planning in the Balkan region. Sustainability 2020, 12, 1813. [Google Scholar] [CrossRef]
- Zorpas, A.A. Strategy development in the framework of waste management. Sci. Total Environ. 2020, 716, 137088. [Google Scholar] [CrossRef] [PubMed]
- Hong, J.; Hong, J.; Otaki, M.; Jolliet, O. Environmental and economic life cycle assessment for sewage sludge treatment processes in Japan. Waste Manag. 2009, 29, 696–703. [Google Scholar] [CrossRef]
- Das, S.; Lee, S.-H.; Kumar, P.; Kim, K.-H.; Lee, S.S.; Bhattacharya, S.S. Solid waste management: Scope and the challenge of sustainability. J. Clean. Prod. 2019, 228, 658–678. [Google Scholar] [CrossRef]
- UN. UN Climate Change Summit: Municipal Solid Waste Action Statement and Plan; UN: New York, NY, USA, 2014. [Google Scholar]
- Yolin, C. Waste Management and Recycling in Japan Opportunities for European Companies (SMEs Focus); EU-Japan Center for Industrial Cooperation: Tokyo, Japan, 2015. [Google Scholar]
- Iqbal, A.; Liu, X.; Chen, G.-H. Municipal solid waste: Review of best practices in application of life cycle assessment and sustainable management techniques. Sci. Total Environ. 2020, 729, 138622. [Google Scholar] [CrossRef]
- Woon, K.S.; Lo, I.M.C. Greenhouse gas accounting of the proposed landfill extension and advanced incineration facility for municipal solid waste management in Hong Kong. Sci. Total Environ. 2013, 458, 499–507. [Google Scholar] [CrossRef]
- Woon, K.S.; Lo, I.M.C. Analyzing environmental hotspots of proposed landfill extension and advanced incineration facility in Hong Kong using life cycle assessment. J. Clean. Prod. 2014, 75, 64–74. [Google Scholar] [CrossRef]
- Zan, F.; Iqbal, A.; Guo, G.; Liu, X.; Dai, J.; Ekama, G.A.; Chen, G. Integrated food waste management with wastewater treatment in Hong Kong: Transformation, energy balance and economic analysis. Water Res. 2020, 184, 116155. [Google Scholar] [CrossRef]
- Guven, H.; Eriksson, O.; Wang, Z.; Ozturk, I. Life cycle assessment of upgrading options of a preliminary wastewater treatment plant including food waste addition. Water Res. 2018, 145, 518–530. [Google Scholar] [CrossRef]
- Kaur, G.; Luo, L.; Chen, G.; Wong, J.W.C. Integrated food waste and sewage treatment—A better approach than conventional food waste-sludge co-digestion for higher energy recovery via anaerobic digestion. Bioresour. Technol. 2019, 289, 121698. [Google Scholar] [CrossRef] [PubMed]
- Liikanen, M.; Havukainen, J.; Hupponen, M.; Horttanainen, M. Influence of different factors in the life cycle assessment of mixed municipal solid waste management systems—A comparison of case studies in Finland and China. J. Clean. Prod. 2017, 154, 389–400. [Google Scholar] [CrossRef]
- Forrester, J.W. Industrial Dynamics—After the First Decade. Manage. Sci. 1968, 14, 398–415. [Google Scholar] [CrossRef]
- Wolstenholme, E.F. System Enquiry: A System Dynamics Approach; John Wiley & Sons, Inc.: Hoboken, NJ, USA, 1990; ISBN 047192783X. [Google Scholar]
- Marzouk, M.; Azab, S. Environmental and economic impact assessment of construction and demolition waste disposal using system dynamics. Resour. Conserv. Recycl. 2014, 82, 41–49. [Google Scholar] [CrossRef]
- Jia, S.; Yan, G.; Shen, A.; Zheng, J. Dynamic simulation analysis of a construction and demolition waste management model under penalty and subsidy mechanisms. J. Clean. Prod. 2017, 147, 531–545. [Google Scholar] [CrossRef]
- Sukholthaman, P.; Sharp, A. A system dynamics model to evaluate effects of source separation of municipal solid waste management: A case of Bangkok, Thailand. Waste Manag. 2016, 52, 50–61. [Google Scholar] [CrossRef]
- HZSPH. Huzhou Statistical Yearbook; Huzhou Statistical Publation House: Huzhou, China, 2019. [Google Scholar]
- Tian, H.; Gao, J.; Hao, J.; Lu, L.; Zhu, C.; Qiu, P. Atmospheric pollution problems and control proposals associated with solid waste management in China: A review. J. Hazard. Mater. 2013, 252, 142–154. [Google Scholar] [CrossRef]
- HZCD MSW Report in Huzhou. Constr. Dep. 2019. Available online: http://jsj.huzhou.gov.cn/ (accessed on 5 May 2020).
- Liu, X.; Dai, J.; Ng, T.L.; Chen, G. Evaluation of potential environmental benefits from seawater toilet flushing. Water Res. 2019, 162, 505–515. [Google Scholar] [CrossRef]
- ISO 14040: Environmental Management–Life Cycle Assessment—Principles and Framework; International Organization for Standardization: Geneva, Switzerland, 2006.
- Doka, G. Life Cycle Inventories of Waste Treatment Services—Part II Landfills—Underground deposits—Landfarming” Ecoinvent Report No. 13; Swiss Centre for Life Cycle Inventories: Dübendorf, Schweiz, 2009. [Google Scholar]
- Han, H.; Long, J.; Li, S.; Qian, G. Comparison of green-house gas emission reductions and landfill gas utilization between a landfill system and an incineration system. Waste Manag. Res. 2010, 28, 315–321. [Google Scholar]
- Loboda, I. Gas Turbine Diagnostics. In Efficiency, Performance and Robustness of Gas Turbines; National Polytechnic Institute: Mexico City, Mexico, 2012. [Google Scholar]
- IPCC (Intergovernmental Panel on Climate Change). Guidelines for National Greenhouse Gas Inventories: Agriculture, Forestry and Other Land Use; IPCC: Geneva, Switzerland, 2006. [Google Scholar]
- EU Directive 2000/76/EC of the European Parliament and of the Council of 4 December 2000 on the Incineration of Waste; Official Journal of the European Communities, European Union: Brussels, Belgium, 2000.
- Cao, Y. Benefit evaluation of classified collection of municipal solid waste in Suzhou. Ph.D. Thesis, Suzhou Universty Science Technology, Suzhou, China, 2015. (In Chinese). [Google Scholar]
- Tao, Y.Y.; Wang, H.H.; Shi, L.L.; Zhou, X.W.; Lu, C.Y.; Shen, M.X. Appropriate quantity of aquatic plants compost for rice-wheat rotation system in Taihu Lake region. J. Plant Nutr. Fertil. 2018, 24, 712–719. [Google Scholar]
- Yuan, H.; Chini, A.R.; Lu, Y.; Shen, L. A dynamic model for assessing the effects of management strategies on the reduction of construction and demolition waste. Waste Manag. 2012, 32, 521–531. [Google Scholar] [CrossRef] [PubMed]
- Kollikkathara, N.; Feng, H.; Yu, D. A system dynamic modeling approach for evaluating municipal solid waste generation, landfill capacity and related cost management issues. Waste Manag. 2010, 30, 2194–2203. [Google Scholar] [CrossRef] [PubMed]
- Beigl, P.; Wassermann, G.; Schneider, F.; Salhofer, S. Forecasting Municipal Solid Waste Generation in Major European Cities. In Proceedings of the 9th International Congress on Environmental Modelling and Software, Fort Collins, CO, USA, 24–28 June 2004. [Google Scholar]
- Bruun, S.; Yoshida, H.; Nielsen, M.P.; Jensen, L.S.; Christensen, T.H.; Scheutz, C. Estimation of long-term environmental inventory factors associated with land application of sewage sludge. J. Clean. Prod. 2016, 126, 440–450. [Google Scholar] [CrossRef]
- Yoshida, H.; ten Hoeve, M.; Christensen, T.H.; Bruun, S.; Jensen, L.S.; Scheutz, C. Life cycle assessment of sewage sludge management options including long-term impacts after land application. J. Clean. Prod. 2018, 174, 538–547. [Google Scholar] [CrossRef]
- Lin, W.Y.; Heng, K.S.; Sun, X.; Wang, J.-Y. Influence of moisture content and temperature on degree of carbonation and the effect on Cu and Cr leaching from incineration bottom ash. Waste Manag. 2015, 43, 264–272. [Google Scholar] [CrossRef]
- Paes, M.X.; de Medeiros, G.A.; Mancini, S.D.; Bortoleto, A.P.; Puppim de Oliveira, J.A.; Kulay, L.A. Municipal solid waste management: Integrated analysis of environmental and economic indicators based on life cycle assessment. J. Clean. Prod. 2020, 254, 119848. [Google Scholar] [CrossRef]
- Otoma, S.; Ricardo, D. Life-cycle greenhouse gas emissions and economic analysis of alternative treatments of solid waste from city markets in Vietnam. J. Mater. Cycles Waste Manag. 2017, 19, 70–87. [Google Scholar] [CrossRef]
- Movahed, Z.P.; Kabiri, M.; Ranjbar, S.; Joda, F. Multi-objective optimization of life cycle assessment of integrated waste management based on genetic algorithms: A case study of Tehran. J. Clean. Prod. 2020, 247, 119153. [Google Scholar] [CrossRef]
- CCF. Carbon Trading Price Survey in China; CCF: Hong Kong, China, 2019. (In Chinese) [Google Scholar]
- World Bank Carbon Pricing Dashboard; The World Bank: Washington, DC, USA, 2020.
- OECD. Municipal Waste, Generation and Treatment (Database); OECD: Paris, France, 2009. [Google Scholar]
- Damgaard, A.; Manfredi, S.; Merrild, H.; Stensøe, S.; Christensen, T.H. LCA and economic evaluation of landfill leachate and gas technologies. Waste Manag. 2011, 31, 1532–1541. [Google Scholar] [CrossRef]
- Niskanen, A.; Mandredi, S.; Christensen, T.H.; Anderson, R. Environmental assessment of Ammassuo landfill (Finland) by means of LCA-modelling (EASEWASTE). Waste Mangement Resour. 2009, 27, 542. [Google Scholar] [CrossRef]
- Zorpas, A. Environmental management systems as sustainable tools in the way of life for the SMEs and VSMEs. Bioresour. Technol. 2010, 101, 1544–1557. [Google Scholar] [CrossRef] [PubMed]
- Banti, D.C.; Tsangas, M.; Samaras, P.; Zorpas, A. LCA of a membrane bioreactor compared to activated sludge system for municipal wastewater treatment. Membranes (Basel) 2020, 10, 421. [Google Scholar] [CrossRef] [PubMed]


Publisher’s Note: MDPI stays neutral with regard to jurisdictional claims in published maps and institutional affiliations. |
© 2021 by the authors. Licensee MDPI, Basel, Switzerland. This article is an open access article distributed under the terms and conditions of the Creative Commons Attribution (CC BY) license (http://creativecommons.org/licenses/by/4.0/).