Article

Energy Efficiency Measurement: A VO TFEE Approach and Its Application

1
Economics and Management School, Beijing University of Technology, Beijing 100124, China
2
Irish Institute for Chinese Studies, University College Dublin, Belfield, Dublin 4, Ireland
*
Authors to whom correspondence should be addressed.
Sustainability 2021, 13(4), 1605; https://doi.org/10.3390/su13041605
Submission received: 25 November 2020 / Revised: 19 January 2021 / Accepted: 29 January 2021 / Published: 3 February 2021
(This article belongs to the Section Energy Sustainability)

Abstract

:
Energy efficiency is crucial to the 2030 UN Sustainable Development Goals (SDGs), but its widely measured indicator, energy intensity, is still insufficient. For this reason, in 2006, total factor energy efficiency (TFEE) was proposed with capital, labor, and energy as inputs and GDP as the desirable output. The later TFEE approach further incorporated pollution as the undesirable output. However, it is problematic to regard GDP (the total value of final products) as the desirable output, because GDP does not include the intermediate consumption, which accounts for a large part of the production activities and may even be larger than the value of GDP. GDP is more suitable for measuring distribution, while VO (value of output) is more appropriate for sustainable production analysis. Therefore, we propose a VO TFEE approach that takes VO as the desirable output instead and correspondingly incorporates the other intermediate materials and services except energy into inputs. Finally, the empirical analysis of the textile industry of EU member states during 2011–2017 indicates that the VO TFEE approach is more stable and convergent in measuring energy efficiency, and is more suitable for helping policymakers achieve the SDGs of energy saving, emissions reduction, and sustainable economic development.

1. Introduction

In order to promote sustainable economic development and environmental protection, energy efficiency has been widely acknowledged as a top priority for international organizations, governments, firms, and even households across the world. The International Energy Agency (IEA) [1] proposes that energy efficiency should be taken as the first fuel rather than a hidden fuel, and regards it as “a key tool for boosting economic and social development” [2]. Moreover, all UN member states adopt the 2030 Agenda for Sustainable Development with 17 Sustainable Development Goals (SDGs), in which SDG 7 sets a target of doubling “the global rate of improvement in energy efficiency by 2030” and SDG 12 requires decoupling environmental degradation from economic growth to achieve sustainable consumption and production [3]. Improving energy efficiency is one of the priorities for achieving these goals. It is important to understand energy consumption in the process of production and identify issues for sustainable economic development. The U.S. Energy Information Administration (EIA) [4] also stresses the importance of energy efficiency and the need to define and measure it better. Therefore, it is essential to develop an appropriate indicator and measurement for energy efficiency.
There are two main measurements for measuring energy efficiency. One is single factor energy efficiency (SFEE), which is usually represented by energy intensity with a single input and a single output, and the other is total factor energy efficiency (TFEE), which usually uses Data Envelopment Analysis (DEA) as one of its typical methods with multiple inputs and multiple outputs. Most researchers primarily focus on the methodological development of DEA models, spend less time on the actual process, and pay little attention to ensuring that the input and output indicators they select properly reflect the process under study [5]. After reviewing and discussing the deficiencies of production sets in these two energy efficiency measurements, we propose a new VO TFEE approach from the perspective of advanced production economics and System of National Accounts (SNA). To demonstrate how the VO TFEE approach proposed in this paper performs in measuring energy efficiency, we compare the results of this approach with those of the three existing main energy efficiency approaches, utilizing data collected from the textile industry in EU member states.
This paper is organized as follows. Section 2 is a literature review on the origin and development of energy efficiency with discussion of the deficiencies of existing measurements. Section 3 presents the VO TFEE approach and describes the methodology this paper uses in calculating TFEE. Section 4 reports the empirical results of different energy efficiency measurements. Section 5 concludes this paper. In view of the large number of abbreviations in this paper, a list of nomenclature is presented in Appendix A as Table A1.

2. Literature Review

From an economic perspective, efficiency is defined as making full use of limited and scarce resources to meet people’s needs [6,7]. According to production economics [8,9], a firm’s technologically feasible production set Y R n is made up of all production vectors that constitute feasible plans ( y 1 , , y n ) for the firm, observing the convention of y j < 0 if commodity j is an input and y j > 0 if it serves as an output. In the production process, when there is no more Pareto improvement in energy consumption, the energy economic system is operating on its production possibility frontier or its optimal state. In other words, to measure energy efficiency is actually to evaluate whether there is energy wastage in the production process by comparing the minimum or optimal energy input with its actual energy input while output is unchanged [10]. Given the amount of output, the calculation of energy efficiency can be written as
e n e r g y   e f f i c i e n c y = m i n i m u m   e n e r g y   i n p u t / a c t u a l   e n e r g y   i n p u t
This is also consistent with the expression of “using less energy to provide the same service” by Lawrence Berkeley National Laboratory of US [11].

2.1. Energy Intensity

As for the calculation and application of energy efficiency, Patterson [12] is the first to elaborate on energy efficiency and identifies the GDP-energy ratio as the indicator of energy efficiency from an economic perspective, which is the inverse of energy intensity, i.e., the units of energy consumption per unit of GDP. Energy intensity, regarded as a typical SFEE due to its single factor input, has been widely used in measuring energy efficiency and taken as a strictly binding target among many countries and international organizations. The larger the energy intensity, the lower the energy efficiency. A recent study by IEA [13] shows that although current plans and policies are expected to reduce energy intensity by nearly 50%, the resulting energy intensity value is still below the new target of an annual decrease of 2.7% set by SDG 7. Energy intensity is critical to energy policy formulation and implementation among many countries and international organizations. However, it remains questionable whether energy intensity is a proper indicator to measure energy efficiency.
Firstly, SFEE is not a measure of energy efficiency in an economy. The calculation of energy intensity is inconsistent with the original definition of energy efficiency as Expression (1) because it has no comparison between optimal and actual energy consumption, and it is not related to technological progress. Energy intensity does not conform to the nature of energy efficiency measurement because there is no meaning without comparison in economics. Therefore, it is difficult for energy intensity to measure whether the production process is efficient or not. Energy intensity is not a well-performing measurement or proxy for energy efficiency [14].
Secondly, energy intensity may be misleading in terms of measuring the performance of overall productivity. For example, energy intensities of primary, secondary, and tertiary industries of China were 13.4, 100.6, and 19.5 tons of standard coal per million yuan respectively in 2016, but we cannot say that the energy intensity of the primary industry is better than that of the secondary industry because this is not comparable among different industries. Energy efficiency cannot be properly measured by energy intensity in an absolute sense. Proskuryakova and Kovalev [15] also argue that what energy intensity reflects is energy consumption, not energy efficiency.
Thirdly, energy intensity may misstate both the level and growth rate of productivity for lack of total factor information. It only focuses on the goal of realizing energy savings and economic growth. It does not consider labor, capital, and other factors in production, nor pollution emissions caused by energy consumption. Energy intensity may decrease solely due to its substitution by labor rather than to any underlying advancement in technological energy efficiency [16]. EIA [4] also states that energy intensity might not reflect energy efficiency accurately because there are many other factors that affect energy intensity. Moreover, it is also misleading for managers and policy makers as it ignores the possibility of achieving its goal, such as the organization and structure of the economy [17], as well as negative externalities, such as environmental pollution. It is well known that reducing energy consumption can lead to a low-carbon society, but energy intensity cannot analyze this relationship systematically and directly, thereby undermining the integrity of economic analysis.
What is more, energy intensity does not conform to any actual production process. A firm cannot produce any output with energy only. In other words, it is not feasible to form a production set with only GDP and energy consumption without any other inputs. SFEE cannot measure potential energy efficiency [18].
Finally, energy intensity does not reveal the cost and revenue of production processes. For example, energy intensity would be substantially reduced if more manual labor was employed in freight transport instead of vehicles. However, this is neither economical nor practical in the real world. Actually, energy intensity is often taken as a measure of an economy’s dependence on energy, which indicates the decoupling of energy consumption from economic growth [19].

2.2. The Existing TFEE

In order to overcome the deficiencies of SFEE, Hu and Wang [20] put forward TFEE by taking into account the contribution of capital, labor, and energy consumption to GDP. They calculate TFEE as the ratio of target energy input to its actual energy input with DEA. The difference between the actual energy input and the target energy input is the total adjustment (inefficiency) of energy input. In DEA, the total energy adjustment refers to radial adjustment at first, conforming to Farrell efficiency [21], and later incorporates slack reduction, making TFEE further satisfy Pareto efficiency [22]. Hu and Wang [20] calculate the total energy adjustment including both radial adjustments and slack reduction, which is defined later as the energy saving target [23]. Total energy reduction can be achieved by improving the level of technology, thereby resulting in production optimization. The more the total adjustment is, the less the optimal energy input will be, and the smaller the value of TFEE is as a result. TFEE can achieve energy savings and output growth with technical efficiency progress.
As a compound indicator of energy efficiency measurement, TFEE has enjoyed widespread application, with capital, labor, and energy as the common inputs and GDP as the output. The production set can be expressed as ( Y 1 , K , L , E ) , where Y1, K, L and E stand for the desirable output usually measured by GDP, capital, labor, and energy consumption, respectively.
With pollution becoming one of the most concerns in recent years, energy saving and pollution reduction have become essential parts of energy research. One of the main contributions of existing TFEE studies is that environment pollution, such as CO2 emissions, is incorporated into output as an undesirable component, thereby improving the production set to ( Y 1 , Y 2 , K , L , E )   where Y2 denotes the undesirable output. This production set helps to analyze energy saving and pollution reduction performance and realize sustainable production.
So far, these two production sets with and without pollution are the two main forms of TFEE analysis. Table 1 provides a theoretical comparison of energy intensity and TFEE, and Table A2 (see Appendix A) is a summary of some existing TFEE indicator selections.
As a measurement of energy efficiency, however, TFEE is still not perfect, although better compared to energy intensity as a measurement.
Firstly, the undesirable output is neglected in the production set ( Y 1 , K , L , E ) , which is contradictory to the fact that fossil energy consumption will inevitably lead to environmental pollution. When measuring energy efficiency, pollution should always be taken into consideration in order to achieve sustainable development.
Secondly, total energy consumption, including both production and household consumption, is often used to measure the energy efficiency of regions and nations in TFEE studies. Actually, only energy consumed in production can be taken as an input in the production set and used to measure energy efficiency. Household energy consumption should not be included in measuring TFEE.
Finally, although the production set ( Y 1 , Y 2 , K , L , E ) further perfects the production set ( Y 1 , K , L , E ) , it is still insufficient because in the production set ( Y 1 , Y 2 , K , L , E ) , Y1 (GDP) only measures the total value of final products or the gross value added of all products in the economy over a period of time. GDP excludes the value of intermediate products. As a kind of intermediate input consumed during the production process, the value of energy consumption is not included in GDP, so the inputs are not consistent with the output in this production set. It is important to choose a proper desirable output indicator to match the inputs.
Given the discussion above, both energy intensity and the production sets of existing TFEE have some deficiencies in measuring energy efficiency. Energy intensity is not in line with the definition of energy efficiency and not considering the substitution effect between factors. Furthermore, the selection of input and output variables in existing TFEE studies does not conform to the requirements of reflecting the actual production process [5]. Therefore, from the perspective of economics and SNA, this paper proposes a new VO TFEE approach in Section 3, which perfects the selection of inputs and outputs by taking pollution into account and making the inputs of the production set consistent with its outputs.

3. Materials and Methods

The new VO TFEE approach is developed in this section by using the original definition of TFEE to calculate energy efficiency and a DEA-based model, slacks-based measure (SBM), to find the optimal energy input. A new variable set with all inputs and outputs are proposed and identified based on SNA in this paper. Therefore, the VO TFEE is in line with not only the definition of energy efficiency, but also the actual production process.

3.1. SBM with Undesirable Output

DEA attempts to gauge relative efficiency by observing radial adjustment. The CCR model proposed by Charnes, Cooper, and Rhodes [24] is the first and remains state of the art for efficiency evaluation. However, the radial measure may overestimate efficiency when there are some slacks [25] and can lead to the absence of information about neglected efficiency [26]. Slacks are a common feature in the basic CCR model. In order to have more discriminatory power in measuring efficiency and a suitable treatment of slacks, Tone [27] proposes slacks-based measure (SBM) to overcome the problem associated with the radial approach by finding the respective maximum slacks of different inputs and outputs in the production. In the presence of pollution, Tone [28] further puts forward SBM with undesirable output as follows.
Suppose there are n decision making units (DMUs), each D M U j   ( j = 1 , 2 , , n ) consumes m inputs x j = ( x 1 j , x 2 j , , x m j ) (a transpose vector) and produces s1 desirable outputs y j g = ( y 1 j g , y 2 j g , , y s 1 j g ) and s2 undesirable outputs y j b = ( y 1 j b , y 2 j b , , y s 2 j b ) , then the production technology set can be specified as T = { ( x , y g , y b ) R : x   c a n   p r o d u c e   ( y g , y b ) } , where T is assumed to satisfy the standard axioms of the production theory and properties and R includes all the feasible input and output vectors. The production possibility set is then defined as P = { ( x , y g , y b ) | x X λ , y g Y g   λ , y b Y b   λ , λ 0 } , where λ = ( λ 1 , λ 2 , , λ n ) is an n × 1 nonnegative vector, X = [ x 1 , x 2 , , x n ] is an m × n matrix of input vectors, Y g = [ y 1 g , y 2 g , , y n g ] is an s 1 × n matrix of desirable output vectors, and Y b = [ y 1 b , y 2 b , , y n b ] is an s 2 × n matrix of undesirable output vectors. In accordance with these definitions, the SBM model with all inputs and outputs for measuring efficiency of a certain D M U ( x 0 , y 0 ) under the constant returns to scale (CRS) is the fractional program as follows:
min ρ * = 1 1 m i = 1 m s i x i 0 1 + 1 s 1 + s 2 ( r = 1 s 1 s r g y r 0 g + r = 1 s 2 s r b y r 0 b ) s . t .   x 0 = X λ + s y 0 g = Y g λ s g y 0 b = Y b λ + s b λ 0 ,   s 0 ,   s g 0 ,   s b 0
The vectors s R m and s b R s 2 are the potential reduction of inputs and undesirable output, and s g R s 1 is the potential expansion of desirable output. They are all slacks. The objective value of function (3) satisfies 0 < ρ * 1 . The closer ρ * value is to 1, the closer the DMU is to the production frontier, that is, the higher the relative energy efficiency is. When ρ * = 1 , the DMU is completely efficient. With the definition of TFEE, we can calculate the TFEE as:
T F E E = a c t u a l   e n e r g y   i n p u t s E a c t u a l   e n e r g y   i n p u t  
As a non-radial DEA model that uses slacks to determine efficiency scores, SBM outperforms the traditional CCR model with CRS settings, and is even recommended as the standard DEA model [29].

3.2. The VO TFEE Approach to Measuring Energy Efficiency

Apart from the definition of TFEE and the SBM with undesirable output, it is important to select proper input and output variables to ensure the accuracy and reliability of energy efficiency measuring results. The input and output variables must be consistent with and fully reflect the production process to the greatest extent. Given that most existing TFEE studies use GDP (value added) as the desirable output, which does not include the value of energy input, and neglect the importance of intermediate inputs, the VO TFEE is proposed on the basis of SNA in this study.
SNA, issued by the United Nations and adopted by more than 150 countries, is the core of the macroeconomic system [30]. SNA aims to fully reflect the results of the production activities of all society and the process of its distribution and use. In order to calculate TFEE correctly, we find the value of output (VO) is a more suitable proxy for desirable output based on SNA.
According to SNA, GDP is the added value created by the production process. It is the total measure of partial production activities (only final products) or the partial measure (value added, not value of output) of total production activities. Different from GDP, however, VO is the total output measure of total production activities. It refers to the value of all goods and services produced in a certain period of time and reflects the total scale and total level of production activities, which cannot be replaced by any other indicator. In this way, GDP is more suitable as an indicator of distribution, while VO is more appropriate as the output measure of all production activities. The relationship between VO and GDP is as follows:
V O i n t e r m e d i a t e   c o n s u m p t i o n = G V A  
VO includes the value of intermediate consumption and is a much broader measure of the economy than GVA (gross value added), or roughly GDP. According to SNA 2008 [30], intermediate consumption consists of both the value of goods and services consumed in the production process as inputs, excluding fixed assets. Some intermediate inputs may be transformed and incorporated into the outputs, while other intermediate inputs may be completely used up, such as energy.
The value of intermediate consumption accounts for a large proportion of VO. In 2016, VO and GDP of the United States were $32.4 trillion and $18.7 trillion, respectively, as estimated by the U.S. Bureau of Economic Analysis, which means that GDP accounted for 57.5% of VO and intermediate consumption accounted for 42.5%. As for the EU, Figure 1 shows the composition of the total output of various EU countries based on the Eurostat [31]. In 2017, the proportion of intermediate consumption in most EU member states accounted for almost 50% of output and a few substantially exceeded 50%, such as Luxembourg and Malta. Intermediate consumption plays an important role in the process of production. Take Ireland as an example of EU members; according to CSO, Ireland [32], as shown in Figure 2, in 2017, Irish intermediate consumption accounted for over half of the output in all sectors, except for services. The proportion of intermediate consumption to total output even exceeds two-thirds in the agriculture, forestry and fishery, and construction sectors of the Irish economy.
As a developing country, China’s GDP was almost 32.9% of its VO in 2015. The remaining 67.1% output from production activities is not included in GDP and this proportion is even larger in other developing countries. As for companies, the added value of U.S. Steel was only 18.05% of its VO in 2018, indicating that the neglected output proportion in the added value of energy-intensive companies is even greater. Therefore, for value added, GDP underestimates the scale and level of production activities by more than 50% and is not a proper proxy of total output. There is an urgent need for a better indicator as a replacement for prov GDP in order to effectively measure energy efficiency.
Some scholars have recently adopted VO rather than GDP as the desirable output, but their understanding of the production set is still insufficient. Li and Li [33] consider the matching of inputs and outputs in production by taking capital, labor, energy consumption, and other intermediate materials as the inputs, and VO and industrial wastes as outputs to measure the industrial TFEE in 30 Chinese provinces. However, intermediate services, such as purchasing, sales, marketing, accounting, data processing, transportation, storage, maintenance, security, etc., are also quite important in the production process. When taking VO as the desirable output, its corresponding inputs should include capital, labor, and energy consumption, together with other intermediate materials and services, as VO is the total value produced in industrial production activities during a certain period of time. Here, we denote VO as Y3.
By replacing Y1 with Y3 as the desirable output and incorporating the other intermediate materials M and services S into inputs, this paper proposes a VO TFEE with feasible production set ( Y 3 , Y 2 , K , L , E , M , S ) in accordance with SNA and makes the production set closer to the reality of the production process in an economy. Compared with the two main production sets of TFEE in previous studies, the new VO TFEE production set is a superior and more comprehensive approach in measuring energy efficiency. Here we denote the production sets ( Y 1 , K , L , E ) , ( Y 1 , Y 2 , K , L , E ) and ( Y 3 , Y 2 , K , L , E , M , S ) as Model 1, Model 2, and Model 3, respectively, and summarize them in Table 2.

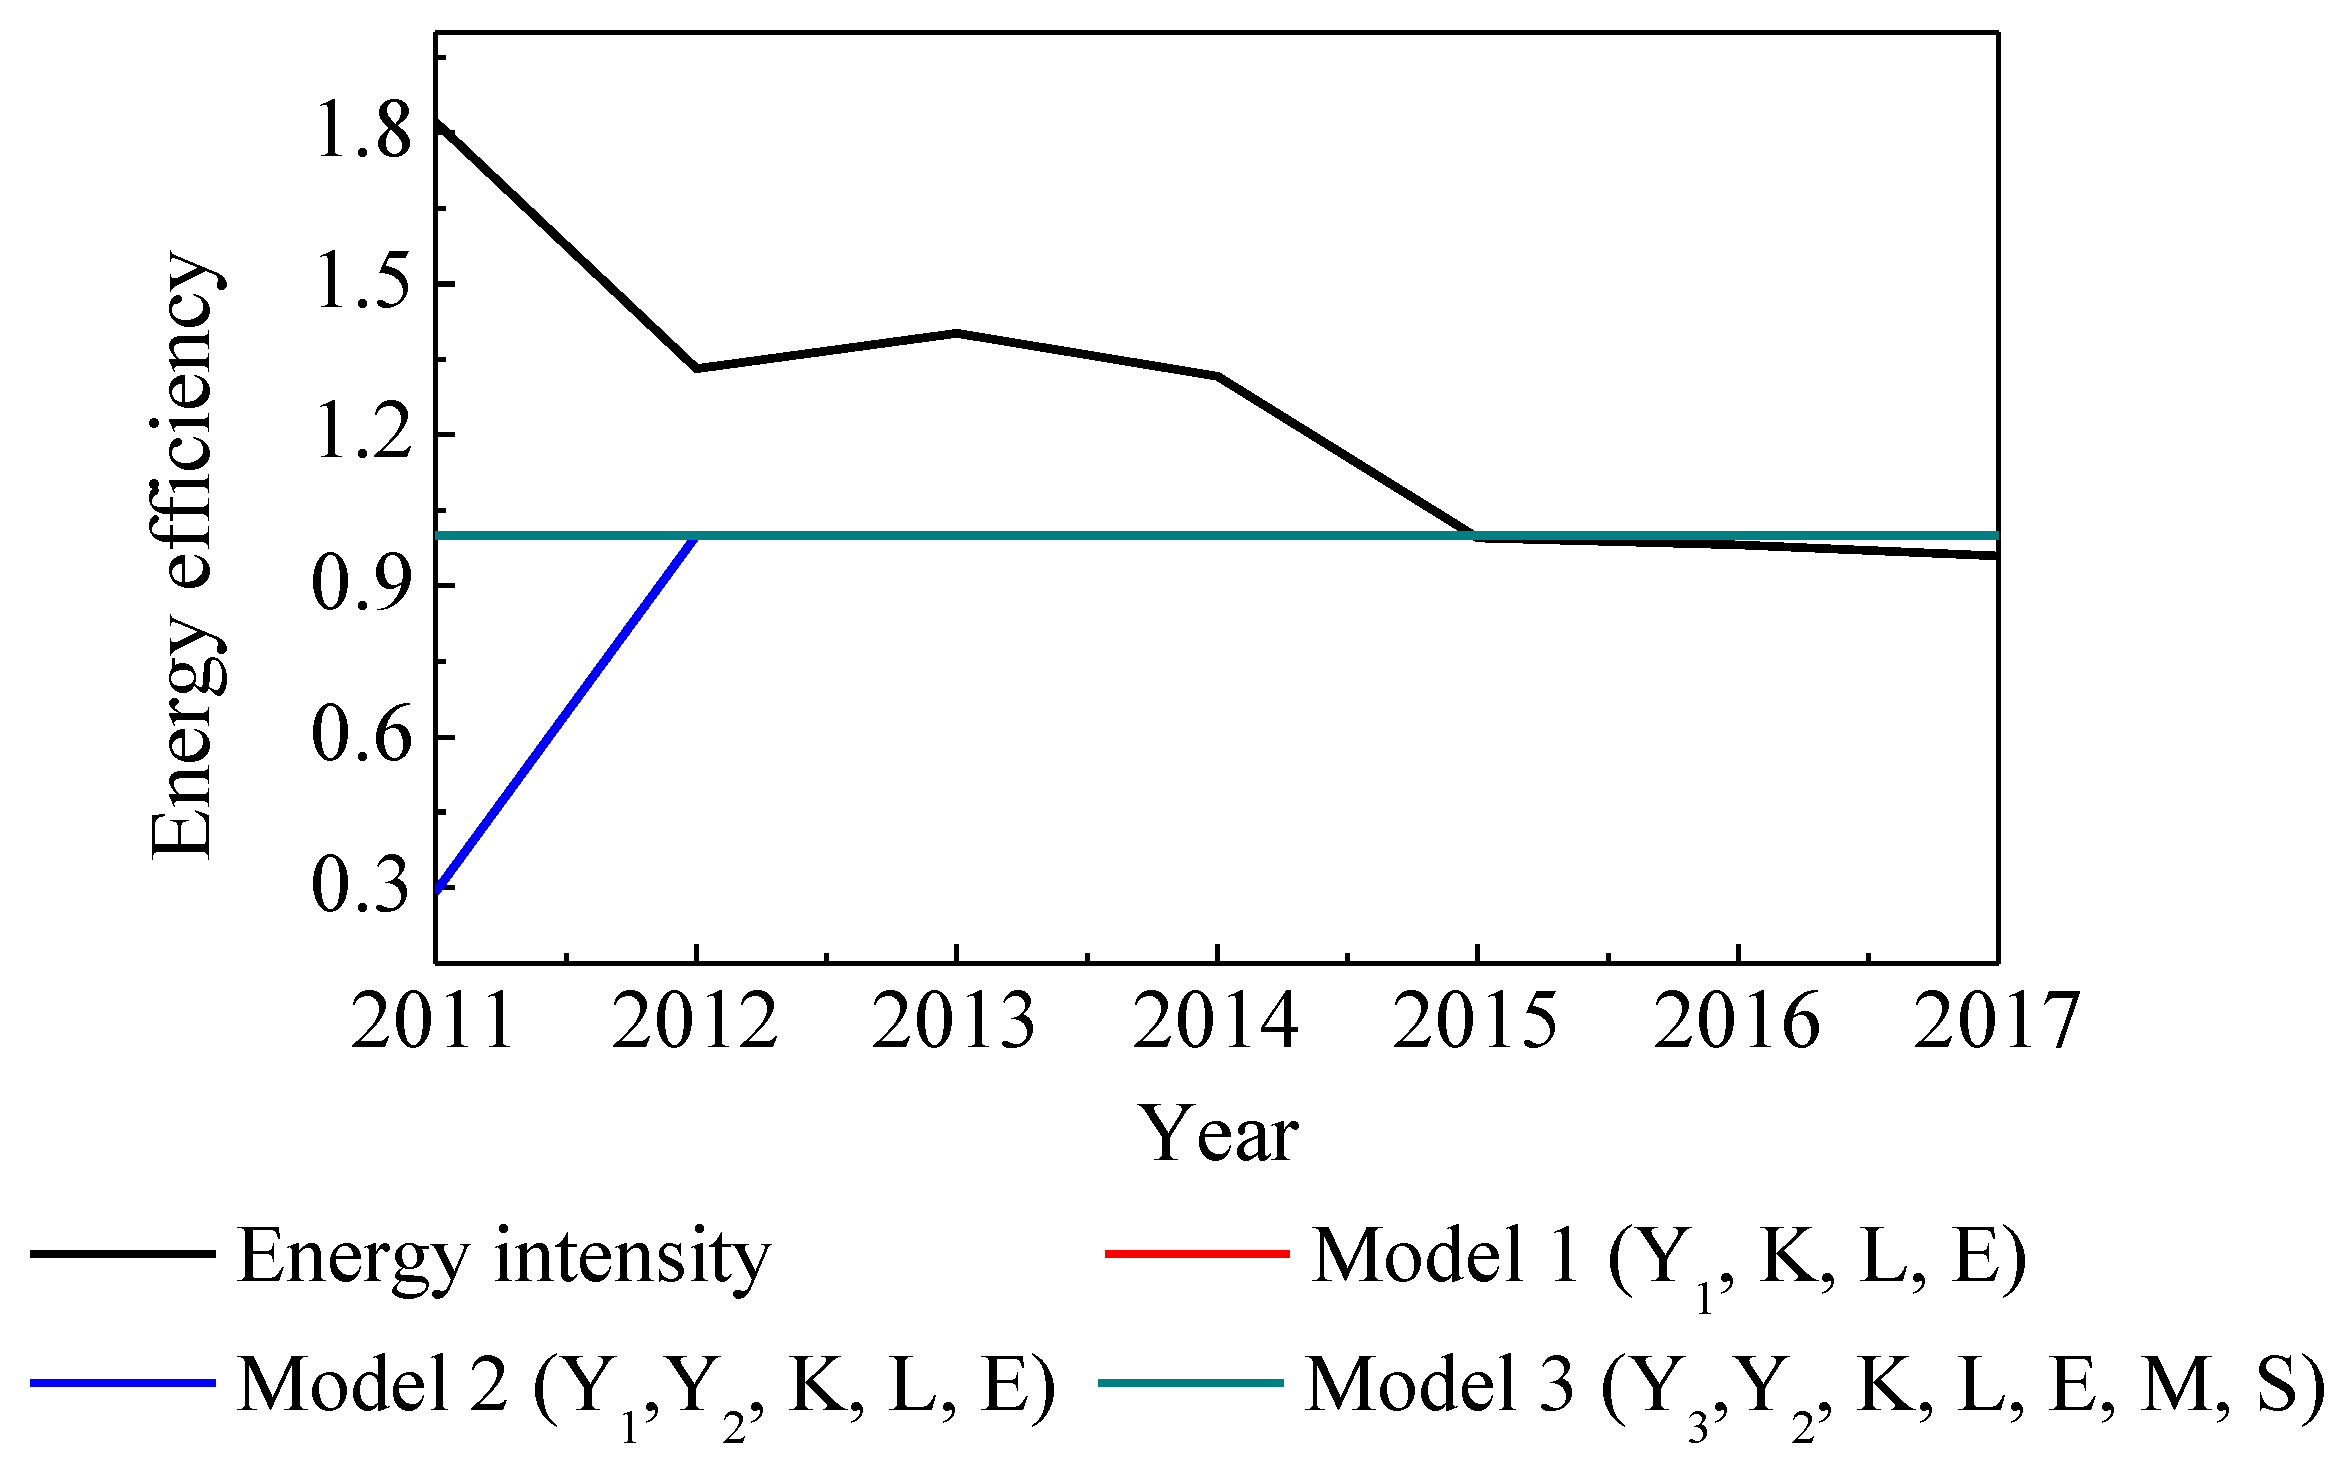
4. Empirical Results and Comparisons

With the VO TFEE indicators and input-oriented SBM with undesirable output, this section conducts an empirical analysis, for the period 2011 to 2017, on energy efficiency measurements for the textile industry in EU member states by examining and comparing empirical results for energy intensity with the three TFEE models.

4.1. Data

The EU textile industry includes the manufacture of textiles, wearing apparel, leather, and related products. For consistency, all input and output data used in this study are extracted from the database corresponding to Eurostat, and the depreciation rate of the textile industry is set as 0.109 according to the EU KLEMS database, which is the depreciation rate of machinery and equipment in the textile industry. The dataset covers 19 EU countries for the period 2011 to 2017 due to the availability of the data source. All monetary variables are converted at constant prices in 2011.
Capital stock in the base year is obtained by dividing the consumption of fixed assets by the depreciation rate, and the subsequent capital stock is calculated with the gross investment in tangible goods using the perpetual inventory method (PIM) proposed by Goldsmith [34]. All the capital stock values are deflated by the price index of fixed capital consumption. Labor is the numbers employed in textile enterprises. Energy consumption refers to final energy consumption in the textile industry. Intermediate materials and services, excluding energy, are calculated by subtracting energy value from intermediate consumption. The three output variables VO, VA, and greenhouse gases are obtained directly from Eurostat. Other intermediate materials and services, excluding energy, VA and VO, are deflated by a GDP deflator.
Table 3 provides three interesting concerns. Firstly, all the input and output data have more or less decreased during the sample period. Secondly, in terms of VA and VO, the value-added rate (VA/VO) of the largest-scale textile industry increases from 0.2750 to 0.3020, which is always less than one-third, while the rate of the smallest-scale textile industry ranges from 0.3686 to 0.4276, which is always larger than one-third. The economic benefits of some large-scale textile industries in the EU are not as good as those of some small-scale textile industries. Finally, in terms of the mean value, the value-added rate of the textile industry is around 0.35, much lower than the 0.5 of total industries shown in Figure 1. Compared with other industries, the EU textile industry is a lower-end industry in the value chain, faces greater competitive pressure and needs to be greatly improved.

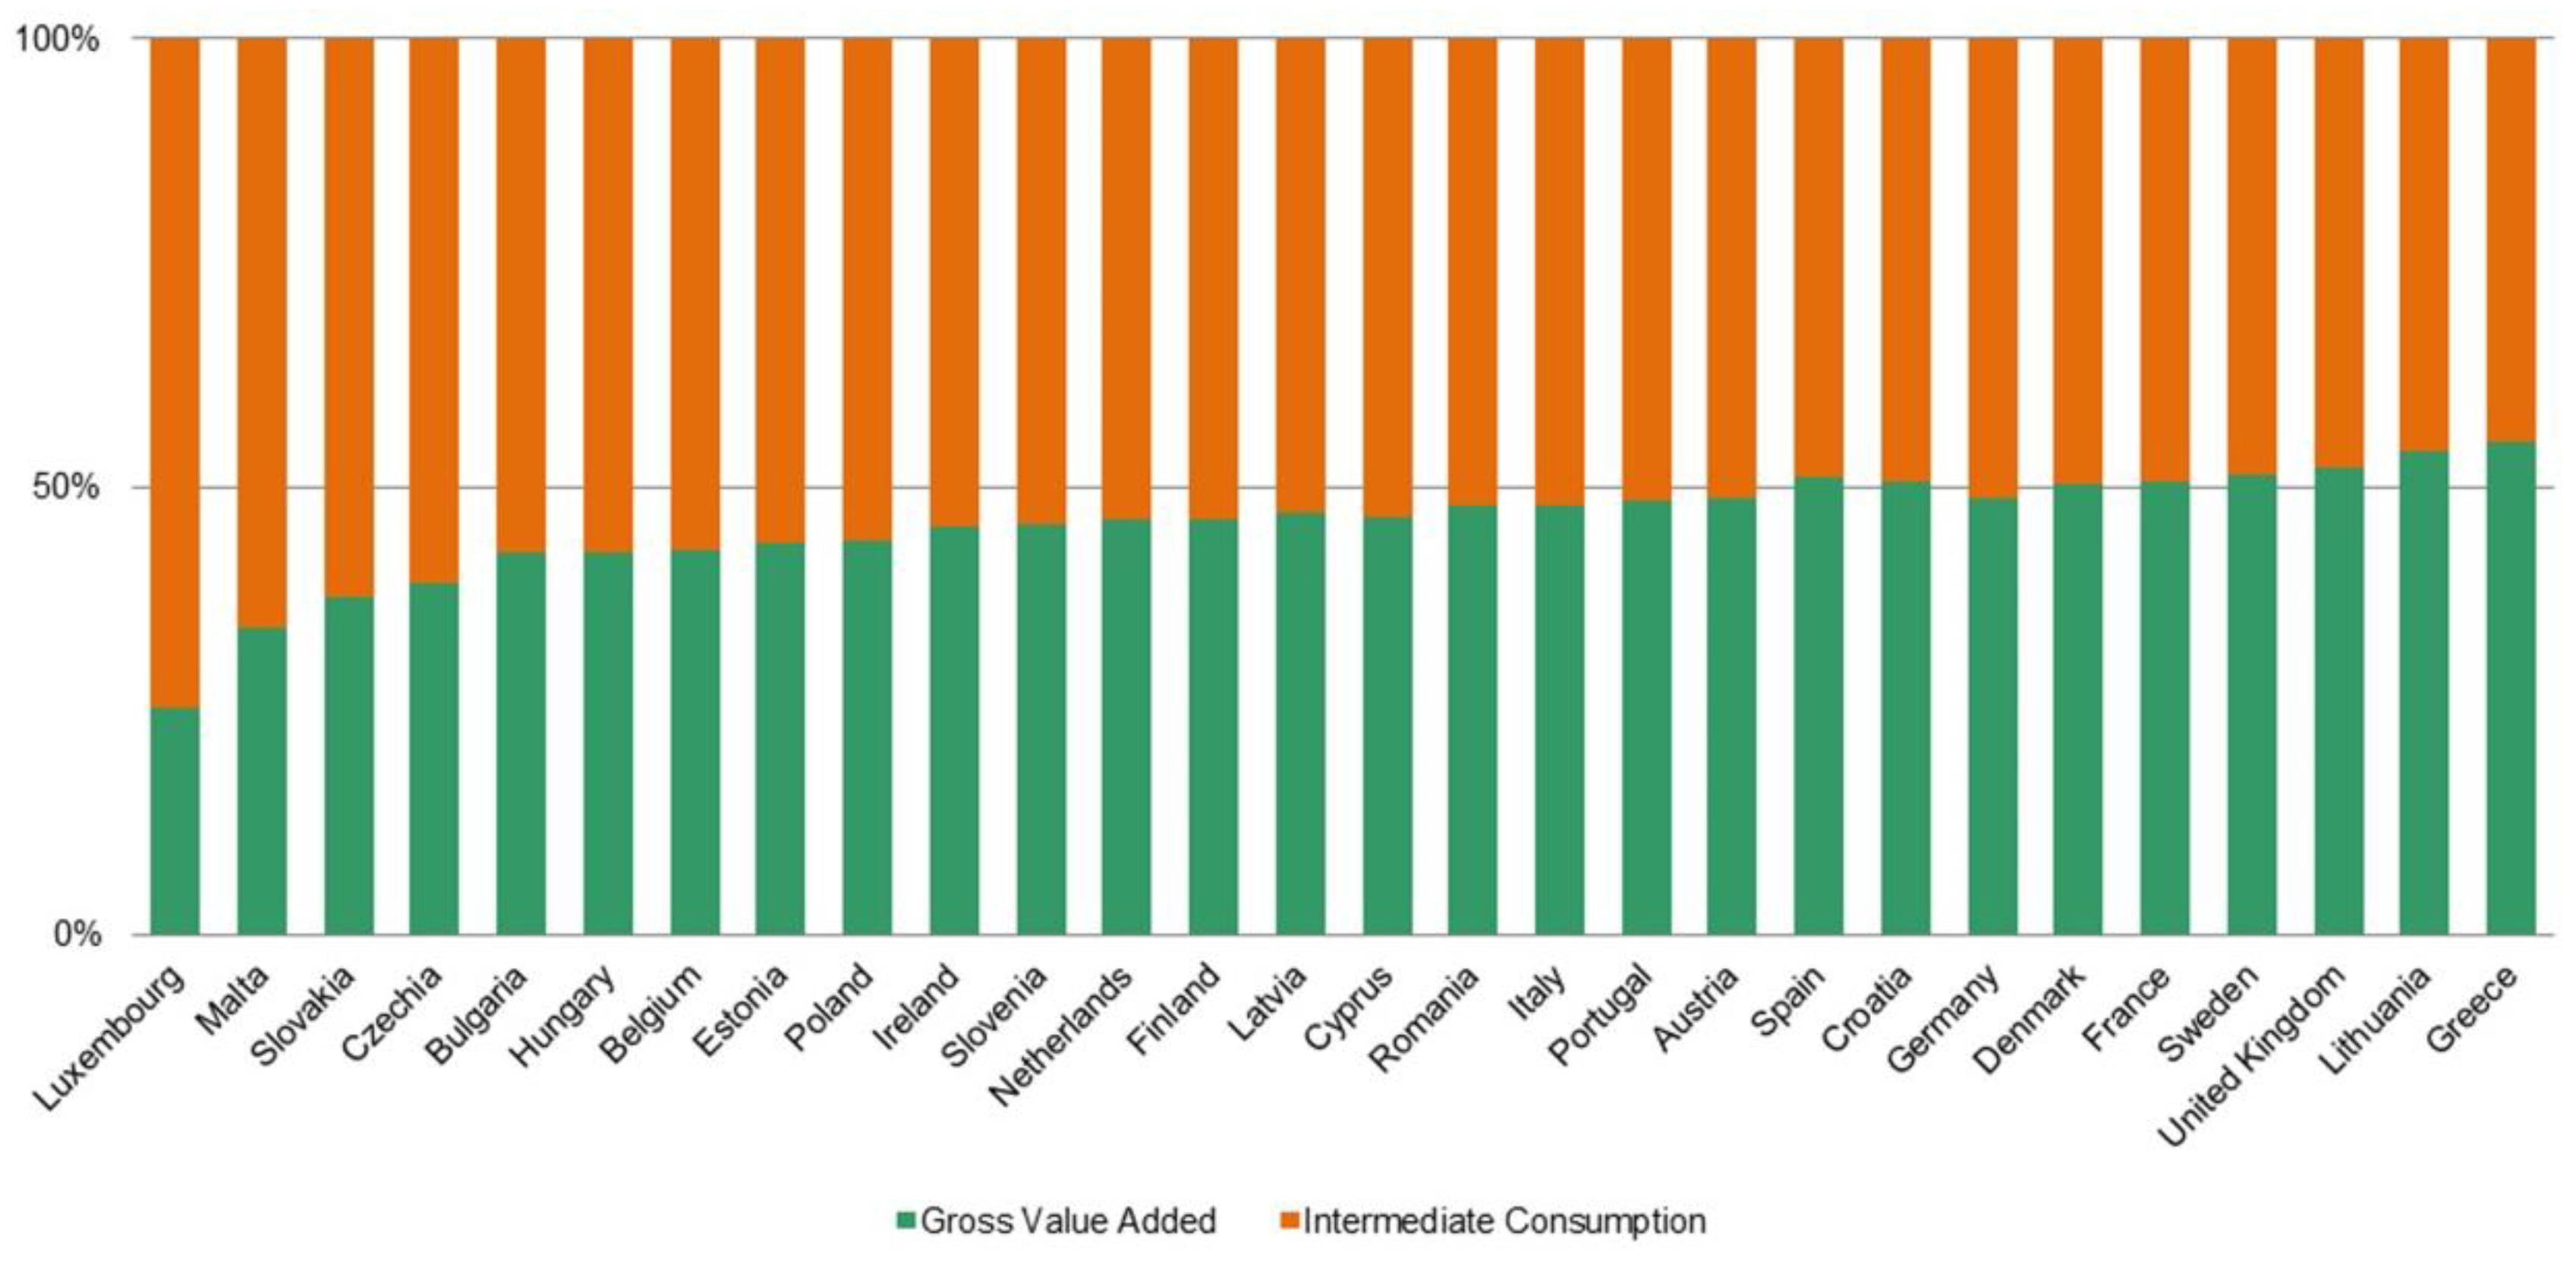
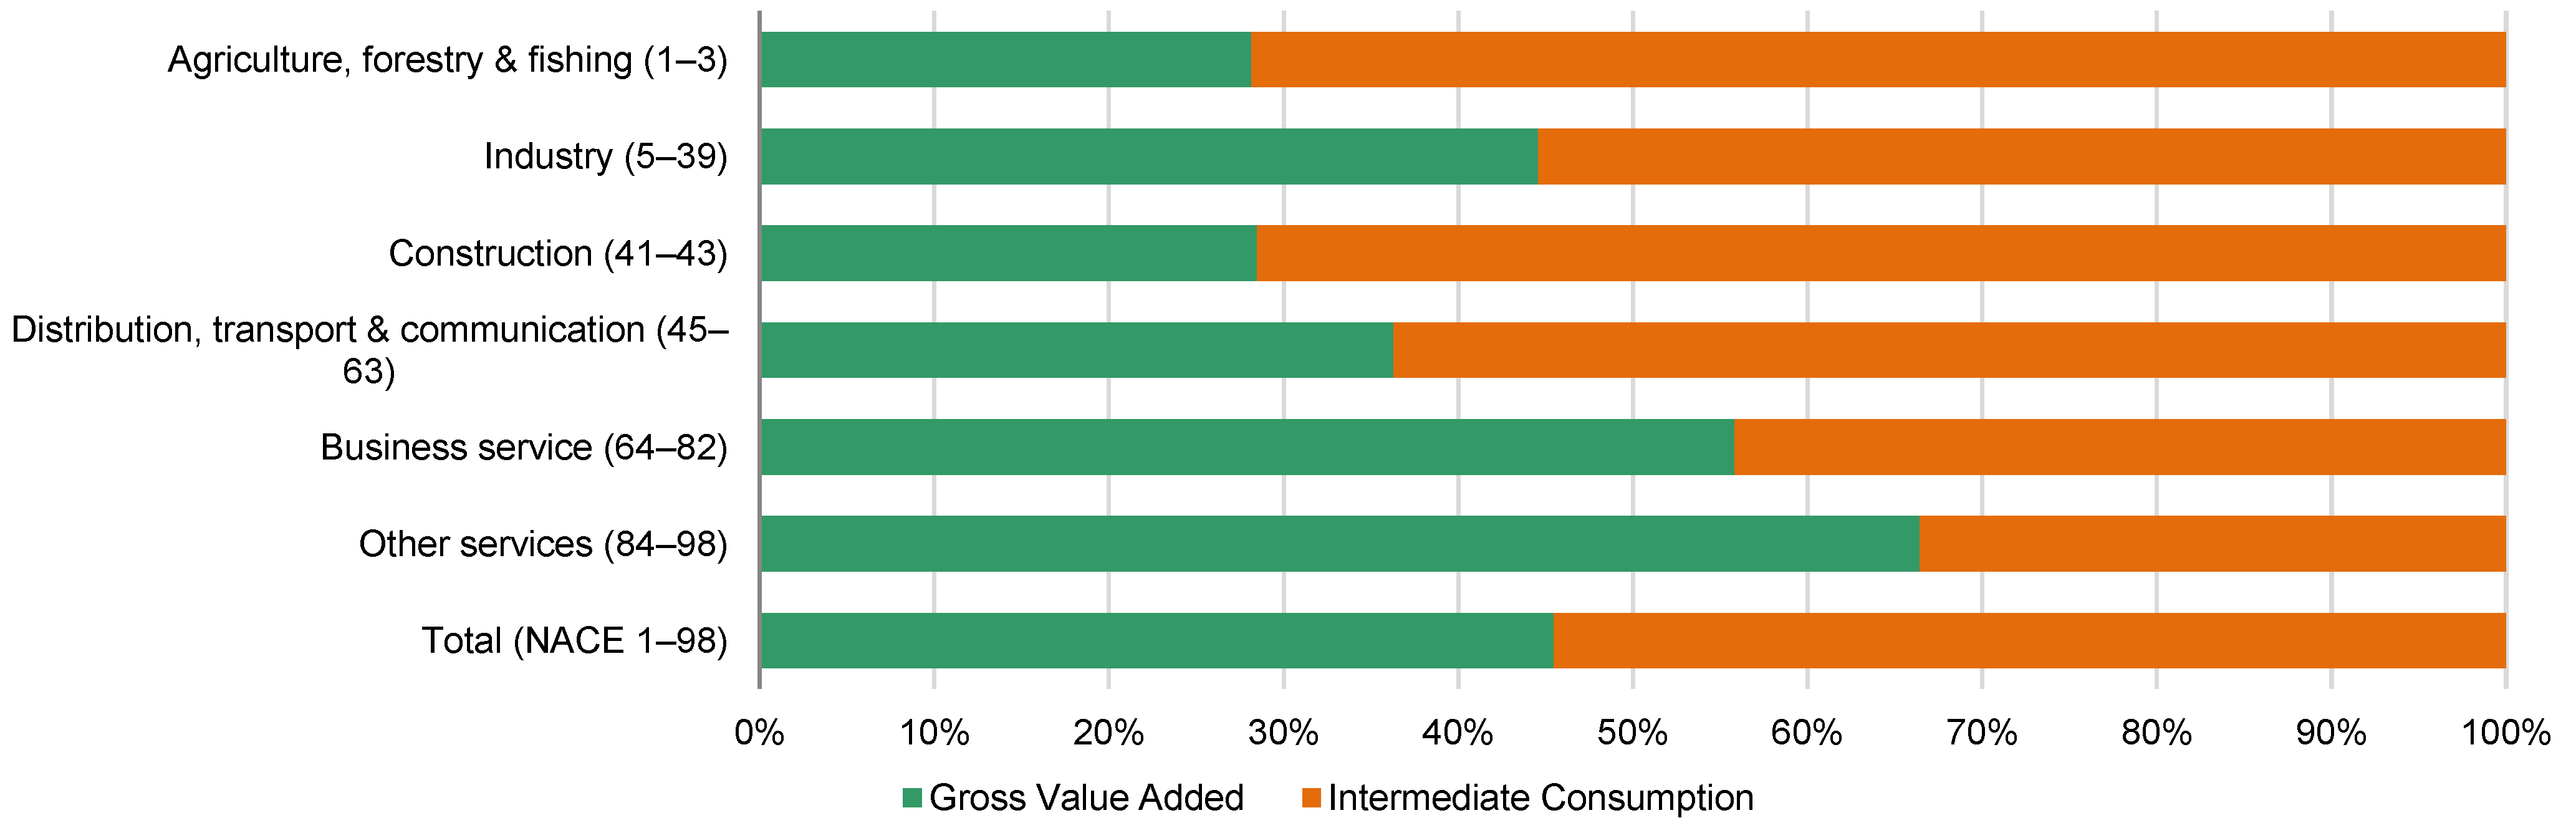
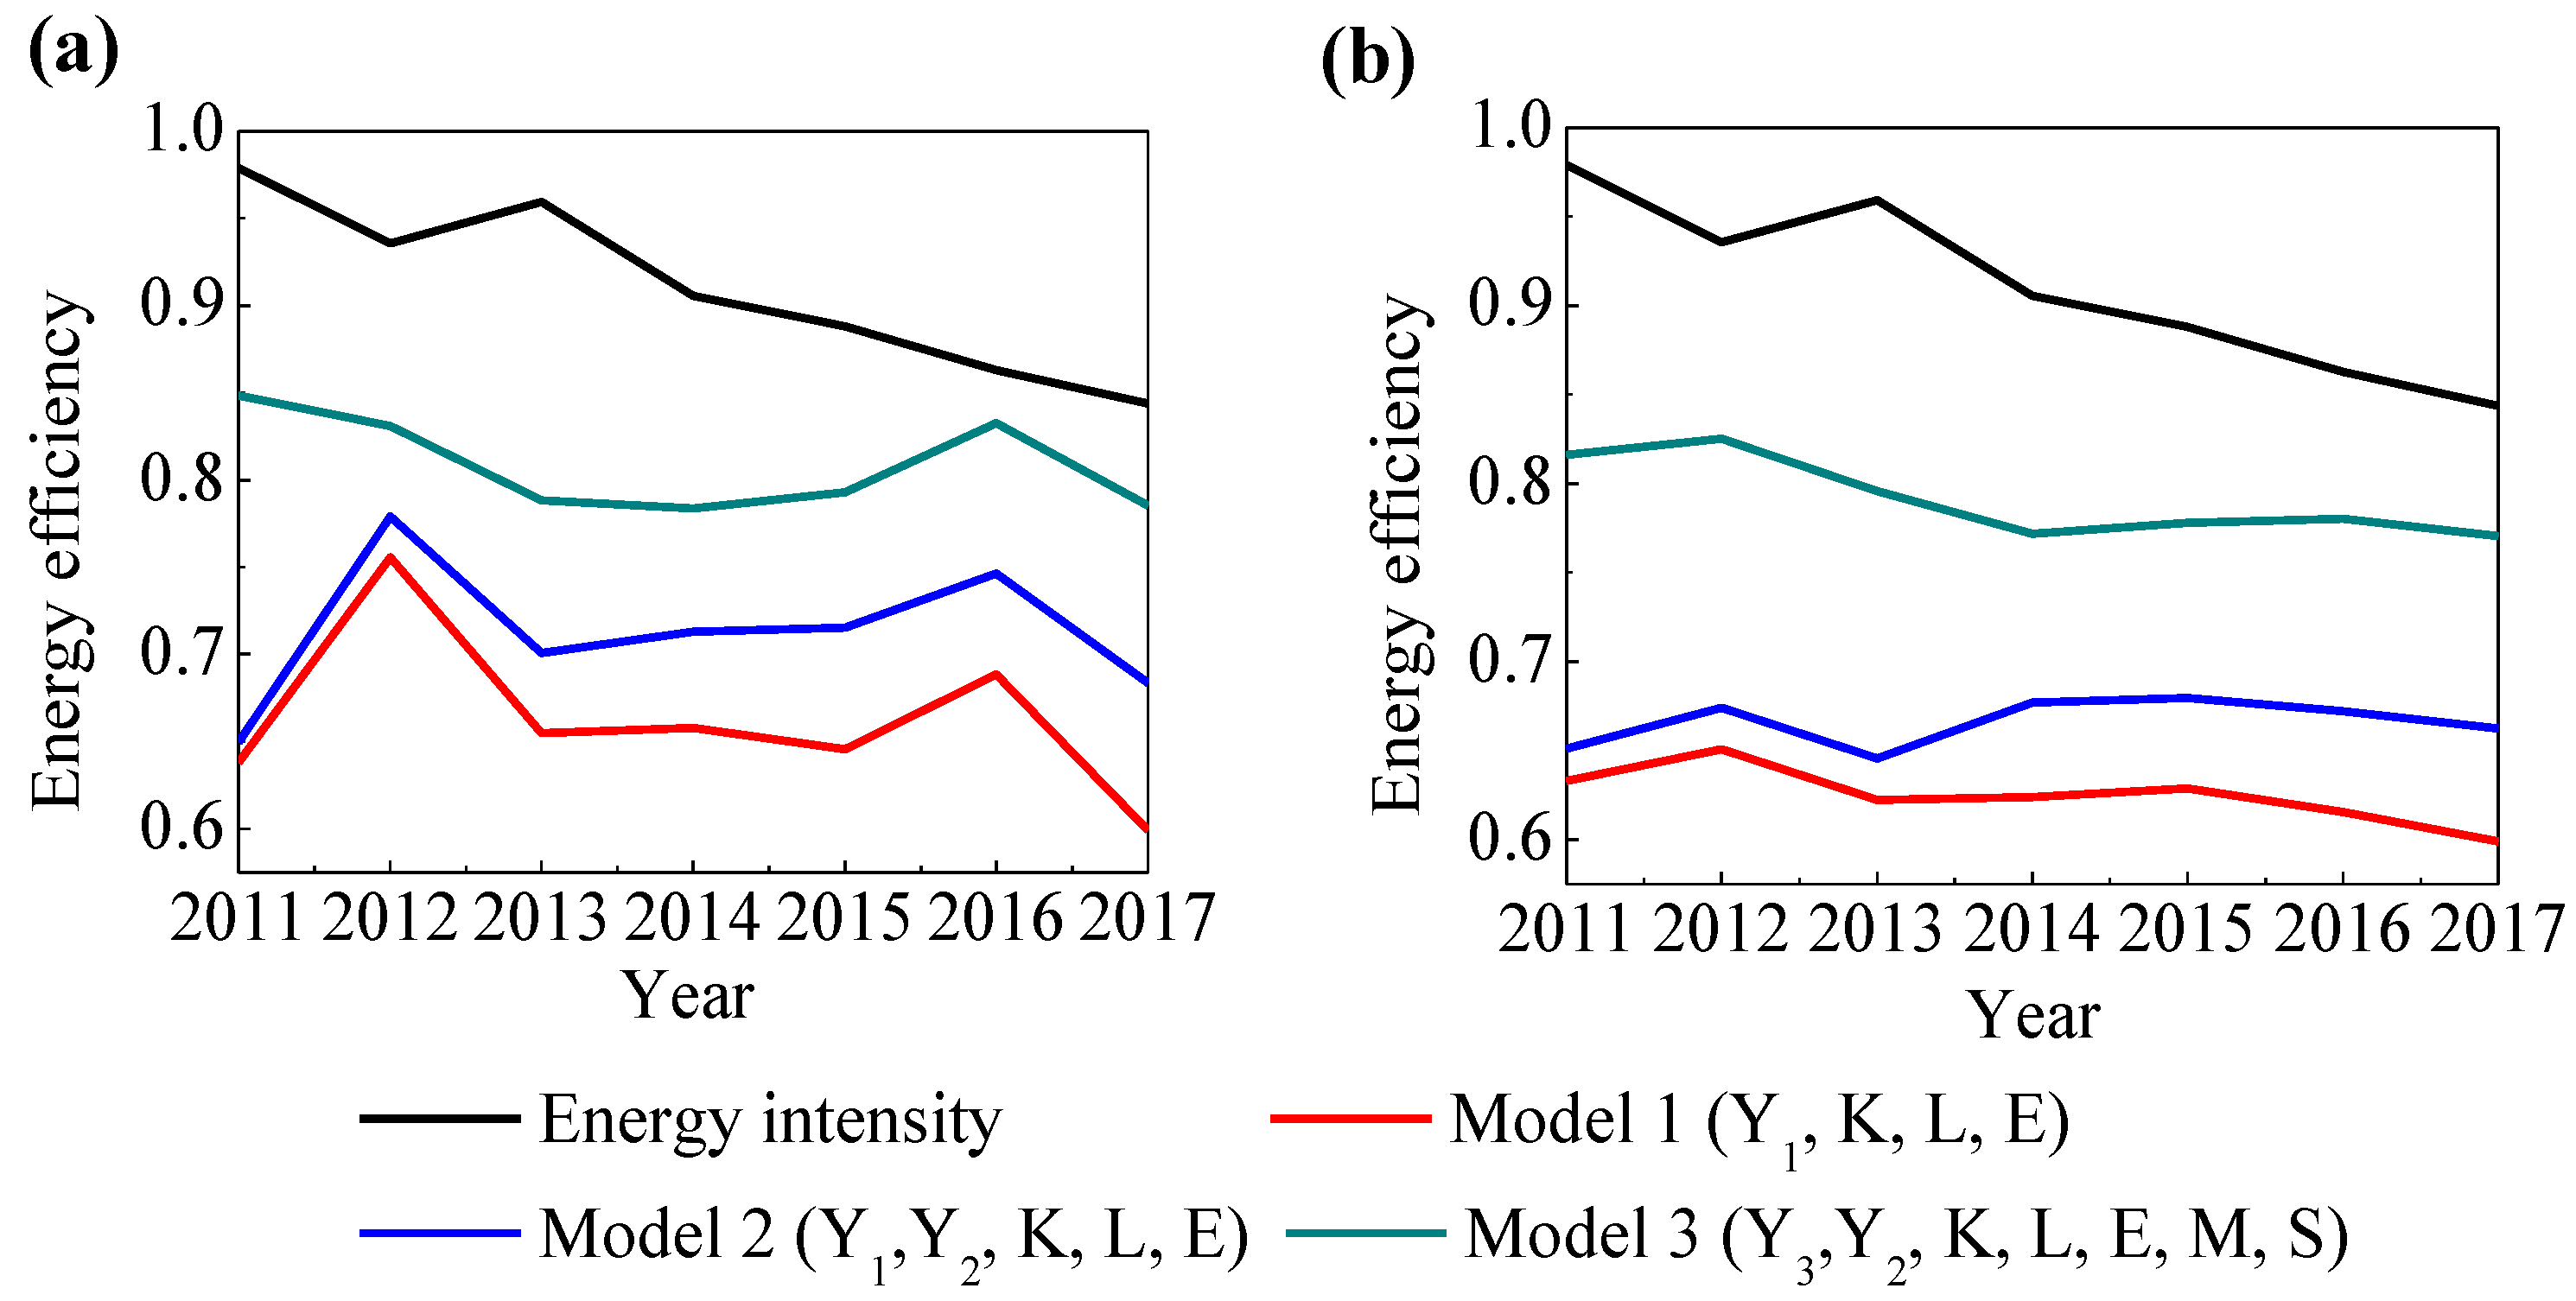
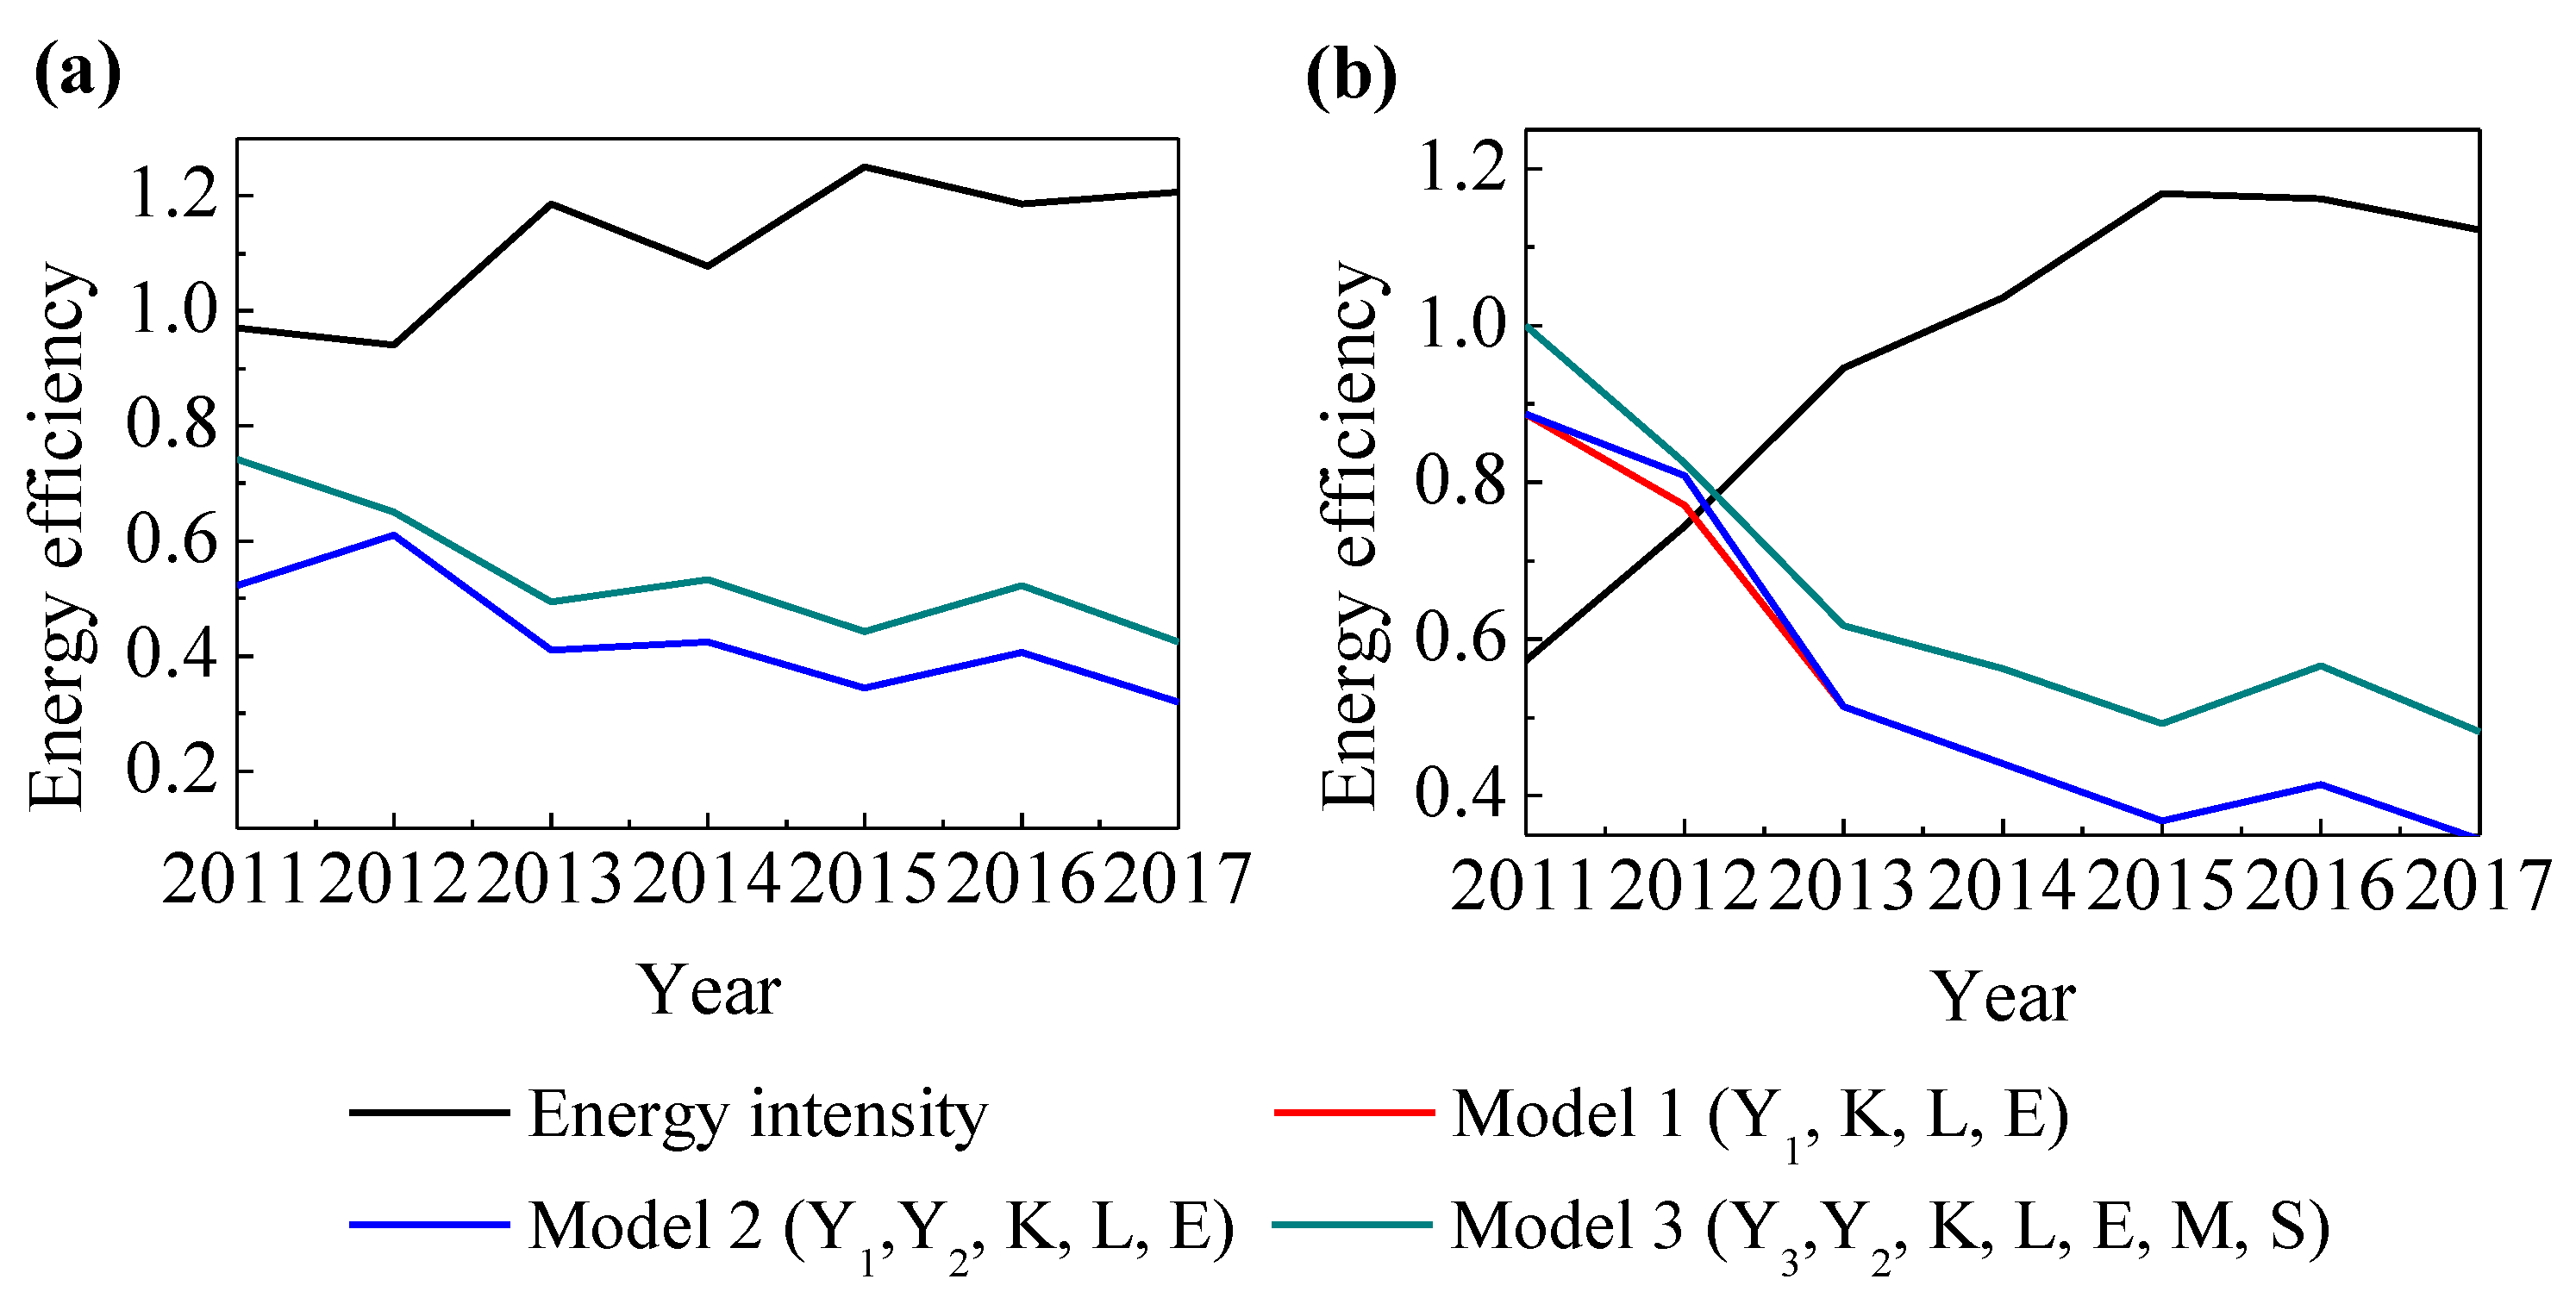
4.2. Results and Comparisons

This section reports on, and compares, the empirical results of the three existing energy efficiency measurements (energy intensity, Model 1 and Model 2) and the VO TFEE approach (Model 3) proposed in this paper, which measures SBM efficiency according to the fractional program (3) and then measures TFEE according to Equation (1). Figure 3 demonstrates the results and trends of average energy efficiency in the textile industry in 19 EU countries during the period 2011–2017. Figure 3a shows the annual average energy efficiency results of the four measures. Figure 3b displays the annual average TFEE trend with three-year SBM-window analysis.
According to Figure 3, there are two observations. On the one hand, the energy efficiency values measured by energy intensity and TFEE are quite different. Among the four approaches, the results of Model 3 have the smallest variance illustrated in Figure 3a, which indicates that Model 3 is more stable and suitable for policy analysis, and in Figure 3b, Model 3 has the most convergent trend since 2013, which reflects the improvement in energy efficiency and learning effects of energy saving and emission reduction in these EU member states.
On the other hand, the TFEE value of Model 2 has similar fluctuations and trends as Model 1, but its value is larger than that of Model 1, which indicates that under the heavy pressure of environmental pollution, the EU textile industry has made certain achievements in environmental governance over the period. In comparison with these two models, Model 3 has the largest TFEE value and fluctuates differently from Models 1 and Model 2. When taking intermediate consumption into account, energy efficiency scores perform better and fluctuate less.
As for the energy efficiency results among countries, it is clearly shown in Table A3 in Appendix B that the ranking of energy intensity is different from that of Model 3 for most countries. For example, Germany and the United Kingdom both rank 1st in Model 3, while in terms of energy intensity Germany ranks 9th and the United Kingdom ranks 17th. According to labor productivity calculated as the ratio of VA to labor in Table A4 (see Appendix B), we can see that the average labor productivity for the German textile industry is 0.8927, ranking first among 19 EU countries, and for the British textile industry it is 0.7321, ranking it second. Therefore, in view of the fact that the level of labor productivity mainly depends on various economic and technological factors in production, it can be considered that the textile industries in Germany and the United Kingdom are more developed, so their energy efficiency ranking should be among the best. The labor productivity ranking of the textile industry in the remaining EU countries also illustrates this view. In terms of ranking energy efficiency values, Model 3 is more convincing than energy intensity.
Furthermore, taking two single countries, Figure 4 shows the energy efficiency results of Bulgaria and Hungary, respectively, from 2011 to 2017, where the TFEE values of Model 1 are almost the same as those of Model 2. Energy intensity in Bulgaria fluctuates and rises while in Hungary continues to rise substantially during the sample period. Considering technical progress and economic development, the value added in the textile industry should gradually increase and energy intensity should gradually decrease throughout the sample period. These confusing results in energy intensity might be due to the deficiency of the single factor energy efficiency measurement rather than poor performance in achieving energy saving goals set by the SDGs.
Based on the discussion above, it can be concluded that energy intensity as a measurement for energy efficiency is also problematic in empirical estimation. In terms of reflecting the reality of energy efficiency, both the values and rankings measured by energy intensity are not as good as those of Model 3, which may mislead policy makers in decision making for national policy development and implementation because energy intensity is widely used in different countries. Filippini and Hunt [35] also state that energy intensity does not always reasonably indicate relative energy efficiency, which could result in a misleading picture for policy makers and misguided decisions in allocating funds. As a new measurement for energy efficiency, Model 3 provides better and more reliable energy efficiency results than energy intensity for policy making around sustainable development.
Figure 5 shows the empirical results of the textile industry in the United Kingdom, where the TFEE values of Model 1 are almost the same as those of Model 2. In Figure 5, the United Kingdom is always efficient in Model 3, but not in Model 1 and Model 2. In fact, in the actual production process, it is impossible for energy efficiency calculated by Model 1 and Model 2 to change from 0.29 to 1 within one year, because the improvement in efficiency is mainly driven by technical progress, which cannot be made so dramatically in just one year. The estimated results of energy efficiency from both Model 1 and Model 2 are also problematic in reflecting reality and are inconsistent with technical progress and practice. Therefore, Model 3 also performs better and more credibly than Model 1 and Model 2.
In summary, from both the perspectives of a theoretical framework and an empirical analysis, the new VO TFEE approach, i.e., Model 3, performs better and is more reliable as an energy efficiency indicator compared with the other three approaches in measuring energy efficiency.

5. Discussion and Conclusions

5.1. Discussion

Sustainable development has become the main trend of world development, and energy efficiency is one of the main standards to measure sustainable development. Improving energy efficiency is crucial for the whole world, especially when considering pollutant emissions. On this basis, many scholars have conducted a lot of research on energy efficiency measurement through energy intensity and TFEE, and evaluate the impact of various factors on energy efficiency. However, energy intensity and the existing two frequently used TFEE approaches have many deficiencies, which do not conform to the foundation of production economics and the practice of economic theory. Therefore, they are insufficient to investigate practical problems and are not conductive to formulating sustainable development policies.
In view of the shortcomings of the three main approaches, this paper proposes a VO TFEE approach (Model 3) for the measurement of energy efficiency, which takes VO instead of GDP as the desirable output and correspondingly incorporates capital, labor, energy, and the other intermediate materials and services except energy into inputs, thereby making the production possibility set include all inputs and outputs in conformity with production economics and SNA. The research results show that Model 3, the VO TFEE, has the smallest variance and is a more stable and convergent approach in measuring energy efficiency compared with the existing approaches, i.e., energy intensity, Model 1 and Model 2 of TFEE, so it is most suitable to provide reference for policy making and analysis.
For VO TFEE, it is essential to have the price of energy. Based on the available data, future research can further analyze energy efficiency of different countries, regions, and cities, as well as its dynamic changes and influencing factors.

5.2. Conclusions

As a comprehensive indicator, energy efficiency includes the three policy objectives of energy saving, pollution reduction, and economic growth. As a traditional and widely used energy efficiency proxy, however, energy intensity only focuses on energy saving and economic growth without considering the feasibility of actual production practice and the substitution between different production factors. The new VO TFEE approach (Model 3) with total factor analysis is more in line with the essence of energy efficiency and production economics as it can simultaneously achieve the policy goals of energy saving, pollution reduction, and sustainable economics. The empirical results indicate that the ranking of energy intensity in Germany and the United Kingdom are less accurate and less reliable compared with that of Model 3. Moreover, the continuous increase of energy intensity in Bulgaria and Hungary does not conform to the energy saving goals set by the SDGs, which may mislead policy makers in decision making and implementation of sustainable development at both industrial and national levels.
Among existing TFEE studies, Model 2 has been improved from Model 1 to incorporate undesirable output into the production possibilities set in the presence of pollution. However, the problem with Model 2 is that GDP is employed as the desirable output and does not include the value of intermediate consumption, which accounts for over half of the total output value of all production activities. In the VO TFEE approach (Model 3), we take VO instead of GDP as the desirable output and incorporate other intermediate consumption and services, excluding energy, into inputs as well in the measurement of energy efficiency. It has been proven by empirical results that Model 3 performs better and more reliably than both Model 1 and Model 2 in measuring energy efficiency of the textile industry in the EU.
According to the theoretical framework developed and the empirical evidence presented in this study, we conclude that the new VO TFEE approach, Model 3, is the best among the existing energy efficiency measurements. Energy intensity should not be regarded as the only binding target for policy making and implementation, and Model 3 should be introduced as a measurement of energy efficiency and put into practice. For policy makers, the VO TFEE approach includes the total input and output of all production activities as well as the optimal allocation efficiency, and its smaller fluctuations are more consistent with actual energy consumption. It can provide more information about sustainable production and help realize the SDGs of energy saving, pollution reduction, and sustainable economic development with the improvement of efficiency.

Author Contributions

Conceptualization, S.L. and H.D.; methodology, S.L. and H.D.; software, H.D.; validation, H.D. and C.L.; formal analysis, S.L. and L.W.; data curation, H.D.; writing—original draft preparation, S.L. and H.D.; writing—review and editing, L.W. All authors have read and agreed to the published version of the manuscript.

Funding

This research received no external funding.

Institutional Review Board Statement

Not applicable.

Informed Consent Statement

Not applicable.

Data Availability Statement

The data presented in this study are openly available in Eurostat at https://ec.europa.eu/eurostat/data/database. The product codes include [nama_10_a64], [sbs_na_sca_r2], [nrg_bal_s], [TEN00117] and [env_ac_ainah_r2].

Acknowledgments

The authors appreciate the editors and the reviewers for their help and constructive comments and suggestions on the drafts of this paper.

Conflicts of Interest

The authors declare no conflict of interest.

Appendix A

Table A1. List of nomenclature.
IEAInternational Energy Agency
EIAEnergy Information Administration
SDGSustainable Development Goal
SFEESingle factor energy efficiency
TFEETotal factor energy efficiency
SNASystem of National Accounts
DEAData Envelopment Analysis
SBMSlacks-based Measure
( y 1 , , y n ) Production feasible plans
VO, Y 3 Value of output
GVAGross value added
DMUDecision making unit
CRSConstant returns to scale
PIMPerpetual inventory method
KCapital
LLabor
EEnergy consumption
MIntermediate materials
SIntermediate services
VA, Y 1 Value added such as GDP
Y 2 Undesirable output
( G D P , E n e r g y ) The production set of energy intensity
( Y 1 , K , L , E ) Model 1, a production set of TFEE
( Y 1 , Y 2 , K , L , E ) Model 2, a production set of TFEE
( Y 3 , Y 2 , K , L , E , M , S ) Model 3, the production set of VO TFEE
x j = ( x 1 j , x 2 j , , x m j ) Input vectors
y j g = ( y 1 j g , y 2 j g , , y s 1 j g ) Desirable output vectors
y j b = ( y 1 j b , y 2 j b , , y s 2 j b ) Undesirable output vectors
λ = ( λ 1 , λ 2 , , λ n ) Nonnegative vector
X = [ x 1 , x 2 , , x n ] m × n matrix of input vectors
Y g = [ y 1 g , y 2 g , , y n g ] s 1 × n matrix of desirable output vectors
Y b = [ y 1 b , y 2 b , , y n b ] s 2 × n matrix of undesirable output vectors
s Potential reduction of inputs
s E Potential reduction of energy consumption
s b Potential reduction of undesirable output
s g Potential expansion of desirable output
ρ * The objective value of SBM
Table A2. Summary of some existing TFEE indicator selections.
InputOutput
TFEE without pollution
Hu and Wang [20](1) Capital; (2) Labor; (3) Energy consumption; (4) Total sown area of farm cropsGDP
Hu and Kao [23](1) Capital; (2) Labor; (3) Energy consumptionGDP
Zhang et al. [36](1) Capital;(2) Labor;(3) Energy consumptionGDP
Song et al. [37](1) Capital formulation; (2) Labor; (3) Energy consumptionGDP
Lin and Du [38](1) Capital; (2) Labor; (3) Energy consumptionGDP
Bian et al. [39](1) Capital; (2) Labor; (3) Energy consumptionGDP
Borozan [40](1) Capital; (2) Employment; (3) Energy consumptionGDP
Jebali et al. [41](1) Capital; (2) Labor; (3) Energy consumptionGDP
Eguchi et al. [42](1) Capital; (2) Coal consumption(1) Net electricity production; (2) sample size
Haider et al. [43](1) Capital; (2) Labor; (3) Energy consumption; (4) Materialoutput
TFEE with pollution
Zhou and Ang [44](1) Capital; (2) Labor; (3) Coal consumption; (4) Oil consumption; (5) Gas consumption; (6) Other energy consumption(1) GDP; (2) CO2
Li and Hu [45](1) Capital; (2) Labor; (3) Energy consumption(1) GDP; (2) SO2; (3) CO2
Wang et al. [46](1) Capital; (2) Labor; (3) Energy consumption(1) GDP; (2) CO2
Wang et al. [47](1) Capital stock; (2) Labor; (3) Energy consumption(1) GDP; (2) CO2
Apergis et al. [48](1) Capital; (2) Labor; (3) Energy consumption(1) GDP; (2) CO2
Wang and Feng [49](1) Capital; (2) Labor; (3) Energy consumption(1) GDP; (2) COD; (3) SO2; (4) Ammonia nitrogen
Wang et al. [50](1) Capital; (2) Labor; (3) Energy consumption(1) GDP; (2) CO2
Wang and Wei [51](1) Capital; (2) Labor; (3) Total energy (Coal, Oil, Natural gas, Electricity)(1) GDP;(2) CO2
Li and Lin [52](1) Capital; (2) Labor; (3) Energy consumption(1) GDP; (2) CO2; (3) SO2; (4) COD
Zhou et al. [53](1) Capital; (2) Labor; (3) Energy consumption(1) GDP; (2) CO2
Zhou et al. [54](1) Capital stock; (2) Labor force; (3) Oil; (4) Natural gas; (5) Coal; (6) Non-fossil energy(1) GDP; (2) CO2
Sueyoshi et al. [55](1) Capital; (2) Labor; (3) Energy consumption(1) Gross regional product; (2) SO2; (3) soot (dust); (4) waste water; (5) COD; (6) Ammonia nitrogen
Yang et al. [56](1) Capital; (2) Labor; (3) Energy consumption (4) SO2; (5) NOXGDP
Yang and Wei [57](1) Capital; (2) Labor; (3) Energy consumption(1) GDP; (2) Waste water; (3) SO2; (4) Smoke and dust
Özkara and Atak [58](1) Capital; (2) Employment; (3) Electricity(1) Production value; (2) CO2
Camioto et al. [59](1) Capital; (2) Labor; (3) Energy consumption(1) GDP; (2) CO2
Fathi et al. [60](1) Capital; (2) Labor; (3) Energy consumption(1) GDP; (2) CO2
Iftikhar et al. [61](1) Capital; (2) Labor; (3) Energy consumption(1) GDP; (2) CO2
Moon and Min [62](1) Capital; (2) Employee; (3) Energy consumption(1) Cost of goods sold; (2) GHG
Moutinho et al. [63](1) Population density; (2) labor productivity; (3) municipal waste; (4) number of registered cars; (5) number of companies(1) GDP/PM10; (2) GDP/CO2
Mohsin et al. [64](1) Labor; (2) Energy consumption(1) GDP; (2) CO2 per capita

Appendix B

Table A3. Comparison of the four energy efficiency results and rankings of each country.
CountryEnergy IntensityTFEE with Model 1TFEE with Model 2TFEE with Model 3
ScoreRankScoreRankScoreRankScoreRank
Bulgaria1.1169160.4337170.4337170.543917
Czechia1.7034190.2781190.2781190.398019
Germany0.84359111111
Estonia1.0272130.4770150.4770150.654213
Ireland1.3714180.3512180.3512180.480118
Greece0.828580.5809110.9026611
Spain0.481120.988030.9880511
Italy0.580530.816260.81921011
Cyprus0.403210.988320.9883411
Latvia0.9509100.5062130.5062130.581316
Lithuania0.765270.6208100.827090.951910
Hungary0.9644110.5341120.5394120.649214
Netherlands1.0597150.4475160.4475160.655612
Austria1.0442140.796781111
Poland0.595340.798070.8421811
Portugal0.9743120.4901140.4901140.608115
Romania0.676460.838551111
Slovakia0.656950.749290.7492110.847011
United Kingdom1.2579170.898940.8989711
Table A4. The average labor productivity of textile industry in EU countries.
CountryLabor ProductivityRankCountryLabor ProductivityRank
Bulgaria0.127012Lithuania0.135511
Czechia0.059418Hungary0.092815
Germany0.89271Netherlands0.23198
Estonia0.19629Austria0.67273
Ireland0.175910Poland0.112513
Greece0.073716Portugal0.23867
Spain0.44074Romania0.39825
Italy0.38446Slovakia0.109114
Cyprus0.045319United Kingdom0.73212
Latvia0.073617

References

  1. International Energy Agency (IEA). From Hidden Fuel to World’s First Fuel? Available online: https://www.iea.org/news/from-hidden-fuel-to-worlds-first-fuel (accessed on 5 November 2020).
  2. International Energy Agency (IEA). Energy Efficiency: A Key Tool for Boosting Economic and Social Development. Available online: https://www.iea.org/news/energy-efficiency-a-key-tool-for-boosting-economic-and-social-development (accessed on 5 November 2020).
  3. United Nations (UN). Transforming our World: The 2030 Agenda for Sustainable Development. Available online: https://sustainabledevelopment.un.org/post2015/transformingourworld/publication (accessed on 5 November 2020).
  4. Energy Information Administration (EIA). Measuring Energy Efficiency in the United States’ Economy: A Beginning; Superintendent of Documents; U.S. Government Printing Office: Washington, DC, USA, 1995. [Google Scholar]
  5. Cook, W.D.; Tone, K.; Zhu, J. Data envelopment analysis: Prior to choosing a model. Omega 2014, 44, 1–4. [Google Scholar] [CrossRef]
  6. Samuelson, P.A.; Nordhaus, W.D. Economics, 19th ed.; McGraw-Hill: New York, NY, USA, 2010. [Google Scholar]
  7. Jehle, G.A.; Reny, P.J. Advanced Microeconomic Theory, 3rd ed.; Prentice Hall: Harlow, UK, 2011. [Google Scholar]
  8. Varian, H.R. Microeconomic Analysis, 3rd ed.; W. W. Norton & Company: New York, NY, USA, 1992. [Google Scholar]
  9. Mas-Colell, A.; Whinston, M.D.; Green, J.R. Microeconomic Theory; Oxford University Press: New York, NY, USA, 1995. [Google Scholar]
  10. Färe, R.; Grosskopf, S.; Lovell, C.A.K. The Measurement of Efficiency of Production; Kluwer-Nijhoff Publishing: Boston, MA, USA, 1985. [Google Scholar]
  11. Borenstein, S. A Microeconomic Framework for Evaluating Energy Efficiency Rebound and Some Implications. In NBER Working Paper No. 19044; National Bureau of Economic Research: Cambridge, MA, USA, 2013. [Google Scholar]
  12. Patterson, M.G. What is energy efficiency? Concepts, indicators and methodological issues. Energy Policy 1996, 24, 377–390. [Google Scholar] [CrossRef]
  13. International Energy Agency (IEA). The 1.7% Improvement in Energy Intensity of the Global Economy in 2017 Marked the Second Consecutive Year of Slowing Improvements. Available online: https://www.iea.org/reports/sdg7-data-and-projections/energy-intensity (accessed on 5 November 2020).
  14. Taylor, P.G.; Abdalla, K.; Quadrelli, R.; Vera, I. Better energy indicators for sustainable development. Nat. Energy 2017, 2. [Google Scholar] [CrossRef] [Green Version]
  15. Proskuryakova, L.; Kovalev, A. Measuring energy efficiency: Is energy intensity a good evidence base? Appl. Energy 2015, 138, 450–459. [Google Scholar] [CrossRef]
  16. Renshaw, E.F. Energy efficiency and the slump in labour productivity in the USA. Energy Econ. 1981, 3, 36–42. [Google Scholar] [CrossRef]
  17. International Energy Agency (IEA). Progress with Implementing Energy Efficiency Policies in the G8. Available online: https://www.iea.org/reports/progress-with-implementing-energy-efficiency-policies-in-the-g8 (accessed on 5 November 2020).
  18. Wilson, B.; Trieu, L.H.; Bowen, B. Energy efficiency trends in Australia. Energy Policy 1994, 22, 287–295. [Google Scholar] [CrossRef]
  19. International Atomic Energy Agency (IAEA). Energy indicators for sustainable development: Guidelines and methodologies. Available online: https://www-pub.iaea.org/MTCD/Publications/PDF/Pub1222_web.pdf (accessed on 5 November 2020).
  20. Hu, J.-L.; Wang, S.-C. Total-factor energy efficiency of regions in China. Energy Policy 2006, 34, 3206–3217. [Google Scholar] [CrossRef]
  21. Farrell, M.J. The measurement of productive efficiency. J. R. Stat. Soc. 1957, 120, 253–290. [Google Scholar] [CrossRef]
  22. Ferrier, G.D.; Lovell, C.K. Measuring cost efficiency in banking: Econometric and linear programming evidence. J. Econom. 1990, 46, 229–245. [Google Scholar] [CrossRef]
  23. Hu, J.-L.; Kao, C.-H. Efficient energy-saving targets for APEC economies. Energy Policy 2007, 35, 373–382. [Google Scholar] [CrossRef]
  24. Charnes, A.; Cooper, W.W.; Rhodes, E. Measuring efficiency of decision making units. Eur. J. Oper. Res. 1978, 2, 429–444. [Google Scholar] [CrossRef]
  25. Fukuyama, H.; Weber, W.L. A directional slacks-based measure of technical inefficiency. Socioecon. Plann. Sci. 2009, 43, 274–287. [Google Scholar] [CrossRef]
  26. Zhou, P.; Ang, B.W.; Wang, H. Energy and CO2 emission performance in electricity generation: A non-radial directional distance function approach. Eur. J. Oper. Res. 2012, 221, 625–635. [Google Scholar] [CrossRef]
  27. Tone, K. A slacks-based measure of efficiency in data envelopment analysis. Eur. J. Oper. Res. 2001, 130, 498–509. [Google Scholar] [CrossRef] [Green Version]
  28. Tone, K. Dealing with undesirable outputs in DEA: A slacks-based measure (SBM) approach. Nippon Opereshonzu Risachi Gakkai Shunki Kenkyu Happyokai Abusutorakutoshu 2004, 2004, 44–45. [Google Scholar]
  29. Kohl, S.; Brunner, J.O. Benchmarking the benchmarks—Comparing the accuracy of data envelopment analysis models in constant returns to scale settings. Eur. J. Oper. Res. 2020, 285, 1042–1057. [Google Scholar] [CrossRef]
  30. European Commission; International Monetary Fund; Organisation for Economic Co-operation and Development; United Nations; World Bank. System of National Accounts 2008; United Nations: New York, NY, USA, 2009. [Google Scholar]
  31. European Commission. Available online: https://ec.europa.eu/eurostat/web/main/data/database (accessed on 13 January 2021).
  32. Central Statistics Office (CSO). Output and Value Added by Activity 2017. Available online: https://www.cso.ie/en/releasesandpublications/ep/p-naova/outputandvalueaddedbyactivity2017/ (accessed on 13 January 2021).
  33. Li, S.; Li, C. Modification and application of total factor energy efficiency measurement. J. Quant. Tech. Econ. 2018, 9, 110–125. [Google Scholar]
  34. Goldsmith, R.W. A Perpetual Inventory of National Wealth. In Studies in Income and Wealth; Conference on Research in Income and Wealth; National Bureau of Economic Research: Cambridge, MA, USA, 1951; Volume 14, pp. 5–73. [Google Scholar]
  35. Filippini, M.; Hunt, L.C. US residential energy demand and energy efficiency: A stochastic demand frontier approach. Energy Econ. 2012, 34, 1484–1491. [Google Scholar] [CrossRef] [Green Version]
  36. Zhang, X.-P.; Cheng, X.-M.; Yuan, J.-H.; Gao, X.-J. Total-factor energy efficiency in developing countries. Energy Policy 2011, 39, 644–650. [Google Scholar] [CrossRef]
  37. Song, M.-L.; Zhang, L.-L.; Liu, W.; Fisher, R. Bootstrap-DEA analysis of BRICS’ energy efficiency based on small sample data. Appl. Energy 2013, 112, 1049–1055. [Google Scholar] [CrossRef]
  38. Lin, B.; Du, K. Technology gap and China’s regional energy efficiency: A parametric metafrontier approach. Energy Econ. 2013, 40, 529–536. [Google Scholar] [CrossRef]
  39. Bian, Y.; Hu, M.; Wang, Y.; Xu, H. Energy efficiency analysis of the economic system in China during 1986–2012: A parallel slacks-based measure approach. Renew. Sust. Energy Rev. 2016, 55, 990–998. [Google Scholar] [CrossRef]
  40. Borozan, D. Technical and total factor energy efficiency of European regions: A two-stage approach. Energy 2018, 152, 521–532. [Google Scholar] [CrossRef]
  41. Jebali, E.; Essid, H.; Khraief, N. The analysis of energy efficiency of the Mediterranean countries: A two-stage double bootstrap DEA approach. Energy 2017, 134, 991–1000. [Google Scholar] [CrossRef]
  42. Eguchi, S.; Takayabu, H.; Lin, C. Sources of inefficient power generation by coal-fired thermal power plants in China: A metafrontier DEA decomposition approach. Renew. Sust. Energy Rev. 2020. [Google Scholar] [CrossRef]
  43. Haider, S.; Danish, M.S.; Sharma, R. Assessing energy efficiency of Indian paper industry and influencing factors: A slack-based firm-level analysis. Energy Econ. 2019, 81, 454–464. [Google Scholar] [CrossRef]
  44. Zhou, P.; Ang, B.W. Linear programming models for measuring economy-wide energy efficiency performance. Energy Policy 2008, 36, 2911–2916. [Google Scholar] [CrossRef]
  45. Li, L.-B.; Hu, J.-L. Ecological total-factor energy efficiency of regions in China. Energy Policy 2012, 46, 216–224. [Google Scholar] [CrossRef]
  46. Wang, K.; Lu, B.; Wei, Y.-M. China’s regional energy and environmental efficiency: A Range-Adjusted Measure based analysis. Appl. Energy 2013, 112, 1403–1415. [Google Scholar] [CrossRef]
  47. Wang, H.; Zhou, P.; Zhou, D.Q. Scenario-based energy efficiency and productivity in China: A non-radial directional distance function analysis. Energy Econ. 2013, 40, 795–803. [Google Scholar] [CrossRef]
  48. Apergis, N.; Aye, G.C.; Barros, C.P.; Gupta, R.; Wanke, P. Energy efficiency of selected OECD countries: A slacks based model with undesirable outputs. Energy Econ. 2015, 51, 45–53. [Google Scholar] [CrossRef] [Green Version]
  49. Wang, Z.; Feng, C. Sources of production inefficiency and productivity growth in China: A global data envelopment analysis. Energy Econ. 2015, 49, 380–389. [Google Scholar] [CrossRef]
  50. Wang, Q.; Su, B.; Zhou, P.; Chiu, C.-R. Measuring total-factor CO2 emission performance and technology gaps using a non-radial directional distance function: A modified approach. Energy Econ. 2016, 56, 475–482. [Google Scholar] [CrossRef]
  51. Wang, K.; Wei, Y.-M. Sources of energy productivity change in China during 1997–2012: A decomposition analysis based on the Luenberger productivity indicator. Energy Econ. 2016, 54, 50–59. [Google Scholar] [CrossRef]
  52. Li, J.; Lin, B. Ecological total-factor energy efficiency of China’s heavy and light industries: Which performs better? Renew. Sust. Energy Rev. 2017, 72, 83–94. [Google Scholar] [CrossRef]
  53. Zhou, P.; Sun, Z.R.; Zhou, D.Q. Optimal path for controlling CO2 emissions in China: A perspective of efficiency analysis. Energy Econ. 2014, 45, 99–110. [Google Scholar] [CrossRef]
  54. Zhou, D.Q.; Meng, F.Y.; Bai, Y.; Cai, S.Q. Energy efficiency and congestion assessment with energy mix effect: The case of APEC countries. J. Clean. Prod. 2017, 142, 819–828. [Google Scholar] [CrossRef]
  55. Sueyoshi, T.; Goto, M.; Wang, D. Malmquist index measurement for sustainability enhancement in Chinese municipalities and provinces. Energy Econ. 2017, 67, 554–571. [Google Scholar] [CrossRef]
  56. Yang, L.; Wang, K.-L.; Geng, J.-C. China’s regional ecological energy efficiency and energy saving and pollution abatement potentials: An empirical analysis using epsilon-based measure model. J. Clean. Prod. 2018, 194, 300–308. [Google Scholar] [CrossRef]
  57. Yang, Z.; Wei, X. The measurement and influences of China’s urban total factor energy efficiency under environmental pollution: Based on game cross-efficiency DEA. J. Clean. Prod. 2019, 209, 439–450. [Google Scholar] [CrossRef]
  58. Özkara, Y.; Atak, M. Regional total-factor energy efficiency and electricity saving potential of manufacturing industry in Turkey. Energy 2015, 93, 495–510. [Google Scholar] [CrossRef]
  59. Camioto, F.D.C.; Moralles, H.F.; Mariano, E.B.; Rebelatto, D.A.D.N. Energy efficiency analysis of G7 and BRICS considering total-factor structure. J. Clean. Prod. 2016, 122, 67–77. [Google Scholar] [CrossRef]
  60. Fathi, B.; Ashena, M.; Bahari, A.R. Energy, environmental, and economic efficiency in fossil fuel exporting countries: A modified data envelopment analysis approach. Sustain. Prod. Consum. 2021, 26, 588–596. [Google Scholar] [CrossRef]
  61. Iftikhar, Y.; Wang, Z.; Zhang, B.; Wang, B. Energy and CO2 emissions efficiency of major economies: A network DEA approach. Energy 2018, 147, 197–207. [Google Scholar] [CrossRef]
  62. Moon, H.; Min, D. A DEA approach for evaluating the relationship between energy efficiency and financial performance for energy-intensive firms in Korea. J. Clean. Prod. 2020, 255, 120283. [Google Scholar] [CrossRef]
  63. Moutinho, V.; Madaleno, M.; Macedo, P. The effect of urban air pollutants in Germany: Eco-efficiency analysis through fractional regression models applied after DEA and SFA efficiency predictions. Sustain. Cities Soc. 2020, 59, 102204. [Google Scholar] [CrossRef]
  64. Mohsin, M.; Hanif, I.; Taghizadeh-Hesary, F.; Abbas, Q.; Iqbal, W. Nexus between energy efficiency and electricity reforms: A DEA-Based way forward for clean power development. Energy Policy 2021, 149, 112052. [Google Scholar] [CrossRef]
Figure 1. The percentage of gross value added and intermediate consumption in the total output value of EU member states in 2017. Source: Eurostat.
Sustainability 13 01605 g001
Figure 2. The percentage of gross value added and intermediate consumption in the total output value of Ireland in 2017. Source: CSO, Ireland.
Sustainability 13 01605 g002
Figure 3. Average energy efficiency results and trends in textile industry of EU, 2011–2017. (a) The annual average energy efficiency results of the four measures; (b) the annual average TFEE trend with three-year slacks-based measure (SBM)-window analysis.
Sustainability 13 01605 g003
Figure 4. Energy efficiency results of textile industry in Bulgaria and Hungary, 2011–2017. (a) Energy efficiency results of textile industry in Bulgaria; (b) energy efficiency results of textile industry in Hungary.
Sustainability 13 01605 g004
Figure 5. Energy efficiency results of textile industry in the United Kingdom, 2011–2017.
Sustainability 13 01605 g005
Table 1. Summary of energy intensity and total factor energy efficiency (TFEE).
Energy IntensityTFEE
DefinitionEnergy consumption per unit of outputRatio of target energy input to the actual energy input
Expression E n e r g y G D P o p t i m a l   e n e r g y   i n p u t a c u t a l   e n e r g y   i n p u t
Value [ 0 , + ) [ 0 , 1 ]
Production set ( G D P , E n e r g y ) ( Y 1 , K , L , E ) or ( Y 1 , Y 2 , K , L , E )
Note: Energy intensity is taken as the representative of SFEE.
Table 2. The production sets of three TFEE models.
OutputInput
Y1 (GDP)Y2
(Undesirable Output)
Y3 (VO)KLEMS
Model 1 × × × ×
Model 2 × × ×
Model 3
Note: As Y3 consists of both intermediate consumption and GVA as Equation (2) expressed, GDP, as a part of VO, is also included in Model 3.
Table 3. The descriptive statistics of all inputs and outputs of all EU countries each year.
VariableYearMeanStd. Dev.MaximumMinimum
Capital stock
(million euro in 2011 constant price)
20113453.4781 7423.7787 32,491.2794 28.4215
20123223.2817 6833.8923 29,924.6587 25.6215
20133064.7756 6340.6949 27,755.3726 22.4527
20142912.6722 5856.4242 25,625.1090 20.3401
20152727.2914 5327.3256 23,221.0915 17.1161
20162664.8664 5077.9500 22,101.6250 16.3665
20172582.6287 4865.3463 21,173.1128 15.2973
Labor
(number)
201110,330.947414,571.662464,464350
201210,100.631614,253.311463,359323
20139883.421113,694.496161,062319
20149851.263213,362.314159,237300
20159892.368413,112.312657,966301
201610,029.210513,026.287757,333297
201710,061.684213,173.554957,946292
Energy consumption
(gigawatt-hour)
20112563.90733639.332213,854.61107
20122442.70753616.673013,966.55606
20132359.74053470.931413,568.27806
20142295.35363372.244613,230.25005
20152206.10463213.954712,868.22205
20162198.70723167.934012,776.41705
20172197.97393288.809713,528.42905.1990
Intermediate materials and services except energy
(million euro in 2011 constant price)
20116157.8244 14,090.9352 61,712.4470 25.2765
20125707.8845 13,025.8529 57,306.2758 22.4154
20135590.2348 12,726.0652 55,955.4625 17.2142
20145712.8812 12,765.0353 56,061.5849 17.5662
20155712.5177 12,496.6908 54,955.9977 20.8218
20165552.3837 12,029.4338 52,830.7348 21.7496
20175638.1871 12,210.8510 53,656.9266 23.0158
Value added
(million euro in 2011 constant price)
20113219.45265638.678924,015.500019.8000
20123060.22585299.901222,453.901914.9453
20133045.58975320.938122,560.536411.3442
20143112.34345406.141522,873.996311.6339
20153135.99515439.633122,974.323312.4878
20163171.40935484.722623,105.508813.5916
20173213.11495617.645923,674.627215.2851
Value of output
(million euro in 2011 constant price)
20119633.526320,004.388887,314.400046.3000
20129023.752218,600.711281,403.704638.6414
20138874.548918,280.091179,999.653829.7538
20149052.433018,393.453180,314.893130.0458
20159046.577518,116.494179,090.880533.8808
20168904.775317,652.795976,952.177935.8324
20179017.926017,972.768478,386.351238.9719
Greenhouse gases
(tonnes in CO2 equivalent)
2011406,554.7321667,948.92862,458,099.88001611.5900
2012371,783.6905579,871.42272,022,994.37001432.0400
2013400,717.0995671,627.14232,558,221.71001271.9300
2014377,705.1632621,028.92532,307,487.35001157.7900
2015392,675.9005703,096.25492,871,121.36001254.1300
2016383,712.2342658,729.91272,644,937.00001272.9000
2017370,583.2774627,648.58702,509,165.52001408.1200
Note: 19 EU countries included in this study are Bulgaria, Czechia, Germany, Estonia, Ireland, Greece, Spain, Italy, Cyprus, Latvia, Lithuania, Hungary, Netherlands, Austria, Poland, Portugal, Romania, Slovakia, and United Kingdom.
Publisher’s Note: MDPI stays neutral with regard to jurisdictional claims in published maps and institutional affiliations.

