Abstract
The Sustainable Development Goals (SDGs) and associated targets focus on a wide range of global issues and can be useful in coastal challenges such as climate change and green economic growth. The aim of this study is to tailor the SDGs, as a universally recognized policy framework, to assess the sustainability performance for coastal flood protection management to enhance climate-resilient and adaptable coastal development. To operationalize this aim, the SDG Sustainability Impact Score (SDG-SIS) framework was developed. Based on system functionalities for the land–sea interface, 38 SDGs were identified in the SDG-SIS framework. Given the availability of public numeric data, only 12 SDG targets are connected with Key Performance Indicators (KPIs). The SDG-SIS framework was applied to two different sets of cases, including five coastline and five sand nourishment cases. This study shows that the geographical and socioeconomic characteristics of the two sets of cases should be considered in the selection of system functionalities as well as the consideration of SDG targets. Moreover, cross-linking cumulative consequences of SIS do not directly indicate the level of sustainability, but the individual SDG target data are essential to reveal the underlying details. This stresses the importance of prioritizing SDGs to serve as leverage for policymakers to optimize the climate resilience and adaptation of coastal management. The SDG-SIS framework enables the support of coastal policy by addressing long-term measures and providing a sustainable vision for future implementation.
1. Introduction
1.1. Coastal Sustainability
Coastal areas are under pressure from a multitude of direct drivers, such as an increasing demand for human settlement and sociopolitical and economic development. Next to these direct drivers, there are indirect drivers, such as climate variability, which exacerbate the degradation of natural coastal conditions. If left unregulated, impacts including flooding of urban areas due to coastal erosion [1], reduction of water quality due to pollution by hazardous waste [2,3], and air pollution due to (maritime) traffic and industries [4] will occur more frequently and intensively. Further complicating the matter, coastal regions often accommodate a high degree of biodiversity and enhance important ecological values [5]. Coastal ecosystem services, such as flood protection, biodiversity, and fisheries, may come under pressure from human actions such as the expansion of ports and coasts [6]. The ongoing trade-off between increasing populations and the utilization of coastal regions is further muddied by realized and pending climate change impacts. Preparations and adaptation strategies to cope with the associated sea-level rise, changing storm intensity, and frequency due to a changing climate are required [7,8]. Climate change is a principal driver of sustainable action plans regarding coastal protection, coastal management, and maintenance planning [9,10]. Sustainable coastal development, in view of social, environmental, governance, and economic considerations, is needed to balance the demands placed on coastal systems [11]. As a result of the growing interest in developing sustainable coasts via the inclusion of nature-based solutions (NBS), increased policy implementation is needed to reduce the impact of climate change on both the natural coastal system and socioeconomic activities [12].
In 2015, the United Nations adopted 17 Sustainable Development Goals (SDGs) including 169 targets and 245 indicators with the aim to end poverty, protect the planet, and ensure the prosperity of people [13,14,15]. The UN has called for global action to achieve the SDG targets by 2030 [16,17]. The SDGs and their targets focus on a wide range of global issues and appear to be useful for coastal topics such as climate change, economic green growth, and environmental degradation of coastal land [18,19,20]. Coastal projects developed and managed in a sustainable manner can provide national and regional benefits and have the potential to play an important role in contributing to the achievement of SDGs [21,22].
This manuscript is composed of five logically structured sections. Section 1.2 consists of a literature review on coastal flood management and provides an overview of the assessment frameworks. In Section 1.3, the subject and the problem statement are introduced as well as the aim of the study. In Section 2, the methodology is elaborated into four research steps; together, they form the SDG-SIS assessment framework. In Section 3, the findings of research are presented and organized according to the four research steps. Finally, in Section 4 and Section 5, the findings are debated and concluded.
1.2. Literature Review
1.2.1. Coastal Flood Management
The current coastal adaptation policy in the Netherlands centers on the dynamic maintenance of the base coastline via sand nourishments. These sand nourishments are a form of coastal flood management, where, in the coastal zone, wave action, currents and aeolian transport interact with dredging barges to transport the sand to the desired zone. When applied correctly, these sand embankments reduce wave energy and therefore enhance flood protection [23]. Research illustrates that sand nourishments are a cost-effective method for flood protection of the Dutch coast [24].
For the holistic evaluation of Integrated Coastal Zone Management (ICZM) [25], a set of indicators is used to assess the progress of ICZM implementation. Monitoring and evaluation of both the sustainability and performance of coastal management is key for building the required evidence for validation, support for wider acceptance, and inclusion of sustainable alternatives on a larger scale [26,27]. A prerequisite in developing such evidence is the identification of indicators that are practical for assessing coastal development and monitoring the progress towards sustainability [28]. Such indicators need to measure the socioeconomic, governance, and environmental considerations, requiring multi-criteria analyses and long-term planning [29,30,31]. Commitment is needed in coastal flood protection management to reduce the probability of flooding in a sustainable manner [32]. A variety of climate adaptation measures can contribute to coastal flood protection management (Table 1). Coastal regions are in a precarious balancing act, continuously leveraging the societal benefits of economic activities and the pressures of potential economic growth against weighing the threats posed by the vulnerable geographical position, compounded by climate change, and ensuring the protection of complex and high-biodiversity ecosystems. However, certain flood protection measures—such as nature-based solutions (NBS) [24,26,33,34]—have the potential to even out the scales and contribute to the strategies within the 2030 Agenda for Sustainable Development [14].

Table 1.
Overview of climate adaptation measures that contribute to coastal flood protection management. Table composed according to [35].
1.2.2. Assessment of Sustainability
Schipper et al. [11] developed a methodology to assess port-(cities) via a set of Key Performance Indicators (KPIs) related to green port policy. The methodology has the potential to be expanded and applied in an inclusive manner [11,47] as the interference of coastal structures and dredging activities on coastal processes has already been incorporated within this approach. The green port policy is based on the integration of Triple P—”People”, “Planet”, and “Prosperity”—in decision-making [45,48,49]. The monitoring of SDGs to identify climate change biodiversity vulnerability and socioeconomic interventions is well studied. Specific SDG and indicator assessment approaches related to infrastructures have been applied for smart cities [50,51], green ports or logistics [52,53], coasts [54], or the circular economy [55].
A variety of SDG assessment frameworks have been analyzed with a set of SDGs to monitor progress in different sectors [56,57,58]. Table 2 presents an overview of SDG assessment frameworks used in coastal regions for policy and research purposes in different geographical areas [12,42,43,44,54,59,60,61,62].
Table 2.
Overview of international Sustainable Development Goal (SDG) assessment frameworks used to assess coastal flood protection management in geographical areas in, respectively, Asia, Africa, Europe, America, and Australia.
1.3. Problem Statement and Aim
The starting point of this study is the problem statement: ready-to-use approaches to assess the level of sustainability and transitions to coastal resilience solutions and adaptation to climate change are not readily available. Moreover, there are no approaches available to operationalize and monitor the implementation of the SDGs in the context of coastal flood protection management.
To tackle these problems, the study emphasizes coastal sustainability to stimulate adaptations for pending climate change effects, to minimize negative ecological and social impacts.
The aim of this study is to tailor the SDGs, as a universally recognized policy framework, to assess the sustainability performance for coastal flood protection management to enhance climate-resilient and adaptable coastal development [27,36,63,64,65,66]. This legitimizes research within the SDG-SIS assessment framework, demonstrating a systematical selection of an inclusive set of SDG targets. The selection is derived from the 17 SDGs and connects with selected KPIs in order to apply them to coastal flood protection management. The SDG-SIS provides a methodology to assess the level of sustainability and transitions to coastal resilience solutions and adaptation to climate change.
2. Methodology
2.1. SDG-SIS Framework
The starting point of the SDG-SIS framework is to select coastal locations. Subsequently, the SDG-SIS framework includes four main steps, starting with the 17 SDGs as input (Figure 1). Step I defines the system features which relates to the selected cases in order to consider the 169 SDG targets (Step II) to continue with the final and tailored selection of SDG-KPIs (Step III). Finally, Step IV consists of the assessment based on numeric data, with the Sustainability Impact Score (SIS) as output.
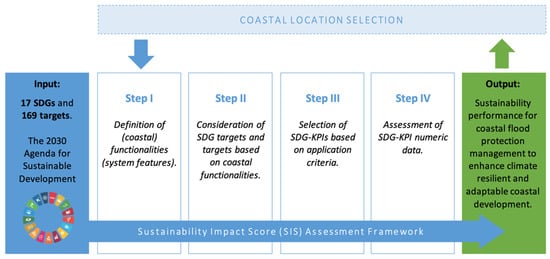
Figure 1.
The SDG-Sustainability Impact Score (SDG-SIS) assessment framework, using a selection of SDGs, SDG targets, and SDG indicators published in the 2030 Agenda for Sustainable Development. The SDG-SIS assessment framework output shows the Sustainability Impact Score to enhance the coastal resilience and adaptation that is reached. Figure modified based on [11].
2.2. Selection of Case Studies
In this study, two sets of cases have been used to demonstrate the wide usability and the applicability of the SDG-SIS assessment framework. The two sets are distinguished according to selected biophysical characteristics of coastlines. This results in, respectively, (A) cases with varying coastal geology and (B) cases with one coastal geology.
2.3. Definition of the Functionalities (Step I)
The aim of the coastal functionalities (Step I) is to define the scope of the sustainability analysis based on the literature. To assess the sustainability performance of coastal flood protection management, it is vital to consider the functionalities consisting of system features on the land–sea interface, resulting in a combination of societal processes, the geology and coastal ecosystem, coastal protection and resilience service, and adaptation of the coastal ecosystem to climate change and accelerating sea-level rise. The following six functionalities are selected in applying the SDG-SIS framework [67,68,69]:
- Serving coastal ecosystems to reduce flood frequency;
- Serving socioeconomic inclusive growth;
- Valuating biodiversity and ecosystem;
- Regulating emission reduction;
- Controlling coastal flooding and erosion reduction;
- Serving wellbeing of humans.
In a matrix, the selected case studies (Step I) are, based on expert judgement, marked using the six functionalities, resulting in a consideration of relevance. The following scoring system is applied: ▽ = low level of relevance towards functionality; ▲ = high level of relevance towards functionality.
2.4. Consideration of SDG Targets (Step II)
The individual 169 targets are analyzed, with the aim to check the potential correlation with the functionalities contributing to all SDGs. In a matrix, the individual SDG target relations with coastal functionalities (step I) are considered. The “direct link”, “indirect/uncertain link”, and “no link” towards the coastal functionalities are considered and checked with the compilation of metadata for SDGs [70]. This consideration of the SDGs and their targets results in a heat map and specific SDG target selection out of the 169 targets in such a manner that it relates to coastal flood protection management.
2.5. Selection Criteria of the SDG Coastal KPIs (Step III)
Preferably, the considered relevant SDG targets—as investigated in Step II—are parameterized with data indicators (KPI) (Step III) which are relevant for coastal resilience solutions to reduce impacts of climate change on coastal flooding and to increase sustainable management of the coastal zone [24,57].
Preferably, data with a Tier 1 classification by the Inter-Agency and Expert Group (IAEG) for the implementation of the SDGs should be used; however, if not available or available but not relevant and/or measurable, other KPI data are selected in order to make the SDG targets quantitative. Therefore, a selection system was developed (Figure 2) to select the optimal SDG coastal KPIs for the purpose of the SDG targets, which preferably meet four selection criteria: availability, relevancy, accuracy, and measurability. The selection criteria as presented in Figure 2 are:
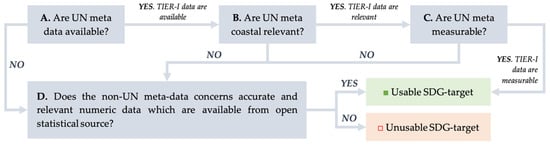
Figure 2.
Selection of the SDG coastal Key Performance Indicators (KPIs) using a four-step flowchart. Each of the four steps A-D are further explained in Section 2.5.
- UN metadata available [57]. The SDG targets are selected based on the criterion A: Are UN Tier 1 metadata available? If available, go to step B; if not available, go to step D.
- Are UN metadata relevant to coastal resilience solutions and effective adaptation strategies of the coastal infrastructure [71]? The SDG targets are selected based on the following criterion B: Is there a relationship with the coastal relevancy? If relevant, go to step C; if not relevant, go to step D.
- Are UN metadata measurable in terms of an easy-to-estimate parameter [67]? The SDG targets are selected based on the following criteria: C: What is the specificity of the indicator for coastal assessment; Does the “specificity of the indicator” relate to its measurability in terms of an easy-to-score parameter? If measurable, go for use as target; if not measurable, go to step D.
- Do the non-UN metadata concern accurate and relevant numeric data which are available from official statistical sources [11]? The SDG targets are selected based on the following criterion: D: Are accurate, relevant numeric data available from official statistical sources? If available, go for usable target; if not available, they are not usable for the target.
2.6. Assessment of SDG-KPI Numeric Data (Step IV)
Step IV applies the framework to five coastline cases and five sand nourishment cases (Table 1). The input for the SDG-SIS assessment analysis (Step IV) originates from numeric data on SDG-KPIs and consists of coastal relevant SDG targets (Step II) and appropriate KPIs (Step III).
The outcome of the assessment is expressed as the Sustainability Impact Score (SIS), which is presented in percentages and compared with the “no impact” SIS value, a fictive benchmark representing the ideal and most sustainable state of a coastline or sand nourishment case.
- The total sum of the individual SDG-KPI outcomes represents the SIS. In this study, 12 SDG-KPIs are selected (Step III) for the assessment. This range of individual SDG-KPI (in formula: KPI) can be divided into two different sub-values, respectively, SISa and SISb.
- SISa entails the sum of SDG-KPI outcomes that represent a positive impact towards the SIS—for example, renewable energy (SDG 7.2) with KPI expressed in percentage renewable electricity share of total electricity output. Each of the individual outcomes are linearly standardized on a scale of 0–100 percent, which is generated using the individual KPI outcome divided by the best-scoring KPI. For the SISa values, the KPImax must be used.
- SISb entails the sum of SDG-KPI outcomes that represent a negative impact towards the SIS—for example, CO2 emission reduction (SDG 9.4) with KPI expressed in CO2 emissions per capita. For SISb, the lowest-scoring KPI (KPImin) is used to linearly standardize the individual KPI outcome. Moreover, the SISb values are converted with a reciprocal value of 1. The output correlation variables from the comprehensive results can be compared with the SDG-KPIs of the no-impact benchmark coast.
2.7. Statistical Analysis
ANalysis Of VAriance (ANOVA) is used to test differences between the group means for SDG target indicators within the coastal case study. The real value data are transformed to percentages. Relationships between the variables that describe the indicators are assessed using Pearson’s rank correlation.
3. Results
3.1. Selection of Coastal Locations
The two sets of cases (Figure 3) are selected based on biophysical characteristics. This results in: (A) cases with varying coastal geology and (B) cases with one coastal geology.
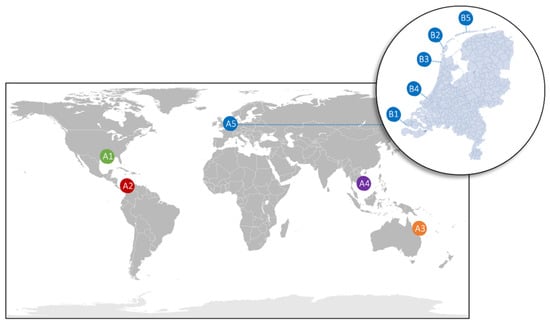
Figure 3.
Coastal infrastructures have been selected based on biophysical characteristics of coastlines. Respectively, Coastlines with a varying geology: (A1) Louisiana/CLG; (A2) Colombia/CCC; (A3) Australia/CQP; (A4) Vietnam/CVM; and (A5) The Netherlands/CNN; Coastline cases with one geology in the Netherlands: (B1) Domburg/CNZ; (B2) Texel/CNT; (B3) Callantsoog/CNC; (B4) Delfland/CNH and (B5) Ameland Inlet/CNA.
- Five cases, including coastlines with different geologies, were selected: (A1) Mississippi Delta of Louisiana, United States of America, (A2) Caribbean Delta of Colombia, (A3) South Pacific Ocean, Queensland, Australia, (A4) East Sea Mekong Delta, Vietnam, and (A5) North Sea Delta of The Netherlands.
- Five cases, including NBS sand nourishment projects within the North Sea region in Netherlands, were selected, representing the set with the same geology: (B1) beach nourishments Domburg and (B2) Texel, (B3) combination of shoreface-beach nourishment Callantsoog, (B4) sand motor nourishment Delfland, and (B5) system nourishment Ameland Inlet.
Table 3 provides an overview of the selected cases on natural coastal defense structures and the NBS sand nourishment structures. In Appendix A, Table A1, a brief overview of the coastal flood defense cases is presented, as well as the management goals, type of coastal infrastructure, coastal climate change adaptation measures, and flood protection [72].
Table 3.
Overview and description of the two sets of cases and their coastal system characteristics used for the sustainability assessment. The table identifies the geographical location; coastal types; type of coastal flood protection and type and size (in situ m3) nourishment. Case studies are divided into two sets, global coastlines (set 1) and sand nourishments (set 2).
3.2. Definition of Functionalities (Step I)
The six identified relevant functionalities represent the features of the coastal system focusing on biophysical characteristics, human pressures, preconditions of coasts, and ecosystem services. The functionalities which have been connected to the five coastline cases (Table 4) consider the relevance of the functionalities towards the selected cases based on expert judgement. The five sand nourishment cases are covered in the coastline case “North Sea Delta of The Netherlands; North Sea (CNN)”.
Table 4.
Consideration of relevance of the functionalities for the five coastline cases. Abbreviations: Mississippi delta of Louisiana USA; Gulf of Mexico (CLG); Caribbean delta of Colombia; Caribbean Sea & Pacific Ocean (CCC), Mekong delta of Vietnam; East Sea (CVM), Coast of Queensland, Australia; South Pacific, Ocean (CQP), North Sea delta of The Netherlands; North Sea (CNN). Legend: 0 = no level of relevance on the service; ▽ = low level of relevance on the service; ▲ = high level of relevance on the service; * The sand nourishment cases are covered in the coastline case CNN.
3.3. Consideration of SDG Targets (Step II)
Table 5 shows the selection of 38 out of 169 SDG targets presented in the heat map. Based on expert judgement, SDG targets are selected that link to coastal functionalities. Appendix B, Table A2 shows the selection and description of the 38 SDG targets. The targets are, respectively: 1.5 (Disaster resilience), 3.9 (Pollutions and contamination), 3.d (Early warning & risk reduction), 6.3 (Water pollution), 6.6 (Water quantity and quality), 7.2 (Renewable energy), 7.3 (Energy efficiency), 8.2 (Economic productivity), 8.4 (Resource efficiency), 8.9 (Sustainable tourism), 9.1 (Resilient infrastructure), 9.4 (CO2 Emission Reduction), 9.5 (Knowledge and innovation), 11.3 (Inclusive urbanization), 11.5 (Disaster risk reduction), 11.6 (Air quality), 11.a (Development planning), 11.b (Holistic disaster risk management), 12.2 (Natural resources), 12.7 (Procurement practices), 12.8 (Flood awareness), 12.b (Monitor sustainable development), 12.c (Phasing out harmful subsidies), 13.1 (Resilience and adaptive capacity), 13.2 (Coastal erosion/accretion), 13.3 (Climate education), 13.b (Effective planning), 14.1 (Marine pollution), 14.2 (Biodiversity abundance), 14.3 (Ocean acidification), 14.4 (Sustainable fishing), 14.5 (Coastal marine conservation), 14.7 (Small island developing), 14.a (Marine technology), 14.c (Ocean conservation), 15.8 (Prevention of invasive alien species), 16.7 (Institutional capacity), 17.17 (Public–private partnerships).
Table 5.
Consideration of the SDG targets (Step II) presented in heat map based on individual SDG target relations with coastal functionalities. In total, 169 SDG targets are considered and a total of 38 SDG targets are scored. The coastal functionalities are: (A) Serving coastal ecosystems to reduce flood frequency; (B) Serving socioeconomic inclusive growth; (C) Valuating biodiversity and ecosystem; (D) Regulating emission reduction; (E) Controlling coastal flooding and erosion reduction and (F) Serving wellbeing of humans. ■ = link between functionality and target; ■ = indirect or uncertain link between functionality and target; ■ = no link between functionality and target; (*) = SDG target and selected indicator used for the SDG-SIS sustainability assessment.
3.4. Selection of the SDG Coastal KPIs (Step III)
The 38 SDG targets were verified using the selection criteria (see Section 2.5), resulting in 12 targets, respectively, 6.6, 7.2, 8.2, 8.9, 9.4, 9.5, 11.5, 11.6, 12.8, 13.2, 14.2, 16.7, with cross-links between the SDG targets (Appendix C, Table A3). This means that 26 SDGs (1.5, 3.9, 3.d, 6.3, 7.3, 8.4, 9.1, 11.3, 11.a, 11.b, 12.2, 12.7, 12.b, 12.c, 13.1, 13.3, 13.b, 14.1, 14.3, 14.4, 14.5, 14.7, 14.a, 14.c, 15.8, 17.17) were not selected since they did not meet the four decision criteria outlined in Figure 2. While some of the excluded possess a strong relation between functionality and SDG targets, the lack of numeric quantifiable data excludes them from selection in this exercise.
Synergies exist between four groups of the selected SDG targets, namely 1(a) between, respectively, disaster resilience (SDG1.5), 1(b) holistic disaster risk management (SDG11.b), 1(c) resilience and adaptive capacity (SDG13.1), and 1(d) disaster risk reduction (SDG 11.5). Similarly, between the SDG targets, 2(a) water pollution (SDG6.3), 2(b) water quantity and quality (SDG6.6), and 2(c) marine pollution (SDG14.1), between 3(a) biodiversity abundance (SDG14.2) and 3(b) coastal marine conservation (SDG14.5) as well as between 4(a) flood awareness (SDG 12.8), 4(b) effective planning (SDG13.b), and 4(c) climate education (SDG 13.3). Therefore, due to these synergies, the SDG targets 1.5, 6.3, 11.b, 13.1, 13.3, 13.d, 14.1, and 14.5 were not incorporated into the SDG-SIS framework analysis as presented in Appendix C, Table A3.
Additionally, SDG 8, 9, and 11 are represented twice by, respectively, economic productivity (SDG8.2) and sustainable tourism (SDG 8.9); CO2 emission reduction (SDG 9.4) and knowledge and innovation (SDG9.5); disaster risk reduction (SDG11.5) and air quality (SDG11.6). These double-represented SDGs may give certain coastal services more emphasis; however, this is not considered overlap. Identification of synergies which may bias and overweight certain factors in the assessment can be considered double counting; therefore, overlap is undesirable and not recommended when implementing this framework. Besides synergies between SDG targets and double scoring of SDGs, there are also missing data for relevant SDG targets. For the sand nourishment cases, the data for SDG7.2 (renewable energy) are missing in terms of reliable actual data.
In Table 6, an overview is presented of 12 selected out of the 38 relevant identified coastal SDG targets which prove to be connectable to relevant, accurate metadata and available and measurable KPI. The consideration involves explicitly linking relevant SDG targets to relevant coastal KPIs. Six selected SDG-KPIs are directly recommended by UN Tier 1 expert group IAEG-SDGs [57,84]. This study uses open source metadata derived from international organizations, respectively, World Bank, Ocean Health Index, The Global Economy, United Nations Office for Disaster Risk Reduction, World Economic Forum, World Health Organization, Rijkswaterstaat, and Deltares.
Table 6.
Overview of Step III, the selected 12 coastal SDG-KPIs applied for global coastlines and sand nourishment cases; for applying in the coastal defense assessment with connectivity to the SDG targets 6.6, 7.2, 8.2, 8.9, 9.4, 9.5, 11.5, 11.6, 12.8, 13.2, 14.2, 16.7.
3.5. SDG Assessment of Coastline Sustainability (Step IV)
In this section, the SDG assessment of international coastline cases is presented. In the next section, the SDG assessment of sand nourishment cases is presented.
The coastal flood protection cases have been assessed based on the coastal numeric data presented in Appendix D, Table A4 (Step IV). Figure 4 presents the calculated SIS of the five coastal cases. The cases of Colombia and Vietnam show the lowest values for, respectively, disaster risk reduction (SDG11.5), sustainable tourism (SDG8.9), knowledge and innovation (SDG9.5), CO2 emission reduction (SDG9.4), flood awareness (SDG12.8), and biodiversity abundance (SDG14.2) compared to the highest scores in the Netherlands, USA and Australia.
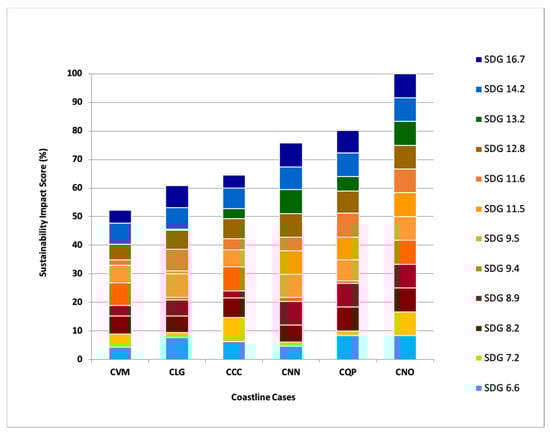
Figure 4.
The SIS for the five international coastline cases. Abbreviations: Mekong delta of Vietnam, East Sea (CVM); Mississippi delta of Louisiana USA; Gulf of Mexico (CLG); Caribbean delta of Colombia; Caribbean Sea & Pacific Ocean (CCC); North Sea delta of The Netherlands; North Sea (CNN); Coast of Queensland, Australia; South Pacific Ocean (CQP); No impact benchmark coast (CNO).
SDG 11.6 assessment of air quality shows the lowest PM2.5 concentrations in Australia and USA, and high concentrations PM2.5 in Vietnam 26.6 (µg/m3). The SDG 13.2 for coastal erosion shows for Caribbean delta of Colombia; Caribbean Sea & Pacific Ocean (CCC), Mekong delta of Vietnam, East Sea (CVM), and Mississippi delta of Louisiana USA; Gulf of Mexico (CLG) an erosion of the sandy shorelines change rate between −1.7 and −0.5 m (including measures) per year average based on Google Earth Engine analyses [98].
Figure 4 presents the SIS of the coastline cases. Results show that the cumulative consequences were the highest for Coast of Queensland, Australia; South Pacific Ocean (CQP). With the effectiveness of multiple targets, it is essential to understand and manage the complexities of a specific study area. Therefore, the results for CVM show that selected SDG targets could be used to enhance the environmental, social, and economic effects of the proposed regional coastal plans.
Figure 5 shows a boxplot comparison of SDG target indicators for the international coastline cases. The boxplots indicate various ranges within each SDG target variable. It demonstrates a high degree of distinction—based on wide data scatter—for the factors affecting sustainability for SDGs, respectively, water quantity and quality (SDG6.6), renewable energy (SDG7.2), sustainable tourism (SDG8.9), CO2 emission reduction (SDG9.4), air quality (SDG11.6), and coastal erosion/accretion (SDG13.2). The ANOVA of the SDG target indicators for the coastline cases (p < 0.05) indicated significant differences between renewable energy (SDG7.2), CO2 emission reduction (SDG9.4), knowledge and innovation (SDG9.5), air quality (SDG11.6), coastal erosion/accretion (SDG13.2), and biodiversity abundance (SDG14.2). The size of the boxes for flood awareness (SDG12.8) and biodiversity abundance (SDG14.2) indicates a minimum distinction between the cases. Statistical analyses of the SDG targets showed a moderate Pearson’s rank correlation coefficient of >0.7 (p > 0.05) for renewable energy (SDG7.2), CO2 emission reduction (SDG9.4), sustainable tourism (SDG8.9), air quality (SDG11.6), and institutional capacity (SDG16.7).
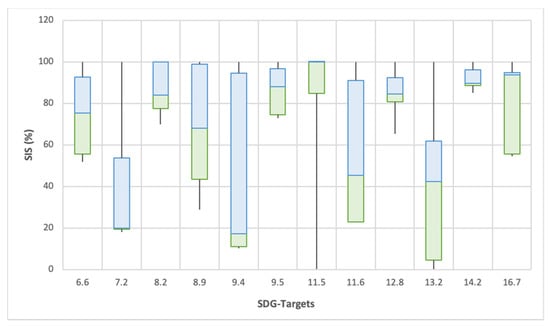
Figure 5.
Boxplot comparison of the selected SDG target indicators for the five international coastline cases (see Figure 2) on socioeconomic and environmental benefits (n = 60). Statistical methods are reported in Section 2.7.
3.6. SDG Assessment of Sand Nourishment Cases (Step IV)
The sand nourishment cases have been assessed based on the coastal numeric data required from Appendix E, Table A5. Figure 6 presents the SIS of the five sand nourishment cases. Results show a similar SIS for the five cases. The fictive no impact benchmark serves as optimum SIS regarding the success or failure of policy implications. The cases of Delfland (CNH) and Ameland (CNA) show the difference for, respectively, water quantity and quality (SDG6.6), sustainable tourism (SDG8.9), knowledge and innovation (SDG9.5), and coastal erosion/accretion (SDG13.2) (Figure 6). The relation of economic productivity (SDG8.2) with the cases Texel (CNT) with high value for job market per cubic meter nourishment and the large differences between the cases CNA and CNT are noteworthy. It is not surprising that the cases CNT and CNZ show high values for sustainable tourism (SDG8.9), due to greater beach capacity available to be used by tourists. Economic productivity (SDG8.2) shows the highest value for the beach nourishment of CNT at EUR 1.2 per cubic meter. The costs associated with a cubic meter of sand, with a certain nourishment technique and fuel costs, are relevant factors to compare different nourishment strategies.
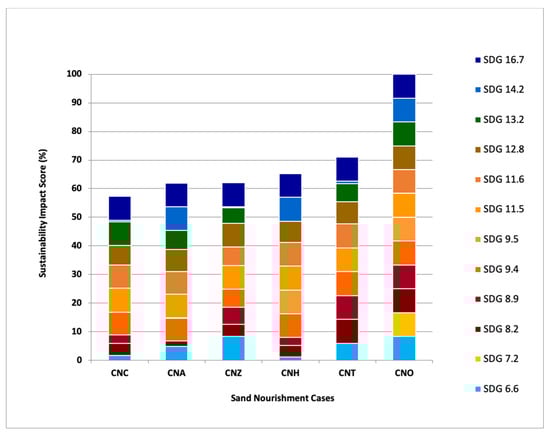
Figure 6.
The SIS values for five sand nourishment cases situated in the Netherlands. Abbreviations: Callantsoog (CNC); Ameland Inlet Pilot (CNA); Domburg (CNZ); Delfland Sand Motor Pilot (CNH); Texel (CNT) and the no impact nourishment benchmark (CNO).
When comparing the case CNT with the cases CNZ and CNC, the subset CNZ scores low for air quality (SDG11.6) due to high levels of PM10. However, case CNH scores low on mean particulate matter PM10 per cubic meter nourishment. The cases CNH and CNA show different scores for coastal erosion/accretion (SDG13.2). Biodiversity abundance (SDG14.2) shows that a relatively high impact on the disrupted sea floor exists for nourishments CNC and CNZ. Institutional capacity (SDG16.7) shows equal relationship values.
Figure 7 shows the boxplot of SDG-KPIs for five sand nourishment cases. It demonstrates a distinction for SDGs, respectively, for water quantity (SDG6.6), economic productivity (SDG8.2), sustainable tourism (SDG8.9), coastal erosion/accretion (SDG13.2), and biodiversity abundance (SDG14.2). Flood awareness (SDG12.8) is not very distinctive between the five sand nourishment case studies. The ANOVA of the SDG-KPIs (p < 0.05) indicated significant differences between the targets: economic productivity (SDG8.2), knowledge and innovation (SDG9.5), and biodiversity abundance (SDG14.2). The statistical analyses of the relationships between the SDG targets showed a moderate Pearson’s rank correlation coefficient for seven indicators of >0.9 (p = 0.12), respectively, for water quantity and quality (SDG6.6), economic productivity (SDG8.2), CO2 emission reduction (SDG9.4), knowledge and innovation (SDG9.5), air quality (SDG11.6), flood awareness (SDG12.8), and coastal erosion/accretion (SDG13.2).
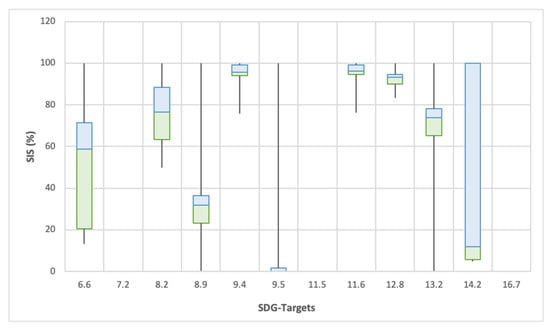
Figure 7.
Boxplot comparison of the selected SDG target indicators for the five sand nourishment cases in the Netherlands (see Figure 4) on socioeconomic and environmental benefits (n = 53). Statistical methods are reported in Section 2.7.
4. Discussion
4.1. SDG-SIS Framework
The aim of this study is to tailor the SDGs, as a universally recognized policy framework, to assess the sustainability performance for coastal flood protection management to enhance climate-resilient and adaptable coastal development. The results of a literature review [9,10,23,25,26,27,28,32,33,34,36,40,41,42,43,44,45,46] showed a wide range of technical and management adaptation measures towards climate adaption within coastal flood protection management. Some coastal adaptation measures have the potential to play a role in sustainable coastal management, e.g., NBS. However, identification of indicators that are practical for assessing coastal development and monitoring the progress of sustainability is required. Several studies consider the impact of integrated socioeconomic, governance, and environmental aspects of sustainability in coastal management. Several studies [12,37,42,43,44,54,59,61,62] discuss the use of SDGs to encourage the development of resilient coastal communities with an effective set of specific targets. SDG assessment models are useful and necessary to identify synergies or support the science–policy interface of SDGs [14,61,62,103,104]. The analysis of this SDG-SIS framework in comparison to other assessment frameworks (Table 2) indicates a limited connection between system functionalities and SDG targets with relevant measurable indicators to tailor the SDGs [54,105]. Moreover, a comprehensive and quantitative assessment with a focus on coastal flood management and SDG targets is missing. The SDG-SIS framework applies a wide variety of SDG targets in coastal regions, thereby underpinning the different geographical characteristics, ecosystem services, socioeconomic development, and functionalities.
Within the SDG-SIS framework, two different sets of cases were presented, a set of five international coastlines and a set of five sand nourishments in the Netherlands. These two sets were chosen to create noteworthy discussions about the applicability of the assessment SDG-SIS framework. The scope of the assessment determines the integrated choice for SDG targets. A set of SDG-KPIs for comparison on coastline level is therefore not simply the same as an assessment for comparison of sand nourishment cases. In the presented approach, one set of functionalities is used for both sets of cases (Step I). Both sets of geographical and coastal policy applications preferably require different considerations of functionalities. This suggests a need for the selection of highly relevant functionalities to avoid a misinterpretation of SDG targets, resulting in a low level of distinction. This results in two separate and different considerations of SDG targets (Step II). However, only one heat map for both the coastlines and sand nourishment cases was considered.
Comparing the five coastlines shows the development of equal initiatives to assess the socioeconomic, governance, and environmental implications with SDG targets. When selecting SDG targets through this framework, it is of note that countries with varying cultural values and a disparity in wealth characteristics may generate different relevant subsets of SDG targets. This, in combination with different principles and legislations among nations, shows the potential to prioritize SDG targets at a country policy level. Based on two separate sets of cases, namely coastline cases with different biophysical characteristics and sand nourishment cases with similar biophysical characteristics, the results indicate that the geographical scope may impact the final set of SDG-KPIs used in the assessment. A small geographical scope results in a detailed SIS but also requires specific data which are often not (yet) publicly available.
4.2. Consideration of SDGs
In this study, SDGs 2, 4, 5, and 10 are not incorporated since they did not meet the criteria for coastal-related functionalities (see Section 2.3). However, demonstrated are the coastal potential trade-offs between the SDGs in light of poverty reduction and between economic growth and environmental integrity [62]. In the end, 38 relevant coastal SDG targets were selected based on coastal functionalities. The lack of subsequent correlation of SDGs to useful public data reduced the 38 targets to 12 SDG targets, connected to useful KPIs. The consequence of leaving out 26 SDG targets is essential for the assessment; however, synergies exist for eight SDG targets, namely 1.5 (disaster resilience), 6.3 (water quality and quality), 11.b (holistic disaster risk management), 13.1 (resilience and adaptive capacity), 13.3 (climate education), 13.b (effective planning), 14.1 (marine pollution), and 14.5 (coastal marine conservation). The consequence of missing the relevant targets may have implications for the inclusiveness of the assessment. Therefore, the final set of SDG targets requires critical consideration. The potential to develop a more inclusive coastal strategy can be pursued by focusing on the availability and accessibility of data, to enhance climate-resilient and adaptable coastal management as leverage to achieve the relevant SDG targets.
4.2.1. SIS for Coastline Cases
The moderately high cumulative sustainability performance of Colombia is interesting, as it is the second lowest score compared to Vietnam (Figure 3). This can be explained mainly by the substantial green energy production (SDG7.2) of Colombia and the lower number of deaths, missing and directly affected persons due to disasters (SDG11.5) [40].
Within the group of higher scoring cases, the high levels of air emissions for the case of the Netherlands, and therefore the low sustainability performance for air quality (SDG11.6), is remarkable. This could be attributable to extensive port and industry activities condensed in the coastal region, although air quality has improved due to the implementation of environmental legislations (11.6) [106]. The low coastal erosion rate in this case results in the high sustainability performance for coastal erosion/accretion SDG13.2. The most likely explanation for the relatively high ranking is the large investments in intensive adaptation measures along the Dutch coastline [107].
The overall highest scoring case is Queensland. This case shows potential to improve its sustainability performance by investing in a higher contribution of renewable energy (SDG7.2) and reducing the emission of CO2 (SDG9.4) as well as concentrating on decreasing coastal erosion (SDG13.2).
Remarkable is the fact that the three highest scoring cases, CNN, CQP, and CLG—representing the most prosperous of the three cases—present the highest emission rates of CO2 and therefore demonstrate low sustainability performance for CO2 emission reduction (SDG9.4). This outcome pledges a stricter policy on emissions of CO2 in economically strong countries. In addition, it indicates that the cumulative SIS is rather unbalanced due to the high SIS and, at the same time, high emission rates of CO2.
4.2.2. SIS for Sand Nourishment Cases
Interestingly, CO2 emissions (SDG9.4) show relatively high concentrations of CO2 emissions/per cubic meter sand for the sand nourishment case CNZ and the lowest concentration of CO2 per cubic meter of sand for the case CNT. This disparity in nourishments can be attributed to the fact that nourishment strategies require different pumping activities, resulting in higher emissions. This indicates that SDG 9.4 is useful for the assessment of NBS, triggering CO2 emission reduction of flood defense coast maintenance solutions, included in the current Dutch Coastal Maintenance Program (Kustlijnzorg).
The cumulative SIS shows little variation between the five sand nourishment cases. There is a relation between missing data and the degree of distinction. Firstly, due to missing data (SDG 7.2, 8.2, 9.5, 11.5), cumulative SIS (data not shown) does not give an accurate and representative presentation. The next discussion section presents the importance of data availability for accurate interpretation of assessment outcomes to serve useful decision-making. Secondly, the sand nourishment cases show, for a few SDG targets, a high degree of distinction (Figure 7): these are water quantity and quality (SDG6.6), economic productivity (SDG8.2), sustainable tourism (SDG8.9), coastal erosion/accretion (SDG13.2), and biodiversity abundance (SDG14.2). This indicates that individual SDG target scores present valuable information, although not in terms of sustainability impact but as separate sustainability criteria.
4.3. Data Availability for Interpretation and Decision-Making
This study proves that for the presented SDG-SIS assessment method of the cases, there is a lack of publicly available numeric data, as only a limited number of SDG targets have a meaningful set of metadata (KPI). This may be a potential pitfall of interpretation and can lead to different conclusions about performances [108]. However, for the 12 applied SDG targets, sufficient publicly available data relating to the KPIs were found; with further adoption and understanding of such approaches, it is possible to increase the awareness of such KPIs, leading to potential monitoring and increased accessibility. When detecting data gaps in nourishment cases within SDG targets (e.g., SDG 8.2), the median should be used in order to achieve a cumulative set of SDGs. Applying SDG frameworks requires data availability for this form of quantitative and statistical analysis [60].
In total, 38 relevant SDG targets were selected for sustainable coast development; however, only 12 related indicators were weighted and aggregated to provide the SIS value as overall index. Data availability of KPIs and their causality with the targets is essential for an integral analysis and comparison. This, in turn, effectively renders 26 targets unusable, incurring the risk of losing the integral selection. Missing SDG targets has policy consequences as it can enhance the efficacy of strategies for the improvement of SDG-related indicators and encompassing integrated strategies for sustainable flood management.
The minor differences in the level of sustainability between the sand nourishment cases further highlight the importance of data accuracy and availability as it is essential to ensure the distinctiveness of the targets. In the coastline cases, six IAEG Tier 1 selected SDG-KPIs are recommended. However, for the sand nourishment cases, none of the selected KPIs were available. This observation indicates the need for accurate data for regional NBS analyses to achieve greater distinction. Additionally, it implies a need for universal data for global analyses to be able to make interoperable comparisons.
4.4. Multiple Modes of Assessment Applicability
To integrate the coastal SDGs in a relevant, measurable, and manageable way, the SDG-SIS framework is useful for the intrinsic achievement of the SDGs by policymakers and other stakeholders. The development of a systematic SDG target assessment framework, as presented in the study, showcases its potential application in different short- and long-term development pathways. Multiple trajectories can be assessed, including the analysis of the current status, evaluating measures required to reach mid-term results for sustainable deltas and socioeconomic growth and addressing visions to develop strategies for long-term results. This indicates the possibility of adaptation pathways to provide a systematic way to determine the level of sustainability to realize suitable management actions [109], allowing a multiple-time perspective on the sustainability impact in the current, mid-, and long-term future.
4.5. Coastal Flood Protection Management in an Adaptable Manner
Applying the SDG targets in the SDG-SIS framework may aid in a higher number and more uniform format of metric reporting and disclosure [110]. Countries should be stimulated by global policy directives to implement solutions with low environmental impact and reduce emissions, with incentives to support sustainable flood protection management. The crucial role of flood defense and coastal sustainability in the SDG-SIS framework supports interaction and prioritization by interpreting the outputs according to the UN 2030 Agenda. Moreover, it contextualizes the objectives within the science–policy dialogue in future perspectives of asset management towards climate resilience and adaptation.
NBS have been actively promoted by the European Commission to restore degraded ecosystems in order to secure the long-term availability of water resources and benefits from aquatic and marine ecosystems [111,112]. Transnational evidence is needed to justify investments and optimize the effectiveness of NBS. The SDG targets may be useful for regional changes in climatic parameters such as sea-level rise and also in linking the EU Strategy on Adaptation to Climate Change to make Europe more climate-resilient and to the EU Flood Directive to assess if coastlines are at risk from flooding [113,114,115,116,117].
5. Conclusions
The aim of this study is to tailor the SDGs, as a universally recognized policy framework, to assess the sustainability performance for coastal flood protection management to enhance climate-resilient and adaptable coastal development. Therefore, the SDG-SIS (Sustainability Impact Score) framework is developed to illustrate how SDGs may be connected to a relevant set of KPIs based on a geographical setting and a characterized policy topic. The SDG-SIS framework was applied on two sets of coastal cases, one distinguished by varying biophysical characteristics and one based on similar biophysical characteristics. There are five main points of conclusion that can be derived from this study. This study concludes that:
- The SDG-SIS methodology relied on chosen functionalities; the selected SDG targets and corresponding KPIs facilitate measurement of the progress towards climate resilient coastal protection. Moreover, the SDG-SIS framework is able to systematically consider SDG targets to support an integrated assessment of coastal sustainability. Moreover, it is illustrated that the complexities in geographical and socioeconomic characteristics may influence the selection of SDG targets.
- The connection between SDG targets and KPIs makes it possible to quantitatively and specifically measure the SDGs, resulting in the SDG-SIS for coastal flood protection management to enhance climate-resilient and adaptable coastal development. Consideration of coastal system features including ecosystem functionalities resulted in the selection of 38 out of the 169 SDG targets. Taking into account the two sets of cases—respectively, a set global coastlines and sand nourishments in the Netherlands—not all 38 targets were able to be connected with KPIs. In this study, indicator selection is dependent on the availability of public numeric data, resulting in an assessment of the case studies with only 12 SDG targets out of selected 36 SDG targets, respectively: 6.6 (water quantity and quality), 7.2 (renewable energy), 8.2 (economic productivity), 8.9 (sustainable tourism), 9.4 (CO2 emission reduction), 9.5 (knowledge and innovation), 11.5 (disaster risk reduction), 11.6 (air quality), 12.8 (flood awareness), 13.2 (coastal erosion/accretion), 14.2 (biodiversity abundance), 16.7 (institutional capacity).
- The crucial role of adequate and specific data is demonstrated as a boundary condition for identifying priorities on early action in order to achieve the SDGs. In this study, open source metadata derived from international agencies prove to be suitable to serve as SDG-KPI. Missing SDG targets can enhance the efficacy of strategies for the improvement of SDG-related indicators and encompassing integrated strategies for sustainable flood protection management. As shown by the minor differences in the level of sustainability between the examined case studies, accurate and available data are essential to ensure a reliable level of distinctiveness of the SDG-KPIs to be able to make valuable interpretations.
- The five NBS sand nourishment cases show a relatively small number of SDG-KPIs which turn out to be valuable for application as SIS. However, individual SDG target scores may be useful as separate SDG criteria, although not in terms of SIS. The available SDG-KPI data of the five global cases perform for some coastlines a low SIS, which indicates a weak climate-resilient and adaptable coastline. However, the SIS can be rather unbalanced due to the high SIS and at the same time, e.g., high emission rates of CO2 for some coastline cases. This concludes that for an individual SDG target, outcomes are crucial to reveal the details of appropriate interpretation of climate-resilient and adaptable coastlines. Therefore, cross-linking cumulative consequences do not directly or definitively indicate the level of sustainability. This denotes the importance of prioritizing SDGs to serve as an instrument for policymakers to optimize the climate robustness of coasts.
- The SDG-SIS framework proves to be flexible in benchmarking progress against defined thresholds which denote the achievement of SDGs. The framework supports coastal policy by addressing long-term measures and providing a sustainable vision for future implementation. The SDG-SIS framework is a starting point for discussions on integrated policy since it shows that a set of indicators can be successfully applied to assess flood protection management, rendering it applicable on a global or regional scale for coherent integrated policymaking across sectors to enhance climate-resilient and adaptive management. Moreover, the SDG-SIS framework proves to be flexibly applicable, provided there are accurate data, for other policy domains such as asset management.
To further develop the SDG-SIS framework it is recommended to apply the framework in practice. This implies the application of coastal-related SDG targets to initiate cli-mate-resilient and adaptive policies in global and regional flood protection management.
Author Contributions
Conceptualization, C.A.S. and G.G.J.D.; methodology, C.A.S., G.G.J.D. and B.d.V.; formal analysis, C.A.S. and G.G.J.D.; investigation C.A.S., G.G.J.D. and B.d.V.; writing—original draft preparation, C.A.S. and G.G.J.D.; writing—review and editing, C.A.S., G.G.J.D., B.d.V., B.B. and Q.L. All authors have read and agreed to the published version of the manuscript.
Funding
This research received no external funding.
Institutional Review Board Statement
Not applicable.
Informed Consent Statement
Not applicable.
Data Availability Statement
Data available in a publicly accessible repository. The data presented in this study are openly available in Appendix D; Table A4 and Appendix E; Table A5.
Acknowledgments
This paper benefited greatly from discussions evaluating the sustainable measures with RWS colleagues in project Coastal Genesis and EU Interreg Building with Nature and EU Interreg Cluster for Cloud to Coast Climate Change adaptation (C5a). We are grateful to Arjen Luijendijk (Deltares) for making the shorelines erosion Google Earth Engine calculations of the case studies. Moreover, many thanks for Evelien Brand (RWS) for advising with the statistical calculations. We would like to thank the collegial reviewers Alex Ziemba (Deltares and TU Delft), Heleen Vreugdenhil (Deltares and TU Delft), and Egon Baldal (RWS) as well as the external reviewers for their time devoted to this manuscript since we feel their comments helped to improve the quality of the manuscript.
Conflicts of Interest
The authors declare no conflict of interest.
Appendix A
Table A1.
Description of two sets of cases, respectively, five coastline cases and five sand nourishment cases in the Netherlands with background information on coastal activities, climate change, and type of coastal infrastructure. Abbreviations: Mississippi delta of Louisiana USA; Gulf of Mexico (CLG); Caribbean delta of Colombia; Caribbean Sea & Pacific Ocean (CCC), Mekong delta of Vietnam; East Sea (CVM), Coast of Queensland, Australia; South Pacific, Ocean (CQP), North Sea delta of The Netherlands; North Sea (CNN), Sand Motor Pilot (CNH), Ameland Inlet Pilot (CNA), Callantsoog (CNC); Domburg (CNZ), Delfland Texel (CNT).
| Coastal Services | CLG | CCC | CVM | CQP | CNN | CNH | CNA | CNC | CNZ | CNT |
|---|---|---|---|---|---|---|---|---|---|---|
| Coastal area | Mississippi Delta in Louisiana Gulf of Mexico | Caribbean Delta of Colombia | Vietnam Mekong Delta | Queensland Pacific | North Sea coast in The Netherlands | Netherlands, Delfland nourishment | Netherlands, Ameland Inlet nourishment | Netherlands, Callantsoog nourishment | Netherlands, Domburg nourishment | Netherlands, Texel nourishment |
| Metropolis in coastal area | New Orleans | Cartagena, Barranquilla | Ho Chi Min City | Brisbane | Cadzand-Den Helder | The Hague | Small villages | Small villages | Small villages | Small villages |
| Coastal inhabitants * 1000 [118] | 4.684 | 9.746 | 17.510 | 4.165 | 8.219 | 515 | 3.7 | 2.4 | 106.5 | 13.6 |
| Amount of people per km2 | 35 | 73 | 318 | 12 | 504 | 6.344 | 58 | 96 | 147 | 86 |
| City population in coastal area (inhabitants * 1000) for years 2010 & 2025 [119] | (1.167) 1.224 | (950); Nd | (6.166); 9.662 | (2.044); 2.694 | (6.999); 7.285 | Nd | Nd | Nd | Nd | Nd |
| Environmental- & climate protection plan (Table 2) | + (2017) | + (2017) | + (2013) | + (2018) | + (2013) | + (2010) | + (2013) | + (2013) | + (2013) | + (2013) |
| Coastal defense aim | Natural defenses and habitat | Protecting coastlines | Natural defenses; Mekong Delta Plan (MDP) has no formal status | Protecting coastlines | Protecting coastlines | Delta program Coast Innovation pilot; | Delta program Coast innovation pilot | Part of Delta program Coast | Part of Delta program Coast | Part of Delta program Coast |
| Marine Protection Areas (% of terr. waters) or N2000 or marine/coastal wetlands (RAMSAR) | 41.1 | 2.1 | 0.6/ RAMSAR | 40.7/ RAMSAR | 21.5/ N2000 | N2000 | N2000 | N2000 | N2000 | N2000 |
| Goal of long-term or Master Plans | Resilience | Resilience | Safe prosperous and sustainable delta | Management of coastal areas, vulnerable to erosion | Viable coast | Experiment | Experiment | Viable coast | Viable coast | Viable coast |
| Policy model climate change | Protection and adapting | “Dutch delta approach” | Socioeconomic planning | Cost-effective strategy management | Strategy for the coast | Aims set for pilot | Aims set for pilot | Strategy for the coast | Strategy for the coast | Strategy for the coast |
| Maritime transport or port activities | Not mentioned | National dredging plan | Not mentioned | Not mentioned | Not mentioned | Not mentioned | Not mentioned | Not mentioned | Not mentioned | Not mentioned |
| Strategy on climate regulation, adaptation to storms and river discharges | Restoration, protection, oyster | Integrated Coastal Zone Management (ICZM) | MDP risk by upstream developments | Need for adaptation to Climate Change (CC) | Flood safety with spatial plan | ICZM | ICZM | ICZM | ICZM | ICZM |
| Flood and coastal protection | Storm surge-based flood risk reduction | Application early warning system | Mekong Delta (MD) in top 5 deltas most affected by CC | - | Shoreface and beach nourishments | Sand motor Innovative concepts | System nourishment Innovative concepts | Shoreface and beach nourishments | Shoreface and beach nourishments | Shoreface and beach nourishments |
| Goal of urgency for action | Flood risk and hurricane disaster control | Safety of water production | Sustainability and safety | Coastal hazards for beaches | ICZM and innovation nourishments | Innovative and integrated solutions | Innovative and integrated solutions | ICZM and innovation nourishments | ICZM and innovation nourishments | ICZM and innovation nourishments |
Appendix B
Table A2.
Overview of the selected 38 coastline and sand nourishment SDG targets for applying in the SDG-SIS assessment framework. Respectively, with the SDG targets: 1.5 (Disaster resilience), 3.9 (Pollutions and contamination), 3.d (Early warning & risk reduction), 6.3 (water pollution), 6.6 (Water quantity and quality), 7.2 (Renewable energy), 7.3 (Energy efficiency), 8.2 (Economic productivity), 8.4 (Resource efficiency), 8.9 (Sustainable tourism), 9.1 (Resilient infrastructure), 9.4 (CO2 Emission Reduction), 9.5 (Knowledge and innovation), 11.3 (Inclusive urbanization), 11.5 (Disaster risk reduction), 11.6 (Air Quality), 11.a (Development planning), 11.b (Holistic disaster risk management), 12.2 (Natural resources), 12.7 (Procurement practices), 12.8 (Flood awareness), 12.b (Monitor sustainable development), 12.c (Phasing out harmful subsidies), 13.1 (Resilience and adaptive capacity), 13.2 (Coastal erosion/accretion), 13.3 (Improve climate education), 13.b (Effective planning), 14.1 (Reduce marine pollution), 14.2 (Biodiversity abundance), 14.3 (Ocean acidification), 14.4 (Sustainable fishing), 14.5 (Coastal marine conservation), 14.7 (Small island developing), 14.a (Marine technology), 14.c (Ocean conservation), 15.8 (Prevention of invasive alien species), 16.7 (Institutional capacity), 17.17 (Public–private partnerships).
| SDG Target | Goals and Targets from the 2030 Agenda for Sustainable Development [14] |
|---|---|
| 1.5 | By 2030, build the resilience of the poor and those in vulnerable situations and reduce their exposure and vulnerability to climate-related extreme events and other economic, social and environmental shocks and disasters. |
| 3.9 | By 2030, substantially reduce the number of deaths and illnesses from hazardous chemicals and air, water and soil pollution and contamination. |
| 3.d | Strengthen the capacity of all countries, in particular developing countries, for early warning, risk reduction and management of national and global health risks. |
| 6.3 | By 2030, improve water quality by reducing pollution, eliminating dumping and minimizing release of hazardous chemicals and materials, halving the proportion of untreated wastewater and substantially increasing recycling and safe reuse globally. |
| 6.6 | By 2020, protect and restore water-related ecosystems, including mountains, forests, wetlands, rivers, aquifers and lakes. |
| 7.2 | By 2030, increase substantially the share of renewable energy in the global energy mix. |
| 7.3 | By 2030, double the global rate of improvement in energy efficiency. |
| 8.2 | Achieve higher levels of economic productivity through diversification, technological upgrading and innovation, including through a focus on high-value added and labour-intensive sectors |
| 8.4 | Improve progressively, through 2030, global resource efficiency in consumption and production and endeavour to decouple economic growth from environmental degradation, in accordance with the 10-Year Framework of Programmes on Sustainable Consumption and Production, with developed countries taking the lead. |
| 8.9 | By 2030, devise and implement policies to promote sustainable tourism that creates jobs and promotes local culture and products. |
| 9.1 | Develop quality, reliable, sustainable and resilient infrastructure, including regional and transborder infrastructure, to support economic development and human well-being, with a focus on affordable and equitable access for all. |
| 9.4 | By 2030, upgrade infrastructure and retrofit industries to make them sustainable, with increased resource-use efficiency and greater adoption of clean and environmentally sound technologies and industrial processes, with all countries taking action in accordance with their respective capabilities. |
| 9.5 | Enhance scientific research, upgrade the technological capabilities of industrial sectors in all countries, in particular developing countries, including, by 2030, encouraging innovation and substantially increasing the number of research and development workers per 1 million people and public and private research and development spending. |
| 11.3 | By 2030, enhance inclusive and sustainable urbanization and capacity for participatory, integrated and sustainable human settlement planning and management in all countries. |
| 11.5 | By 2030, significantly reduce the number of deaths and the number of people affected and substantially decrease the direct economic losses relative to global gross domestic product caused by disasters, including water-related disasters, with a focus on protecting the poor and people in vulnerable situations. |
| 11.6 | By 2030, reduce the adverse per capita environmental impact of cities, including by paying special attention to air quality and municipal and other waste management. |
| 11.a | Support positive economic, social and environmental links between urban, peri-urban and rural areas by strengthening national and regional development planning. |
| 11.b | By 2020, substantially increase the number of cities and human settlements adopting and implementing integrated policies and plans towards inclusion, resource efficiency, mitigation and adaptation to climate change, resilience to disasters, and develop and implement, in line with the Sendai Framework for Disaster Risk Reduction 2015–2030, holistic disaster risk management at all levels. |
| 12.2 | By 2030, achieve the sustainable management and efficient use of natural resources. |
| 12.7 | Promote public procurement practices that are sustainable, in accordance with national policies and priorities. |
| 12.8 | By 2030, ensure that people everywhere have the relevant information and awareness for sustainable development and lifestyles in harmony with nature. |
| 12.b | Develop and implement tools to monitor sustainable development impacts for sustainable tourism that creates jobs and promotes local culture and products. |
| 12.c | Rationalize inefficient fossil-fuel subsidies that encourage wasteful consumption by removing market distortions, in accordance with national circumstances, including by restructuring taxation and phasing out those harmful subsidies, where they exist, to reflect their environmental impacts, taking fully into account the specific needs and conditions of developing countries and minimizing the possible adverse impacts on their development in a manner that protects the poor and the affected communities. |
| 13.1 | Strengthen resilience and adaptive capacity to climate-related hazards and natural disasters in all countries. |
| 13.2 | Integrate climate change measures into national policies, strategies and planning. |
| 13.3 | Improve education, awareness-raising and human and institutional capacity on climate change mitigation, adaptation, impact reduction and early warning. |
| 13.b | Promote mechanisms for raising capacity for effective climate change-related planning and management in least developed countries and small island developing States, including focusing on women, youth and local and marginalized communities. |
| 14.1 | By 2025, prevent and significantly reduce marine pollution of all kinds, in particular from land-based activities, including marine debris and nutrient pollution. |
| 14.2 | By 2020, sustainably manage and protect marine and coastal ecosystems to avoid significant adverse impacts, including by strengthening their resilience, and take action for their restoration in order to achieve healthy and productive oceans. |
| 14.3 | Minimize and address the impacts of ocean acidification, including through enhanced scientific cooperation at all levels. |
| 14.4 | By 2020, effectively regulate harvesting and end overfishing, illegal, unreported and unregulated fishing and destructive fishing practices and implement science-based management plans, in order to restore fish stocks in the shortest time feasible, at least to levels that can produce maximum sustainable yield as determined by their biological characteristics. |
| 14.5 | By 2020, conserve at least 10 per cent of coastal and marine areas, consistent with national and international law and based on the best available scientific information. |
| 14.7 | By 2030, increase the economic benefits to small island developing States and least developed countries from the sustainable use of marine resources, including through sustainable management of fisheries, aquaculture and tourism. |
| 14.a | Increase scientific knowledge, develop research capacity and transfer marine technology, taking into account the Intergovernmental Oceanographic Commission Criteria and Guidelines on the Transfer of Marine Technology, in order to improve ocean health and to enhance the contribution of marine biodiversity to the development of developing countries, in particular small island developing States and least developed countries. |
| 14.c | Enhance the conservation and sustainable use of oceans and their resources by implementing international law as reflected in the United Nations Convention on the Law of the Sea, which provides the legal framework for the conservation and sustainable use of oceans and their resources, as recalled in paragraph 158 of “The future we want” |
| 15.8 | By 2020, introduce measures to prevent the introduction and significantly reduce the impact of invasive alien species on land and water ecosystems and control or eradicate the priority species. |
| 16.7 | Ensure responsive, inclusive, participatory and representative decision-making at all levels. |
| 17.17 | Encourage and promote effective public, public–private and civil society partnerships, building on the experience and resourcing strategies of partnerships. |
Appendix C
Table A3.
Selection of the SDG-KPIs based on total of 38 SDG targets that will contribute to sustainable coastal functionalities (Step III). The SDG targets are selected based on the selection criteria: A: Are UN Tier 1 metadata available [57]? B: Is there a relationship with the coastal relevancy of list UN IAEG-SDGs? C: What is the specificity of the indicator for coastal assessment; Does the “specificity of the indicator” relate to its measurability in terms of an easy-to-score parameter? D: Are accurate and relevant numeric data available from official statistical sources? The questions A–D are answered for the coastline analysis. For the sand nourishment analysis, all SDGs use a different source to the UN except for target 11.5. ■ = useful SDG-KPI for SDG-SIS assessment; □ = SDG-KPI not useful SDG-SIS assessment; → B = Go to question B; → C = Go to question C; → D = Go to question D.
| Selection Criteria | |||||||||||
|---|---|---|---|---|---|---|---|---|---|---|---|
| Selected SDG Targets | Short Description | (A) Availability | (B) Relevancy | (C) Specificity | (D) Accuracy | Selected/ Not Selected | Motivation of Synergy | ||||
| YES | NO | YES | NO | YES | NO | YES | NO | ||||
| 1.5 | Disaster resilience | → B | → C | ■ | Not selected | Covered in 11.5 | |||||
| 3.9 | Pollutions and contamination | → B | → D | □ | Not selected | ||||||
| 3.d | Early warning & risk reduction | → B | → D | □ | Not selected | ||||||
| 6.3 | Water pollution | → B | → C | → D | ■ | Not selected | Covered in 6.6 | ||||
| 6.6 | Water quantity and quality | → B | → C | ■ | Selected | ||||||
| 7.2 | Renewable energy | → B | → C | ■ | Selected | ||||||
| 7.3 | Energy efficiency | → B | → D | → D | □ | Not selected | |||||
| 8.2 | Economic productivity | → B | → C | → D | ■ | Selected | double- SDG | ||||
| 8.4 | Resource efficiency | → D | □ | Not selected | |||||||
| 8.9 | Sustainable tourism | → D | ■ | Selected | double- SDG | ||||||
| 9.1 | Resilient infrastructure | → B | → D | □ | Not selected | ||||||
| 9.4 | CO2 emission reduction | → B | → C | → D | ■ | Selected | double- SDG | ||||
| 9.5 | Knowledge and innovation | → B | → D | ■ | Selected | double- SDG | |||||
| 11.3 | Inclusive urbanization | → D | □ | Not selected | |||||||
| 11.5 | Disaster risk reduction | → D | ■ | Selected | double- SDG | ||||||
| 11.6 | Air quality | → B | → C | ■ | Selected | double- SDG | |||||
| 11.a | Development planning | → D | □ | Not selected | |||||||
| 11.b | Holistic disaster risk management | → B | → C | → D | ■ | Not selected | covered in 11.5 | ||||
| 12.2 | Natural resources | → D | □ | Not selected | |||||||
| 12.7 | Sustainable procurement | → D | □ | Not selected | |||||||
| 12.8 | Flood awareness | → D | ■ | Selected | |||||||
| 12.b | Monitor sustainable development | → D | □ | Not selected | |||||||
| 12.c | Phasing out harmful subsidies | → D | □ | Not selected | |||||||
| 13.1 | Resilience and adaptive capacity | → B | → D | ■ | Not selected | covered in 11.5 | |||||
| 13.2 | Coastal erosion or accretion | → B | → D | ■ | Selected | ||||||
| 13.3 | Improve climate education | → B | → D | ■ | Not selected | covered in 12.8 | |||||
| 13.b | Effective planning | → D | ■ | Not selected | covered in 12.8 | ||||||
| 14.1 | Marine pollution | → D | ■ | Not selected | covered in 6.6 | ||||||
| 14.2 | Biodiversity abundance | → D | ■ | Selected | |||||||
| 14.3 | Ocean acidification | → D | □ | Not selected | |||||||
| 14.4 | Sustainable fishing | → B | → D | □ | Not selected | ||||||
| 14.5 | Coastal-marine conservation | → B | → D | ■ | Not selected | covered in 14.2 | |||||
| 14.7 | Small island developing | → D | □ | Not selected | |||||||
| 14.a | Marine technology | → D | □ | Not selected | |||||||
| 14.c | Ocean conservation | → D | □ | Not selected | |||||||
| 15.8 | Prevention of invasive alien species | → D | □ | Not selected | |||||||
| 16.7 | Institutional capacity | → D | ■ | Selected | |||||||
| 17.17 | Public–private partnerships | → D | □ | Not selected | |||||||
Appendix D
Table A4.
Used SDG targets with linking indicators of coastal services on sustainability in coastline cases calculated with numeric data collected in period 2015–2018. Categorization into social, environmental, and economic groups according [120,121]. The benchmark CNO is not presented. For the abbreviations, see Appendix A, Table A1.
| Short Description | KPI | SDG Target | Unit | Reference | CLG | CCC | CVM | CQP | CNN |
|---|---|---|---|---|---|---|---|---|---|
| Social service | |||||||||
| Water quantity and quality | Actual renewable water resources per capita | 6.6 | % | [118] | 75 | 61 | 42 | 81 | 45 |
| Renewable energy | Renewable electricity share of total electricity output (%) | 7.2 | % | [87] | 13.2 | 68.2 | 36.7 | 13.6 | 12.4 |
| Disaster risk reduction | Sendai Index | 11.5 | Number of deaths/missing persons affected by hydrological disasters per 100,000 inhabitants of coastal area | [94] | 7.90 | 787.2 | 5151.5 | 6.7 (2016) | 0.0 |
| Air quality | PM2.5 | 11.6 | μg/m3 | [95] | 6.7 | 13.4 | 26.6 | 6.1 | 11.0 |
| Institutional capacity | Governance Effectiveness Index | 16.7 | % | [101] | 91 | 54 | 53 | 92 | 97 |
| Environmental service | |||||||||
| Coastal erosion or accretion | Average erosion or accretion rate | 13.2 | Average change rate in m/year | [98] | −1.58 | −0.52 | −1.71 | 0.04 | 1.12 |
| Biodiversity abundance | Ocean Health Index | 14.2 | % | [88] | 84.2 | 80.1 | 83.3 | 94.0 | 90.5 |
| Economic service | |||||||||
| Economic productivity | Annual growth rate of real GDP per employed person | 8.2 | % | [88] | 66.8 | 80.4 | 74.0 | 95.6 | 66.8 |
| Sustainable tourism | World Economic Forum | 8.9 | % | [90] | 41.4 | 17.50 | 26.5 | 60.1 | 60.8 |
| CO2 emission reduction | Carbon dioxide (CO2) emissions per capita; estimates | 9.4 | 1000 tons CO2/CAP km2 coast | [91] | 16.5 | 1.7 | 1.8 | 15.4 | 9.9 |
| Knowledge and innovation | Global Competitiveness Index | 9.5 | % | [92] | 5.9 | 4.3 | 4.4 | 5.2 | 5.7 |
| Flood awareness | Public awareness | 12.8 | % | [96] | 21 | 22 | 17 | 24 | 26 |
Appendix E
Table A5.
Used SDG targets with linking indicators of coastal services on sustainability in sand nourishment cases in the Netherlands, calculated with numeric data collected in period 2015–2018. Categorization into social, environmental, and economic groups according [120,121]. The benchmark CNO is not presented. For the abbreviations, see Appendix A, Table A1. ND = No data.
| Short Description | KPI | SDG Target | Unit | Reference | CNH | CNA | CNC | CNZ | CNT |
|---|---|---|---|---|---|---|---|---|---|
| Social service | |||||||||
| Water quantity and quality | Eutrophication | 6.6 | NO3 and NO2 (mg/l) | [122] | 0.75 (1981) | 0.17 (2018) | 0.49 (1978) | 0.10 (2018) | 0.14 (2018) |
| Renewable energy | Renewable electricity share of total electricity output (%) | 7.2 | % | [87] | ND | ND | ND | ND | ND |
| Disaster risk reduction | Sendai Index | 11.5 | Number of deaths/missing persons affected by hydrological disasters | [94] | 0 | 0 | 0 | 0 | 0 |
| Air quality | Air pollution/ MKI | 11.6 | kg DB eq./m3 | [86] | 4.01 | 4.21 | 4.14 | 5.22 | 3.98 |
| Institutional capacity | Participation ladder | 16.7 | Index | [102] | 3 | 3 | 3 | 3 | 3 |
| Environmental service | |||||||||
| Coastal erosion or accretion | Average erosion or accretion per nourishment | 13.2 | Average change rate in m/year | [99] | −36 | 0 | 10 | −6 | −2 |
| Biodiversity abundance | Impact of disrupted seabed m3 | 14.2 | m2/m3 | [100] | 0.7 | 0.7 | 12.2 | 14.5 | 5.9 |
| Economic service | |||||||||
| Economic productivity | Annual growth job market due project in Euro/m3 | 8.2 | Euro/m3 | [89] | ND | 0.28 | 0.60 | ND | 1.20 |
| Sustainable tourism | Amount of Extra dry beach surface per m3 | 8.9 | m2/m3 | [38] | 0.07 | 0.00 | 0.08 | 0.16 | 0.22 |
| CO2 emission reduction | Carbon dioxide (CO2) emissions per nourishment | 9.4 | kg CO2 eq/m3 nourishment | [86] | 11.0 | 11.6 | 11.4 | 14.4 | 10.9 |
| Knowledge and innovation | Citation of peer publications in SCOPUS | 9.5 | number of citations | [93] | 284 | 5 | 0 | 0 | 0 |
| Flood awareness | Flood and water awareness based | 12.8 | HF (%) | [97] | 2.15 | 2.23 | 1.99 | 2.39 | 2.26 |
References
- Hall, J.W.; Sayers, P.; Walkden, M.; Panzeri, M. Impacts of climate change on coastal flood risk in England and Wales: 2030–2100. Philos. Trans. R. Soc. A Math. Phys. Mot. Sci. 2006, 364, 1027–1049. [Google Scholar] [CrossRef]
- De Boer, J.; Van der Zande, T.E.; Pieters, H.; Ariese, F.; Schipper, C.A.; Van Brummelen, T.; Vethaak, A.D. Organic contaminants and trace metals in flounder liver and sediment from the Amsterdam and Rotterdam harbours and off the Dutch coast. J. Env. Monit. 2001, 3, 386–393. [Google Scholar] [CrossRef]
- Botwe, B.O.; de Schamphelaere, K.; Schipper, C.A.; Teuchies, J.; Blust, R.; Nyarko, E.; Lens, P.N.L. Integrated hazard, risk and impact assessment of tropical marine sediments from Tema Harbour (Ghana). Chemosphere 2017. [Google Scholar] [CrossRef] [PubMed]
- Muller, C.O.; Yu, H.; Zhu, B. Ambient air quality in China: The impact of particulate and gaseous pollutants on IAQ. Procedia Eng. 2015, 121, 582–589. [Google Scholar] [CrossRef][Green Version]
- Schipper, C.A.; Vergouwen, S.; Bel de, B.; de Jong, M. Ports of the Future. Exploratory Study. Deltares Rep. 2015, 45, 1220137-000. Available online: https://www.researchgate.net/publication/282011883_Port_of_the_Future_Exploratory_study (accessed on 1 May 2015).
- Bishop, M.; Peterson, C. Assessing the environmental impacts of beach nourishment. J. Sci. Math. 2005, 55, 887–896. [Google Scholar]
- Kundzewicz, Z.W.; Kanae, S.; Seneviratne, S.I. Flood risk and climate change: Global and regional perspectives. Hydrol. Sci. J. 2013, 59, 1–28. [Google Scholar] [CrossRef]
- Miller, J.D.; Hutchins, M. The impacts of urbanisation and climate change on urban flooding and urban water quality: A review of the evidence concerning the United Kingdom. J. Hydrol. Reg. Stud. 2017, 12, 345–362. [Google Scholar] [CrossRef]
- IPCC. Summary for policymakers. In Climate Change 2014: Mitigation of Climate Change. Contribution of Working Group III to the Fifth Assessment Report of the Intergovernmental Panel on Climate Change; Edenhofer, O.R., Pichs-Madruga, Y., Sokona, E., Farahani, S., Kadner, K., Seyboth, A., Adler, I., Baum, S., Brunner, P., Eickemeier, B., et al., Eds.; Cambridge University Press: Cambridge, UK; New York, NY, USA, 2014. [Google Scholar]
- van Wesenbeeck, B.K.; de Boer, W.; Narayan, S.; van der Star, W.R.; de Vries, M.B. Coastal and riverine ecosystems as adaptive flood defences under a changing climate. Mitig. Adapt. Strateg. Glob. Change 2016, 22, 1087–1094. [Google Scholar] [CrossRef]
- Schipper, C.A.; Vreugdenhil, H.; de Jong, M.P.C. A sustainability assessment of ports and port-city plans: Comparing ambitions with achievements. Transp. Res. 2017, 57, 84–111. [Google Scholar] [CrossRef]
- Nicholls, R.J.; Hutton, C.W.; Lázár, A.N.; Allan, A.; Adger, W.N.; Adams, H.; Wolff, J.; Rahman, M.; Salehin, M. Integrated assessment of social and environmental sustainability dynamics in the Ganges-Brahmaputra-Meghna delta, Bangladesh. Estuar. Coast. Shelf Sci. 2016, 183, 1–12. [Google Scholar] [CrossRef]
- UN. Take Action for the Sustainable Development Goals–United Nations Sustainable Development. 2015. Available online: https://www.un.org/sustainabledevelopment/sustainable-development-goals/ (accessed on 1 December 2015).
- UN. Transforming Our World: The 2030 Agenda for Sustainable Development; Resolution Adopted by the General Assembly on 25 September 2014; (A/Res/70/1); UN: New York, NY, USA, 2015. [Google Scholar]
- Adoption of the Paris Agreement; Proposal by the President, COP21; UN: New York, NY, USA, 2015.
- UN. Report of the Inter-Agency and Expert Group on Sustainable Development Goal Indicators Statistical Commission. Items for Discussion and Decision: Data and Indicators for the 2030 Agenda for Sustainable Development; E/CN.3/2019/2; UN: New York, NY, USA, 2019. [Google Scholar]
- UN. 2019. Available online: https://undocs.org/pdf?symbol=en/A/RES/74/4 (accessed on 20 January 2021).
- UN. The Sustainable Development Goals Report 2017; United Nations: New York, NY, USA, 2017; Available online: https://unstats.un.org/sdgs/files/report/2017/TheSustainableDevelopmentGoalsReport2017.pdf (accessed on 20 January 2021).
- UN. Guidelines to Support Country Reporting on the Sustainable Development Goals; UN: New York, NY, USA, 2017. [Google Scholar]
- UNDP. What are the Sustainable Development Goals? 2018. Available online: www.undp.org/content/undp/en/home/sustainable-development-goals.html (accessed on 20 January 2021).
- UNDP. Investing in Innovative Nature-Based Solutions; UNDP: New York, NY, USA, 2017. [Google Scholar]
- Wendling, L.A.; Huovila, A.; Castell-Rüdenhausen, M.; Hukkalainen, M.; Airaksinen, M. Benchmarking nature-based solution and smart city assessment schemes against the sustainable development goal indicator framework. Front. Env. 2018. [Google Scholar] [CrossRef]
- Giardino, A.; Santinelli, G.; Vuik, V. Coastal state indicators to assess the morphological development of the Holland coast due to natural and anthropogenic pressure factors. Ocean Coast. Manag. 2014, 87, 93–101. [Google Scholar] [CrossRef]
- Stronkhorst, J.; Huisman, B.; Giardino, A.; Santinelli, G.; Santos, F.D. Sand nourishment strategies to mitigate coastal erosion and sea level rise at the coasts of Holland (The Netherlands) and Aveiro (Portugal) in the 21st century. Ocean Coast. Manag. 2018, 156, 266–276. [Google Scholar] [CrossRef]
- Sustain. Measuring Coastal Sustainability: The Sustain Policy Tool. 2012. Available online: https://www.msp-platform.eu/projects/measuring-coastal-sustainability-sustain-policy-tool (accessed on 20 January 2021).
- Dawson, R.J.; Dickson, M.E.; Nicholls, R.J. Integrated analysis of risks of coastal flooding and cliff erosion under scenarios of long-term change. Clim. Chang. 2009, 95, 249–288. [Google Scholar] [CrossRef]
- World Bank. Implementing Nature-Based Flood Protection: Principles and Implementation Guidance; World Bank: Washington, DC, USA, 2017. [Google Scholar]
- Green, D.R.; Payne, J.L. Marine and Coastal Resource Management: Principles and Practices (Earthscan Ocean); Routledge: New York, NY, USA, 2017; 336p, ISBN 1849712905. [Google Scholar]
- UN. Indicators of Sustainable Development: Guidelines and Methodologies; No. E.08. II. A.2; United Nations: New York, NY, USA, 2007; ISBN 978-92-1-104577-2. [Google Scholar]
- DEDUCE. Indicators Guidelines. To Adapt an Indicators-Based Approach to Evaluate Sustainable Coastal Development; DEDUCE Interreg III; 2007, 98 pg. Available online: http://www.im.gda.pl/images/ksiazki/2007_indicators_guidelines.pdf (accessed on 1 December 2007).
- Schanze, J.; Hutter, G.; Penning-Rowsell, E.; Nachtnebel, H.P.; Meyer, V.; Werritty, A.; Harries, T.; Holzmann, H.; Jessel, B.; Koeniger, P.; et al. Systematisation, Evaluation and Context Conditions of Structural and Non-Structural Measures for Flood Risk Re-Duction; ERA-NET CRUE: London, UK, 2008. [Google Scholar]
- Sayers, P.; Walsh, C.; Dawson, R. Climate impacts on flood and coastal erosion infrastructure. Infrastruct. Asset Manag. 2015, 1400040. [Google Scholar] [CrossRef]
- Stive, M.J.F.; de Schipper, M.A.; Luijendijk, A.P.; Aarninkhof, S.G.J.; van Gelder-Maas, C.; van Thiel de Vries, J.S.M.; de Vries, S.; Henriquez, M.; Marx, S.; Ranasinghe, R. A new alternative to saving our beaches from sea-level rise: The sand motor. J. Coast. Res. 2013, 29, 1001–1008. [Google Scholar] [CrossRef]
- Sutton-Grier, A.E.; Gittman, R.K.; Arkema, K.K.; Bennett, R.O.; Benoit, J.; Blitch, S.; Burks-Copes, K.A.; Colden, A.; Dausman, A.; DeAngelis, B.M.; et al. Investing in natural and nature-based infrastructure: Building better along our coasts. Sustainability 2018, 10, 523. [Google Scholar] [CrossRef]
- Dronkers, J.; Stojanovic, T. Coastal management and governance. In North Sea Climate Change Assessment; Colijn, F., Quante, M., Eds.; Springer: Berlin, Germany, 2016; pp. 475–488. [Google Scholar]
- Narayan, S.; Beck, M.W.; Wilson, P. The value of coastal wetlands for flood damage reduction in the northeastern USA. Sci. Rep. 2017, 7, 9463. [Google Scholar] [CrossRef]
- Giardino, A.; Mulder, J.; de Ronde, J.; Stronkhorst, J. Sustainable development of the Dutch coast: Present and future. J. Coast. Res. 2011, 61, 166–172. [Google Scholar] [CrossRef]
- Stronkhorst, J.; van Buren, R. Asset Management en Kustlijnzorg; Report 1220047-002; Deltares: Delft, The Netherland, 2015. (In Dutch) [Google Scholar]
- Rizzo, A.; Anfuso, G. Coastal dynamic and evolution: Case studies from different sites around the world. Water 2020, 12, 2829. [Google Scholar] [CrossRef]
- Disaster Risk Reduction and Resilience in the 2030 Agenda for Sustainable Development; UNDRR: Geneva, Switzerland, 2015.
- Suraj, M.; Singh, R.B.; Huggel, C. Climate Change, Extreme Events and Disaster Risk Reduction: Towards Sustainable Development Goals; Springer: Berlin, Germany, 2018. [Google Scholar] [CrossRef]
- Lorcan, C.; Blanchard, K.; Maini, R.; Radu, A.; Eltinay, N.; Zaidi, Z.; Murray, V. Knowing what we know—Reflections on the development of technical guidance for loss data for the Sendai framework for disaster risk reduction. PLoS Curr. 2018, 10, 1–12. [Google Scholar]
- Rickels, W.; Dovern, J.; Hoffmann, J.; Quaas, M.F.; Schmidt, J.O.; Visbeck, M. Indicators for monitoring sustainable development goals: An application to oceanic development in the European Union. Earth’s Future 2016, 4, 252–267. [Google Scholar] [CrossRef]
- Ishtiaque, A.; Masrur, A.; Rabby, Y.W.; Jerin, T.; Dewan, A. Remote sensing-based research for monitoring progress towards SDG 15 in Bangladesh: A review. Remote. Sens. 2020, 12, 691. [Google Scholar] [CrossRef]
- Kistenkas, F.H.; Bouwma, I.M. Barriers for the ecosystem services concept in European water and nature conservation law. Ecosyst. Serv. 2018, 29, 223–227. [Google Scholar] [CrossRef]
- Climate Change Adaptation, Marine and Coastal Issues; Commission Staff Working Document (SWD 2013); European Commision: Brussels, Belgium, 2013.
- Kudale, M.D. Impact of port development on the coastline and the need for protection. Indian J. Geo-Mar. Sci. 2010, 39, 597–604. [Google Scholar]
- Elkington, J. Cannibals with Forks: The Triple Bottom Line of 21st Century Business; Capstone Publishing Ltd.: Oxford, UK, 1998. [Google Scholar]
- Haarmann, W.; Hermans, F.; Overeem, I. Monitoring van Provinciale Duurzame Ontwikkeling. De Duurzaamheidbalans Getoetst in Vier Provincies. 2004. Available online: https://www.telos.nl/Publicaties/PublicatiesRapporten/HandlerDownloadFiles.ashx?idnv=699418 (accessed on 20 January 2021).
- Ahvenniemi, H.; Huovila, A.; Pinto-Seppä, I.; Airaksinen, M. What are the differences between sustainable and smart cities? Cities 2017, 60, 234–245. [Google Scholar] [CrossRef]
- Essex, B.; Koop, S.H.A.; van Leeuwen, C.J. Proposal for a national blueprint framework to monitor progress on water-related sustainable development goals in Europe. Environ. Manag. 2020, 65, 1–18. [Google Scholar] [CrossRef]
- Schipper, C.A. Understanding the sustainable development goal approach for ports of the future. In Proceedings of the 38th IAHR World Congress, Panama City, Panama, 1–6 September 2019. [Google Scholar]
- Zimon, D.; Srouf, J.T.R. Drivers of sustainable supply chain management: Practices to alignment with UN sustainable development goals. Int. J. Qual. Res. 2019, 14, 219–236. [Google Scholar] [CrossRef]
- Horan, D. National Baselines for Integrated Implementation of an Environmental Sustainable Development Goal Assessed in a New Integrated SDG Index. Sustainability 2020, 12, 6955. [Google Scholar] [CrossRef]
- Schroeder, P.; Anggraeni, K.; Weber, U. The relevance of circular economy practices to the sustainable development goals. J. Ind. Ecol. 2018, 2, 77–95. [Google Scholar] [CrossRef]
- Lawer, E.T.; Herbeck, J.; Flitner, M. Selective adoption: How port authorities in Europe and West Africa engage with the globalizing ‘Green Port’ idea. Sustainability 2019, 11, 5119. [Google Scholar] [CrossRef]
- UN. (2019) Tier Classification for Global SDG Indicators, 4 April 2019. Available online: https://unstats.un.org/sdgs/files/Tier%20Classification%20of%20SDG%20Indicators_4%20April%202019_web.pdf (accessed on 1 May 2019).
- Nabyonga-Orem, J. Monitoring sustainable development goal 3: How ready are the health information systems in low-income and middle-income countries? BMJ Glob. Health 2017, 2, e000433. [Google Scholar] [CrossRef] [PubMed]
- Le Blanc, D. Towards integration at last? The sustainable development goals as a network of targets. Sustain. Dev. 2015, 23, 176–187. [Google Scholar] [CrossRef]
- Nilsson, M.; Chisholm, E.; Griggs, D. Mapping interactions between the sustainable development goals: Lessons learned and ways forward. Sustain. Sci. 2018, 13, 1489–1503. [Google Scholar] [CrossRef]
- Pedercini, M.; Zuellich, G.; Dianati, K.; Arquitt, S. Toward achieving sustainable development goals in ivory coast: Simulating pathways to sustainable development. Sustain. Dev. 2018, 26, 588–595. [Google Scholar] [CrossRef]
- Hutton, C.W.; Nicholls, R.J.; Lázár, A.T.; Chapman, A.; Schaafsma, M.; Salehin, M. Potential trade-offs between the sustainable development goals in coastal Bangladesh. Sustainability 2018, 10, 1108. [Google Scholar] [CrossRef]
- Reguero, B.G.; Bresch, D.N.; Beck, M. Coastal risks, nature-based defenses and the economics of adaptation: An application in the Gulf of Mexico, USA. Coast. Eng. Proc. 2014, 1, 25. [Google Scholar] [CrossRef]
- Raymond, C.M.; Berry, P.; Breil, M.; Nita, M.R.; Kabisch, N.; de Bel, M.; Enzi, V.; Frantzeskaki, N.; Geneleti, D.; Cardinaletti, M.; et al. An Impact Evaluation Framework to Support Planning and Evaluation of Nature-Based Solutions Projects; Report Prepared by the EKLIPSE Expert Working Group on Nature-Based Solutions to Promote Climate Resilience in Urban Areas; Centre for Ecology and Hydrology: Wallingford, UK, 2017. [Google Scholar]
- Raymond, C.M.; Frantzeskaki, N.; Kabisch, N. A framework for assessing and implementing the co-benefits of nature-based solutions in urban areas. Environ. Sci. Pol. 2017, 77, 15–24. [Google Scholar] [CrossRef]
- Dushenko, M.; Bjorbæk, C.T.; Steger-Jensen, K. Application of a sustainability model for assessing the relocation of a container terminal: A case study of Kristiansand port. Sustainability 2019, 11, 87. [Google Scholar] [CrossRef]
- IPCC. Climate change 2001: Impacts, adaptation and vulnerability. In Contribution of Working Group II to the Third Assessment Report of the Intergovernmental Panel on Climate Change, World Meteorological Organisation and United Nations Environment Programme; McCarthy, J., Canziani, O.F., Leary, N.A., Dokken, D.J., White, K.S., Eds.; Cambridge University Press: Cambridge, UK, 2001; 1032p. [Google Scholar]
- Millennium Ecosystem Assessment. Ecosystems and Human Well-Being: Synthesis; Island Press: Washington, DC, USA, 2005. [Google Scholar]
- Torresan, S.; Critto, A.; Valle, M.D.; Harvey, N.; Marcomini, A. Assessing coastal vulnerability to climate change: Comparing segmentation at global and regional scales. Sustain. Sci. 2018, 3, 45–65. [Google Scholar] [CrossRef]
- UN. Compilation of Metadata for the Proposed Global Indicators for the Review of the 2030 Agenda for Sustainable Development, Metadata for Goals 1 till 17. 2016. Available online: https://unstats.un.org/sdgs/iaeg-sdgs/metadata-compilation (accessed on 20 January 2021).
- Gopalakrishnan, L.; Landry, C.E.; Smith, M.D. Climate change adaptation in coastal environments: Modeling challenges for resource and environmental economists. Rev. Environ. Econ. Policy 2018, 12, 48–68. [Google Scholar] [CrossRef]
- Climate Change Adaptation, Coastal and Marine Issues; SWD 133; UN: New York, NY, USA, 2013.
- Russel, P.R. Mississippi River Diversions Could Save Louisiana’s Drowning Coast. Eng. News Record. 2018. Available online: https://www.datacenterresearch.org/news/mississippi-river-diversions-could-save-louisianas-drowning-coast/ (accessed on 9 August 2018).
- State of Louisiana. Coast Masterplan. Louisiana Comprehensive Master Plan for a Sustainable Coast; OTS-State Printing: Baton Rouge, LA, USA, 2017.
- OECD Environmental Performance Reviews: Colombia; OECD Publishing: Paris, France, 2014. [CrossRef]
- Guannel, G.; Arkema, K.; Ruggiero, P.; Verutes, G. The power of three: Coral reefs, seagrasses and mangroves protect coastal regions and increase their resilience. PLoS ONE 2016, 11, e0158094. [Google Scholar] [CrossRef] [PubMed]
- Preparing a Shoreline Erosion Management Plan. Guideline for Coastal Development; Department of Environment and Science, Queensland Government: Brisbane, QLD, Australia, 2018.
- Gebhardt, S.; Nguyen, L.D.; Kuenzer, C. Mangrove Ecosystems in the Mekong Delta–Overcoming Uncertainties in Inventory Mapping Using Satellite Remote Sensing Data. Chapter 12. In The Mekong Delta System: Interdisciplinary 315 Analyses of a River Delta, Environmental Science and Engineering; Renaud, F.G., Kuenzer, C., Eds.; Springer: Dordrecht, The Netherlands, 2012. [Google Scholar]
- Ministry of Natural Resources and Environment. Mekong Delta Plan Long-Term Vision and Strategy for a Safe, Prosperous and Sustainable Delta; MinIeW, RHDHV, Deltares, Rebel, WUR. 2013. Available online: https://www.deltares.nl/app/uploads/2014/01/Mekong-delta-plan-Long-term-vision-and-strategy.pdf (accessed on 20 January 2021).
- Compass for the Coast. National Coastal Strategy; Ministry of Infrastructure and Environment, Delta Commission: The Hague, The Netherlands, 2013.
- Van Oers, M.; Ministerie van Verkeer en Waterstaat, Rijkswaterstaat, Waterdienst (RWS, WD). Objectbeheerregime Kustfundament. Beheer- en Onderhoudsstrategie Objectbeheerregime Kustfundament. 2017; 84p, (In Dutch). Available online: https://puc.overheid.nl/rijkswaterstaat/doc/PUC_143111_31/ (accessed on 20 January 2021).
- DHV Milieu en Infrastructuur; H+N+S landschapsarchitecten. Aanleg en Zandwinning Zandmotor Delflandse Kust: Projectnota/ MER; Provence Zuid-Holland: Den Haag, The Netherlands, 2010; 372p. (In Dutch) [Google Scholar]
- Van Prooijen, B.C.; Tissier, M.F.S.; de Wit, F.P.; Pearson, S.G.; Brakenhoff, L.B.; van Maarseveen, C.G.; van der Vegt, M.; Mol, J.W.; Kok, F.; Holzhauer, H.; et al. Measurements of hydrodynamics, sediment, morphology and benthos on Ameland ebb-tidal delta and lower shoreface. Earth Syst. Sci. Data 2020. [Google Scholar] [CrossRef]
- SDG-Tracker. 2018. Available online: https://ourworldindata.org/uploads/2018/06/SDG-Data-Matrix-01.png (accessed on 20 January 2021).
- UNEP. 2019. Available online: http://www.unep.org/explore-topics/water/what-we-do/monitoring-water-quality (accessed on 20 January 2021).
- Rijkswaterstaat. What is DuboCalc? 2018. Available online: https://www.dubocalc.nl/en/what-is-dubocalc/ (accessed on 20 January 2021).
- World Bank. 2019. Available online: https://data.worldbank.org/indicator/EG.GDP.PUSE.KO.PP.KD (accessed on 20 January 2021).
- Ocean Health Index. 2018. Available online: http://www.oceanhealthindex.org/ (accessed on 20 January 2021).
- Andringa, T. De Kust-Meer dan Hoogwaterbescherming. Een Verkenning van de Baten van Kustlijnzorg. Ph.D. Thesis, University of Twente, Enschede, The Netherlands, 2015. (In Dutch). [Google Scholar]
- World Economic Forum. The Travel & Tourism Competitiveness Report 2019; World Economic Forum: Geneva, Switzerland, 2019; ISBN 978-2-940631-01-8. [Google Scholar]
- Global Economy. 2019. Available online: https://www.theglobaleconomy.com/rankings/Carbon_dioxide_emissions_per_capita/ (accessed on 20 January 2021).
- World Economic Forum. 2019. Available online: http://reports.weforum.org/global-competitiveness-index-2017-2018/competitiveness-rankings/#series=GCI.B.09 (accessed on 20 January 2021).
- Elsevier. 2018. Available online: https://www.scopus.com/search/form.uri?display=basic (accessed on 20 January 2021).
- Sendai Framework. The International Disaster Database. Centre for Research on the Epidemiology of Disasters/CRED. 2019. Available online: https://www.emdat.be/classification (accessed on 20 January 2020).
- World Health Organization. 2019. Available online: http://www.who.int/phe/health_topics/outdoorair/databases/cities/en/ (accessed on 20 January 2021).
- Hyogo Framework. 2019. Available online: https://www.preventionweb.net/english/hyogo/progress/priority5/?pid:222 (accessed on 20 January 2021).
- SAMR Publieksmonitor Waterpeil; Ministry of Infrastructure and Water Management: The Hague, The Netherlands, 2016; (In Dutch). Available online: https://klimaatadaptatienederland.nl/@212601/waterpeil/ (accessed on 1 July 2016).
- Luijendijk, A.; Hagenaars, G.; Ranasinghe, R.; Baart, F.; Donchyts, G.; Aarninkhof, S. The state of the world’s beaches. Sci. Rep. 2018, 8, 6641. [Google Scholar] [CrossRef]
- Giardino, A.; den Heijer, C.; Santinelli, G.; van der Werf, J.J. Tools for Medium and Long-Term Prediction of Nourishment Effects; Report 1207724-003; Deltares: Delft, The Netherlands, 2013. [Google Scholar]
- Van Duin, C.F.; Vrij Peerdeman, M.; Jaspers, C.J.; Bucholc, A.M.; Wessels, S.C. MER Winning Suppletiezand Noordzee 2013–2017; Report; Grontmij: Stockholm, Sweden, 2012. (In Dutch) [Google Scholar]
- World Bank. Government Effectiveness Index. 2019. Available online: http://info.worldbank.org/governance/wgi/index.aspx#reports (accessed on 20 January 2021).
- Pröpper, I.M.A.M.; Steenbeek, D.A. De aanpak van Interactief Beleid: Elke Situatie is Anders; Coutinho: Bussum, The Netherlands, 1999. (In Dutch) [Google Scholar]
- Neumann, B.; Ott, K.; Kenchington, R. Strong sustainability in coastal areas: A conceptual interpretation of SDG 14. Sustain. Sci. 2017, 12, 1019–1035. [Google Scholar] [CrossRef]
- Allen, C.; Reid, M.; Thwaites, J.; Glover, R.; Kestin, T. Assessing national progress and priorities for the sustainable development goals (SDGs): Experience from Australia. Sustain. Sci. 2019, 15, 521–538. [Google Scholar] [CrossRef]
- Wood, S.L.R.; Jonson, S.K.; Justin, J.A.; Brauman, K.A.; Chaplin-Kramer, R.; Fremier, F.; Girvetz, E.; Line, J.; Gordon, J.L.; Kappel, C.V.; et al. Distilling the role of ecosystem services in the sustainable development goals. Ecosyst. Serv. 2018, 29, 70–82. [Google Scholar] [CrossRef]
- Velders, G.J.; Maas, R.J.; Geilenkirchen, G.P.; de Leeuw, F.A.; Ligterink, N.E.; Ruyssenaars, P.; de Vries, W.J.; Wesselin, J. Effects of European emission reductions on air quality in the Netherlands and the associated health effects. Atmos. Environ. 2020, 221, 117109. [Google Scholar] [CrossRef]
- Vousdoukas, M.I.; Ranasinghe, R.; Mentaschi, L.; Plomaritis, T.A.; Athanasiou, P.; Luijendijk, A.; Feyen, L. Sandy coastlines under threat of erosion. Nat. Clim. Chang. 2020, 10, 260–263. [Google Scholar] [CrossRef]
- Dang, H.A.H.; Serajuddin, U. Tracking the sustainable development goals: Emerging measurementchallenges and further reflections. World Dev. 2020, 127, 104570. [Google Scholar] [CrossRef]
- Butler, J.R.A.; Bohensky, E.L.; Suadnya, W.; Yanuartati, Y.; Handayani, T.; Habibi, P.; Puspadi, K.; Skewes, T.D.; Wise, R.M.; Suharto, I. Scenario planning to leap-frog the sustainable development goals: An adaptation pathways approach. Clim. Risk Manag. 2015. [Google Scholar] [CrossRef]
- GRI. 2019. Available online: https://database.globalreporting.org/ (accessed on 20 January 2021).
- Borsje, B.W.; de Vries, S.; Janssen, S.K.H.; Luijendijk, A.P.; Vuik, V. Chapter 8. Building with nature as coastal protection strategy in the Netherlands. In Living Shorelines; The Science and Management of Nature-Based Coastal Protection; Bilkovic, D.M., Mitchell, M.M., La Peyre, M.K., Toft, D., Eds.; CRC Press: Boca Raton, FL, USA, 2016. [Google Scholar]
- EU. An EU Strategy on Adaptation to Climate Change. COM 2013, 216. Available online: https://eur-lex.europa.eu/LexUriServ/LexUriServ.do?uri=COM:2013:0216:FIN:EN:PDF (accessed on 16 April 2013).
- Water Elements in the European Green Deal; Directorate-General for the Environment, European Commission: Brussels, Belgium, 2020.
- EC. Regulation of the European Parliament and of the Council Establishing the Framework for Achieving Climate Neutrality and Amending Regulation (EU) 2018/1999 (European Climate Law); 2020/0036 (COD); EC: Brussels, Belgium, 2020. [Google Scholar]
- Directive 2007/60/EC of the European Parliament and of the Council of 23 October 2007 on the Assessment and Management of Flood Risks; European Parliament: Brussels, Belgium, 2007.
- Schueler, K. Nature-Based Solutions to Enhance Coastal Resilience; Inter-American Development Bank: Washington, DC, USA, 2017. [Google Scholar]
- Schmidt, S.; Neumann, B.; Waweru, Y.; Durussel, C.; Unger, S.; Visbeck, M. SDG14 conserve and sustainably use the oceans, seas and marine resources for sustainable development. In A Guide to SDG Interactions: From Science to Implementation; Griggs, D.J., Nilsson, M., Stevance, A.-S., McCollum, D., Eds.; International Council for Science: Paris, France, 2017; pp. 174–218. [Google Scholar]
- UNEP. 2020. Available online: https://open.unep.org/ (accessed on 20 January 2021).
- McKinsey. Global Cities of the Future: An Interactive Map. 2012. Available online: https://www.mckinsey.com/featured-insights/urbanization/global-cities-of-the-future-an-interactive-map (accessed on 20 January 2021).
- Vinuesa, R.; Azizpour, H.; Leite, I.; Balaam, M.; Dignum, V.; Domisch, S.; Felländer, A.; Langhans, S.D.; Tegmark, M.; Nerini, F.F. The role of artificial intelligence in achieving the sustainable development goals. Nat. Commun. 2020, 11, 233. [Google Scholar] [CrossRef]
- Fonseca, L.M.; Domingues, J.P.; Dima, A.M. Mapping the sustainable development goals relationships. Sustainability 2020, 12, 3359. [Google Scholar] [CrossRef]
- Waterinfo Database. 2020. Available online: https://waterinfo.rws.nl/#!/nav/expert/ (accessed on 20 January 2021).


Publisher’s Note: MDPI stays neutral with regard to jurisdictional claims in published maps and institutional affiliations. |
© 2021 by the authors. Licensee MDPI, Basel, Switzerland. This article is an open access article distributed under the terms and conditions of the Creative Commons Attribution (CC BY) license (http://creativecommons.org/licenses/by/4.0/).