Article

Vendors’ Attitudes and Perceptions towards International Tourists in the Malaysia Night Market: Does the COVID-19 Outbreak Matter?

by
Mohammad Javad Maghsoodi Tilaki
1,*,
Gelareh Abooali
2,
Massoomeh Hedayati Marzbali
3 and
Narimah Samat
1
1
Geography Section, School of Humanities, Universiti Sains Malaysia, Penang 11800, Malaysia
2
School of Tourism, Hospitality and Event Management, Universiti Utara Malaysia, Sintok 06010, Malaysia
3
School of Housing, Building and Planning, Universiti Sains Malaysia, Penang 11800, Malaysia
*
Author to whom correspondence should be addressed.
Sustainability 2021, 13(3), 1553; https://doi.org/10.3390/su13031553
Submission received: 9 December 2020 / Revised: 2 January 2021 / Accepted: 3 January 2021 / Published: 2 February 2021
(This article belongs to the Special Issue Resident-Tourist Relationships, Interactions and Sustainability)

Abstract

:
Although the negative economic impacts of COVID-19 are undiscovered, the tourism industry is recognized as one of the most vulnerable sectors. Considering tourism’s contribution to Malaysia’s GDP, this study aims to examine vendors’ attitudes and perceptions towards international tourists in night markets after the emergence of COVID-19 and the impacts of propagation power of COVID-19 on vendors’ perceptions in Malaysia. As large numbers of informal workers lost 60% of their income worldwide due to the pandemic, a lack of research is observed on vendors’ attitudes after the pandemic, especially in Southeast Asia. The study model was derived on the basis of the revised social exchange theory (SET). A questionnaire survey was conducted among local vendors in Malaysia using a multistage probability sampling method. Findings revealed that place attachment has a significant effect on positive perception but not negative perception towards international tourists’ receptiveness. Results indicate that positive perceptions towards international tourists significantly and positively mediate the relationship among place attachment, economic gain, and involvement with tourist receptiveness. Moreover, the research concluded that vendors still have positive attitudes towards international tourists’ receptiveness due to economic gain and their place attachment and involvement levels during the COVID-19 pandemic.

1. Introduction

Owing to the rapid outbreak of coronavirus disease 2019 (COVID-19) from its origin in Wuhan, China, in mid-December 2019 [1], the World Health Organization (WHO) declared the phenomena as a pandemic on 11 March 2020 [2]. Despite the different intervention policies for outbreak prevention, COVID-19 has infected more than 55 million people and caused over one million deaths (as of 30 October 2020) around the world [3]. The interventions can be categorised into two main policies, including (i) increasing the diagnostic testing, improving the clinical producers, and rapid isolation of confirmed cases [4]; and (ii) restriction of mobility in global, national, and regional levels [5]. The tourism industry is one of the most affected sectors by COVID-19 [6], as most countries have implemented entry restrictions on all foreign nationals in response to the COVID-19 outbreak [5,7]. Consequently, international tourism slowed down by 22% in the first quarter of 2020, and the number of international tourists is forecasted to drop by 60–80% in 2020 [8].
Although the negative impacts of COVID-19 on economic, employment, and household income are unknown to date [6], negative relationships exist between the development of international tourism and pandemic outbreaks [1]. Consequently, a loss of 75 million tourism industry jobs is estimated in 2020 [8]. Despite the direct contribution of the tourism industry to the gross domestic product (GDP) and employment in many countries [9], the COVID-19 outbreak has seriously influenced different sections of the tourism industry, including tourists’ transportation, hoteling, shopping activities and expenditures, tour operations, and catering [10].
In the Asia-Pacific region, the tourism industry has made an important contribution to the GDP over the last two decades. Therefore, communities are more vulnerable to the pandemic due to travel restrictions [11], including in Southeast Asia. Malaysia is one of the countries in Southeast Asia which experienced high economic growth rate and high employment rate during the past three decades. This success has been achieved through investment and development in different sectors including oil and gas, manufacturing, palm oil industry, and tourism sectors [12]. Although Malaysia’s inbound tourism has grown extensively over the past decades, the 2020 Movement Control Order (MCO) restricted entry to Malaysia and movement all over the country from 18 March to 11 June 2020 as a preventive measure in response to the COVID-19 pandemic. Subsequently, the economic sector was immediately affected after the international and local travel restrictions and then the suspension of production activities in Malaysia. Consequently, the country lost RM2.4 billion per day (1USD = 4.18 MYR) and RM63 billion in total during MCO. Moreover, approximately 730,000 people have lost their jobs in Malaysia during the MCO, and the unemployment rate reached 5.0%, the highest since 1990 [13].
Indeed, the tourism industry has been affected more than the other types of business and services despite the fact that tourism is the third biggest contributor to Malaysia’s GDP. Thus, the affected jobs and activities can be categorised as international and domestic tourism and day visits and include segments as diverse as air transport, cruises, public transport, hoteling and accommodation, shopping and survivors, cafes and restaurants, conventions, festivals, meetings, and sports events [14].
In the literature, the relationships among shopping, tourism, retailing, and leisure have undergone extensive investigation, which was introduced by Jansen-Verbeke in 1987. Overall, shopping has been considered a favourite activity among international tourists in recent years [15,16]. From another perspective, findings have demonstrated that most tourists believe the journey is incomplete without shopping [17], and the latter has become one remarkable factor pushing tourists towards destinations [18]. The tourist market consists of modern shopping malls [19], shopping villages [20], pedestrian shopping streets [21], public markets [22], and night markets [23]. These locations can play effective roles to remind tourists about visited places through purchased souvenirs [24].
Although tourist markets and night markets have been recently recognised as popular tourist attractions in many places, several challenges exist between numerous large shopping complexes and night markets. In main cities worldwide, shopping malls have been developed as hybrid consumption and entertainment centres for bringing all needs under one roof [23,25]. The evolution of urban growth indicates that the shopping complexes have been spread when the retail chain of stores was shifted from the main streets of old towns to modern buildings and shopping plazas [25]. Unlike shopping complexes and malls, temporary markets such as weekend market, tourist market, and night market are considered visible parts of urban cultures which are closely addressing people’s daily lives. Products sold at shopping complexes and malls have fixed prices, whilst customers meet different atmospheres and occasions in tourist markets or night markets for bargain deals to buy reduced-price items [26]. Owing to persistent bargaining, the ambience of the night market is usually crowded, messy, and noisy [18]. Furthermore, evidence has suggested that tourists and vendors freely engage with others in the night market [27] and that tourists feel positive about mingling with the local vendors and host communities [28].
Owing to the economic, social, and cultural benefits of the night market as a tourist attraction, a large body of literature concentrated on sustaining night markets against shopping complexes by closing the alignment of the views of vendors and customers [23]. Thus, social exchange theory (SET) has been applied in a broad range of research contexts as well as the tourism field to posit people’s interaction together through a self-assessment of cost and benefits [29]. SET offers a conceptual base to study the relationship between costs and benefits of tourism and residents’ support and receptiveness [30].
Although SET proposed that individual behaviour is involved in the process of resource exchange [31], extant literature on the tourism field has been extensively documented on the basis of SET to evaluate the residents’ perception and support the tourism development process [32,33,34]. In the context of tourism, SET postulates that residents support tourism development when its benefits surpass its costs [35]. Although the significance of the study is apparent from the fact that tourists’ shopping behaviour is based on the mobility, social relationship, and physical contact between vendors and consumers [36], debate scarcely exists in the body of literature to understand the behaviour of vendors and customers in the shopping process at night markets [17].
During the last decade, numerous studies focused on motivation, satisfaction, and behaviour of tourists in shopping activities; however, little debate exists in the body of literature to address the comprehensive and accurate awareness about vendors’ opinions of the tourists in night markets [23], especially during and after a pandemic. To fill the knowledge gap, the current research applied the revised SET as introduced by Meeker in 1971 in the conceptual framework to examine vendors’ attitudes and perceptions towards international tourists in the night markets after the emergence of COVID-19 and the impacts of propagation power of COVID-19 on vendors’ perceptions in Malaysia. The current study contributes to the scientific literature regarding the role and influence of positive and negative effects on their mediation with the relationship between vendors’ attitudes and their receptiveness towards international tourists after the COVID-19 outbreak in Malaysia’s night markets, with scarcely any studies investigating them. Therefore, this study aimed to investigate the relationship between attitudes (i.e., place attachment, economic gain and involvement) and receptiveness, and the mediating role the effects (both positive and negative) could have in these relationships.

1.1. COVID-19 Outbreak and the Government Measures

On 25 January 2020, the first case of COVID-19 was detected in Malaysia and traced back to three Chinese nationals who previously had close contacts with an infected person in Singapore. Although the Ministry of Health (MOH) quickly devised standard guidelines for the management of COVID-19 in each state of Malaysia, the first positive case was confirmed on 4th February 2020. Subsequently, other states such as Penang reported their first COVID-19 case in March 2020. As mentioned earlier, the Malaysia government applied MCO due to the increasing number of positive cases to 553 cases on 16th March 2020. Furthermore, the government implemented three more national orders after MCO to decrease outbreak incidences namely: Conditional Movement Control Order (CMCO), Recovery Conditional Movement Control Order (RCMCO), and Restricted Movement Control Order (RMCO).
As of 25 December 2020, Malaysia passed 101,000 total COVID-19 positive cases with 449 deaths, whereas the five most affected states are Sabah (35,415), Selangor (27,709), Negeri Sembilan (7335), Johor (3821), and Penang (3106) [37]. Since October 2020, Malaysia has entered the third wave of the COVID-19, and the third wave of the COVID-19 pandemic unleashed its fury on several parts of Malaysia such as the State of Penang [38].
Although the state of Penang had not recorded any new infection during three months from May 2020 to August 2020 and had earned it the only state in Malaysia with a green state status, Penang was back on alert after recording new cases since August 2020. Indeed, since November 2020, with the beginning third wave of COVID-19, two major COVID-19 clusters have been identified in Penang state, and then COVID-19 infection cases have increased to 1809 (25 November 2020) and 3106 (25 December 2020), while the infected cases were 851 on 25 October 2020 (MoH, 2020). Local authorities initiated a series of drastic measures limiting human movement and activity in fighting against the COVID-19 pandemic in Penang, but all shopping malls, night markets, and wet markets are operating trouble-free. Nevertheless, the issue did not end here. A few weeks later, on 13th November 2020, local authorities had ordered to close for 14 days one wet market, as a trader based at the wet market was suspected to have contracted COVID-19. In response, wet and night markets have been sanitised frequently, but remain open until now.
The Malaysian government rolled out emergency packages totalling 89 billion of US dollars (18% GDP of Malaysia) to keep their economies afloat [39]. The government is under significant stress to restrict the social and economic impact of the COVID-19 pandemic through implementing new constructs and priorities in their policies and strategies [40]. Generally, the government quickly established and implemented two set actions, including “one-off actions” and “series of actions” for affected people and economic stakeholders to respond to the immediate economic impacts of the pandemic [41]. Malaysia is one of the countries that intensified their measures to support small and medium enterprises, whereas most tourism companies are in the sector. Furthermore, the government concentrated on cash injection to the Malaysian economy through extra payments to the vulnerable population [42].
However, the government has launched three stimulus packages to ease cash flow of businesses, assist affected individuals, and stimulate demand for the domestic “travel and tourism” sector in three stages: (i) immediate actions during first weeks; (ii) consolidation phase during first months; and (iii) recovery phase during and after first months of the COVID-19 outbreak [41].

1.2. Social Exchange Theory

Tourism brings positive and negative impacts. Although tourism generates revenue, creates jobs, builds up infrastructure, and encourages cultural exchange, its negative impact is undeniable [43,44]. In addition, tourism is perceived to result in several cultural, environmental, economic, and social negative impacts and disrupts local communities [45]. There exists an extensive literature on the socio-cultural impacts of tourism development [46]. As a result, several models and theoretical perspectives have been employed or developed to help explain the socio-cultural impacts of tourism, especially residents’ perception and attitude towards tourism development [47].
Despite the numerous theoretical frameworks that explain residents’ perception towards tourism and its possible impacts, social exchange theory (SET) is the most utilised one [34]. SET justifies human behaviour or social interaction on the premise of exchanging rewards and costs. Individuals consider starting relationships after analysing rewards and costs involved to maximise benefits and minimise costs [48]. At the community level, perception and attitude towards tourism have been identified by economic, environmental, and sociocultural costs and benefits [30]. At the individual level, SET offers an explanation for research findings to understand why those engaged in tourism-related activities who earn extra benefits have increased positive perception and attitude towards tourism and tourists [30].
Furthermore, during this time of crisis and bleak economy, when people are financially strained, their perceptions and attitudes are subjected to change [49,50,51]. Thus, residents’ perception towards tourism and tourists can be biased and inclined towards a specific direction such as economic gain. Therefore, residents’ receptiveness to tourists and tourism is associated with the extent to which their desires are met and their views are considered [49,51].
Although SET has been predominantly used to explain residents’ perception towards tourism phenomena on the basis of the cost–benefit perspective [52], evidence has suggested that residents’ attachment is an effective factor in the formation of their perception towards cost and benefit [53,54,55]. Generally, place attachment concentrates on the strong feeling of people towards places [56], which consists of at least two distinctive dimensions: place identity and place dependence [57,58]. In a tourism context, place attachment can be related to various aspects, namely residents’ attitudes towards tourism development [53,55,59], place image [54], the effective bond between residents and tourists [58], and iconicity and heritage value of the destination [55]. Due to the ability of place attachment to illustrate residents’ receptiveness towards visitors [55], a host community’s receptiveness can be improved by increasing social interactions and economic gains within the community.
In addition, the interaction between residents and tourists is an important factor in outlining residents’ perception. Residents’ support and receptiveness for both domestic and international tourists are shaped when their expectation is being met [60]. Mensah et al. [61] rationalised that residents of a community are receptive to tourists when their well-being is met by socially responsible tourism corporates. In fact, individual relationships can be reciprocal [62]. Therefore, the nature of residents’ interaction with tourists can affect their receptiveness and perception of tourism in a positive or a negative way [63]. The recent study by Armutlu and colleagues [64] revealed that the host community’s perceived risk of contracting the COVID-19 virus from tourists is an important variable influencing their receptiveness. Consequently, residents’ positive perception towards tourists increases their receptiveness not only to visitors but also to tourism [65].

1.3. Revised SET Framework

In the context of tourism, SET describes the process of exchange between residents of a community and tourists. However, several researchers have doubted its ability in illuminating the antecedents of residents’ perception. For example, Sharpley [66] elaborated that most studies of residents’ perceptions focus on variables that are part of residents’ identity to predict residents’ attitudes but neglect the relationship between residents and tourists.
Although the common understanding of SET is to explain the process of exchange between residents and tourists according to perceived costs and benefits, the relationship among these costs and benefits and their nature is vague [66,67]. For example, although residents prioritised environmental protection over economic gain, they gave priority to the improvement of the standard of living over environmental concerns [68]. Early studies on residents’ attitudes towards tourism generally assumed the homogeneity of residents’ perception or attitudes towards tourism due to sociocultural similarity [69]. In reality, different groups of the community may see tourism differently and perceive its impacts in different ways. The same logic can be applied during crises; the perception and response of different groups of residents towards the risks associated with tourism would vary [70].
Owing to the limitation of SET, several scholars have searched for other theories to explain residents’ perceptions and factors behind them [66,71]. A revised SET framework was introduced by Meeker in 1971. This revised framework was developed according to the theory of reciprocity, which emphasises exchanges between groups of people. It is based upon six rules of exchange: reciprocity, rationality, altruism, group gain, status consistency, and competition [72]. Reciprocity is an important rule of the exchange process. Individuals apply reciprocity rules expecting that their interactions are reliant on others’ actions. In the process of exchange, individuals feel obliged by receiving benefits and in return are committed to returning the favour [72,73].
Rationality justifies the logic behind individual behaviours in accordance with their values and beliefs [72]. Boley and McGehee [71] and Andereck and Valentine [74] used Weber’s theory of rationality to overcome the shortcomings of SET and to understand how the factors associated with residents’ values and beliefs influence their perceptions.
Although altruism implies acting for the benefit of others despite the costs of doing so, the competition rule refers to acting in favour of one’s own benefit, regardless of the harm that such actions may cause to others [72,75]. Group gain has been defined as benefits shared into a “single common pot”, which individuals can benefit from, regardless of their input, and then contribute to the pool when they can [72]. Status consistency indicates the allocation of benefits to individuals according to their membership in a certain group, such as race or gender, which can influence their perceptions [72]. By applying the revised framework of SET, verifying and understanding the influential factors of residents’ perceptions are easy.

1.4. Theoretical Framework

Numerous studies have explored a range of factors affecting residents’ perceptions of tourism and its related impacts [65,74,76,77]. This study investigates the validity of some of these factors and their impacts on shaping residents’ support and receptiveness as claimed by scholars [30,78]. The current study employed a positivist philosophical stance, using a quantitative survey method to collect data. Extensive research has considered the effects of community attachment on constructing residents’ perceptions [77,79]. In early studies, community attachment was considered the function of the length of residency. Later in 1994, McCool and Martin [80] explained that residents’ sense of belonging and length of residency shape community attachment; hence, recent studies have addressed this inadequacy by including items borrowed from the social sciences [81,82]. Nevertheless, contradictory findings revealed the relationship between community attachment and residents’ perception. For instance, Gursoy and Jurowski [83] found no significant effect of community attachment on residents’ perceptions. However, despite a significant positive relationship between community attachment and the positive perception of residents, no relationship was detected between community attachment and negative perceptions. According to the revised SET framework, the group gain rule may explain the relationship between community attachment and residents’ perception. Therefore, the following hypotheses have been driven from the results of previous studies and theoretical background.
Hypothesis 1a.
Place attachment has effects on positive perceptions.
Hypothesis 1b.
Place attachment has effects on negative perceptions.
Economic gain, either through involvement in the tourism industry [74,84] or increase in the level of residents’ income through the enhancement of economic activities in the community [74,77], has an influence on residents’ perceptions towards tourism. SET’s rationality rule rationalises the effects of possible economic factors on residents’ perceptions [74]. Such direct or indirect economic gain is expected to positively affect residents’ perceptions regarding tourism development. Conversely, studies found a non-significant effect of economic gain on residents’ negative perception [83,84]. However, these findings contradict SET’s rationality rule, where these relationships should be significantly negative. The following research hypotheses have been developed:
Hypothesis 2a.
Economic gain has effects on positive perceptions.
Hypothesis 2b.
Economic gain has effects on negative perceptions.
Community involvement in the process of decision making and planning for tourism development has been proven to affect residents’ perceptions [77,79]. Community involvement in the process of planning and decision-making enhances residents’ awareness of the process and benefits of development and empowers them as well [82]. In this study, vendors’ involvement in the process of developing new plans to resume the night market activities is expected to positively affect perception. Therefore, the following hypothesis has been developed to test this relationship:
Hypothesis 3.
Involvement has effects on positive and negative perceptions.
During crisis and economic depression, residents’ perception and attitude are be subjected to change [49,50,51,64]. Consequently, residents’ perceptions towards tourism and its effects may be influenced by specific factors, such as economic gain, more than others. Residents’ receptiveness and support towards tourists and tourism are therefore related to the level which their benefits are met and their views are considered [49,51]. This relationship is assumed to be justified by the altruism rule and competition rule of revised SET. On the basis of the revised framework of SET as well as the above discussions, the following hypotheses can be put forward:
Hypothesis 4a.
Positive perception has an effect on receptiveness.
Hypothesis 4b.
Negative perception has an effect on receptiveness.
Hypothesis 5a.
Positive perception mediates the relationship between place attachment and receptiveness.
Hypothesis 5b.
Negative perception mediates the relationship between place attachment and receptiveness.
Hypothesis 6a.
Positive perception mediates the relationship between economic gain and receptiveness.
Hypothesis 6b.
Negative perception mediates the relationship between economic gain and receptiveness.
Hypothesis 7a.
Positive perception mediates the relationship between involvement and receptiveness.
Hypothesis 7b.
Negative perception mediates the relationship between involvement and receptiveness.

2. Materials and Methods

2.1. Site Selection

Penang, an island-state off the north-western coast of Peninsular Malaysia, was chosen as the research location for this study. Penang is one of the most developed Malaysian states and has a population of 1.77 million people [85]. Considering that Penang has numerous well-preserved heritage buildings, its capital city (George Town) was listed as a UNESCO World Cultural Heritage Site. Moreover, this destination is famous for its beaches, elegant colonial buildings, excellent variety of species of wildlife, diverse and delicious cuisine, and its multi-cultural population. Furthermore, Penang Island has nine night markets (or Pasar Malam in the Malay language), namely Batu Feringghi, Farlim, Paya Terubong, Taman Nibong, Pasar Malam Van Praagh, Kimberley Street Food, Macallum Street, Tanjung Bungah, and Sungai Dua night markets. The night markets are recognised as specific places for those who would like to visit unique local attractions with loud noise, boisterous fun, and delicious street foods. Generally, the vendors begin their work at night markets by preparing the food and selling fruits and vegetables at night markets only a few hours before sunset, when many people are gathered in crowded corridors through smoke and fumes from grills and steaming. In contrast to shopping mall complexes, all night markets are hot, humid, and uncomfortable places. Nonetheless, tourists can find the best bargains and stunning street foods, especially in Penang.
Owing to such specific characteristics and potential breach of the new social restrictions at night markets, a survey was conducted in Penang, Malaysia, which covered a sample of 144 vendors (after data cleaning) from a multi-stage cluster sampling method across Penang Island from 1 September 2020 until 12 September 2020. At the first stage, four out of nine night markets (i.e., Batu Feringghi, Farlim, Kimberley Street Food, and Macallum Street) were randomly chosen. Then, samples within the chosen clusters were randomly selected. A team of interview staff consisting of three postgraduate students was organised and trained to implement the fieldwork and walk from stalls to stalls in four night markets to conduct face-to-face interviews with vendors who were 18 years old or older. The team attempted to contact vendors several times in selected night markets to achieve a high and qualified response rate over the ten days. As Mandarin is generally spoken by the Chinese in Malaysia, the surveys were conducted in English, Malay, and Mandarin according to the respondent’s preference. They required approximately 15 min to complete the survey.

2.2. Survey Instrument

The study is quantitative in nature, thus prompting participants to respond to a set of person-administered questionnaires. Apart from providing their demographic information, participants responded to 23 statements that reflected place attachment, economic gain, involvement, positive perceptions, negative perceptions, and vendors’ receptiveness. Table 1 presents the study variables with respective indicators. The questionnaire survey was adapted from similar questionnaires as used in previous studies with some modifications related to the COVID-19 outbreak [65,79,81,86,87]. The scales were constructed on the basis of a seven-point Likert-scale ranging from 1, representing “extremely disagree” to 7 representing “extremely agree”.
The hypothesis testing was conducted using PLS analysis with the SmartPLS3 software [88]. PLS was chosen because of its appropriateness to the exploratory nature of the study model, in which some of the hypothesised relationships between the variables had not undergone previous testing. Moreover, PLS is more appropriate when a research model is at its infancy and avoids the limitations of covariance-based SEM such as sample size and restrictions stemming from modelling complexity [89]. Nonparametric bootstrapping with 1000 replications was applied to test the significance of the path coefficient between latent variables as well as between the latent variables and respective manifest variables.

3. Results

3.1. Respondent Profiles

Among the 144 responses, all standardised values were within the range of −4 to 4 as suggested by Mertler and Reinhart [90], given that no outlier exists in the dataset. The average age of the respondents was 45 years (SD = 14.54), and 57% of the respondents were male. In terms of length of work at night markets, nearly 70% of the respondents had worked at night markets for more than five years (M = 13.88, SD = 12). Table 2 shows other socio-demographic characteristics of respondents, which show that the majority were Malaysian citizens, and the Chinese had completed secondary education, were married and lived with their family.

3.2. Measurement Model Results

Partial least square structural equation modelling (PLS-SEM) was used to assess the study hypotheses. To assess the validity and reliability of the measurements, several criteria were considered. The measurement model evaluation requires outer loadings, convergent validity, composite reliability, and discriminant validity. As suggested by Hair et al. [91], the outer loadings must be above 0.4. The analysis indicated that two items (i.e., attachment6 and attachment7) had outer loadings lower than 0.4, resulting in a removal of these two items. A modified model produced acceptable factor loadings for all items as shown in Table 3. The final analysis shows that the smallest outer loading value was 0.726 (Receptive5). To assess the reliability, the threshold value of Cronbach’s Alphas, rho-A, and composite reliability for a given construct was 0.7. Table 4 posits that all the constructs have reliability value more than 0.70. The measure of convergent validity is the average variance extracted for which the threshold value is 0.5 [92].
Moreover, the discriminant validity was examined using (1) the criterion suggested by Fornell and Larcker [92], where the square root of AVEs of each construct was ensured to be greater than the correlation estimate between constructs (see Table 4); (2) if the outer loading values on the respective constructs were greater than their cross-loadings on other constructs (see Table 3) and (3) the Heterotrait–Monotrait (HTMT) ratio and confidence interval. The liberal threshold values for the HTMT ratio and corresponding confidence interval are less than 0.85 and 1, respectively [93]. Table 4 shows that the square root of AVE exceeds the inter-correlations of the constructs in the model and suggests that the measure had adequate discriminant validity [94]. Consequently, HTMT ratios and the corresponding confidence intervals for each pair are less than 0.85 and 1, respectively (Table 5). Hence, the model possesses both convergent and discriminant validity.
Additionally, the possibility of common method variance was examined by using Harman’s one-factor test [95]. According to these authors, common method variance occurs when only one factor emerges from a factor analysis or when the first factor explains more than 50% of the variance. In this light, all the items for the constructs were introduced into a factor analysis, and the unrotated matrix indicates that the first factor explains 39% of the variance. As such, common method variance is not an issue in this study.

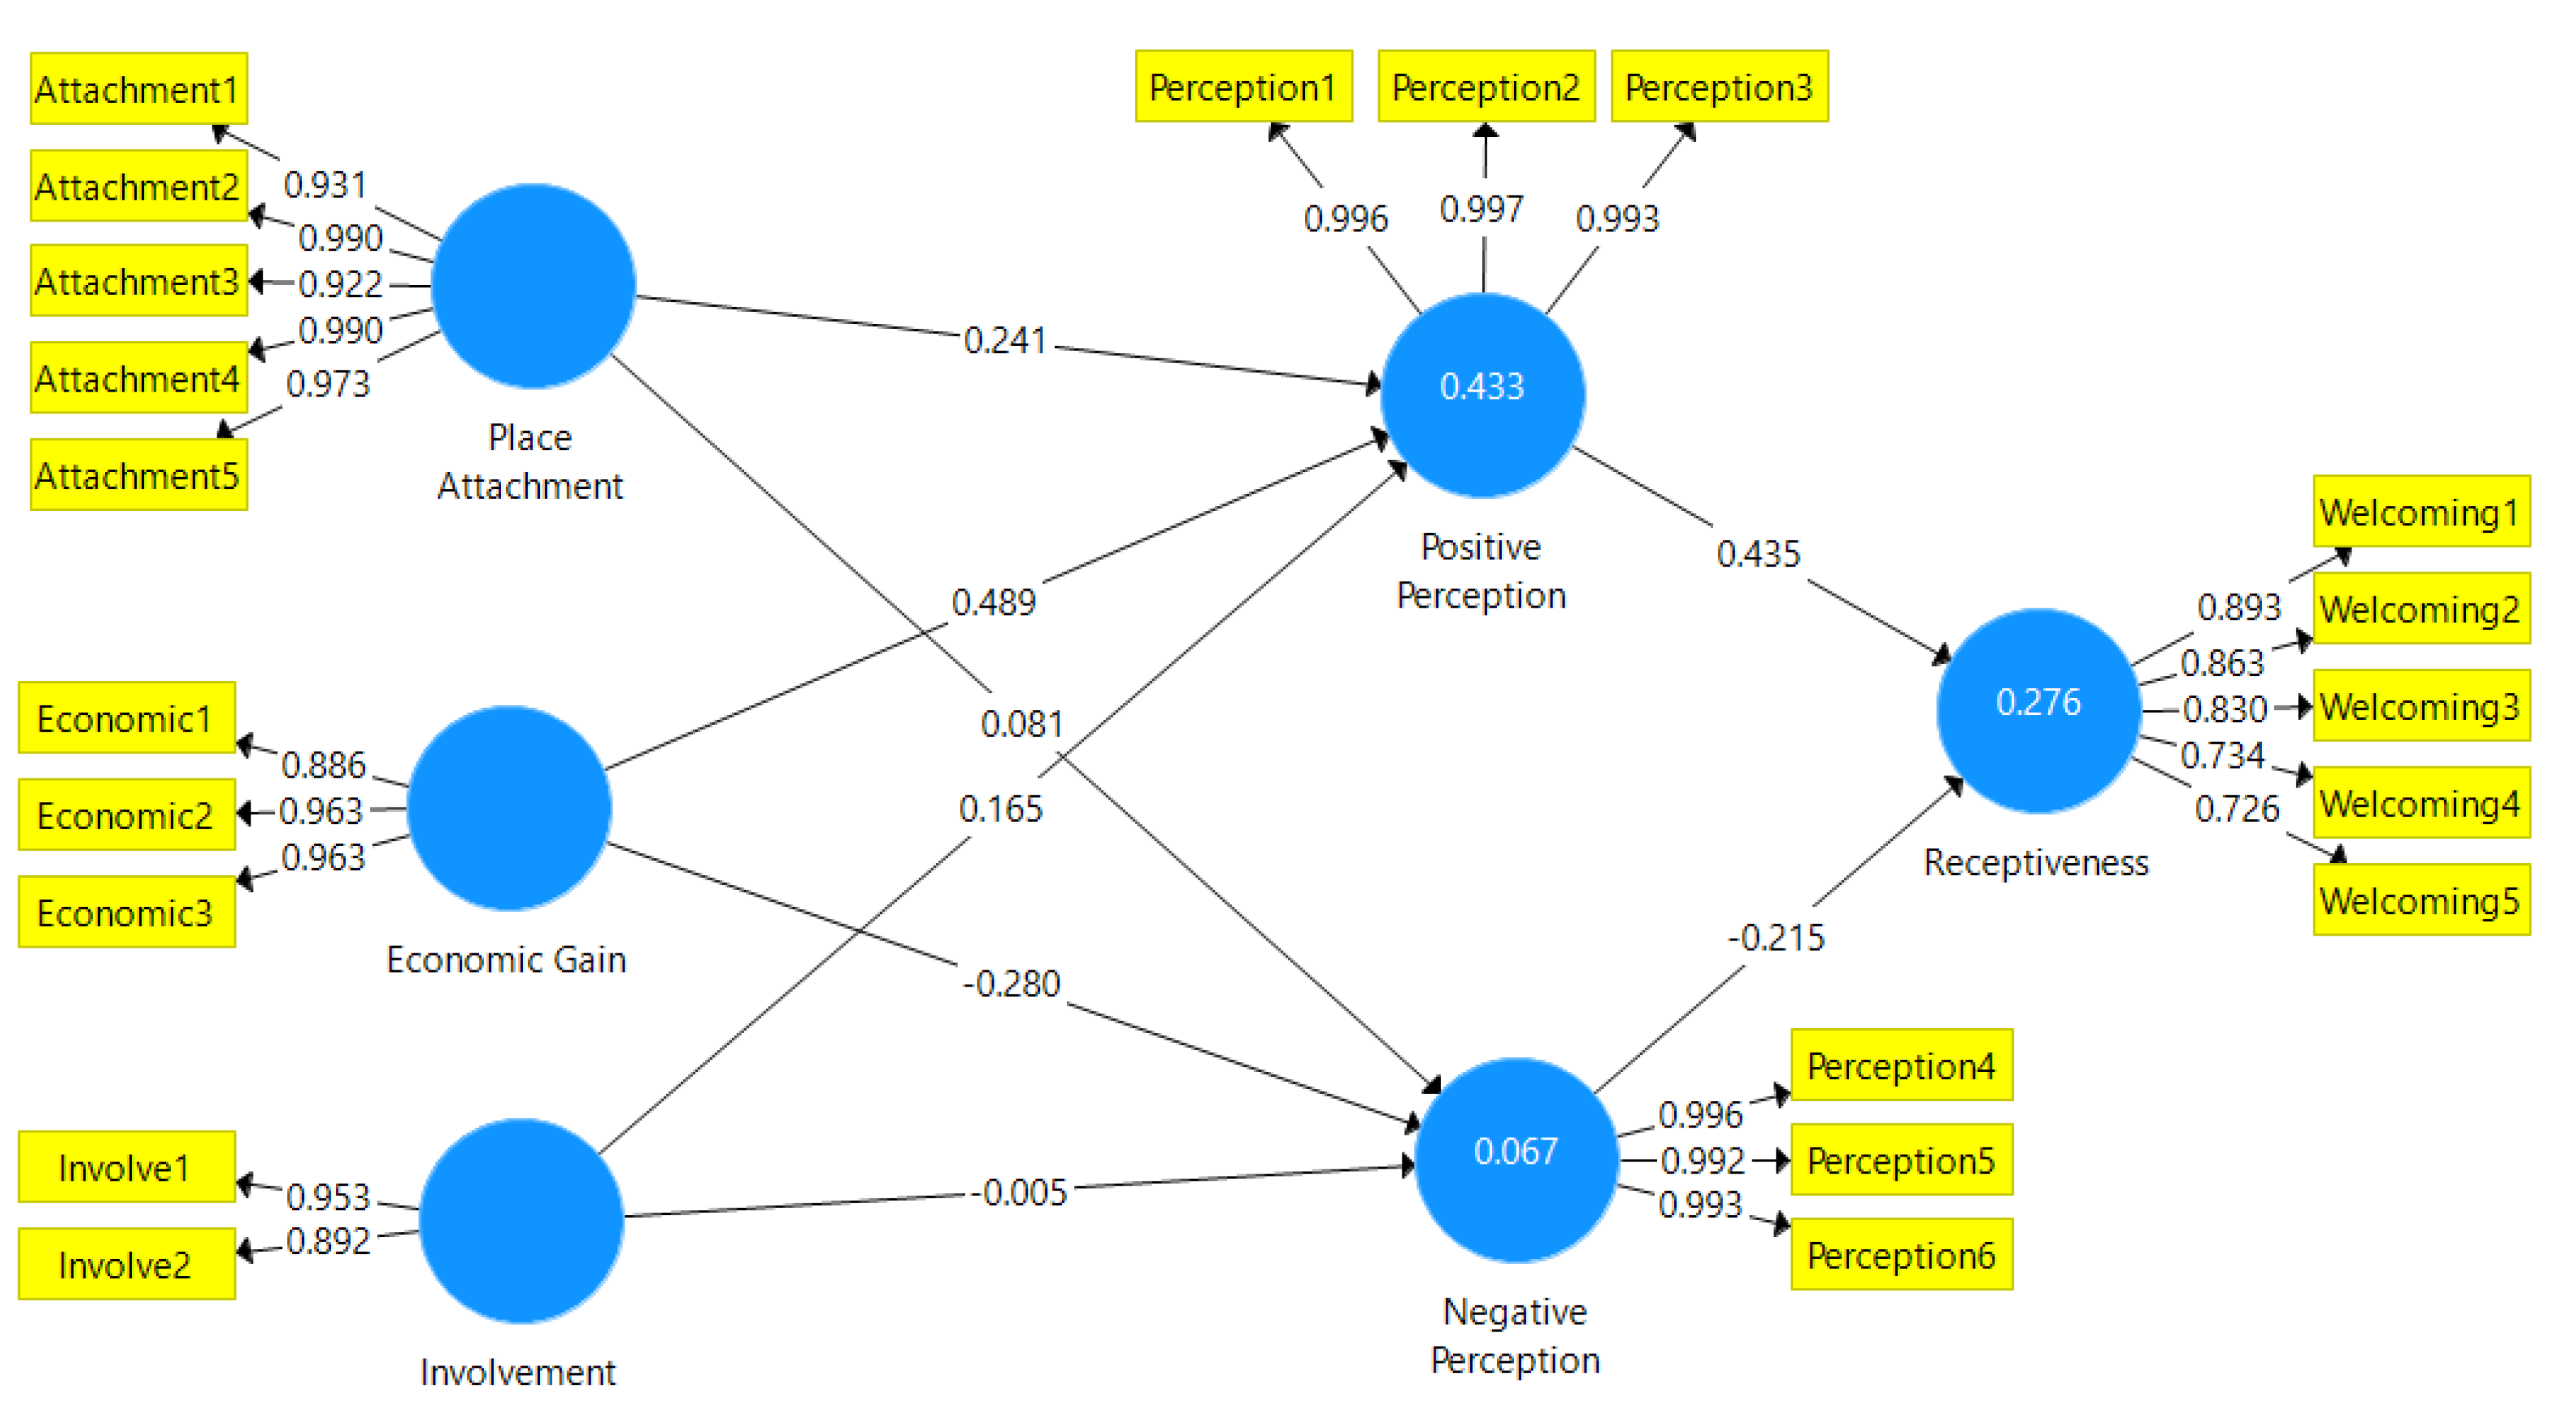
3.3. Assessment of the Structural Model

3.3.1. Direct Effects

Table 6 depicts the results of the path analysis used to test the hypothesis of direct effects among latent variables. The results indicated that the effect of place attachment on positive perception is positive and significant (β = 0.241, p < 0.01), whereas the effect of place attachment on negative perception is insignificant (β = 0.081, p > 0.05). In terms of economic gain, it has significant effects on both positive (β = 0.489, p < 0.01) and negative perceptions (β = −0.280, p < 0.01). As shown in Figure 1, the results indicated the significant effect of involvement on positive perception (β = 0.165, p < 0.01), but not on negative perception (β = −0.005, p > 0.01). Furthermore, both positive (β = 0.435, p < 0.01) and negative (β = −0.215, p < 0.01) perceptions have significant effects on receptiveness towards international tourists. The positive relationship between positive perception and receptiveness implies high levels of positive perceptions and association with high levels of vendors’ receptiveness towards international tourists. However, the results further demonstrated that a high level of negative perception is associated with a low level of receptiveness. Hence, the results support H1a, H2a, H2b, H3a, H4a, and H4b but not H1b and H3b. The R2 value for receptiveness is 26.7%.

3.3.2. Indirect Effects

This study estimates six mediating relationships. Table 7 depicts the results of path analysis used to test the hypothesis of indirect effects. The t values were computed through a bootstrapping procedure suggested by Hayes [96] with 1000 samples by reading the specific indirect effect from the PLS output. Table 7 shows that the t values of three indirect effects (H5a, H6a, and H7a) are significant at 0.01 level. This finding indicates that positive perception mediates the relationship between three independent variables and receptiveness. However, negative perception does not mediate the aforementioned relationships.
The computation of the strength of mediation is important in the context of a concluding decision about the mediation effects. As suggested by Hair et al. [91], the strength of a mediation effect was computed by incorporating the variance accounted for (VAF) method, where VAF > 80% implies full mediation, 20% ≤ VAF ≤ 80% indicates partial mediation, and VAF < 20% is an indication of no mediation. The VAF was calculated to estimate the magnitude of the indirect effect by dividing the indirect effect by the total effect [97]. The VAF value indicates that approximately 78% of the total indirect effect of economic gain on receptiveness are explained by the partial mediating effect of positive perception (Table 7). The results further suggest that the relationship between place attachment and receptiveness is fully mediated by positive perception, as the VAF presented a value greater than 80% (i.e., 100%). In addition, the relationship between involvement and receptiveness is fully mediated by positive perception. Hence, indirect-only mediation was supposed because the last two indirect effects were fully mediated by positive perception [91].
On the basis of the R2 values, the result reveals that approximately 43% of the variance in positive perception are explained by place attachment, economic gain, and involvement, whereas economic gain explains approximately 7% of the variance in negative perception. However, five variables, place attachment, economic gain, involvement, and positive and negative perceptions reasonably explain 27% of the variance in receptiveness. The purpose of calculating the effect size (f2) is to estimate the extent of the influence of an independent latent variable on the dependent variable. Effect size is based on the change in the coefficient of determination (R2). According to Chin [98], the values of 0.02, 0.15, and 0.35 represent the levels of effect size as small, moderate, and substantial, respectively. Table 6 shows that the f2 for place attachment and economic gain on positive perception were 0.084, and 0.068, respectively. However, economic gain has a substantial impact on positive perception (f2 = 0.343) and a small impact on negative perception (f2 = 0.068). Meanwhile, positive and negative perceptions have substantial and small impacts on receptiveness, respectively.
We evaluated for multicollinearity among the variables in the model and did not find any cause for concern by using the criteria of variance inflation factor (VIF), which were (Table 6) all below the suggested threshold of 5.00 [99]. Shmueli et al. [100] suggested that the predictive relevance of the model through the blindfolding procedure should be examined. The Q2 values for positive perception (Q2 = 0.401), negative perception (Q2 = 0.054), and receptiveness (Q2 = 0.155) are > 0, suggesting that the model has sufficient predictive relevance.

4. Conclusions and Discussion

This study aimed to evaluate vendors’ attitudes and receptiveness towards international tourists after the COVID−19 outbreak in Malaysia’s night markets. The significance of the study is apparent from the fact that tourists’ shopping behaviour is based on the mobility, social relationship, and physical contact between vendors and consumers [36], and such activities potentially breach the new social restrictions at night markets during the pandemic. With respect to this specific topic, although an enormous amount of work has been carried out on psychological reactance in an online context, many studies have neglected the issue of the current pandemic regarding vendors of night markets with low-paid jobs and vendors’ perceptions on tourists [14]. Therefore, a critical gap exists in the challenges of non-online shopping due to the COVID−19 pandemic that must be filled experimentally and theoretically [101]. The study is also important given its practical focus on vendors’ attitudes and their receptiveness towards international tourists which is missing in the night market literature [17,102].
However, the current research has considered a similar approach as the studies conducted by Gössling and Scott [14] and Ntounis and Mumford [103], who proved that the tourist shopping as well as food places and services have been affected by COVID−19, but food service has been seriously affected due to limited liquidity, small profit margins [14], and COVID transmission through food [104]. In non-shopping malls, such as a night markets, the situation is more vulnerable, especially in Malaysia, because most of the vendors are categorised in the B40 (bottom 40% of people), where their incomes are under 3000 MYR (700 US Dollars) per month. The research finding revealed that more than 65% of respondents are from the low-income group of the community, and the result is consistent with that of prior research in Vietnam [105], Colombia [102], Philippines [106], India [107], and Peru [108].
By employing revised SET as a theoretical framework, this study developed and empirically tested a conceptual model for understanding the vendors’ attitudes and their receptiveness towards international tourists during the COVID−19 pandemic and potential breach of the social distancing at night markets. This model employed the predictors (i.e., place attachment, economic gain and involvement), outcomes (receptiveness) and mediating role of perceptions, both positive and negative, among vendors towards international tourists due to the COVID-19 pandemic.
The current study extends the scientific literature by contributing to the understanding of the role and influence of positive and negative effects on the relationship between vendors’ attitudes and their receptiveness towards international tourists after the COVID-19 outbreak in Malaysia’s night markets. Findings revealed that place attachment has a significant effect on positive perception but not negative perception. These results are consistent with the findings of previous studies [54,109]. Moreover, the positive perceptions towards international tourists significantly and positively mediate the relationship between place attachment, economic gain, and involvement with receptiveness. This result ties well with previous studies, wherein the quality interaction between residents’ and tourists positively affect their perception [63] and consequently results in residents’ receptiveness [62,64].
In line with SET’s rationality rule, we found a significant and positive relationship between economic gain and positive perceptions, whereas, contrary to a previous study [83], we found a negative association between economic gain and negative perceptions. This finding implies that economic gains decrease when negative perceptions increase.
The results suggest that vendors’ perceived attachment to the night market, their economic gains based on the tourists and their involvement towards decision-making in night markets were associated with positive perceptions. Consequently, positive perceptions increase their receptiveness towards international tourists during the COVID-19 pandemic. This pattern of observation has been shown in a previous work during normal situations [65], and a recent study by Armutlu and colleagues [64] disclosed that perceived risk of contracting the COVID-19 virus from tourists determines their receptiveness.
Findings revealed that involvement has a significant effect on positive perception but not negative perception. Although a large body of literature has found a significant relationship between place attachment and residents’ perceptions towards tourists [54,77,109], the results of the current study found no significant association between place attachment and negative perceptions among vendors in the study area. This finding is consistent with a previous work, which found no significant relationship between place attachment and positive perceptions [83].

Theoretical and Practical Implications

This study has a number of theoretical and practical implications. From a theoretical perspective, the current study applied the revised SET into tourist shopping field through Malaysian night markets. Nowadays, tourist shopping is more than a process of selling or buying for daily needs, but it is considered a popular tourist attraction that promotes culture and social life of the host community [110]. Despite SET’s abilities to assess the residents’ perception towards tourism impacts [33], the current study has employed SET as a qualified conceptual perspective to evaluate the effect of the COVID-19 outbreak perception on vendors’ attitude, perception, and behaviour after reopening borders and resuming international tourists’ visit and shopping in night markets. The results of this study indicate new perspectives concerning the role that perceptions play between vendors’ attitudes and receptiveness. Therefore, this study illustrates how psychological mechanisms shape vendors’ attitudes related to international tourists during health risk situations. The research findings created a framework for a clear understanding of crisis-gain of vendors. Given that the literacy level of respondents was low, and most of them (75%) had completed primary and secondary school, finding a significant number of vendors who have inattention to or distractibility from health protocols is expected. The results further reveal that respondents pay attention to health protocols and closely follow TV, radio, and social media in response to the COVID-19 outbreak. This finding is inconsistent with past studies, which found that those with inadequate or lower literacy levels lack awareness about health and have illness more than adults with high literacy [111,112].
Furthermore, the results show a high level of involvement among vendors to improve the management of night markets, and they would prefer to reopen the borders and resume the acceptance of international tourists to gain increased benefits and income. The findings have pointed out that vendors have income insecurity and instability, which are in line with previous studies [105]. Therefore, residents’ receptiveness towards tourists and tourism is associated with the extent to which their desires are met.
Meanwhile, the current study suggests practical implications for the tourism industry and informal economy sectors of Malaysia. Malaysian informal workers are working in manufacturing, accommodation, wholesale and retail trade and food services, but they are recognised as the most vulnerable workers. Whilst 16% of Malaysia’s labour force are above 50 years old, this age group increases to 29% among the self-employed [85]. In the world, the average age of vendors lies between 51 to 65 years (Otto and Varner, 2005), but the average age of this study respondents was 45 years, 30% of whom were above 50 years of old. Most of them have poor access to medical and health services. From the economic aspect, they have no alternative income sources during lockdown or they lose their current job. Consequently, vendors obviously have no income during the lockdown period. The findings reveal that 64% of vendors have monthly incomes below 3000 MYR (700 USD); however, approximately 40% of Malaysian households have income levels below 3000 MYR. Thus, 53% of vendors can possibly avoid investing in their current job, and they would prefer to change them. Remarkably, the night market is one of the top tourist attractions for both leisure tourists and business travellers [23], and it can promote socialisation and the region’s special cultural features [110]. However, the intention of vendors to change their job contradicts authorities’ strategies to develop the cultural tourism of Penang as George Town was awarded as a world heritage site by UNESCO.
Although the tourism sector depends heavily on social actors [113], the weak economic background of street vendors aggravates the issues of night markets in competition with shopping complexes. With regard to the role of shopping tourism on tourism industry development and owing to travel restrictions for international tourists in the past nine months, national and local authorities applied financial strategies to support street vendors by stimulating demands for the domestic travels to mitigate the impacts of COVID-19.
Although the study found no significant mediating roles of negative perceptions of vendors towards international tourists on the relationship between vendors’ attitudes and receptiveness of vendors towards visitors, the current pandemic disease obviously increases tourists’ uncertainty level and makes them sensitive about the crisis. As tourist trust has a significant positive impact on destination image [114], street vendors and night market managements must be prepared and apply health instruction with strict compliance to increase tourist satisfaction, as the latter has strong health considerations.
Despite the success demonstrated, some study limitations should be acknowledged. Firstly, one limitation of this work is that no information exists for positive COVID-19 cases among night market vendors. Data on this matter are important to assess health risk levels at night markets and their intention to follow health protocols. Hence, future studies can conduct direct observations along with the questionnaire survey to assess vendors’ activities with compliance to health protocols. Secondly, this study is a cross-sectional study, thereby preventing the drawing of generalisability of the study findings as well as the causality of the relationships. Therefore, we believe that additional longitudinal data are needed to validate the study findings and to test the study model during conditional MCO as has been announced by the Malaysian government. Another limitation refers to the number of samples. Gathering a sufficient number of data can be a difficult process, especially during MCO. As reported earlier, four out of nine night markets in Penang were chosen as the study areas. A larger sample size in Penang and other states in Malaysia should be gathered in future studies. In existing practice, one of the existing modelling limitations is taking into consideration the viewpoints of practitioners and academics towards the COVID-19 pandemic and their perspectives on the federal and state governments’ actions towards the international tourists. In future works, it may be useful to study particular aspects of local government actions towards controlling the COVID−19 pandemic in relation to international tourists. Although not a primary objective of our analysis, another caveat refers to the evaluation of the impact of governmental recovery strategies on different sectors of the tourism industry in Malaysia, especially small businesses such as night markets, to mitigate the impacts of COVID−19. Finally, based on stakeholder theory, the roles/failures of key stakeholders such as public, private, and civic society on prevention of the disease diffusion is worth further investigation.

Author Contributions

Conceptualization, M.J.M.T. and N.S.; methodology, M.H.M. and G.A.; software, M.H.M.; validation, M.J.M.T. and M.H.M.; writing—original draft preparation, M.J.M.T. and G.A.; writing—review and editing, M.J.M.T. and M.H.M.; project administration, M.J.M.T. and N.S.; funding acquisition, N.S. All authors have read and agreed to the published version of the manuscript.

Funding

The research was funded by the Ministry of Higher Education, Malaysia, via Fundamental Research Grant Scheme (FRGS) grant number 203/PHUMANITI/671109.

Institutional Review Board Statement

Not applicable.

Informed Consent Statement

Not applicable.

Data Availability Statement

The data used to support the findings of this study are available from the corresponding author by request.

Acknowledgments

The authors would like to thank the vendors who have agreed to participate in the survey carried out for this study.

Conflicts of Interest

The authors declare no conflict of interest.

References

  1. Yang, Y.; Zhang, H.; Chen, X. Coronavirus pandemic and tourism: Dynamic stochastic general equilibrium modeling of infectious disease outbreak. Ann. Tour. Res. 2020, 83, 102913. [Google Scholar] [CrossRef] [PubMed]
  2. WHO. WHO Announces COVID−19 Outbreak a Pandemic; World Health Organization: Geneva, Switzerland, 2020. [Google Scholar]
  3. WHO. WHO Coronavirus Disease (COVID−19) Dashboard; World Health Organization: Geneva, Switzerland, 2020. [Google Scholar]
  4. Kraemer, M.U.; Yang, C.-H.; Brownstein, J.S.; Layan, M.; Vespignani, A.; Tian, H.; Dye, C.; Pybus, O.G.; Scarpino, S.V.; Gutiérrez, B.; et al. The effect of human mobility and control measures on the COVID-19 epidemic in China. Science 2020, 368, 493–497. [Google Scholar] [CrossRef] [PubMed] [Green Version]
  5. Lapointe, D. Reconnecting tourism after COVID-19: The paradox of alterity in tourism areas. Tour. Geogr. 2020, 22, 633–638. [Google Scholar] [CrossRef]
  6. Chin, C.-L.; Lo, M.-C.; Bin Razak, Z.; Pasbakhsh, P.; Mohamad, A.A. Resources Confirmation for Tourism Destinations Marketing Efforts Using PLS-MGA: The Moderating Impact of Semirural and Rural Tourism Destination. Sustainability 2020, 12, 6787. [Google Scholar] [CrossRef]
  7. Mostafanezhad, M. Covid-19 is an unnatural disaster: Hope in revelatory moments of crisis. Tour. Geogr. 2020, 22, 639–645. [Google Scholar] [CrossRef]
  8. UNWTO. International Tourist Numbers Could Fall 60−80% in 2020; Unwto Reports; World Tourism Organization: Geneva, Switzerland, 2020. [Google Scholar]
  9. Sio-Chong, U.; So, Y.-C. The impacts of financial and non−financial crises on tourism: Evidence from Macao and Hong Kong. Tour. Manag. Perspect. 2020, 33, 100628. [Google Scholar]
  10. Farzanegan, M.R.; Gholipour, H.F.; Feizi, M.; Nunkoo, R.; Andargoli, A.E. International Tourism and Outbreak of Coronavirus (COVID-19): A Cross-Country Analysis. J. Travel Res. 2020, 0047287520931593. [Google Scholar] [CrossRef]
  11. Connell, J. ‘Timeless Charm’: Tourism and development in Southeast Asia. In Routledge Handbook of Southeast Asian Development; Routledge: Abingdon-on-Thames, UK, 2018; pp. 153–168. [Google Scholar]
  12. Tilaki, M.J.M.; Abdullah, A.; Bahauddin, A.; Marzbali, M.H. The Necessity of Increasing Livability for George Town World Heritage Site: An Analytical Review. Mod. Appl. Sci. 2013, 8, 123. [Google Scholar] [CrossRef]
  13. Department of Statistics Malaysia. Employment Statistics First Quarter 2020; Department of Statistics Malaysia: Putrajaya, Malaysia, 2020.
  14. Gössling, S.; Scott, D.; Hall, C.M. Pandemics, tourism and global change: A rapid assessment of COVID-19. J. Sustain. Tour. 2020, 29, 1–20. [Google Scholar] [CrossRef]
  15. Choi, M.J.; Heo, C.Y.; Law, R. Progress in Shopping Tourism. J. Travel Tour. Mark. 2015, 33, 1–24. [Google Scholar] [CrossRef]
  16. Kozak, M. Bargaining Behavior and the Shopping Experiences of British Tourists on Vacation. J. Travel Tour. Mark. 2015, 33, 1–13. [Google Scholar] [CrossRef]
  17. Azmi, A.; Abdullah, A.; Nurhidayati, S.E.; Shaw, G. Shopping and Tourism: A STATE−OF−THE−ART REVIEW. Hamdard Islamicus 2020, 43, 639–655. [Google Scholar]
  18. Som, A.P.M.; Mohammad, B.A.A.; Ibrahim, H.M.H. Shopping motivation factors at tourist night markets. J. Tour. 2010, 11, 69–78. [Google Scholar]
  19. Egresi, I.; Polat, D. Assessing Tourists’satisfaction with Their Shopping Experience in Istanbul. Geoj. Tour. Geosites 2016, 10, 172–186. [Google Scholar]
  20. Moscardo, G.; Benckendorff, P.; Murphy, L. Exploring patterns of satisfaction and shopping motivation in a tourist shopping village. In Proceedings of the TTRA 2011: 42nd Annual Travel and Tourism Research Conference, London, UK, 19–21 June 2011. [Google Scholar]
  21. Lew, A.A. Pedestrian shopping streets and urban tourism in the restructuring of the Chinese city. Tour. Power Space 2006, 164–184. [Google Scholar] [CrossRef]
  22. Balsas, C.J. The role of public markets in urban habitability and competitiveness. J. Place Manag. Dev. 2019, 13, 30–46. [Google Scholar] [CrossRef]
  23. Lee, D.; Pearce, P. Shining a light on Asian night markets: Vendors’ and visitors’ views. Int. J. Tour. Cities 2020, 6, 467–484. [Google Scholar] [CrossRef]
  24. Swanson, K.K.; Horridge, P.E. Travel motivations as souvenir purchase indicators. Tour. Manag. 2006, 27, 671–683. [Google Scholar] [CrossRef]
  25. Akansel, I. Examining the Relationship between Economics and Philosophy; IGI Global: Hershey, PA, USA, 2019. [Google Scholar]
  26. Chin, O.; Harun, M. Night market: A platform for creating new entrepreneurs. Humanit. Soc. Sci. 2015, 3, 32–36. [Google Scholar] [CrossRef] [Green Version]
  27. Hung, H.-K.; Wu, C.-C. Impact of night markets on residents’ quality of life. Soc. Behav. Pers. Int. J. 2020, 48, 1–12. [Google Scholar] [CrossRef]
  28. Chang, J.; Chiang, C.H. Segmenting American and Japanese Tourists on Novelty-seeking at Night Markets in Taiwan. Asia Pac. J. Tour. Res. 2006, 11, 391–406. [Google Scholar] [CrossRef]
  29. Blau, P. Power and Exchange in Social Life; J Wiley & Sons: New York, NY, USA, 1964. [Google Scholar]
  30. Ward, C.; Berno, T. Beyond social exchange theory: Attitudes toward tourists. Ann. Tour. Res. 2011, 38, 1556–1569. [Google Scholar] [CrossRef]
  31. Emerson, R.M. Social Exchange Theory. Annu. Rev. Sociol. 1976, 2, 335–362. [Google Scholar] [CrossRef]
  32. Bhat, A.A.; Majumdar, K.; Mishra, R.K. Local support for tourism development and its determinants: An empirical study of Kashmir region. Asia Pac. J. Tour. Res. 2020, 25, 1232–1249. [Google Scholar] [CrossRef]
  33. Phuc, H.N.; Nguyen, H.M. The importance of collaboration and emotional solidarity in residents’ support for sustainable urban tourism: Case study Ho Chi Minh City. J. Sustain. Tour. 2020, 1–20. [Google Scholar] [CrossRef]
  34. Gursoy, D.; Chi, C.G.; Dyer, P. Locals’ Attitudes toward Mass and Alternative Tourism: The Case of Sunshine Coast, Australia. J. Travel Res. 2009, 49, 381–394. [Google Scholar] [CrossRef]
  35. Fredline, E.; Faulkner, B. Chapter 5. Host Community Reactions: A Cluster Analysis. Progress. Tour. Res. 2003, 27, 114–135. [Google Scholar] [CrossRef]
  36. Jin, H.; Moscardo, G.; Murphy, L. Making sense of tourist shopping research: A critical review. Tour. Manag. 2017, 62, 120–134. [Google Scholar] [CrossRef]
  37. Ministry of Health Malaysia (MoH). Covid−19 Malaysia Update. 2020. Available online: http://covid−19.moh.gov.my (accessed on 25 December 2020).
  38. Sabri, I. Malaysia not only Country Affected by Third Covid−19 Wave. 2020. Available online: https://www.nst.com.my/news/nation/2020/10/632353/malaysia−not−only−country−affected−third−covid−19−wave (accessed on 25 December 2020).
  39. Subhani, O. No Half Measures for Singapore. 2020. Available online: https://www.straitstimes.com/business/economy/no−half−measures−for−singapore (accessed on 21 December 2020).
  40. KPMG. Malaysia Government and Institution Measures in Response to COVID−19. 2020. Available online: https://home.kpmg/xx/en/home/insights/2020/04/malaysia−government−and−institution−measures−in−response−to−covid.html (accessed on 23 December 2020).
  41. Bank Negara Malaysia (BNM). Measures to Address COVID−19 Impact. 2020. Available online: https://www.bnm.gov.my/o/covid−19/index.html (accessed on 22 December 2020).
  42. The International Monetary Fund (IMF). Policy Responses to COVID−19. 2020. Available online: https://www.imf.org/en/Topics/imf−and−covid19/Policy−Responses−to−COVID−19#M (accessed on 23 December 2020).
  43. Hao, H.; Long, P.; Kleckley, J. Factors predicting homeowners’ attitudes toward tourism: A case of a coastal resort community. J. Travel Res. 2011, 50, 627–640. [Google Scholar] [CrossRef]
  44. Nunkoo, R.; Ramkissoon, H. Power, trust, social exchange and community support. Ann. Tour. Res. 2012, 39, 997–1023. [Google Scholar] [CrossRef]
  45. Stronza, A.; Gordillo, J. Community views of ecotourism. Ann. Tour. Res. 2008, 35, 448–468. [Google Scholar] [CrossRef]
  46. Afthanorhan, A.; Awang, Z.; Fazella, S. Perception of Tourism Impact and Support Tourism Development in Terengganu, Malaysia. Soc. Sci. 2017, 6, 106. [Google Scholar] [CrossRef] [Green Version]
  47. Pham, L.; Kayat, K. Residents’ perceptions of tourism impact and their support for tourism development: The case study of Cuc Phuong National Park, Ninh Binh province, Vietnam. Eur. J. Tour. Res. 2011, 4, 123–146. [Google Scholar]
  48. Homans, G.C.; Behavior, S. Its elementary forms. Soc. Behav. 1961, 119, 488–531. [Google Scholar]
  49. Hateftabar, F.; Chapuis, J.M. How resident perception of economic crisis influences their perception of tourism. J. Hosp. Tour. Manag. 2020, 43, 157–168. [Google Scholar] [CrossRef]
  50. Garau-Vadell, J.B.; Gutierrez-Taño, D.; Diaz-Armas, R. Economic crisis and residents’ perception of the impacts of tourism in mass tourism destinations. J. Destin. Mark. Manag. 2018, 7, 68–75. [Google Scholar] [CrossRef]
  51. Voon, J.P.; Voon, J.C. A structural model of consumption: An application to China during the global financial crisis. J. Socio-Econ. 2012, 41, 284–288. [Google Scholar]
  52. Martín, H.S.; de Los Sánchez, M.M.G.; Herrero, Á. Residents’ attitudes and behavioural support for tourism in host communities. J. Travel Tour. Mark. 2017, 35, 231–243. [Google Scholar] [CrossRef]
  53. Hu, B.; Tuou, Y.; Liu, J. How Does Destination Social Responsibility Impact Residents&rsquo; Pro-Tourism Behaviors? The Mediating Role of Place Attachment. Sustainability 2019, 11, 3373. [Google Scholar] [CrossRef] [Green Version]
  54. Ganji, S.F.G.; Johnson, L.W.; Sadeghian, S. The effect of place image and place attachment on residents’ perceived value and support for tourism development. Curr. Issues Tour. 2020, 1–15. [Google Scholar] [CrossRef]
  55. Woosnam, K.M.; Aleshinloye, K.D.; Ribeiro, M.A.; Stylidis, D.; Jiang, J.; Erul, E. Social determinants of place attachment at a World Heritage Site. Tour. Manag. 2018, 67, 139–146. [Google Scholar] [CrossRef]
  56. Hidalgo, M.; Hernández, B. Place Attachment: Conceptual and Empirical Questions. J. Environ. Psychol. 2001, 21, 273–281. [Google Scholar] [CrossRef]
  57. Strzelecka, M.; Boley, B.B.; Woosnam, K.M. Place attachment and empowerment: Do residents need to be attached to be empowered? Ann. Tour. Res. 2017, 66, 61–73. [Google Scholar] [CrossRef]
  58. Woosnam, K.M.; Aleshinloye, K.D.; Strzelecka, M.; Erul, E. The Role of Place Attachment in Developing Emotional Solidarity With Residents. J. Hosp. Tour. Res. 2018, 42, 1058–1066. [Google Scholar] [CrossRef]
  59. Ramkissoon, H.; Weiler, B.; Smith, L.D.G. Place attachment and pro-environmental behaviour in national parks: The development of a conceptual framework. J. Sustain. Tour. 2012, 20, 257–276. [Google Scholar] [CrossRef] [Green Version]
  60. Ramkissoon, H. Perceived social impacts of tourism and quality-of-life: A new conceptual model. J. Sustain. Tour. 2020, 1–17. [Google Scholar] [CrossRef]
  61. Mensah, C.; Kugbonu, M.A.; Reiser, D. CSR in Tourism. In Encyclopedia of Sustainable Management; Springer Science and Business Media LLC: Berlin/Heidelberg, Germany, 2020; pp. 1–8. [Google Scholar]
  62. Page, S.J.; Connell, J. Tourism: A Modern Synthesis; Routledge: Oxon, UK, 2020. [Google Scholar]
  63. Udoh, I.S. Hospitality of the People at the Tourism Destination and Destination Attractiveness of Akwa Ibom State, Nigeria. Int. J. Res. 2019, 5, 1–7. [Google Scholar]
  64. Armutlu, M.E.; Bakır, A.C.; Sönmez, H.; Zorer, E.; Alvarez, M.D. Factors affecting intended hospitable behaviour to tourists: Hosting Chinese tourists in a post-Covid-19 world. Anatolia 2020, 1–14. [Google Scholar] [CrossRef]
  65. Wang, Y.; Pfister, R.E. Residents’ Attitudes Toward Tourism and Perceived Personal Benefits in a Rural Community. J. Travel Res. 2008, 47, 84–93. [Google Scholar] [CrossRef]
  66. Sharpley, R. Host perceptions of tourism: A review of the research. Tour. Manag. 2014, 42, 37–49. [Google Scholar] [CrossRef]
  67. Kayat, K. Power, social exchanges and tourism in Langkawi: Rethinking resident perceptions. Int. J. Tour. Res. 2002, 4, 171–191. [Google Scholar] [CrossRef]
  68. Liu, J.C.; Var, T. Resident attitudes toward tourism impacts in Hawaii. Ann. Tour. Res. 1986, 13, 193–214. [Google Scholar] [CrossRef]
  69. Gursoy, D.; Ouyang, Z.; Nunkoo, R.; Wei, W. Residents’ impact perceptions of and attitudes towards tourism development: A meta-analysis. J. Hosp. Mark. Manag. 2019, 28, 306–333. [Google Scholar] [CrossRef]
  70. Qiu, R.T.R.; Songb, H.; Na Lic, S.; Songb, H. Social costs of tourism during the COVID-19 pandemic. Ann. Tour. Res. 2020, 84, 102994. [Google Scholar] [CrossRef]
  71. Boley, B.B.; McGehee, N.G.; Perdue, R.R.; Long, P. Empowerment and resident attitudes toward tourism: Strengthening the theoretical foundation through a Weberian lens. Ann. Tour. Res. 2014, 49, 33–50. [Google Scholar] [CrossRef]
  72. Cropanzano, R.; Mitchell, M.S. Social Exchange Theory: An Interdisciplinary Review. J. Manag. 2005, 31, 874–900. [Google Scholar] [CrossRef] [Green Version]
  73. Wang, Y.; Xiang, D.; Yang, Z.; Ma, S. (Sara) Unraveling customer sustainable consumption behaviors in sharing economy: A socio-economic approach based on social exchange theory. J. Clean. Prod. 2019, 208, 869–879. [Google Scholar] [CrossRef]
  74. Andereck, K.L.; Valentine, K.M.; Knopf, R.C.; Vogt, C.A. Residents’ perceptions of community tourism impacts. Ann. Tour. Res. 2005, 32, 1056–1076. [Google Scholar] [CrossRef]
  75. Meeker, B.F. Decisions and Exchange. Am. Sociol. Rev. 1971, 36, 485. [Google Scholar] [CrossRef]
  76. Jayawardena, C.; Patterson, D.J.; Choi, C.; Brain, R. Sustainable tourism development in Niagara. Int. J. Contemp. Hosp. Manag. 2008, 20, 258–277. [Google Scholar] [CrossRef]
  77. Látková, P.; Vogt, C.A. Residents’ Attitudes toward Existing and Future Tourism Development in Rural Communities. J. Travel Res. 2012, 51, 50–67. [Google Scholar] [CrossRef]
  78. Jurowski, C.; Gursoy, D. Distance Effects on Residents’ Attitudes Toward Tourism. Ann. Tour. Res. 2004, 31, 296–312. [Google Scholar] [CrossRef]
  79. Nicholas, L.N.; Thapa, B.; Ko, Y.J. Residents’perspectives of A World Heritage Site: The Pitons Management Area, St. Lucia. Ann. Tour. Res. 2009, 36, 390–412. [Google Scholar]
  80. McCool, S.F.; Martin, S.R. Community Attachment and Attitudes Toward Tourism Development. J. Travel Res. 1994, 32, 29–34. [Google Scholar] [CrossRef]
  81. Gursoy, D.; Rutherford, D.G. Host attitudes toward tourism: An improved structural model. Ann. Tour. Res. 2004, 31, 495–516. [Google Scholar] [CrossRef]
  82. Tosun, C. Host perceptions of impacts: A comparative tourism study. Ann. Tour. Res. 2002, 29, 231–253. [Google Scholar]
  83. Gursoy, D.; Jurowski, C.; Uysal, M. Resident attitudes: A structural modeling approach. Ann. Tour. Res. 2002, 29, 79–105. [Google Scholar]
  84. Ko, D.-W.; Stewart, W.P. A structural equation model of residents’ attitudes for tourism development. Tour. Manag. 2002, 23, 521–530. [Google Scholar] [CrossRef]
  85. Department of Statistics Malaysia. The Population and Housing Census of Malaysia. In Population and Vital Statistics; Department of Statistics Malaysia: Putrajaya, Malaysia, 2019. [Google Scholar]
  86. Bordás, C.S.; Usán, P.; Teruel, P. The Mediating Role of Positive and Negative Affects in the Relationship Between Self-Esteem and Happiness. Psychol. Res. Behav. Manag. 2020, 13, 355–361. [Google Scholar] [CrossRef]
  87. Rua, S.V. Perceptions of tourism: A study of residents’ attitudes towards tourism in the city of Girona. J. Tour. Anal. 2020, 27, 165–184. [Google Scholar] [CrossRef]
  88. Ringle, C.M.; Wende, S.; Becker, J.-M. SmartPLS 3; SmartPLS GmbH: Boenningstedt, Germany, 2015; Available online: http://www.smartpls.com (accessed on 5 January 2020).
  89. Wetzels, M.; Odekerken-Schröder, G.; Van Oppen, C. Using PLS Path Modeling for Assessing Hierarchical Construct Models: Guidelines and Empirical Illustration. MIS Q. 2009, 33, 177. [Google Scholar] [CrossRef]
  90. Mertler, C.A.; Reinhart, R.V. Advanced and Multivariate Statistical Methods: Practical Application and Interpretation, 6th ed.; Routledge: New York, NY, USA, 2017. [Google Scholar]
  91. Hair, J.F.; Hult, G.T.M.; Ringle, C.M.; Sarstedt, M. A Primer on Partial Least Squares Structural Equation Modeling (PLS−SEM), 2nd ed.; Sage: Thousand Oaks, CA, USA, 2017. [Google Scholar]
  92. Fornell, C.; Larcker, D.F. Evaluating structural equation models with unobservable variables and measurement error. J. Mark. Res. 1981, 18, 39–50. [Google Scholar] [CrossRef]
  93. Henseler, J.; Ringle, C.M.; Sarstedt, M. A new criterion for assessing discriminant validity in variance-based structural equation modeling. J. Acad. Mark. Sci. 2015, 43, 115–135. [Google Scholar] [CrossRef] [Green Version]
  94. Chin, W.W. How to write up and report PLS analyses. In Handbook of Partial Least Squares: Concepts, Methods and Application; Springer: New York, NY, USA, 2010; pp. 655–690. [Google Scholar]
  95. Podsakoff, P.M.; MacKenzie, S.B.; Lee, J.-Y.; Podsakoff, N.P. Common method biases in behavioral research: A critical review of the literature and recommended remedies. J. Appl. Psychol. 2003, 88, 879–903. [Google Scholar]
  96. Hayes, A.F. Beyond Baron and Kenny: Statistical Mediation Analysis in the New Millennium. Commun. Monogr. 2009, 76, 408–420. [Google Scholar] [CrossRef]
  97. Shrout, P.E.; Bolger, N. Mediation in experimental and nonexperimental studies: New procedures and recommendations. Psychol. Methods 2002, 7, 422–445. [Google Scholar] [CrossRef]
  98. Chin, W.W. The partial least squares approach for structural equation modeling. In Modern Methods for Business Research; Marcoulides, G.A., Ed.; Lawrence Erlbaum: Mahwah, NJ, USA, 1998; pp. 295–336. [Google Scholar]
  99. Hair, J.F.; Ringle, C.M.; Sarstedt, M. Partial Least Squares Structural Equation Modeling: Rigorous Applications, Better Results and Higher Acceptance. Long Range Plan. 2013, 46, 1–12. [Google Scholar] [CrossRef]
  100. Shmueli, G.; Sarstedt, M.; Hair, J.F.; Cheah, J.H.; Ting, H.; Vaithilingam, S.; Ringle, C.M. Predictive model assessment in PLS-SEM: Guidelines for using PLSpredict. Eur. J. Mark. 2019, 53, 2322–2347. [Google Scholar]
  101. Akhtar, N.; Akhtar, M.N.; Usman, M.; Ali, M.; Siddiqi, U.I. COVID-19 restrictions and consumers’ psychological reactance toward offline shopping freedom restoration. Serv. Ind. J. 2020, 40, 891–913. [Google Scholar] [CrossRef]
  102. Vargas, A. Outside the Law: An Ethnographic Study of Street Vendors in Bogota. In Lund Studies in Sociology of Law; Lund University: Lund, Sweden, 2016. [Google Scholar]
  103. Ntounis, N.; Mumford, C.; Loroño-Leturiondo, M.; Parker, C.; Still, K. How safe is it to shop? Estimating the amount of space needed to safely social distance in various retail environments. Saf. Sci. 2020, 132, 104985. [Google Scholar] [CrossRef]
  104. Eslami, H.; Jalili, M. The role of environmental factors to transmission of SARS-CoV-2 (COVID-19). AMB Express 2020, 10, 1–8. [Google Scholar] [CrossRef] [PubMed]
  105. Truong, V.D. Tourism, poverty alleviation, and the informal economy: The street vendors of Hanoi, Vietnam. Tour. Recreat. Res. 2017, 43, 52–67. [Google Scholar] [CrossRef]
  106. Yotsumoto, Y. Formalization of Urban Poor Vendors and their Contribution to Tourism Development in M anila, P hilippines. Int. J. Jpn. Sociol. 2013, 22, 128–142. [Google Scholar] [CrossRef]
  107. Bhowmik, S.K.; Saha, D. Financial Inclusion of the Marginalised. Financ. Incl. Marg. 2013. [Google Scholar] [CrossRef]
  108. Steel, G. Vulnerable Careers: Tourism and Livelihood Dynamics Among Street Vendors in Cusco, Peru; Rozenberg Publishers: Amsterdam, The Netherlands, 2008. [Google Scholar]
  109. Kang, S.K.; Lee, J. Support of marijuana tourism in Colorado: A residents’ perspective using social exchange theory. J. Destin. Mark. Manag. 2018, 9, 310–319. [Google Scholar] [CrossRef]
  110. Chang, J.; Min, J.C.H.; Lin, Y.-H.P.; Chiang, C.H. Profiling Japanese Tourists Visiting Night Markets in Taiwan. J. Qual. Assur. Hosp. Tour. 2007, 8, 25–44. [Google Scholar] [CrossRef]
  111. Macabasco-O’Connell, A.; DeWalt, D.A.; Broucksou, K.A.; Hawk, V.; Baker, D.W.; Schillinger, D.; Ruo, B.; Bibbins-Domingo, K.; Holmes, G.M.; Erman, B.; et al. Relationship Between Literacy, Knowledge, Self-Care Behaviors, and Heart Failure-Related Quality of Life Among Patients With Heart Failure. J. Gen. Intern. Med. 2011, 26, 979–986. [Google Scholar] [CrossRef] [Green Version]
  112. Videto, D.M.; Dake, J.A. Promoting Health Literacy Through Defining and Measuring Quality School Health Education. Health Promot. Pract. 2019, 20, 824–833. [Google Scholar] [CrossRef]
  113. Nicolau, J.L. Corporate social responsibility: Worth−creating ctivities. Ann. Tour. Res. 2008, 35, 990–1006. [Google Scholar]
  114. Liu, J.; Wang, C.; Fang, S.; Zhang, T. (Christina) Scale development for tourist trust toward a tourism destination. Tour. Manag. Perspect. 2019, 31, 383–397. [Google Scholar] [CrossRef]
Figure 1. Parameter estimates of PLS analysis.
Sustainability 13 01553 g001
Table 1. Study variables with respective indicators.
Construct Item Description
Place attachment
Attachment1 Recognition of this night market as a famous tourists’ spot is important to me.
Attachment2I have positive feelings for this night market.
Attachment3I have particular feelings for this place.
Attachment4I think of myself as being from this place.
Attachment5I have an emotional attachment to this place—it has meaning to me.
Attachment6I am willing to invest my talent or time to make this an even better place.
Attachment7I am willing to make financial sacrifices for the sake of this place and its residents.
Economic gain
Economic1Increasing the number of tourists has an effect on my current household income.
Economic2A high percentage of my current income used to come from the money spent by visitors.
Economic3Most of my income comes from the tourist trade.
Involvement
Involve1The vendors of the night market have been involved in the planning process to reopen the market.
Involve2The vendors of the night market have been trained and briefed on how to implement the control measures set by the government.
Positive perception
Perception1International tourists would create more jobs for night market vendors.
Perception2International tourists would bring more income for us.
Perception3Our standard of living has been increased considerably because of them.
Negative perception
Perception4Local residents might suffer from having international tourists back.
Perception5Having them back would increase the risk of COVID-19.
Perception6Other local tourists might avoid visiting our night market because of them.
Receptiveness
Receptiveness1I believe that international tourists will come back as soon as it is safe.
Receptiveness2I support having international tourists back.
Receptiveness3The government support and facilitate inbound international tourists.
Receptiveness4It is important to develop a health plan to manage international tourists when they are here.
Receptiveness5I am willing to follow and implement all the health measurements if we could have them back.
Table 2. Respondents’ demographic characteristics.
Demographic FactorsCategories Number Percentage (%)
Study site Batu Feringghi6847.2
Macallum Street106.9
Farlim149.7
Kimberley5236.1
Nationality Malaysian citizen13392.4
Non Malaysian citizen117.6
Ethnicity Malay5034.7
Chinese5638.9
Indian2819.4
Bangladesh 53.5
Indonesia 21.4
Thailand 21.4
Pakistan 10.7
Gender Female6243.1
Male8256.9
Marital status Married and living with spouse11680.6
Single/Divorced/Separated 2819.4
Education University/college3625.0
Secondary education9666.7
Primary education128.3
Income level Less than RM 1000139.0
From RM 1001–20004430.6
From RM 2001–30003725.7
From RM 3001–4000149.7
RM 4001 and above2316.0
Don’t know139.0
Table 3. Outer loadings and cross-loadings of latent constructs.
ItemEconomic GainInvolvementNegative PerceptionPlace AttachmentPositive PerceptionReceptiveness
Attachment10.414−0.0070.0310.9310.4200.394
Attachment20.407−0.077−0.0420.9900.4320.373
Attachment30.353−0.127−0.0160.9220.3550.319
Attachment40.396−0.068−0.0540.9900.4240.371
Attachment50.417−0.038−0.0800.9730.4430.386
Economic10.886−0.046−0.3410.4180.5860.510
Economic20.9630.181−0.1690.3690.5550.328
Economic30.9630.177−0.1650.3700.5550.327
Involve10.1700.953−0.045−0.0250.2130.023
Involve2−0.0150.892−0.022−0.1100.1440.048
Perception10.6060.205−0.2170.4440.9960.493
Perception20.5950.211−0.2320.4240.9970.487
Perception30.6080.179−0.2000.4250.9930.457
Perception4−0.228−0.0340.996−0.043−0.208−0.299
Perception5−0.262−0.0620.992−0.033−0.213−0.317
Perception6−0.245−0.0170.993−0.029−0.227−0.306
Welcoming10.4480.058−0.2980.3850.5470.893
Welcoming20.3970.014−0.2400.3160.4620.863
Welcoming30.243−0.029−0.2050.3000.2850.830
Welcoming40.2680.042−0.2520.2740.2600.734
Welcoming50.2810.043−0.2550.2560.2800.726
Notes: Values in boldface are outer loadings, whereas others are cross-loadings.
Table 4. Assessment of reliability and validity of constructs.
Economic GainInvolvementNegative PerceptionPlace AttachmentPositive PerceptionReceptiveness
Economic Gain0.938
Involvement0.1030.923
Negative Perception−0.247−0.0380.994
Place Attachment0.414−0.064−0.0350.961
Positive Perception0.6060.200−0.2170.4330.995
Receptiveness0.4220.035−0.3100.3850.4810.812
Average Variance Extracted0.8800.8520.9880.9240.9910.659
Composite Reliability0.9560.9200.9960.9840.9970.906
rho_A0.9350.9280.9960.9840.9960.919
Cronbach’s Alpha0.9310.8320.9940.9790.9950.875
Note: The diagonals (in bold) represent the square root of the AVE.
Table 5. Heterotrait–Monotrait (HTMT).
Economic GainInvolvementNegative PerceptionPlace AttachmentPositive Perception
Involvement0.172
CI.90 (0.097, 0.315)
Negative Perception0.249
CI.90 (0.085, 0.415)
0.040
CI.90 (0.020, 0.238)
Place Attachment0.430
CI.90 (0.262, 0.582)
0.092
CI.90 (0.039, 0.265)
0.047
CI.90 (0.022, 0.223)
Positive Perception0.626
CI.90 (0.482, 0.747)
0.212
CI.90 (0.060, 0.365)
0.218
CI.90 (0.046, 0.375)
0.437
CI.90 (0.289, 0.583)
Receptiveness0.436
CI.90 (0.250, 0.593)
0.056
CI.90 (0.051, 0.228)
0.328
CI.90 (0.154, 0.481)
0.404
CI.90 (0.284, 0.544)
0.482
CI.90 (0.323, 0.623)
Table 6. Path coefficient and hypothesis testing (direct effects).
HsRelationshipβt ValueDecisionf2VIF
H1aPlace attachment → Positive perception0.2413.239 ***Supported0.084 (Small)1.224
H1bPlace attachment → Negative perception0.0810.782Not supported0.0001.224
H2aEconomic gain → Positive perception0.4896.136 ***Supported0.343 (Substantial)1.232
H2bEconomic gain → Negative perception−0.2802.804 ***Supported0.068 (Small)1.232
H3aInvolvement → Positive perception0.1652.699 ***Supported0.047 (Small)1.025
H3bInvolvement → Negative perception−0.0050.049Not supported0.0001.025
H4aPositive perception → Receptiveness0.4355.622 ***Supported0.249 (Substantial)1.050
H4bNegative perception → Receptiveness−0.2152.656 ***Supported0.061 (Small)1.050
Beta = regression weight, t values are computed through bootstrapping procedure with 144 cases and 1000 samples; *** p < 0.01.
Table 7. Hypothesis testing (indirect effects).
Hs Specific Indirect EffectPath Coefficients (O)Standard Deviation
(STDEV)
T Statistics (|O/STDEV|)p ValuesDecision VAF (%)
H5aPlace attachment → Positive perception → receptiveness0.1050.0402.624 ***0.009Supported 100
H5bPlace attachment → Negative perception → receptiveness−0.0170.0250.6970.486Not supported
H6aEconomic gain → Positive perception → receptiveness0.2130.0553.900 ***0.000Supported 77.89
H6bEconomic gain → Negative perception→receptiveness0.0600.0341.7500.080Not supported
H7aInvolvement → Positive perception→ receptiveness0.0720.0282.595 ***0.010Supported 98.66
H7bInvolvement → Negative perception → receptiveness0.0010.0210.0470.963Not supported
*** p < 0.01, VAF (variance accounted for) = indirect effect/total effect.
Publisher’s Note: MDPI stays neutral with regard to jurisdictional claims in published maps and institutional affiliations.

