Spatiotemporal Pattern of Vegetation Ecology Quality and Its Response to Climate Change between 2000–2017 in China

 and
and
Abstract
:1. Introduction
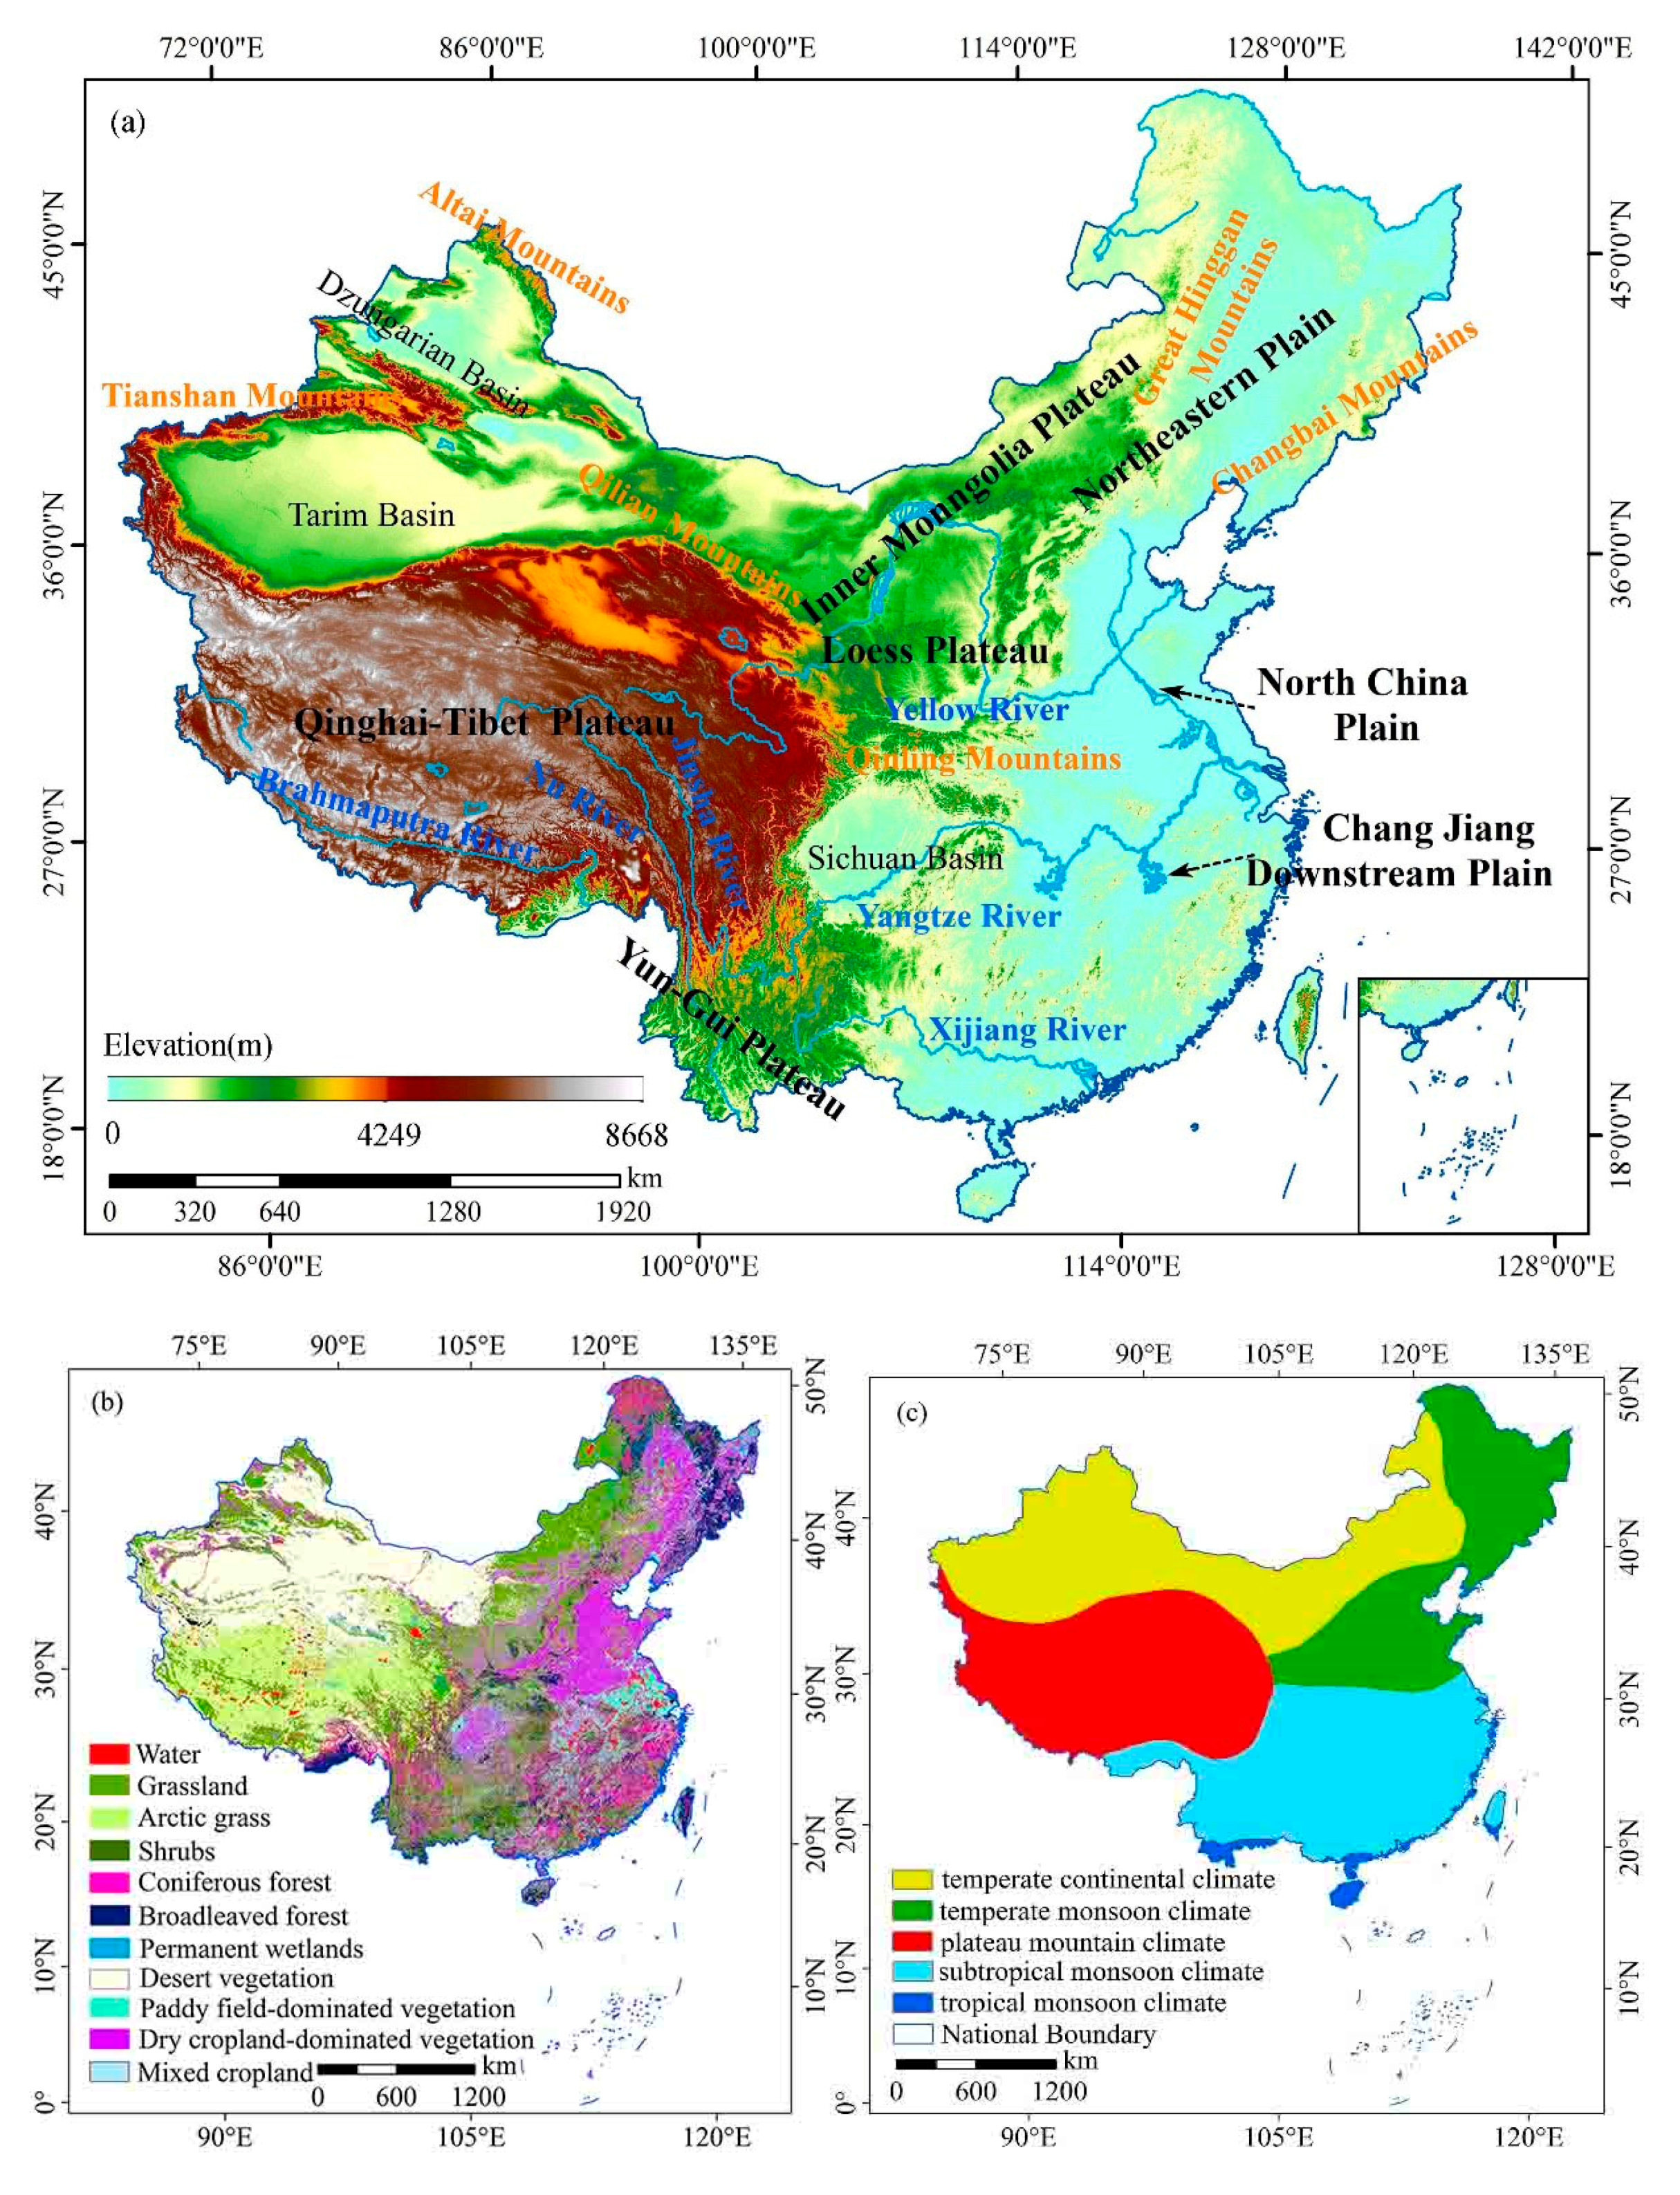
2. Materials and Methods
2.1. Remote Sensing Data
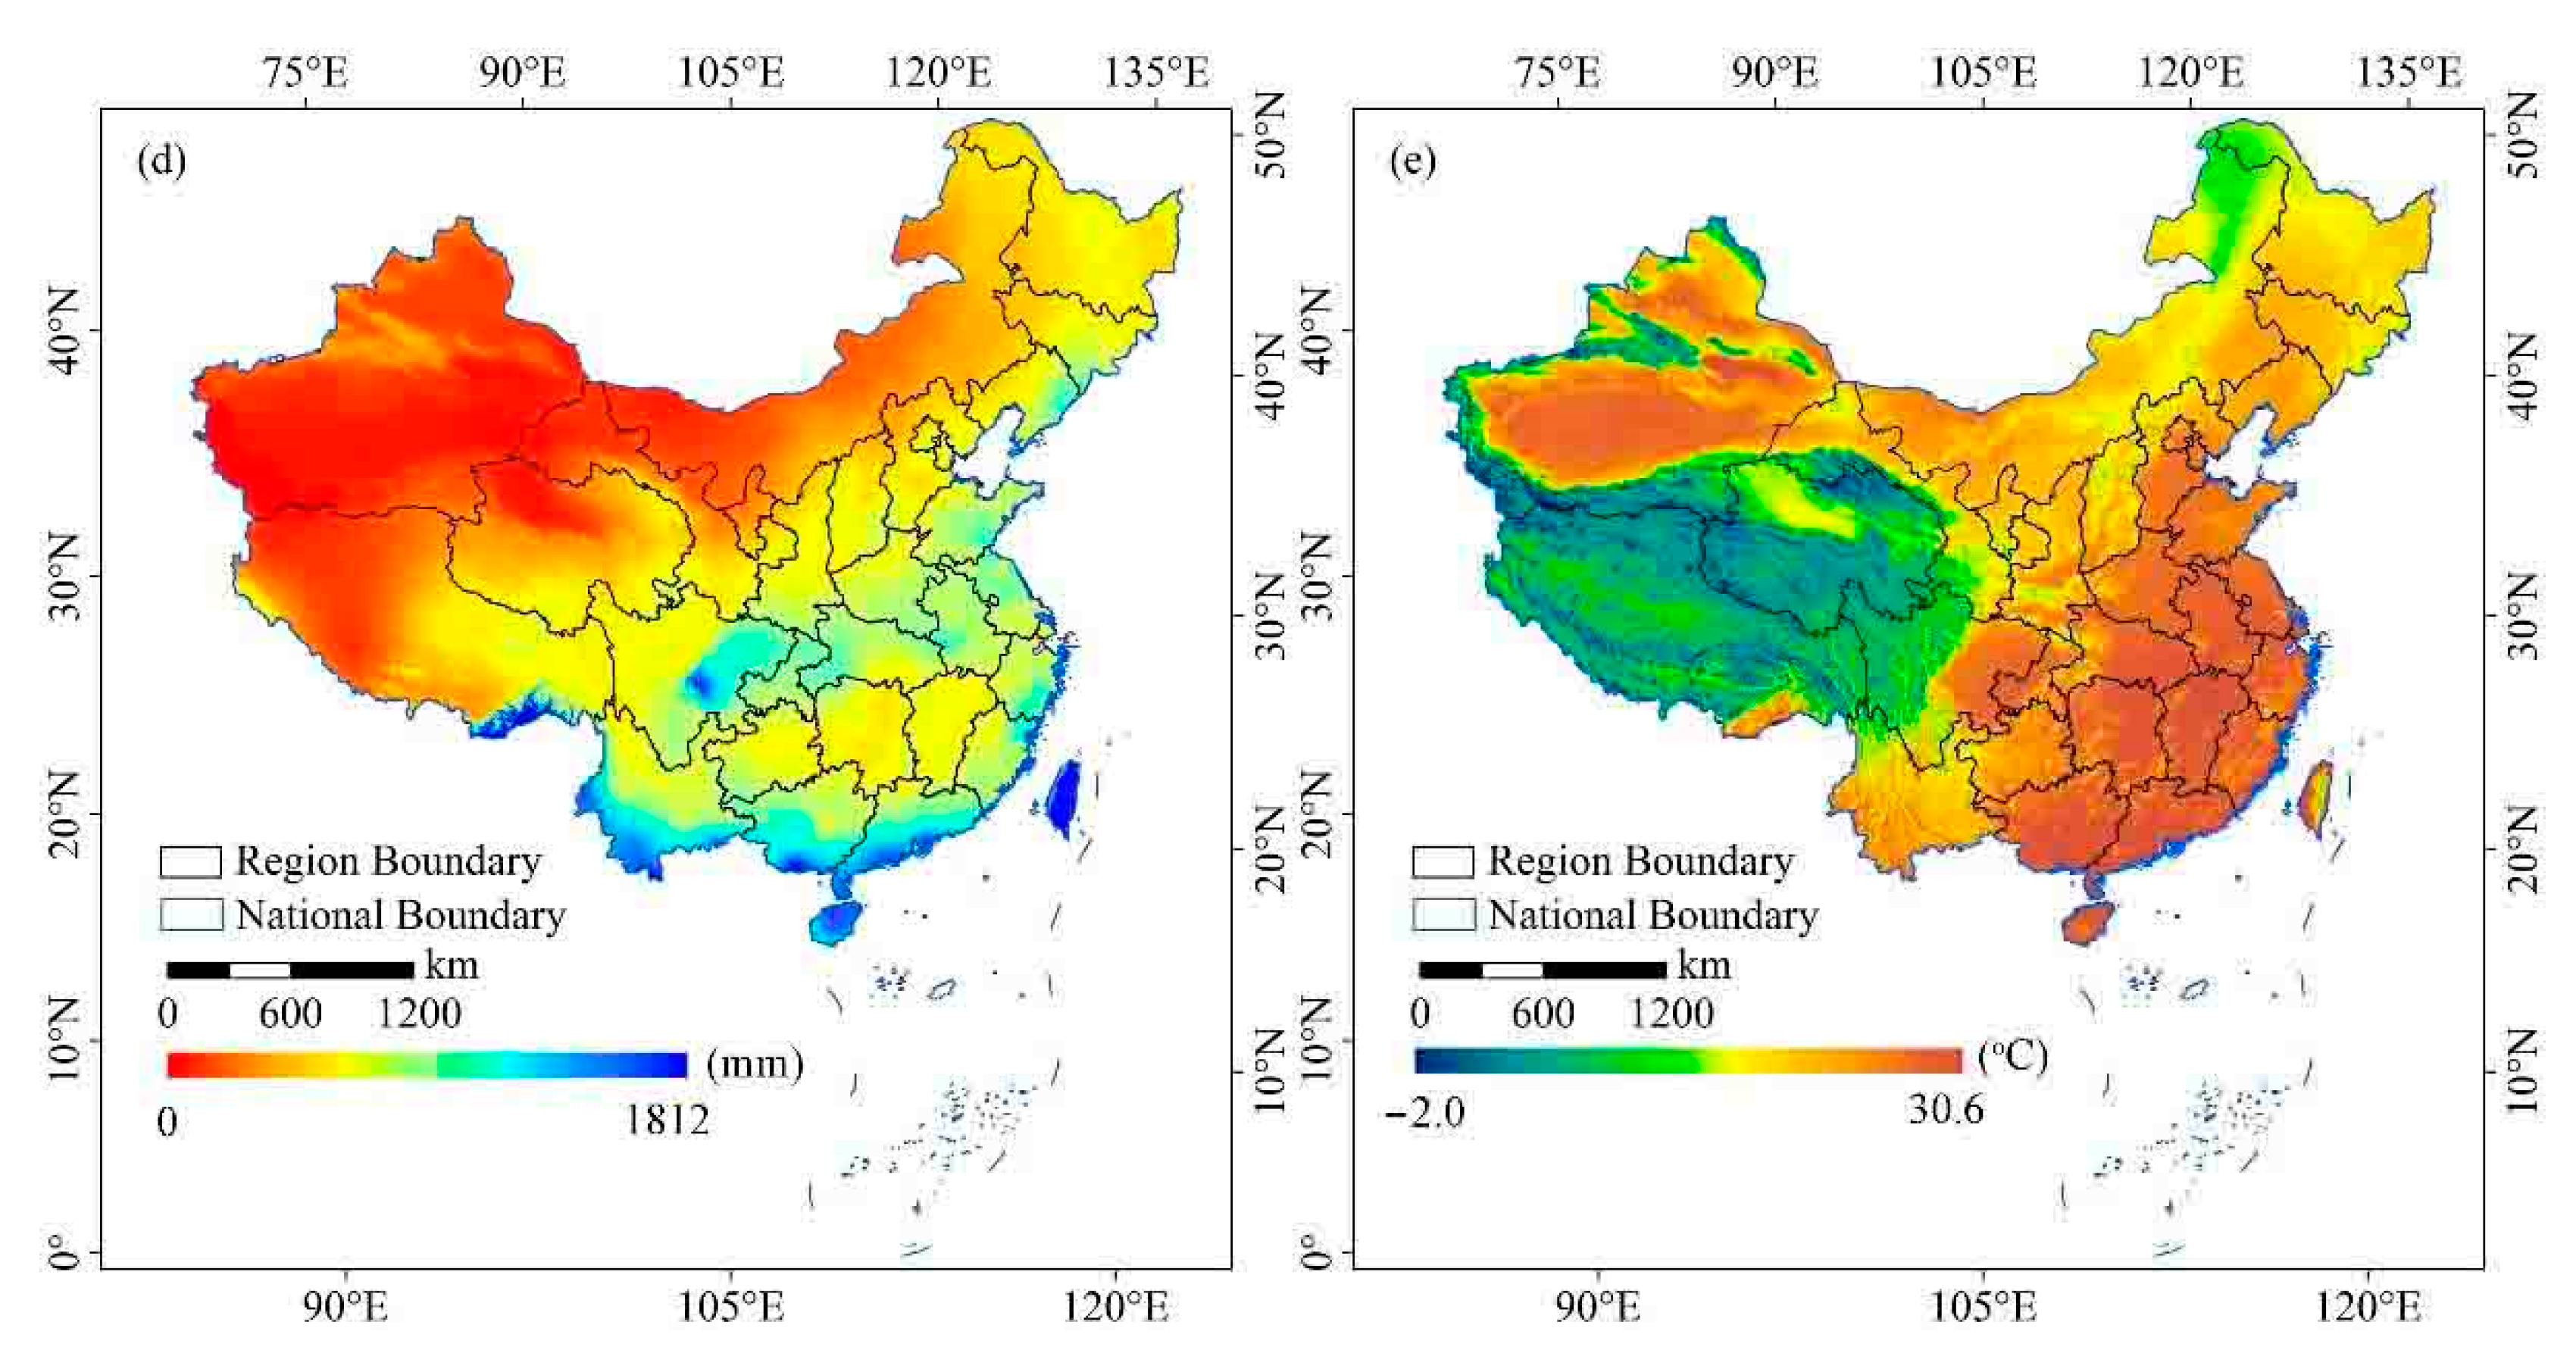
2.2. Other Data
2.3. Methods
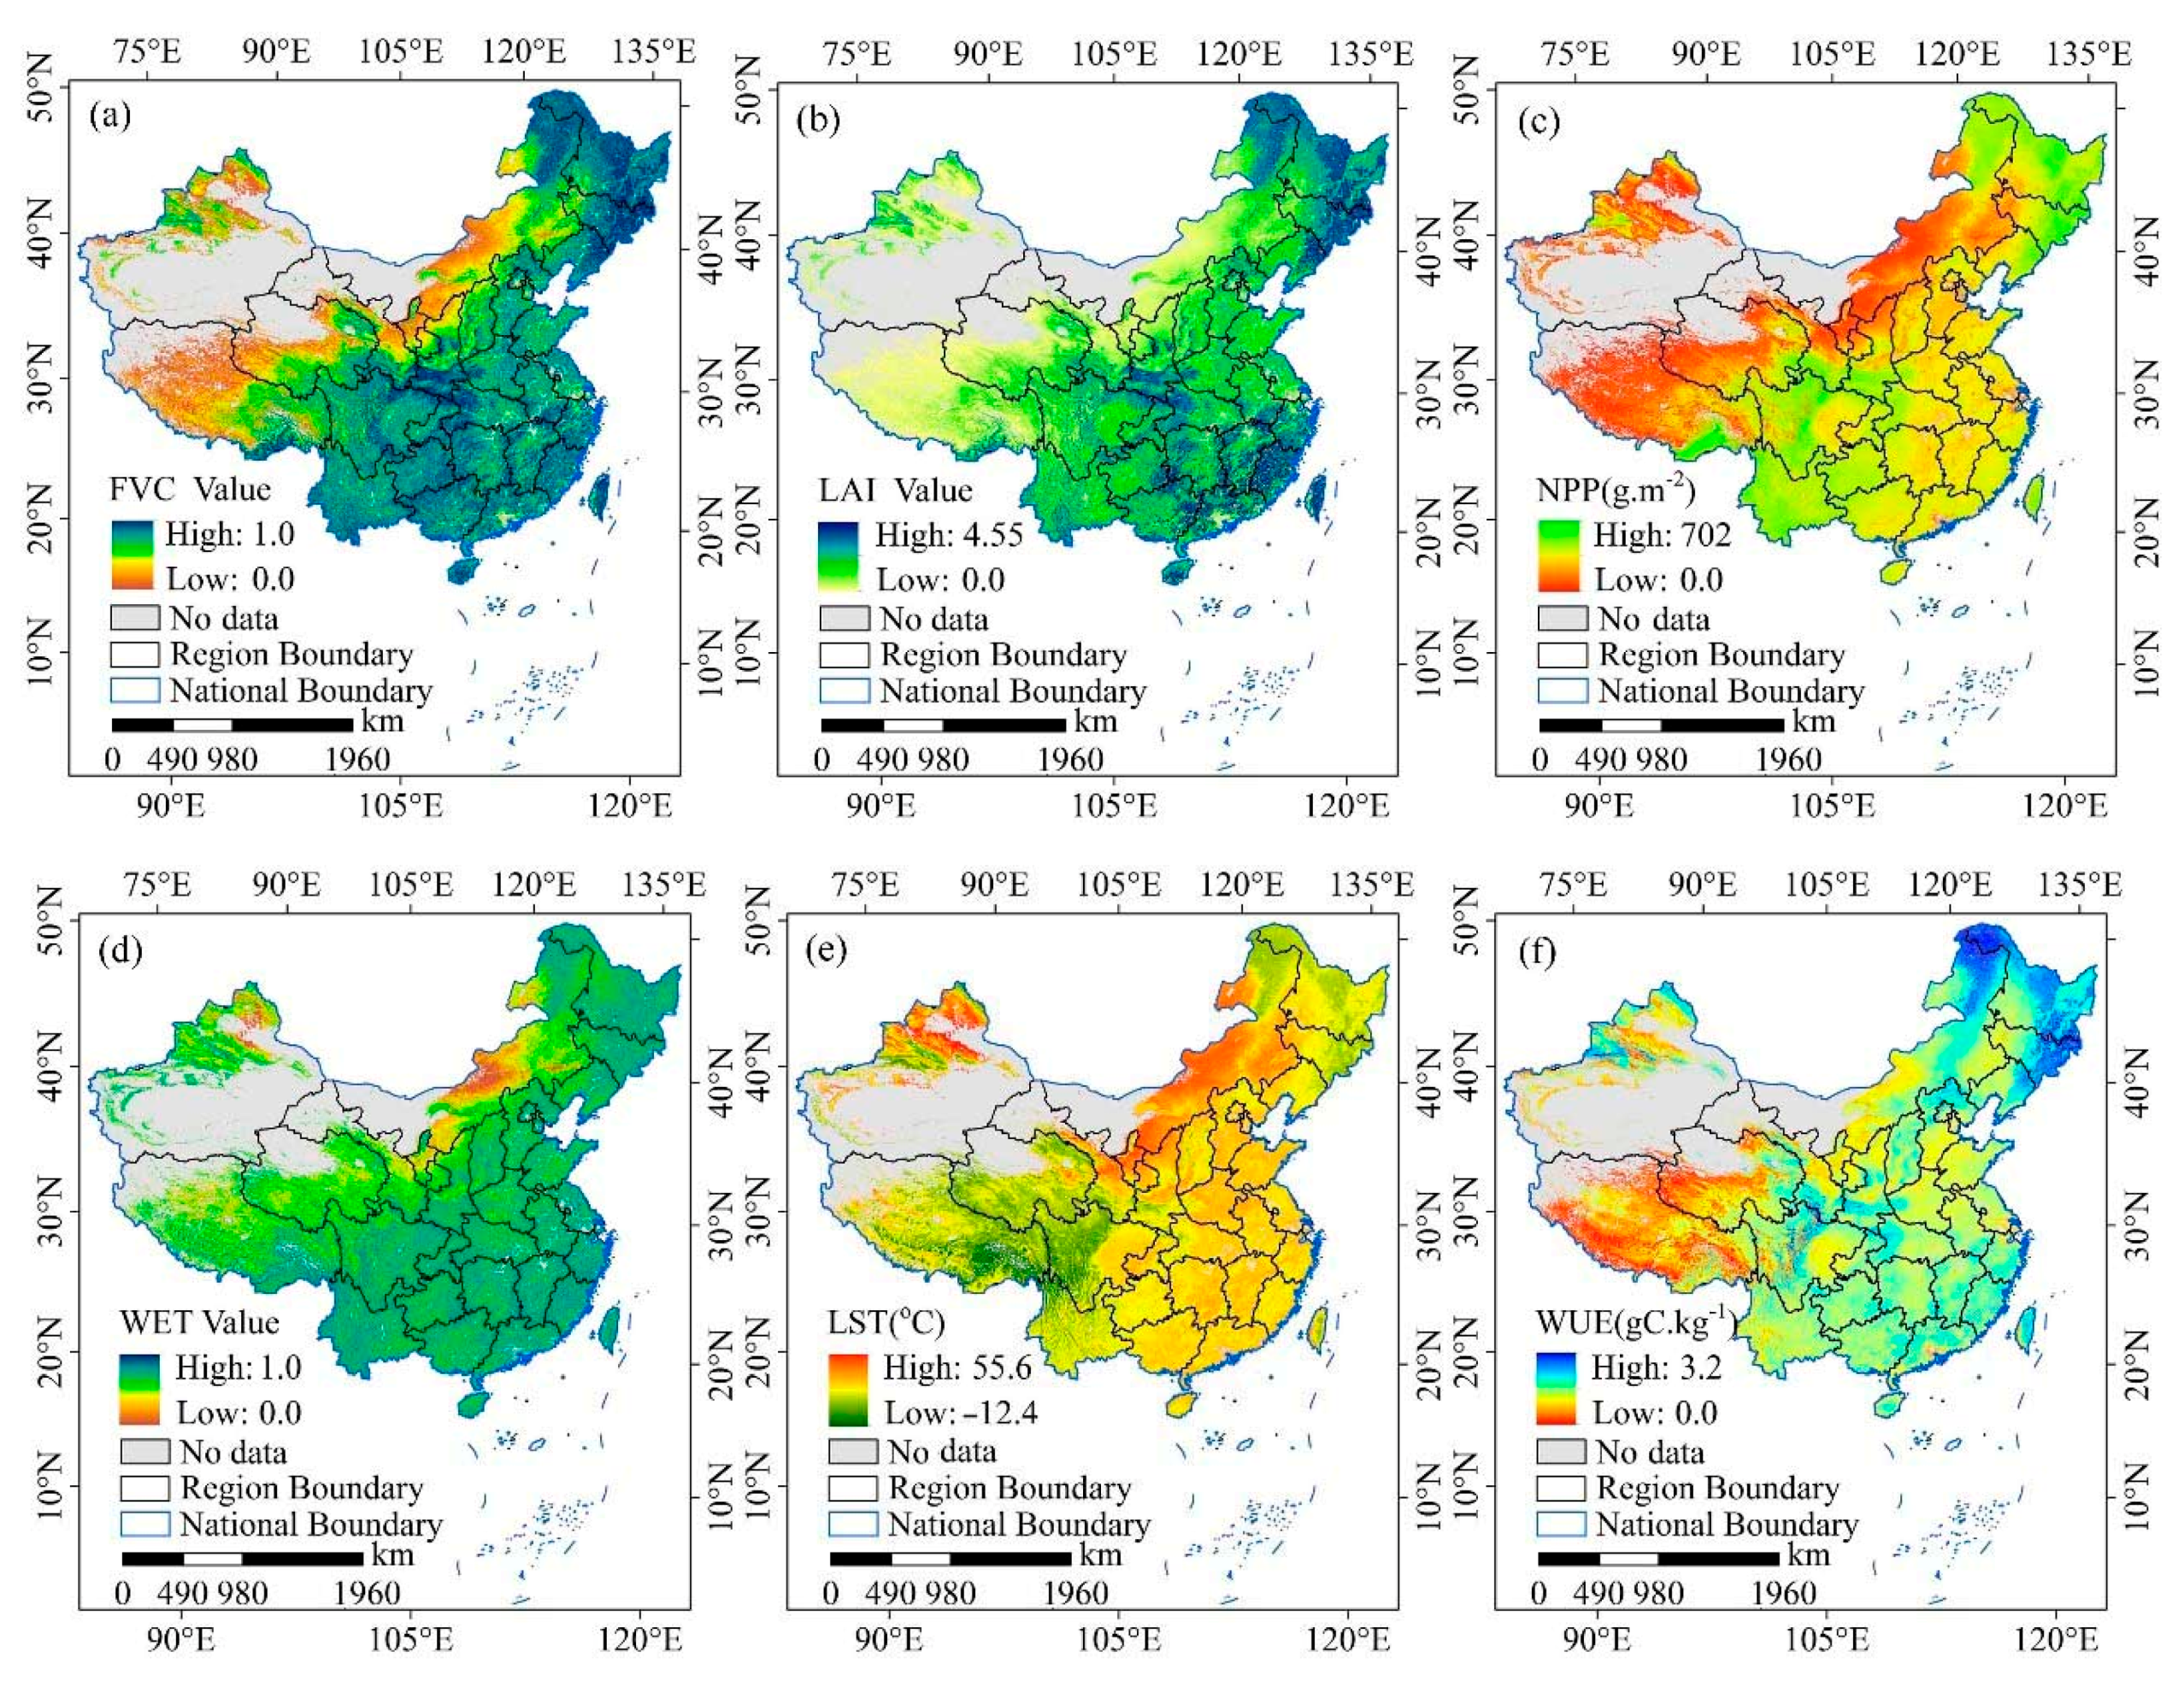
2.3.1. Indicators Used in VEQI
2.3.2. Construction of VEQI
2.3.3. Exploratory Spatial Data Analysis
SEN + Mann–Kendall
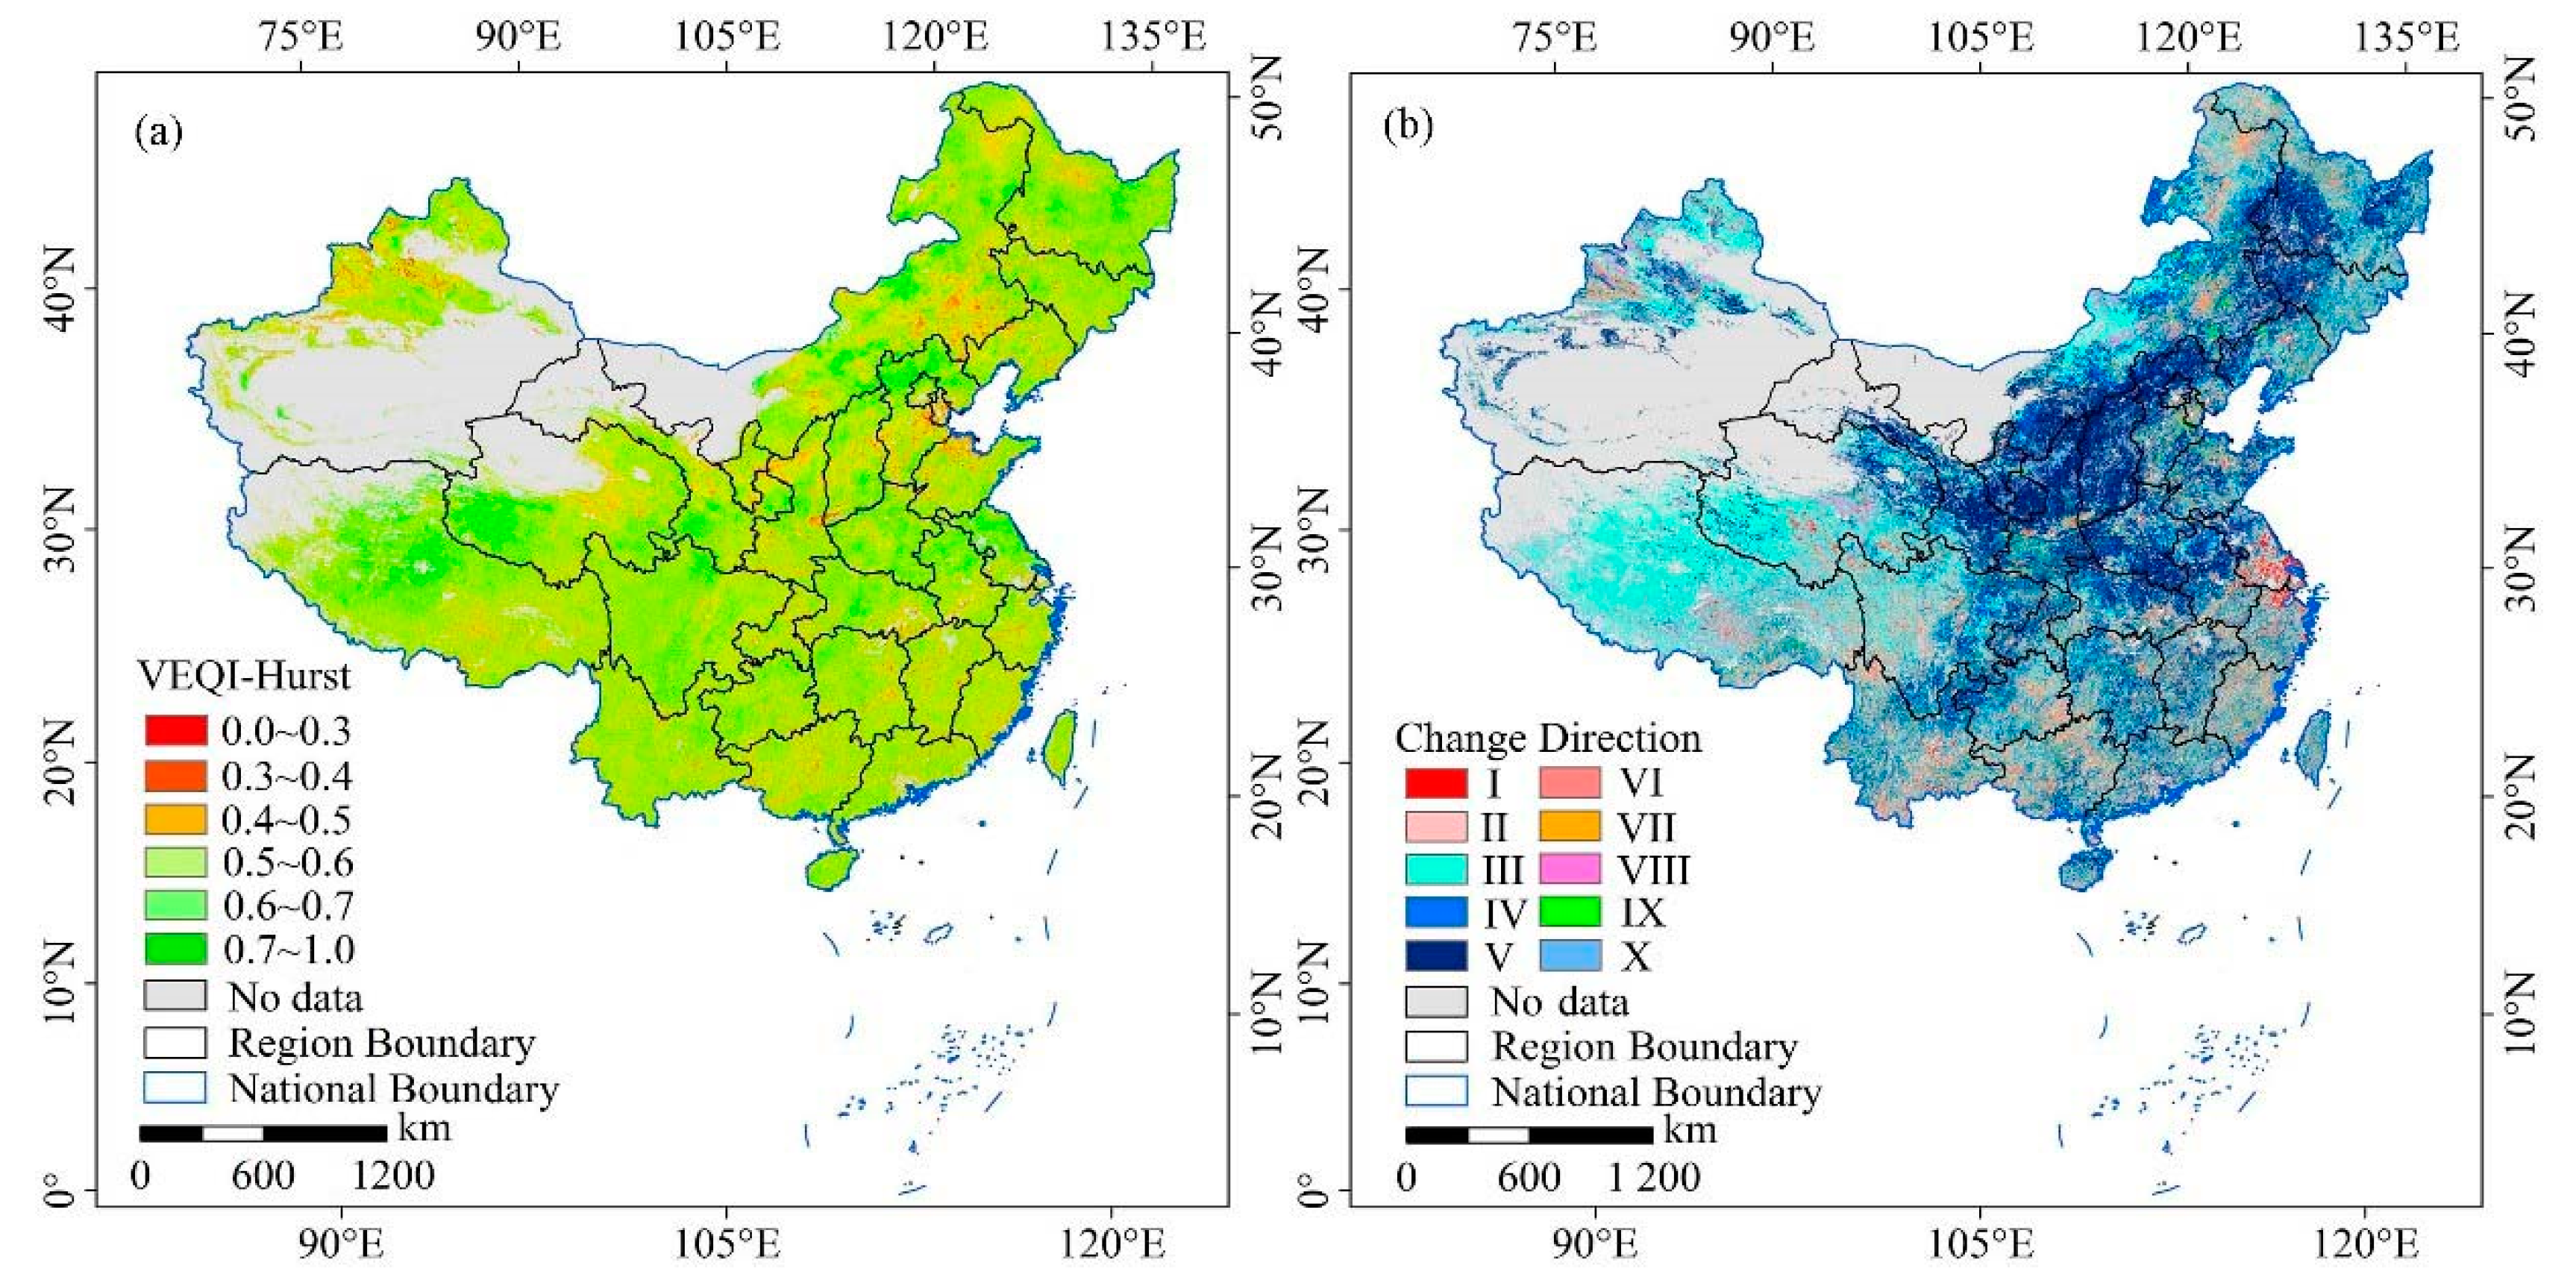
Hurst Exponent
3. Results
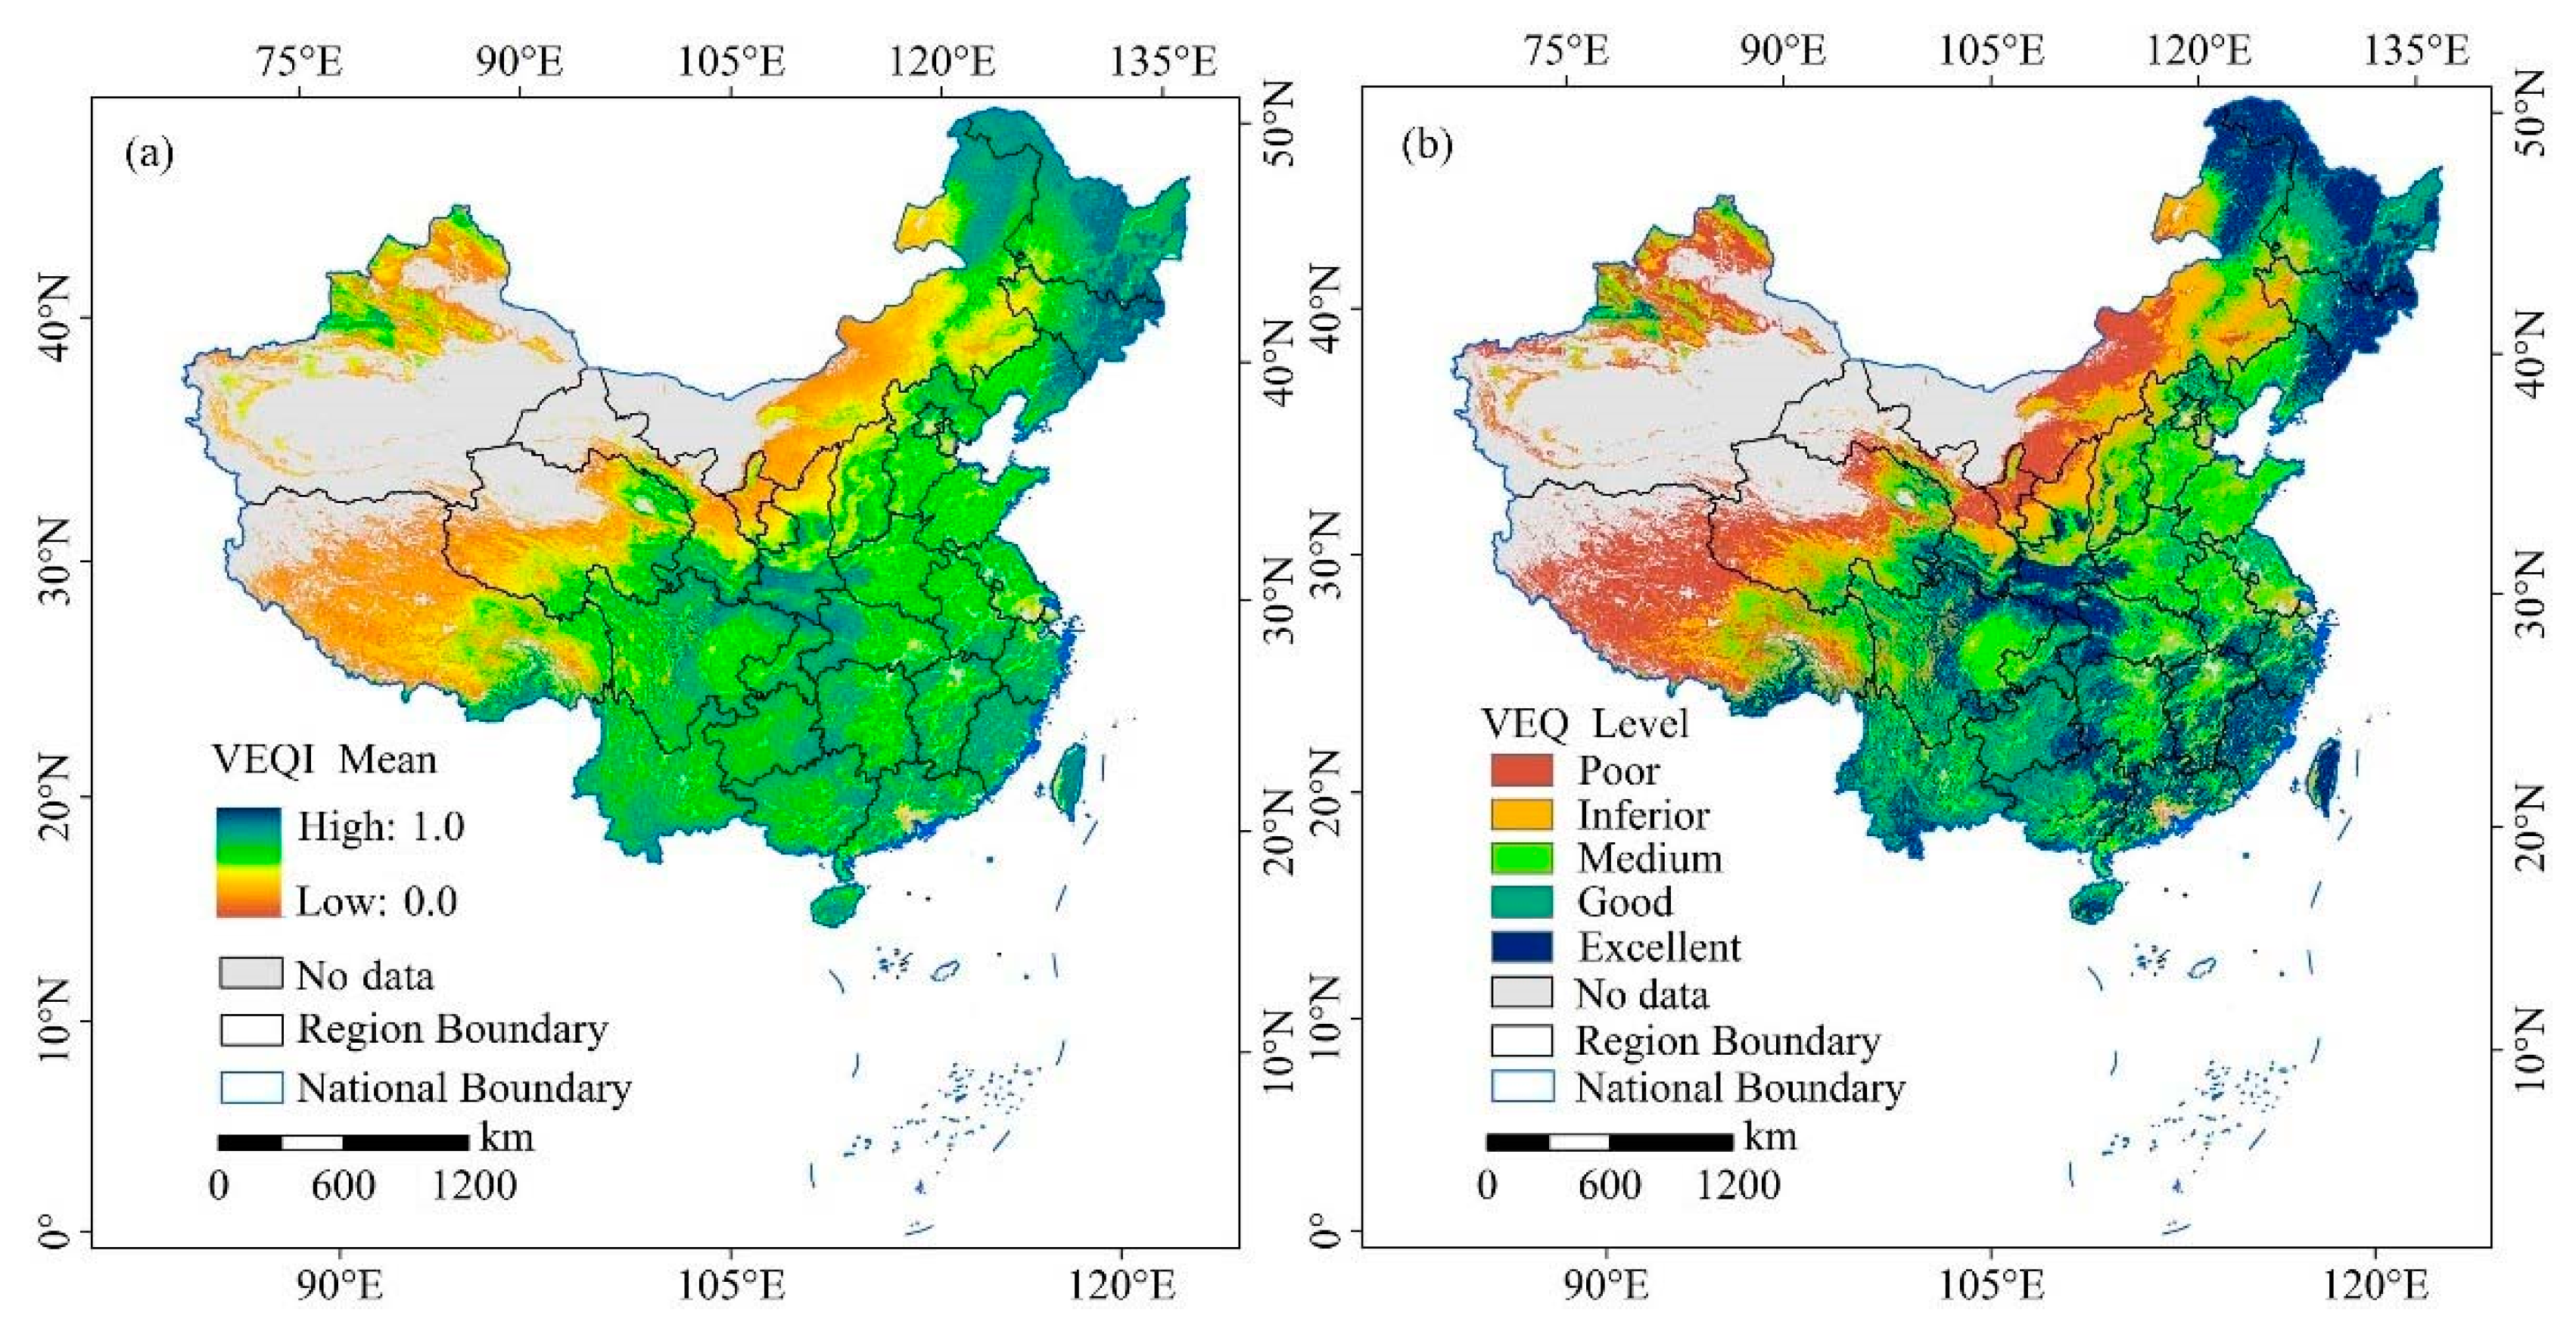
3.1. Spatiotemporal Pattern of VEQ
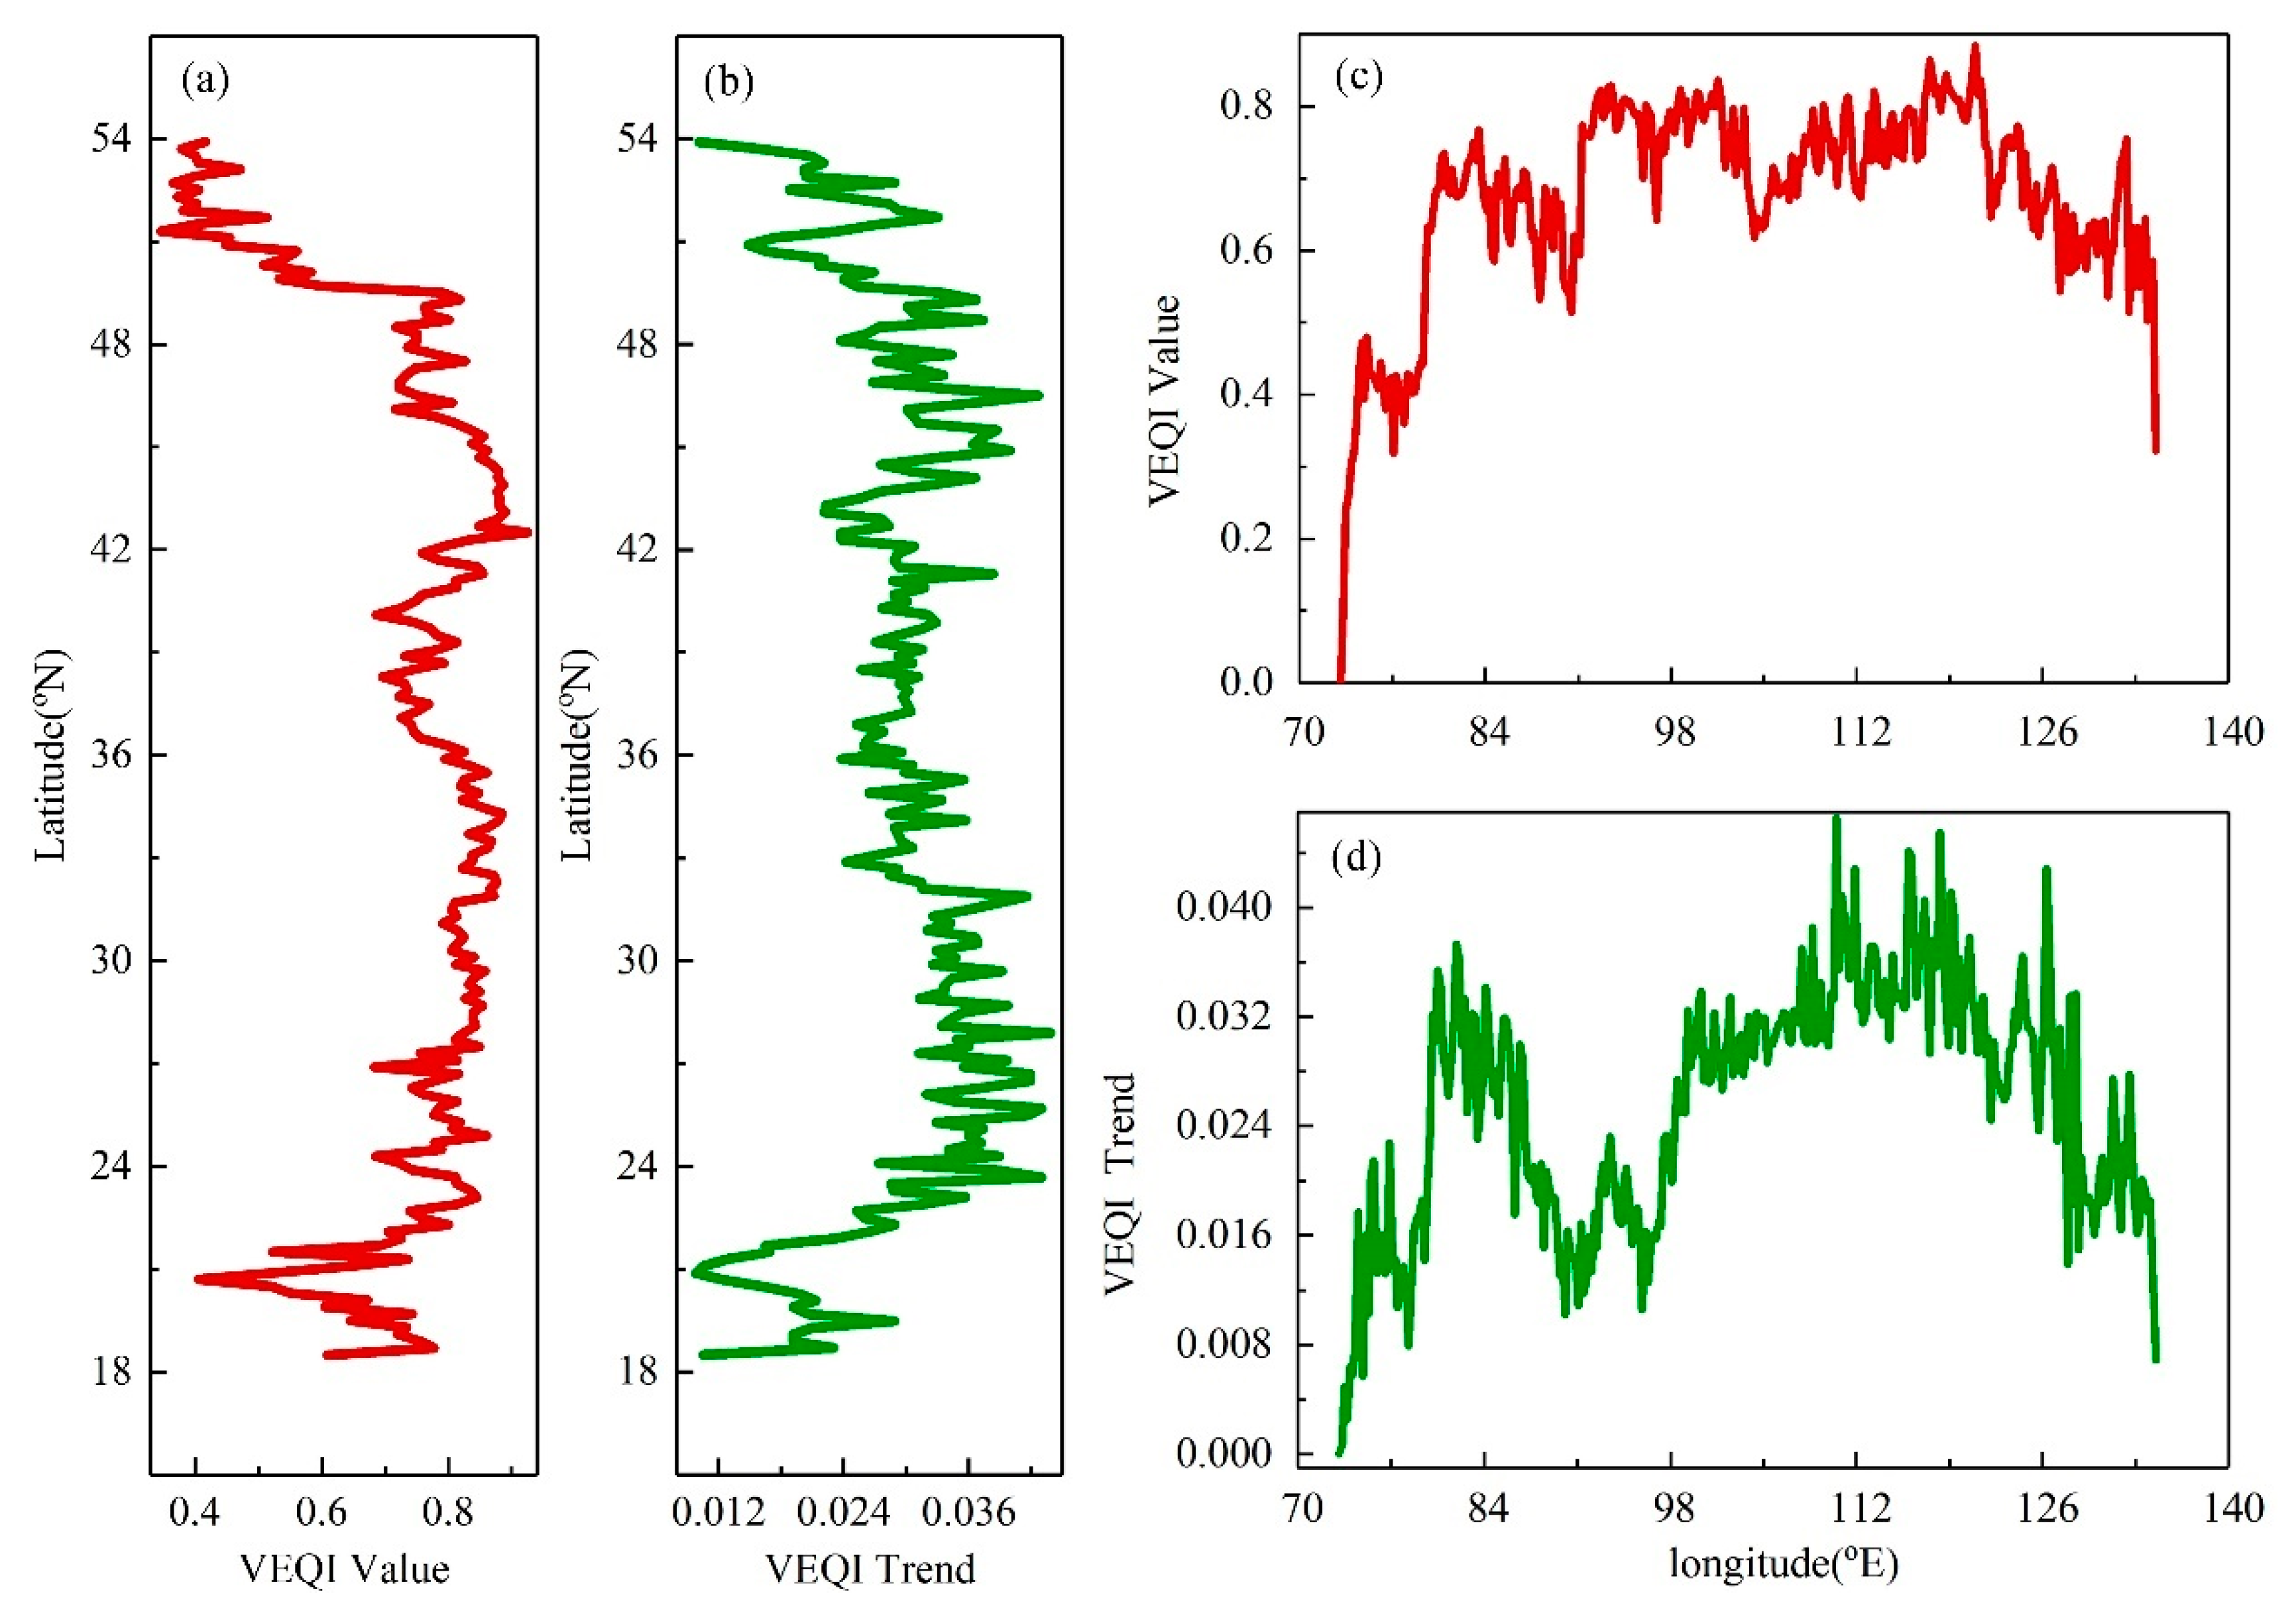
3.1.1. Spatial Distribution of VEQ
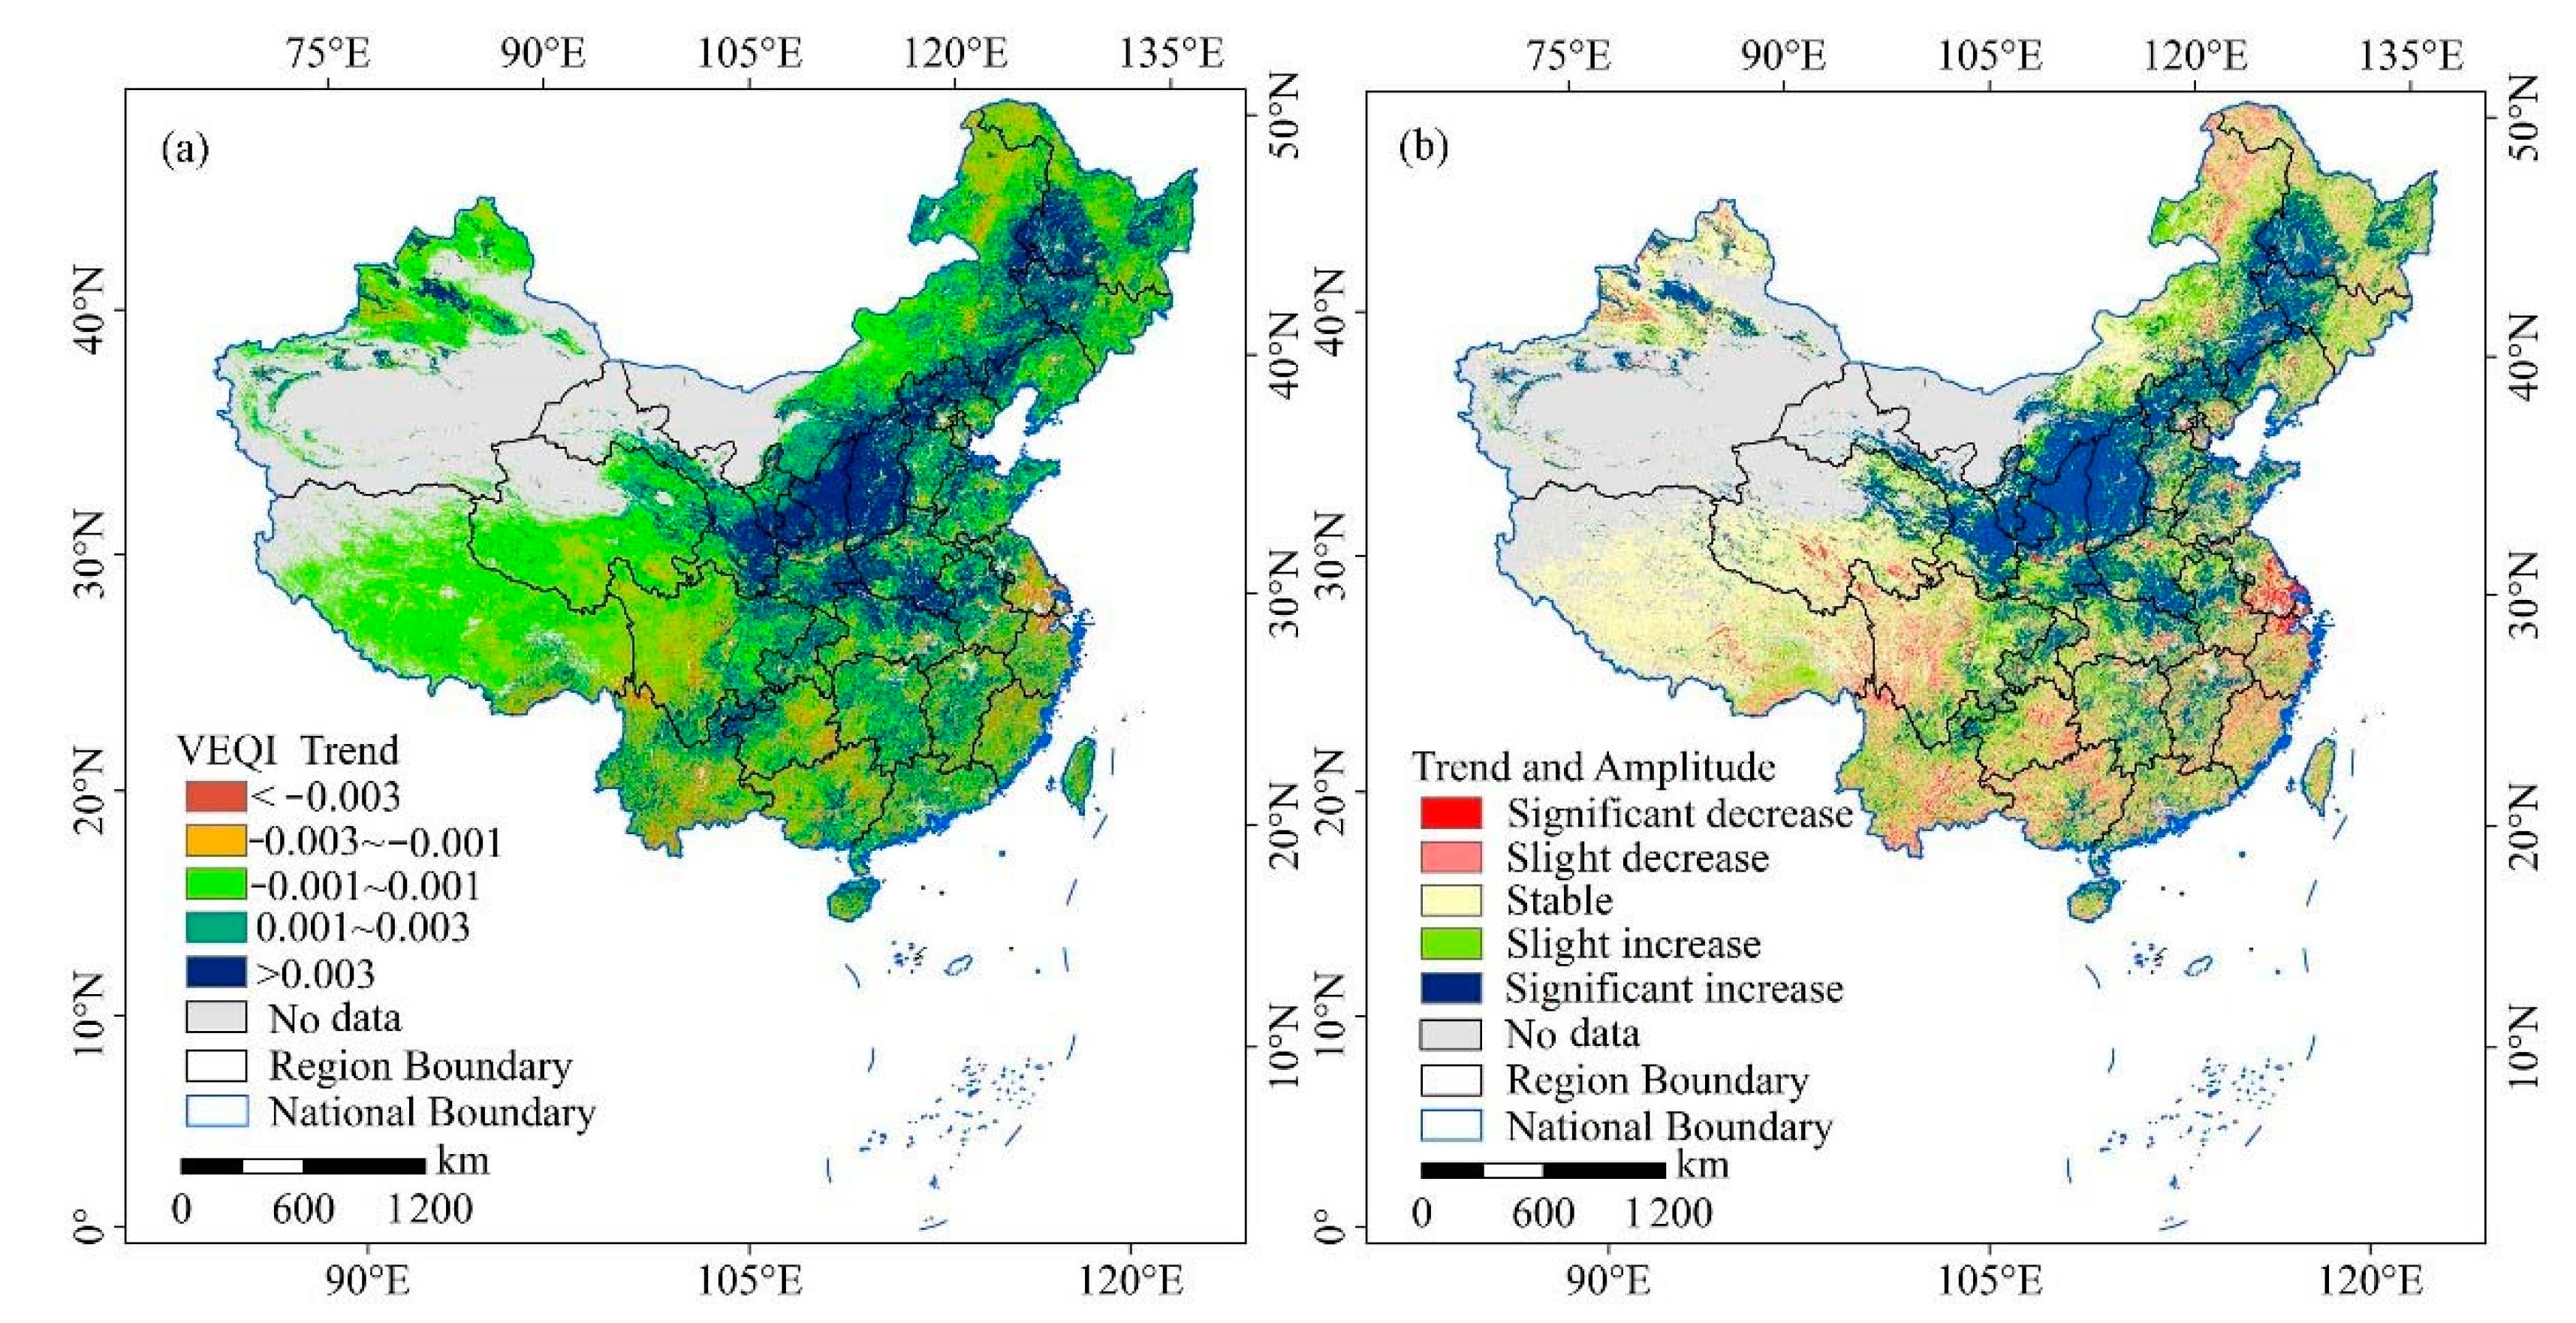
3.1.2. The Change Trend and Amplitude of VEQ
3.1.3. The Sustainability and Direction of VEQ in the Future
3.2. The Characteristics of VEQ in Different Ecosystems
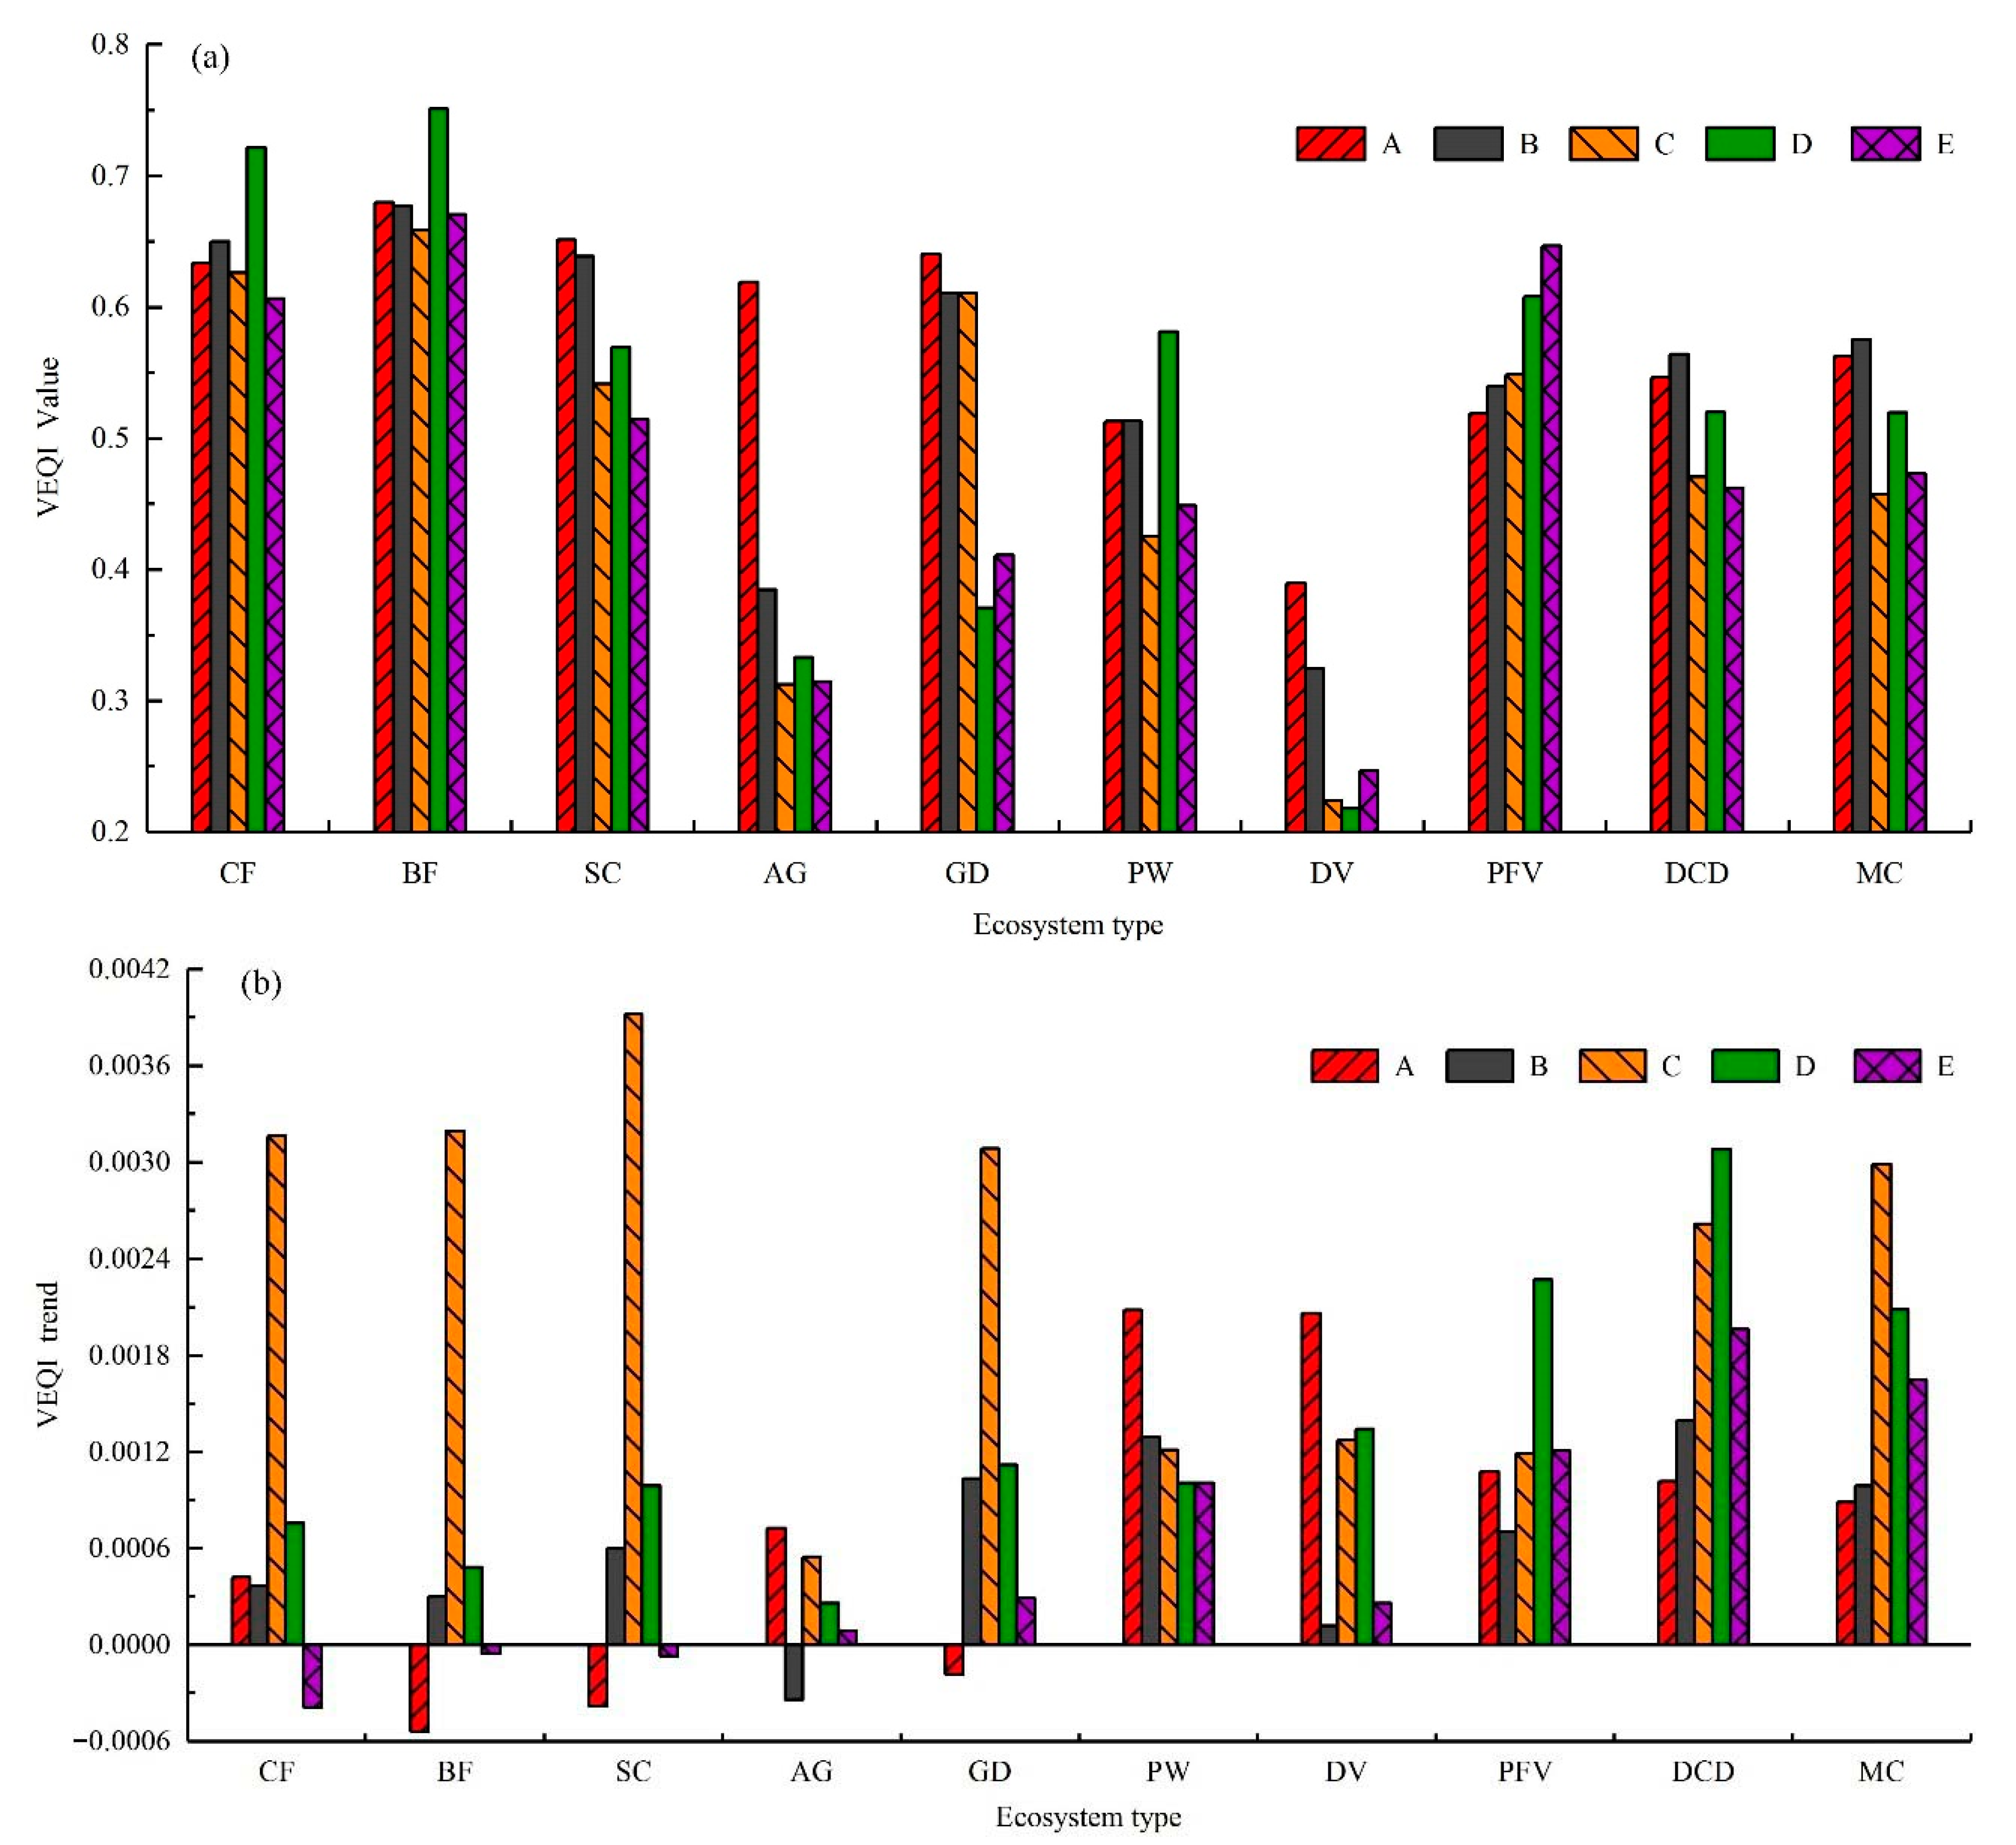
3.2.1. The Distribution and Trend of VEQ for Ecosystems within Climatic Zones
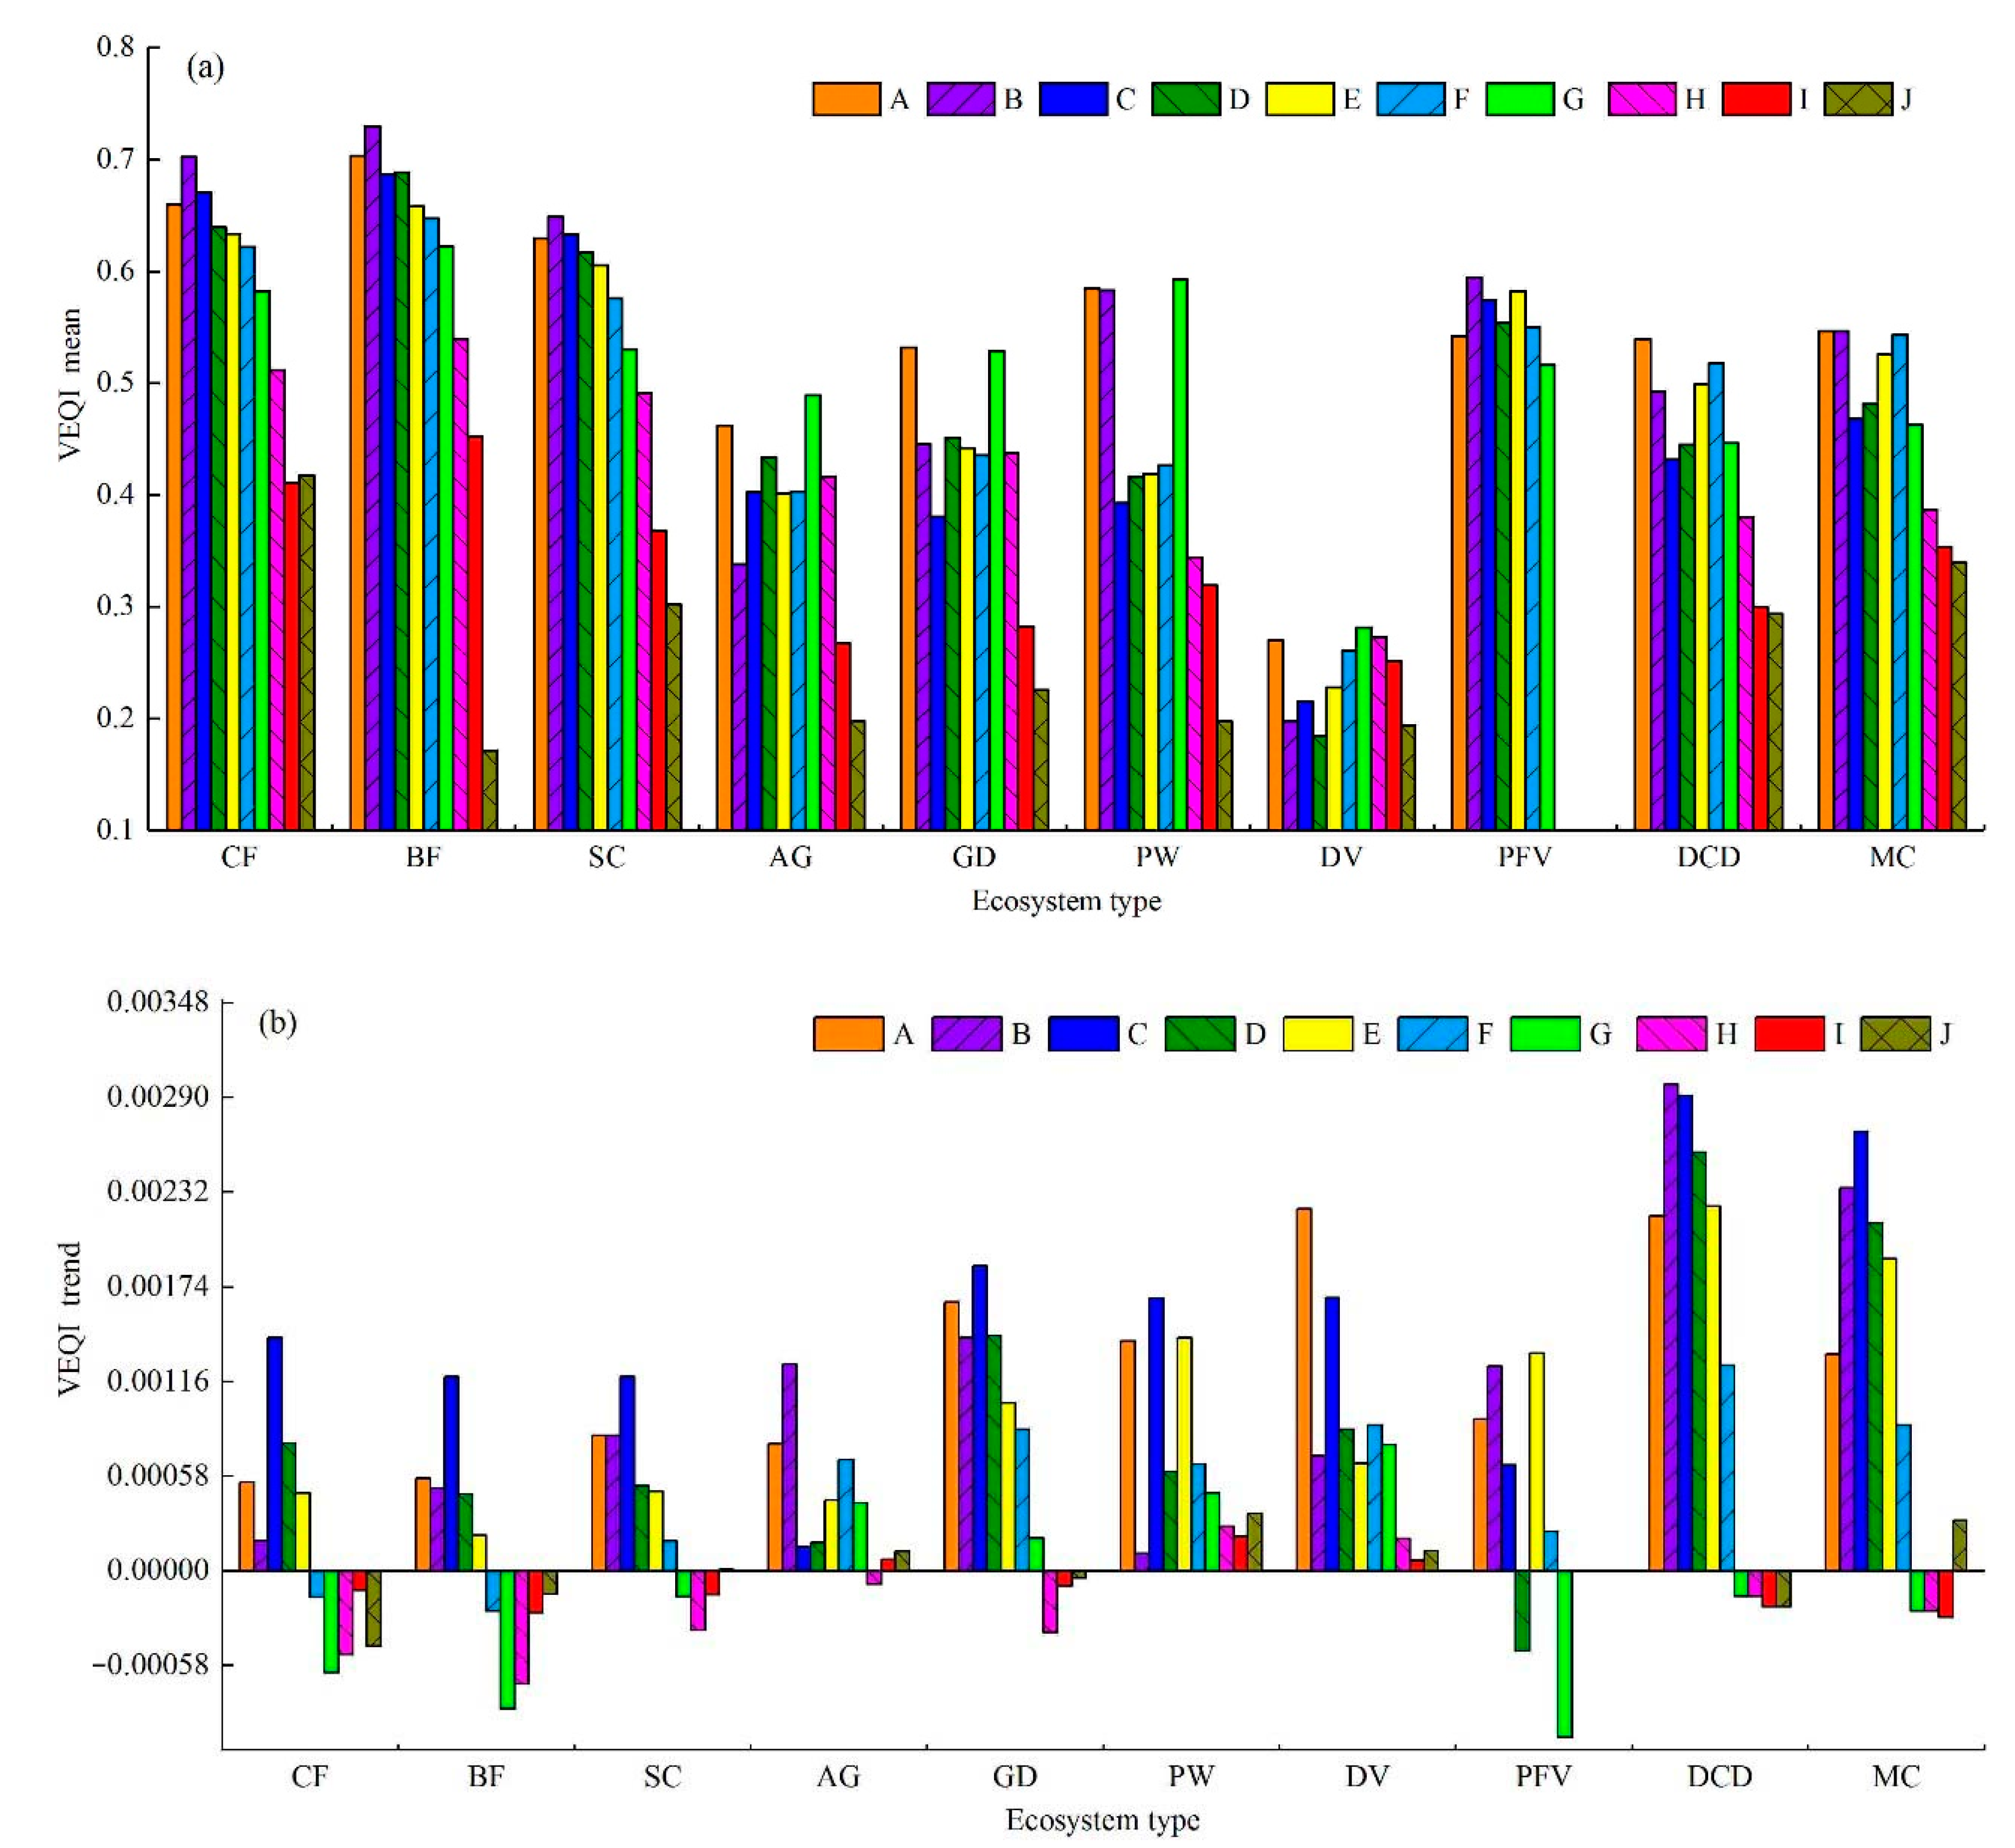
3.2.2. The Distribution and Trend of VEQ for Ecosystems within Different Altitudes
3.3. The Relationship between VEQ and Climate Factors
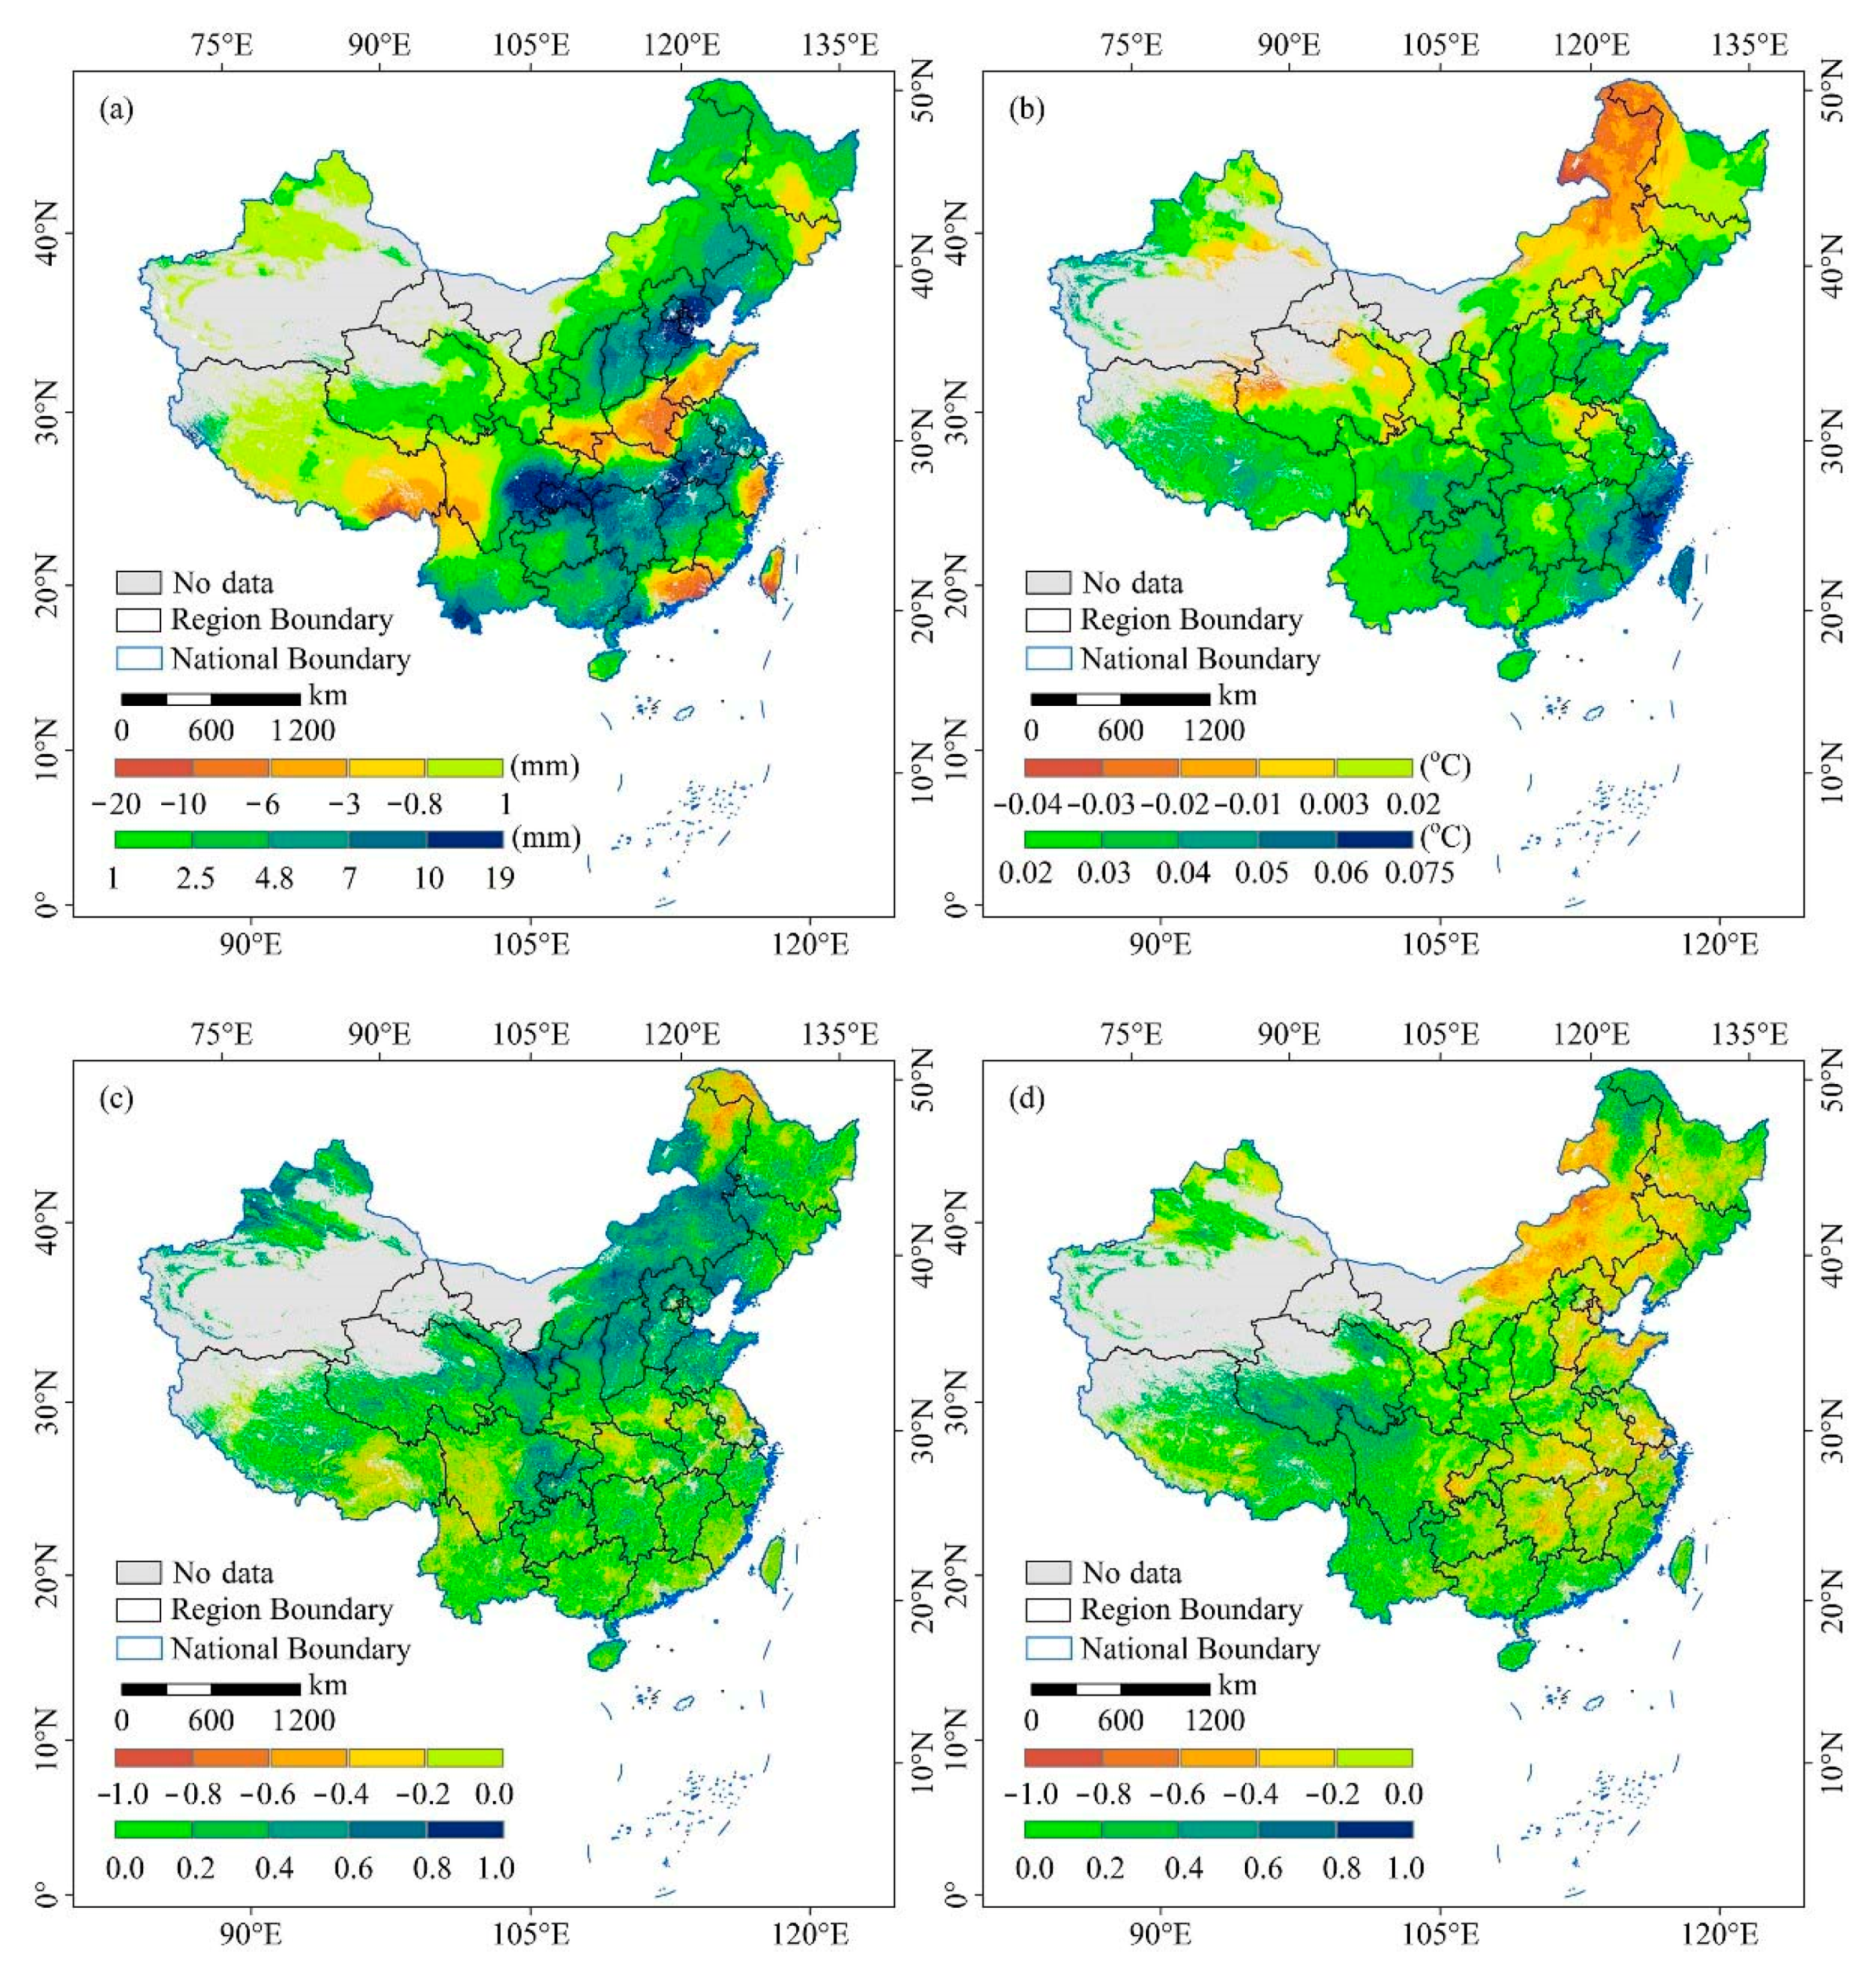
3.3.1. Climate Change and its Correlation with VEQ in Space
3.3.2. The Correlation between VEQ and Climate Factors for Different Ecosystem
3.3.3. Impact of Climatic Factors on the VEQ of Different Ecosystems at Different Range
4. Discussion
4.1. Spatial Distribution and Change Trend of the VEQ
4.2. The VEQ Characteristics of Different Ecosystem
4.3. Impact of Meteorological Factors on the VEQ and Research Deficiencies
5. Conclusions
Author Contributions
Funding
Institutional Review Board Statement
Informed Consent Statement
Data Availability Statement
Acknowledgments
Conflicts of Interest
References
- Ouyang, Z.Y.; Zheng, H.; Xiao, Y.; Polasky, S.; Liu, J.G.; Xu, W.H.; Wang, Q.; Zhang, L.; Xiao, Y.; Rao, E.M.; et al. Improvements in ecosystem services from investments in natural capital. Science 2016, 352, 1455–1459. [Google Scholar] [CrossRef]
- Liu, X.F.; Zhu, X.F.; Li, S.S.; Liu, Y.X.; Pan, Y.Z. Changes in growing season vegetation and their associated driving forces in China during 2001–2012. Remote Sens. 2015, 7, 15517–15535. [Google Scholar] [CrossRef] [Green Version]
- Wu, Y.J.; Zhao, X.S.; Xi, Y.; Liu, H.; Li, C. Comprehensive evaluation and spatial-temporal changes of eco-environmental quality based on MODIS in Tibet during 2006–2016. Acta Geogr. Sin. 2019, 74, 1438–1449. [Google Scholar] [CrossRef]
- Luo, H.X.; Wang, L.L.; Fang, J.H.; Li, Y.P.; Li, H.L.; Dai, S.P. NDVI, temperature and precipitation variables and their relationships in Hainan Island from 2001 to 2014 based on MODIS NDVI. In Geo-Informatics in Resource Management and Sustainable Ecosystem, Proceedings of the International Conference on Geo-Informatics in Resource Management and Sustainable Ecosystem, Wuhan, China, 16–18 October 2015; Springer: Berlin/Heidelberg, Germany, 2016; pp. 336–344. [Google Scholar]
- Colditz, R.; Villanueva, V.L.A.; Tecuapetla-Gomez, I.; Gómez-Mendoza, L. Temporal relationships between daily precipitation and NDVI time series in Mexico. In Proceedings of the International Workshop on the Analysis of Multitemporal Remote Sensing Images (MultiTemp), Brugge, Belgium, 27–29 June 2017. [Google Scholar] [CrossRef]
- Geng, L.Y.; Che, T.; Wang, X.F.; Wang, H.B. Detecting spatiotemporal changes in vegetation with the BFAST model in the Qilian Mountain region during 2000–2017. Remote Sens. 2019, 11, 103. [Google Scholar] [CrossRef] [Green Version]
- Deng, X.Z.; Huang, J.K.; Rozelle, S.; Zhang, J.P.; Li, Z.H. Impact of urbanization on cultivated land changes in China. Land Use Policy 2015, 45, 1–7. [Google Scholar] [CrossRef]
- Gao, J.B.; Jiao, K.W.; Wu, S.H. Investigating the spatially heterogeneous relationships between climate factors and NDVI in China during 1982 to 2013. J. Geogr. Sci. 2019, 29, 1597–1609. [Google Scholar] [CrossRef] [Green Version]
- Chen, C.; Park, T.; Wang, X.H.; Piao, S.L.; Xu, B.D.; Chaturvedi, R.K.; Fuchs, R.; Brovkin, V.; Ciais, P.; Fensholt, R.; et al. China and India lead in greening of the world through land-use management. Nat Sustain. 2019, 2, 122–129. [Google Scholar] [CrossRef]
- Liu, G.; Sun, R.; Xiao, Z.Q.; Cui, T.X. Analysis of spatial and temporal variation of net primary productivity and climate controls in China from 2001 to 2014. Acta Ecol. Sin. 2017, 37, 4936–4945. [Google Scholar] [CrossRef]
- Long, S.; Guo, Z.F.; Xu, L.; Zhou, H.Z.; Fang, W.H.; Xu, Y.J. Spatiotemporal variations of fractional vegetation coverage in China based on Google Earth Engine. Remote Sens. Technol. Appl. 2020, 35, 326–334. [Google Scholar] [CrossRef]
- Jiang, F.G.; Smith, A.R.; Kutia, M.; Wang, G.X.; Liu, H.; Sun, H. A modified KNN method for mapping the Leaf Area Index in arid and semi-arid areas of China. Remote Sens. 2020, 12, 1884. [Google Scholar] [CrossRef]
- Chuai, X.W.; Guo, X.M.; Zhang, M.; Yuan, Y.; Li, J.S.; Zhao, R.Q.; Yang, W.J.; Li, J.B. Vegetation and climate zones based carbon use efficiency variation and the main determinants analysis in China. Ecol. Indic. 2020, 111, 105967. [Google Scholar] [CrossRef]
- Zhang, Y.H.; Ye, A.Z. Spatial and temporal variations in vegetation coverage observed using AVHRR GIMMS and terra MODIS Data in the mainland of China. Int. J. Remote Sens. 2020, 41, 4238–4268. [Google Scholar] [CrossRef]
- Shi, X.L.; Wu, M.Y.; Zhang, N. Characteristics of water use efficiency of typical terrestrial ecosystems in China and its response. Trans. Chin. Soc. Agric. Eng. 2020, 36, 152–159. [Google Scholar] [CrossRef]
- Ran, Y.H.; Li, X. Plant Functional Types Map in China; Cold and Arid Regions Science Data Center: Lanzhou, China, 2011. [Google Scholar] [CrossRef]
- Ran, Y.H.; Li, X.; Lu, L.; Li, Z.Y. Large-scale land cover mapping with the integration of multi-source information based on the dempster-shafer theory. Int. J. Geogr. Inf. Sci. 2012, 26, 169–191. [Google Scholar] [CrossRef]
- Peng, S.Z.; Gang, C.; Cao, Y.; Chen, Y. Assessment of climate change trends over the Loess Plateau in China from 1901 to 2100. Int. J. Climatol. 2017, 38, 2250–2264. [Google Scholar] [CrossRef]
- Peng, S.Z.; Ding, Y.X.; Wen, Z.M.; Chen, Y.M.; Cao, Y.; Ren, J.Y. Spatiotemporal change and trend analysis of potential evapotranspiration over the Loess Plateau of China during 2011–2100. Agric. For. Meteorol. 2017, 233, 183–194. [Google Scholar] [CrossRef] [Green Version]
- Peng, S.Z.; Ding, Y.X.; Liu, W.Z.; Li, Z. 1 km monthly temperature and precipitation dataset for China from 1901 to 2017. Earth Syst. Sci. Data 2019, 11, 1931–1946. [Google Scholar] [CrossRef] [Green Version]
- Peng, S.Z. 1-km Monthly Precipitation Dataset for China (1901–2017); National Tibetan Plateau Data Center: Beijing, China, 2020. [Google Scholar] [CrossRef]
- Ding, Y.X.; Peng, S.Z. Spatiotemporal trends and attribution of drought across China from 1901–2100. Sustainability 2020, 12, 477. [Google Scholar] [CrossRef] [Green Version]
- Ma, Z.C.; Yu, H.B.; Cao, C.M.; Zhang, Q.F.; Hou, L.L.; Liu, Y.X. Spatiotemporal characteristics of fractional vegetation coverage and its influencing factors in China. Resour. Environ. Yangtze Basin 2020, 29, 1310–1321. [Google Scholar] [CrossRef]
- Ftnsholt, R.; Sandholt, I.; Rasmussen, M.S. Evaluation of MODIS LAI, FAPAR and the relation between FAPAR and NDVI in a semi-arid environment using in situ measurements. Remote Sens. Environ. 2004, 91, 490–507. [Google Scholar] [CrossRef]
- Sabokbar, H.F.; Roodposhti, M.S.; Tazik, E. Landslide susceptibility mapping using geographically-weighted principal component analysis. Geomorphology 2014, 226, 15–24. [Google Scholar] [CrossRef]
- Jensen, J.L.R.; Humes, K.S.; Hudak, A.T.; Vierling, L.A.; Delmelle, E. Evaluation of the MODIS LAI product using independent lidar-derived LAI: A case study in mixed conifer forest. Remote Sens. Environ. 2011, 115, 3625–3639. [Google Scholar] [CrossRef] [Green Version]
- Liao, Y.R.; Gai, Y.Y.; Yao, Y.J.; Fan, W.J.; Xu, X.R.; Yan, B.Y. Validation methods of LAI products on the basis of scaling effect. J. Remote Sens. 2015, 19, 143–152. [Google Scholar] [CrossRef]
- Kauth, R.J.; Thomas, G.S. The tasseled cap—A graphic description of the spectral-temporal development of agricultural crops as seen in Landsat. In Proceedings of the Symposium on Machine Processing of Remotely Sensed Data, West Lafayette, IN, USA, 29 June–1 July 1976; pp. 41–51. [Google Scholar]
- Huang, C.Q.; Wylie, B.; Yang, L.; Homer, C.; Zylstra, G. Derivation of a tasselled cap transformation based on Landsat 7 at-satellit reflectance. Int. J. Remote Sens. 2002, 23, 1741–1748. [Google Scholar] [CrossRef]
- Xu, H.Q.; Wang, Y.F.; Guan, H.D.; Shi, T.T.; Hu, X.S. Detecting ecological changes with a remote sensing based ecological index (RSEI) produced time series and change vector analysis. Remote Sens. 2019, 11, 2345. [Google Scholar] [CrossRef] [Green Version]
- Lobser, S.E.; Cohen, W.B. MODIS tasselled cap: Land cover characteristics expressed through transformed MODIS data. Int. J. Remote Sens. 2007, 28, 5079–5101. [Google Scholar] [CrossRef]
- Rhee, J.; Im, J.; Carbone, G.J. Monitoring agricultural drought for arid and humid regions using multi-sensor remote sensing data. Remote Sens. Environ. 2010, 114, 2875–2887. [Google Scholar] [CrossRef]
- Weng, Q.; Fu, P.; Gao, F. Generating daily land surface temperature at Landsat resolution by fusing Landsat and MODIS data. Remote Sens. Environ. 2014, 145, 55–67. [Google Scholar] [CrossRef]
- Xu, H.Q. Dynamic of soil exposure intensity and its effect on thermal environment change. Int. J. Climatol. 2014, 34, 902–910. [Google Scholar] [CrossRef]
- Liu, Q.; Yang, Z.P.; Han, F.; Shi, H.; Wang, Z.; Chen, X.D. Ecological environment assessment in world natural heritage site based on Remote-Sensing Data. a case study from the Bayinbuluke. Sustainability 2019, 11, 6385. [Google Scholar] [CrossRef] [Green Version]
- Yue, H.; Liu, Y.; Li, Y.; Lu, Y. Eco-environmental quality assessment in China’s 35 major cities based on remote sensing ecological index. IEEE Access. 2019, 7, 51295–51311. [Google Scholar] [CrossRef]
- Liu, D.; Hao, S. Ecosystem health assessment at county-scale using the pressure-state-response framework on the Loess Plateau, China. Int. J. Environ. Res. Public Health 2017, 14, 2. [Google Scholar] [CrossRef] [PubMed] [Green Version]
- Liu, X.F.; Zhu, X.F.; Pan, Y.Z.; Li, S.S.; Zhang, D.H.; Liu, Y.X. The spatial-temporal changes of cold surge in Inner Mongolia during recent 53 Years. Acta Geogr. Sin. 2014, 69, 1013–1024. [Google Scholar] [CrossRef]
- Wang, G.G.; Zhou, K.F.; Sun, L.; Qin, Y.F.; Li, X.M. Study on the vegetation dynamic change and R/S analysis in the past ten years in Xinjiang. Remote Sens. Technol. Appl. 2010, 25, 84–90. [Google Scholar] [CrossRef]
- He, Y.; Yan, H.W.; Ma, L.; Zhang, L.F.; Qiu, L.S.; Yang, S.W. Spatiotemporal dynamics of the vegetation in Ningxia, China using MODIS imagery. Front. Earth Sci. 2020, 14, 221–235. [Google Scholar] [CrossRef]
- Wang, S.X.; Yao, Y.Y.; Zhou, Y. Analysis of ecological quality of the environment and influencing factors in China during 2005–2010. Int. J. Environ. Res. Public Health 2014, 11, 1673–1693. [Google Scholar] [CrossRef]
- Zhang, D.; Liu, X.M.; Zhang, L.; Zhang, Q.; Gan, R.; Li, X.H. Attribution of evapotranspiration changes in humid regions of China from 1982 to 2016. J. Geophys. Res.-Atmos 2020, 125. [Google Scholar] [CrossRef]
- Gao, Y.; Zhu, X.J.; Yu, G.R.; He, N.P.; Wang, Q.F.; Tian, J. Water use efficiency threshold for terrestrial ecosystem carbon sequestration in China under afforestation. Agric. For. Meteorol. 2014, 195, 32–37. [Google Scholar] [CrossRef]
- Zhao, T.; Bai, H.; Deng, C.H.; Meng, Q.; Guo, S.Z.; Qi, G.Z. Topographic differentiation effect on vegetation cover in the Qinling Mountains from 2000 to 2016. Acta Ecol. Sin. 2019, 39, 4499–4509. [Google Scholar] [CrossRef]
- Zhou, Z.Q.; Ding, Y.B.; Shi, H.Y.; Cai, H.J.; Fu, Q.; Liu, S.N.; Li, T.X. Analysis and prediction of vegetation dynamic changes in China: Past, present and future. Ecol. Indic. 2020, 117, 106642. [Google Scholar] [CrossRef]
- FAOSTAT, Food and Agriculture Organization (FAO). 2018. Available online: http://www.fao.org/faostat/ (accessed on 1 August 2020).
- Zhou, J.L.; Ma, M.G.; Xiao, Q.; Wen, J.G. Vegetation dynamics and its relationship with climatic factors in southwestern China. Remote Sens. Technol. Appl. 2017, 32, 966–972. [Google Scholar] [CrossRef]
- Jiao, K.W.; Gao, J.B.; Wu, S.H.; Hou, W.J. Research progress on the response processes of vegetation activity to climate change. Acta Ecol. Sin. 2018, 38, 2229–2238. [Google Scholar] [CrossRef]
- Zhang, M.; Huang, X.J.; Chuai, X.W.; Yang, H.; Lai, L.; Tan, J.Z. Impact of land use type conversion on carbon storage in terrestrial ecosystems of China:a spatial-temporal perspective. Sci. Rep. 2015, 5, 10233. [Google Scholar] [CrossRef] [PubMed]


| Indicator Factors | 2000 | 2006 | 2012 | 2017 | ||||
|---|---|---|---|---|---|---|---|---|
| PC1 | PC2 | PC1 | PC2 | PC1 | PC2 | PC1 | PC2 | |
| LST | −0.278 | 0.786 | −0.281 | 0.861 | −0.253 | 0.843 | −0.237 | 0.911 |
| WUE | 0.043 | 0.724 | 0.083 | 0.831 | 0.191 | 0.853 | 0.155 | 0.751 |
| NPP | 0.921 | 0.283 | 0.92732 | 0.237 | 0.920 | 0.206 | 0.937 | 0.118 |
| FVC | 0.919 | 0.251 | 0.917 | 0.246 | 0.939 | 0.223 | 0.953 | 0.096 |
| LAI | 0.828 | 0.435 | 0.825 | 0.348 | 0.903 | 0.274 | 0.922 | 0.205 |
| WET | 0.451 | 0.753 | 0.431 | 0.736 | 0.455 | 0.799 | 0.399 | 0.886 |
| Eigenvalue | 3.113 | 1.878 | 3.086 | 2.336 | 3.158 | 2.245 | 2.967 | 2.250 |
| Variance contribution/% | 53.059 | 34.518 | 52.8255597 | 35.400 | 52.488 | 36.11 | 49.995 | 37.030 |
| Cumulative contribution/% | 53.059 | 87.577 | 52.827 | 88.227 | 52.488 | 88.590 | 49.995 | 87.025 |
| Hurst Exponent | Trend Coefficient (Slope) and Significance (P) | VEQ forecast type | Area Percentage (%) |
|---|---|---|---|
| 0.5 < H < 1 | Slope < −0.003; P < 0.05 | Sustained significant decrease | 1.69 |
| 0.5 < H < 1 | −0.003 < Slope < −0.001; P > 0.05 | Sustained not-significant decrease | 5.87 |
| 0.5 < H < 1 | −0.001 < Slope < 0.001; P > 0.05 | Basic stability | 41.13 |
| 0.5 < H < 1 | 0.001< Slope < 0.003; P > 0.05 | Sustained not-significant increase | 15.14 |
| 0.5 < H < 1 | Slope > 0.003; P > 0.05 | Sustained significant increase | 15.09 |
| 0 < H < 0.5 | Slope < −0.003; P < 0.05 | Not-Sustained significant decrease | 1.23 |
| 0 < H < 0.5 | −0.003 < Slope < −0.001; P > 0.05 | Not-Sustained not-significant decrease | 1.72 |
| 0 < H < 0.5 | −0.001 < Slope < 0.001; P > 0.05 | Not-Basic stability | 9.53 |
| 0 < H < 0.5 | 0.001< Slope < 0.003; P > 0.05 | Not-Sustained not-significant increase | 4.23 |
| 0 < H < 0.5 | Slope > 0.003; P > 0.05 | Not-Sustained significant increase | 4.37 |
| Ecosystem Type | Grid Counts | VEQI Value | Altitude | ||||
|---|---|---|---|---|---|---|---|
| Mean Value | Trend (Per Year) | Hurst Exponent | Mean Value (m) | R | |||
| Forest vegetation | Coniferous forest | 635,367 | 0.685 | 0.00106 | 0.5672 | 1189 | −0.308 |
| Broadleaved forest | 659,414 | 0.731 | 0.00131 | 0.5692 | 857 | −0.113 | |
| Low-height natural vegetation | Shrubs | 558,158 | 0.643 | 0.00149 | 0.5690 | 1398 | −0.405 |
| Arctic grass | 920,397 | 0.327 | 0.00010 | 0.5908 | 4600 | −0.517 | |
| Grassland | 1,700,267 | 0.494 | 0.00209 | 0.5648 | 1692 | −0.171 | |
| Permanent wetlands | 90,494 | 0.588 | 0.00155 | 0.5684 | 1161 | −0.355 | |
| Desert vegetation | 408,587 | 0.296 | 0.00148 | 0.5642 | 2970 | 0.061 | |
| Artificially cultivated vegetation | Paddy field-dominated vegetation | 444,124 | 0.625 | 0.00159 | 0.5679 | 274 | 0.189 |
| Dry cropland-dominated vegetation | 1,278,668 | 0.580 | 0.00269 | 0.5658 | 603 | −0.302 | |
| Mixed cropland | 166,657 | 0.598 | 0.00359 | 0.5640 | 681 | −0.148 | |
| Ecosystem Type | Precipitation | Temperature | |||||
|---|---|---|---|---|---|---|---|
| Mean Value (mm) | R | P | Mean Value (°C) | R | P | ||
| Forest vegetation | Coniferous forest | 136 | 0.008 | 0.436 | 19.44 | 0.046 | 0.461 |
| Broadleaved forest | 157 | 0.037 | 0.455 | 19.46 | 0.014 | 0.496 | |
| Low-height natural vegetation | Shrubs | 149 | 0.083 | 0.450 | 19.77 | 0.022 | 0.488 |
| Arctic grass | 74 | 0.162 | 0.416 | 5.79 | 0.240 | 0.349 | |
| Grassland | 89 | 0.289 | 0.261 | 16.45 | −0.082 | 0.438 | |
| Permanent wetlands | 86 | 0.110 | 0.345 | 14.90 | 0.047 | 0.366 | |
| Desert vegetation | 63 | 0.213 | 0.320 | 11.45 | 0.077 | 0.437 | |
| Artificially cultivated vegetation | Paddy field-dominated vegetation | 147 | 0.114 | 0.420 | 24.06 | −0.150 | 0.424 |
| Dry cropland-dominated vegetation | 117 | 0.285 | 0.281 | 21.05 | −0.140 | 0.466 | |
| Mixed cropland | 129 | 0.228 | 0.332 | 21.42 | −0.086 | 0.481 | |
| Vegetation | Precipitation Value Range (mm) | Temperature Value Range (°C) | ||||||
|---|---|---|---|---|---|---|---|---|
| Scope | Positive | Negative | Fluctuating | Scope | Positive | Negative | Fluctuating | |
| Coniferous forest | 18–594 | 18–108 | — | 108–594 | 3–27 | 3–12 | 12–23 | 23–27 |
| Broadleaved forest | 10–875 | 10–109 | — | 109–875 | 6–27 | 6–17 | 17–27 | — |
| Shrubs | 11–419 | 11–168 | — | 168–419 | 1–27 | 1–23 | 23–27 | — |
| Arctic grass | 0–261 | 13–261 | 0–13 | — | −1–26 | −1–26 | — | — |
| Grassland | 0–187 | 0–100 | — | 100–187 | 2–26 | 2–13 | 13–26 | — |
| Permanent wetlands | 4–311 | 4–85 | 148–311 | 85–148 | 0–27 | 0–13 | 13–23 | 23–27 |
| Desert vegetation | 0–356 | 12–356 | 0–12 | — | −2–27 | −2–10 | 10–18 | 18–27 |
| Paddy field-dominated vegetation | 25–535 | 25–74 | 174–535 | 74–174 | 16–27 | — | 16–27 | — |
| Dry cropland-dominated vegetation | 3–244 | 3–38, 54–169 | 38–54 | 169–244 | 8–27 | — | 8–15 | 15–27 |
| Mixed cropland | 5–589 | 5–172 | — | 172–589 | 8–27 | 8–17 | 24–27 | 17–24 |
Publisher’s Note: MDPI stays neutral with regard to jurisdictional claims in published maps and institutional affiliations. |
© 2021 by the authors. Licensee MDPI, Basel, Switzerland. This article is an open access article distributed under the terms and conditions of the Creative Commons Attribution (CC BY) license (http://creativecommons.org/licenses/by/4.0/).
Share and Cite
Li, C.; Li, X.; Luo, D.; He, Y.; Chen, F.; Zhang, B.; Qin, Q. Spatiotemporal Pattern of Vegetation Ecology Quality and Its Response to Climate Change between 2000–2017 in China. Sustainability 2021, 13, 1419. https://doi.org/10.3390/su13031419
Li C, Li X, Luo D, He Y, Chen F, Zhang B, Qin Q. Spatiotemporal Pattern of Vegetation Ecology Quality and Its Response to Climate Change between 2000–2017 in China. Sustainability. 2021; 13(3):1419. https://doi.org/10.3390/su13031419
Chicago/Turabian StyleLi, Chao, Xuemei Li, Dongliang Luo, Yi He, Fangfang Chen, Bo Zhang, and Qiyong Qin. 2021. "Spatiotemporal Pattern of Vegetation Ecology Quality and Its Response to Climate Change between 2000–2017 in China" Sustainability 13, no. 3: 1419. https://doi.org/10.3390/su13031419