Abstract
The reported research examines the impact of product portfolio labeling strategies on brand reputation and equity. A netnographic approach allowed to observe winery portfolio labeling approaches and create a typology of winery labeling strategies. Expert evaluation served to assess the dependent variable brand equity by deploying a regression analysis. For the observed wine industry, being part of the food industry, creating consistent and recognizable brands has a direct relevance for reducing (sustainability-related) food information overload and thereby building sustainable brand equity. The results uncover the relative importance of each of the six identified labeling strategies as well as their impact on reputation and brand equity creation. The results point to the need to establish a consistent, strategically founded product communication. Such an approach, with a positive effect on reputation building can serve to build sustainable brand equity. “Stuck in the middle”-type strategies apparently diminish winery brand equity exploitation. The findings contribute to the knowledge on food labels in product communication strategies and their impact on organizational brand equity, thereby having high relevance for the implementation of environmental certification initiatives in an organizational context. The article deploys a novel research approach in an under-researched area to provide new insights for further research as well as implications for practice.
Keywords:
regression; wine labels; quality; product portfolio; branded house; house of brands; brand family 1. Introduction
The presented research aspires to provide evidence for the under-researched link between product communication from a strategic portfolio perspective as a means to transport concise, appealing information and brand equity. It does so by exploring a set of German wineries. Wine suits this research idea regarding two aspects. Firstly, wine product design and especially labeling are a strong decision factor in the buying process, with high relevance for the strategic positioning of the producer. Labels provide relevant product information but also serve for strategic communication by the producer. Hence, the labels must meet food- and health-related information standards, with growing requirements for transparency. Furthermore, in wine production, design and communication have a key role in supporting strategic profiling of producers, their aspirations as well as the personality of the company owner in micro-wineries. Hence, labeling serves not only to communicate nutritional data or legally required information, but also to awaken consumer emotions and motivate buying. Labels are therefore of paramount importance for generating and sustaining customer loyalty as well as for charging a price premium depend. Uncovering the most relevant elements for creating consistent and recognizable winery brands has a direct relevance for reducing food information overload and thereby building brand reputation and equity.
No previous research has dealt with the impact of organization/business product portfolio labeling on SME (Small and Medium-sized Enterprise) brand equity. Specifically, with the exception of the explorative research conducted by Durrieu [1] and experimental research conducted by Elliot and Barth [2], there has been no further research on the impact of packaging and/or labeling on brand equity in the wine industry. In addition, previous literature in the field of labeling strategies reports almost exclusively on corporations, leaving SMEs and SME wineries as research gap in this field. Brand management in SMEs is guided by entrepreneurs’ implicit knowledge in a process that combines strategic and communicative action with the environment, while in large organizations, it is based on a more rational approach and explicit knowledge of consumer behavior and gaps in the market [3,4,5]. This study aims at filling these gaps.
Research on wine labels and packaging is largely dominated by a customer-based perspective, exploring in detail how specific label design and packaging appeal to customers, capture their attention and impact on taste, quality perceptions and, ultimately, customers’ choice of wine [6,7,8,9,10]. Areas of scientific analysis include the importance of label processing (reading) fluency [11], the impact of labels and packaging on hedonic liking [12]; the impact of fun wine labels on consumer preferences [13]; the impact of wine back labels on consumer preferences [14]; the impact of wine labels on millennial consumers [15] and the interest of consumers in eco-labeled wines [16,17]. A small research stream on wine labeling, leaving the classical route of a consumer perspective, deals with the duality of price premium for eco-wines and price reduction for eco-labeled wines as well as motivations (improvement, visibility and public relations) and deterrents (resources required to obtain certification) of participating in eco-certification [18,19]. Regarding the impact of wine packaging on wine brands, the impact of visual appeal has been researched in detail as well as how low-complexity contexts enhance the visual appeal of a product by influencing consumer attention and processing fluency [20]. Indeed, research on wine packaging lacks a branding perspective. The body of knowledge includes the impact of different cultural contexts on perceived attractiveness of wine; the historical cases of innovative packaging and experimental consumer responses to innovative packaging; profiles of consumers willing to pay for “green” packaging; as well as Life-Cycle Assessments (LCAs) of wine packaging [21,22,23,24,25,26]. In order to provide evidence for under-searched causalities, this research contributes by exploring the relation between winery labeling and product visual appearance on one side and winery brand equity on the other side. The created database for analysis extracts different sources to analyze the two aspects, drawing on wineries’ information complemented by expert evaluation. The research highlights strategic aspects by exploring the importance of communicating the product portfolio (with corresponding labels) in a way that supports the overall company brand equity.
Customer pressure for more sustainable products has spurred a multitude of labeling approaches, confronting producers in the food industry with serious challenges regarding sustainability-oriented labeling [27]. One of these challenges is whether to steer the whole company towards sustainability [28], only one product family [29] or just one product [30]. This study provides an answer to the question of how these different labeling approaches impact the overall SME winery brand equity by researching six different labeling approaches, from “branded house” and “brand family” to several types of “house of brands”. Hereby, the research provides insights on how successful sustainability initiatives should be communicated in a way that reinforces sustainability of the SME brand equity. Sustainability is much more than a marketing tool, as it aims at challenging and changing existing consumption patterns, but it needs to include a mixture of competitive and collaborative approaches [31]. In this sense, the implementation and communication of sustainability should be aligned with SMEs’ overall goals. Previous research reported that for brands with high equity, the marginal effects of adding an environmental label are lower than for low-equity brands, being even zero for high-end brand equity brands [32].
This research sets out to examine the impact of different winery labeling strategies and their impact on winery brand equity in order to address the aforementioned gaps in the literature and to provide practical orientation for winery brand management, highly relevant in light of the drive-out wine markets. To this end, the research exploits reputational effects, leaning on accessible information from different sources (i.e., brand performance measured by expert ratings and an analysis of labeling strategies, examining producer information as provided via the product portfolio on wineries’ websites). Having in mind that the two sources to measure reputation possess individual approaches to judging wines and wineries/vintners, it is important to emphasize that this research focusses on the winery rating. Three questions guide the research, which are further elaborated in the literature review:
- RQ1: What is the typology of labeling approaches in winery product portfolio management?
- RQ2: What is the impact of each labeling approach on winery brand equity?
- RQ3: How valid and, therefore, replicable are the identified relationships of labeling approach on winery brand equity?
2. Literature Review
2.1. Sustainability, Labeling and Packaging in the Food and Beverage Industry
There is a tendency in food-related research on labeling in recent years to be focused on sustainability labeling and certification [33]. It has been demonstrated that sustainability-oriented labels receive greater evaluations than non-sustainability ones with customers who are concerned with social desirability and that sustainability claims can improve perceived flavor of the product, but sustainability claims cannot replace the importance of sensory attributes such as flavor in hedonic products [34,35]. Research in the coffee industry has determined the conditions under which uncertified internal corporate social responsibility (CSR) claims and external third-party CSR labels are successful in increasing customer evaluations and deterring greenwashing claims [36]. In addition, it has been demonstrated with the example of coffee certifications that there is no significant difference in the positive effect of company self-declarations regarding sustainability and third-party certifications [27]. A research stream on food labels in the retail context predominantly explores packaging and labeling of retailers’ private labels (PLs) in comparison to independent producers’ national brands (NBs) [37,38] as well as the impact of innovation and norm-challenging products on both other product brands as well as retailer brand [30].
Food packaging has multiple functions, from informing consumers about the content and quality to branding and marketing purposes as well as addressing broader health, social and environmental issues [39,40,41,42,43]. In addition, technological and environmental aspects of product packaging have been well researched and documented in the literature [44,45]. Consumer-based research on product packaging is also significant. Such research concentrates on visual and haptic perceptions of online consumers as well as general (offline) consumer perceptions and product positioning strategies, based on package evaluations (colors, typography, graphic forms and images) [46,47]. Life-Cycle Assessment (LCA) seems to be one of the most well-established methods for examining and quantifying environmental impacts of product packaging, both in the food industry and beyond [48,49]. In addition, a direct relation has been determined between organizational product design function and logistics function, as product packaging decisions directly impact logistics performance in terms of costs and environmental impacts [50]. Package recycling is a potentially powerful tool towards transformation to circular economy and presents and important research field both for business and management research as well as for marketing and consumer research [51,52,53,54].
2.2. Brand Equity in the Wine Industry
Wine brand equity research is rather scarce and it develops and deploys primarily wine-specific brand equity measures and dimensions, while no research has deployed standard brand equity instruments such as those of Aaker [55] and Yoo and Donthu [56]. Hereby, the specific natures of both the wine industry as well as wine brands are laid-out. They include aspects of standard brand equity models such as geographic and grape variety in relation to brand image; snob effect of collectability on brand associations; wine auctions’ effect on brand familiarity; the impact of vintage variability and style as well as the impact of the opinion of wine critics and peers on perceived quality [57]. Previous research on wine brand equity has examined in more detail the impact of environmental inclination on wine brand equity, the impact of positive affect during wine tasting on wine brand equity as well as the impact of quality, price, social acceptance and motivations on wine region brand equity [1,58,59,60,61]. Although wine brand equity research is primarily based on consumer-based samples, this research build on methodology previously deployed by Blair, Atanasova, Pitt, Chan and Wallstrom [60] on deploying third-party evaluations of wineries for researching wine brand equity. However, the important difference is that this research deals with winery brands and winery brand evaluations and not wine brand and wine brand evaluations. The case study presented by Pitta [62] is the only previous research found dealing with winery-level brand equity. Brand equity has also been researched in the related and synergetic industry of wine tourism. This research stream deals both with wineries’ brand equity and related cellar door service quality [63,64] as well as wine regions’ brand equity by examining the impact of the denomination of origin and regions’ brand image on wine tourism brand equity [65,66].
2.3. Brand Equity Foundations and the Role of Sustainability
Core elements of brand equity are brand assets and brand liabilities, which can be grouped into five categories: (1) brand loyalty, (2) name awareness, (3) perceived quality, (4) brand associations in addition to perceived quality and (5) other proprietary assets (patents, trademarks, channel relationships) [55]. While Aaker’s model is based on brand assets, some more recent works on brand equity exclude these aspects and emphasize the awareness aspect of brand equity instead, thereby defining the following major elements of brand equity: (1) Aided brand awareness; (2) Unaided (spontaneous) brand awareness; (3) Consideration set; (4) Already consumed [4]. However, the present study focuses on third-party evaluations as an indicator for perceived quality as well as a proprietary-like asset of a winery. Both aspects represent important elements in the brand equity model [55]. Indeed, third-party evaluations are increasingly relevant in consumers’ choices and because of the brand connotation, an important part of winery brand equity in the German wine industry.
The issue of sustainability and organic food has been of considerable interest in food-related brand equity research. There is evidence that adding (organic/sustainable) food identification impacts customer purchase intention and that it is mediated by brand equity and brand identity as well as altruistic attribution, both for sub-label brands as well as for corresponding umbrella-label brands [67,68]. Such research also deals with the conditions under which corporate social responsibility (CSR) activities positively influence food brand equity, thereby identifying brand value–cause fit and brand function–cause fit as two important dimensions of a fit between a brand and a social cause [69]. The question of co-branded and co-labeled food products has also been researched in detail, providing evidence that this approach is generally a win–win strategy, but it benefits the low-equity brand slightly more than the high-equity one [70]. In recent years, the impact of co-creation and social media has been in the focus of brand equity research in the food industry and beyond [71,72,73]. Furthermore, multi-industry studies which include the food industry have dealt with brand equity restoration and recovery as well as multi-industry comparison of brand equity strength, where it has been found that food industry brands have lower brand equity strength than banking brands [74,75,76].
Brand equity is positioned as a self-contained research field. It is positioned between financial and marketing perspectives, between consumer-based and organizational-based perspectives, with a growing importance of sustainability aspects on brand equity [77]. Brand equity has been researched in a variety of industries—some research takes a multi-industry perspective, while others research, in detail, brand equity in industries ranging from consumer goods (e.g., smartphones), food and beverage and tourism (including airlines, hotels and restaurants) all the way to financial services [69,78,79,80,81,82,83].
The literature on brand equity in the luxury market has confirmed that brand equity predicts both consumers’ attitudes as well as their willingness to pay a price premium [84]. In luxury services, brand equity itself is impacted by employee brand commitment, while a negative impact of renting services has been identified in the case of traditional luxury brands [85,86]. The research on brand equity has also identified that innovation attributes benefit low-equity brands (e.g., with price deals and promotions) more than high-equity brands (e.g., with high advertising spending, high price and good store image) [87,88]. Further relevant streams in brand equity research identified the positive impact of brand awareness and associations, perceived quality, brand loyalty, perceived “brand skill”, brand experience, brand ambassador programs as well as endorser credibility on brand equity [89,90,91,92].
The research stream on sustainability and brand equity sheds light on the impact of environmental and social governance on brand equity [93,94,95]. A positive effect of CSR on performance has been identified in the literature [96]. The same has been confirmed regarding the positive effect of CSR on brand loyalty as a key dimension driving the positive effect on brand equity. Other brand equity metrics either seem not to be influenced by CSR activities (perceived brand quality) or have a more complex, U-shaped relation (brand awareness) [97]. Having in mind the importance of eco-labeling and certification for sustainability transitions in the food and beverage industry and beyond [98,99,100], there is a lack of research on the impact of eco-labeling on organizational brand equity, furthermore triggering the question, what is the best way to label in a complex product portfolio to build sustainable brand equity? This question is unanswered in the literature. Whereas the impact of sustainability/environmental stamps has not been directly researched, it is assumed that introducing new graphical elements such as environmental stamps, badges or logos on a wine label could have detrimental effects on winery brand equity if not planned for on a winery level. Therefore, this article provides insights into which labeling approaches impact positively and which impact negatively on winery brand equity.
2.4. Brand Portfolio Labeling and Architecture in Corporations and SMEs
The impact of branding strategies (branded house, house of brands and mixed branding) on brand equity has been researched before, with the results confirming that the “branded house” approach has a positive effect on brand equity, while mixed branding has a negative effect on brand equity [101]. The present research deploys a uniformity– diversity continuum to research “real-life” labeling approaches used in the everyday practice of German wineries. A similar approach has been previously used to research brand strategies on a continuum from branded house to house of brands [102]. The present research expands this research approach by (1) adapting the approach to SME winery brands instead of corporate brands, by observing labeling approaches on wineries’ websites as a proxy for brand architecture; (2) defining six corresponding non-exclusive labeling strategies which represent brand architectures, thereby attempting to expand the understanding of the “brand family” approach [103] and the diversity options which exist in the “house of brands” approach [102], as both are under-researched areas. Labels and labeling approaches have been deployed in this research as branding tools, while excluding other functions of labeling such as informing on the content of the product and health-related, social and environmental issues. However, the findings have implications for SME brand equity and are therefore of relevance for implementing externally initiated or self-initiated sustainability-oriented labeling in a way that does not hurt the overall SME brand equity.
3. Methodology
In order to explore wine labeling from a strategic portfolio perspective and its impact on brand equity, a novel methodology that draws on third-party evaluations of winery has been deployed. It should be noted that portfolio labeling strategies are often termed brand architecture in the corporate brand literature, which is not completely suitable for the SME winery context. The research combines a netnographic approach for data collection, assessing the producer’s positioning with secondary data on third-party evaluation of the searched wineries. The netnographic approach is especially well suited for inductive research and theory building [104,105]. Netnography evolved from ethnography, used in digital marketing research and of relevance for consumer research, sociology and cultural anthropology [106].
The data for the study were collected between 2017 and 2019. This netnographic part of data on wine labeling approaches was collected by observing wineries’ websites and noting which of the predefined approaches were being deployed through six “dummy” variables. The observations of the winery websites have been retrieved and thereby confirmed by an individual assessment of three observers (both authors as well as a third person), thereby securing a six-eye data collection control mechanism. The evaluation of the strategic labeling draws on colors, logo usage and placement of information. Therefore, the categories stretched on a continuum including “Homogenous—whole winery”, “Homogenous—wine line”, “Same shapes, varied colors”, “Hetergeneous with some recognition elements”, “Unique single wine” and “Unique single alcoholic product (other than wine)”, as presented in Figure 1 below. The categories are signified with suitable graphics which represent the logical construct behind the labeling strategy. Starting on the left, the most simplistic approach is presented as the most uniform type of labeling, where all the labels are practically the same, also termed “branded house” in the literature. The second category represents separate wine lines, where there are no differences inside a wine line but the whole wine line itself is different from the rest of the portfolio, also termed “brand family” in the literature. The third category represents labels of the same shape, which differ in color as a further step towards diversity, representing the first out of four different representations of the “house of brands” approach from the literature. The most complex approach is the one where all the shapes and colors of labels differ, but recognition is fostered through some small graphical elements (a badge, a logo or a stamp). This is the second “house of brands” approach. Approaches adding the most diversity are those adding single wines that are unrelated in terms of labeling to the rest of the portfolio as well as other beverages, which often differ not only in terms of label but also bottle. These approaches both represent the “house of brands” approach from the literature.
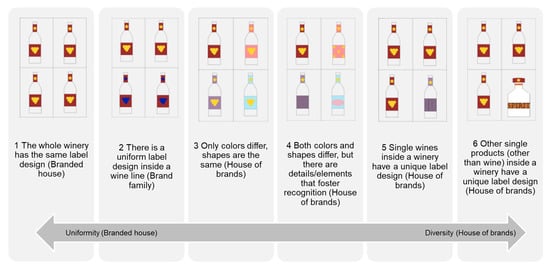
Figure 1.
Portfolio labeling strategies that have been observed on SME wineries’ websites. Source: author’s elaboration and graphical representation.
Data collection for the brand equity assessment was realized by tapping two different sources. Expert ratings of wines and wineries were retrieved from printed publications of renowned wine guides, namely the “Eichelmann Deutschlands Weine” (Eichelmann) and the “Gault and Millau Weinguide” (GM), mirroring the approach used by [60] for accessing wine brand equity through Parker scores. Regarding the scales, both scales are very similar to one another. The Eichelmann rating scale is from 1 to 5: 1—dependable winery; 1.5 and 2—good winery; 2.5 and 3—very good winery; 3.5 and 4—exceptional winery; 5—international top winery or world-class. Similarly, the GM rating scale is also from 1 to 5: 1—winery of dependable quality; 2—good winery; 3—very good winery; 4—great winery on the national level; 5—world-class winery.
Deploying two independent data sources to assess the dependent variable and conducting two regression analyses allowed for validation of the effects that the independent variable has on the dependent variable (see RQ3), thereby rendering results more reliable and more nuanced. The overall sample size was n = 890 wineries, which all needed to be included in both wine guides (Eichelmann and GM) and have a website, inevitably leading to a rather “elite” sample of wineries from the German market. The six categories (independent variables) were coded as binary variables, so-called “dummy” variables (see Alkharusi [107]). By observing the winery websites, the presence or absence of each of the six types of labeling was recorded for each of the 890 wineries.
IBM SPSS v26 software was used for the descriptive statistics and multivariate statistics. Descriptive statistics allowed to create a typology of labeling approaches in winery product portfolios, thereby answering RQ1. Regression analysis was performed to showcase in detail the impact of each labeling approach (independent, predictor variable) on third-party assessment, exploiting both sources for reputation as the dependent outcome variable. This approach provided empirical evidence for navigating product portfolio management in SME wineries by answering RQ2 and RQ3.
4. Results
4.1. Descriptive Statistics
The descriptive statistics permitted for identification of the frequency and, consequently, the importance of each of the six labeling approaches inside the product portfolios of German SME wineries. As presented in the Table 1 below, the most prominent wine labeling approach is “Same shapes, varied colors” (24.9%), where the shapes presented on different labels are completely the same, while colors vary from different shadings of the same color to completely different colors. The second most prominent approach is “Homogeneous—wine line”, where there is uniform labeling inside a wine line. It means that labels between products only show small differences due to different product specifications using some details (such as a stamp). The third most prominent approach is “Heterogeneous with some recognition elements” (18.2%), where both colors and shapes differ, but there are some details or elements (such as stamps, shields and mini logos) that foster recognition between products. The moderately represented approach is “Homogeneous—whole winery” (16.2%), where all products follow an identical label design. Such a strict product labeling approach is deployed by super small wineries with small product portfolios. Although there are also some notable exceptions to this general rule, where middle-sized wineries follow this labeling approach, no cooperatives belong to this category. The two least important approaches are related to single unique products, which can usually be observed as an addition to the overall product portfolio, often representing a wine or alcoholic beverage line which is still in the development process and with further products yet to come. One of these two approaches is “Unique single alc. product (other than wine)” (12.5%), and the other one is “Unique single wine” (7.5%).

Table 1.
Labeling approaches in product portfolios of German SME wineries.
4.2. Regression Analysis
A regression analysis served to examine RQ2 exploring the brand equity impact of the six labeling. The analysis of source A (“Eichelmann”) resulted in non-multi-collinear correlations, which means that important assumption about the created regression model in Table 2 has been met. The correlations were inspected from SPSS output and it has been determined that since all the correlations between the independent (predictor) variables where under 0.7, and the correlations between the independent (predictor) and dependent (outcome) variables were under 0.4 the likelihood of multi-collinearity was extremely low. For further reference on multi-collinearity see [108] Regarding the regression model, which is presented in Table 2 below, R square is the relevant indicator considering the large sample size used in this study (n = 890). According to the R square indicator, the model with six labeling approaches explains 4.3% of the variation in the dependent variable. This finding is also statistically significant as showcased by the Sig. F change indicator in Table 2, which is 0.001 and therefore less than 0.05. This means that the results presented in Table 3 are relevant and present real relationships between statistically significant results.
Table 2.
Model summary for impact of winery labeling types on expert rating of a winery (source 1).
Table 3.
Regression model coefficients for impact of winery labeling types on expert rating of a winery (source 1).
In Table 3, unstandardized coefficients used in the regression equation are presented as well standardized coefficients (beta) serving the interpretation and comparison between independent variables. Providing a quantified insight to answer RQ2, it is important to take into account the Sig. column, which refers to the statistical significance of the value. The only value that is under 0.05 in this column, thereby marking statistically significant results, is the negative impact of the “Heterogeneous with some recognition elements” labeling approach on experts’ ratings, with an unstandardized coefficient (B) value of −0.321 and a significance value of 0.008. All other values are not statistically significant. Taking into account the last column in Table 2, which is Correlations (Part), it confirms the previous results by demonstrating that the single biggest (negative) impact on the dependent variable is the labeling approach “Heterogeneous with some recognition elements”, with the value of −0.11. All other values are less important regarding this indicator.
Table 4 presents the regression model of the impact of the six labeling approaches on expert rating B (i.e., Gault and Millau), in response to RQ2. The correlations between the predictor variables were inspected from SPSS output and all remained below the value of 0.7, which meant that they are not multi-collinear, while the correlation between the dependent variable and the six independent variables also remains under 0.3. This means that the important assumption about the created regression model in Table 4 has been met, because the likelihood of multicollinearity was extremely low. The general findings are in line with the analyses of expert rating source 1, which means that there are no highly significant relationships between the two variables. In this analysis, the regression model (Table 4) with the six labeling approaches explains 3.2% of the variation in the dependent variable. This finding is also statistically significant as showcased by the Sig. F change indicator in Table 1, which is 0.002 and therefore less than 0.05. This means that the results presented in Table 5 are relevant and present real relationships between statistically significant results.
Table 4.
Model summary for impact of winery labeling types on expert rating of a winery (source 2).
Table 5.
Regression model coefficients for impact of winery labeling types on expert rating of a winery (source 2).
As in the first regression analysis, the unstandardized coefficients as well as standardized coefficients (beta), which are suitable for interpretation and comparison between independent variables, are of relevance (Table 5). It is also important to take into account the Sig. column, which refers to the statistical significance of the value presented. Two values are under 0.05 in this column, thereby marking two statistically significant results. The first one is the positive impact of the “Homogeneous—whole winery” labeling approach on expert rating, with an unstandardized coefficient (B) value of 0.321 and a significance of 0.007. The second one is the negative impact of the “Unique single alc. product (other than wine)” labeling approach on expert rating, with an unstandardized coefficient (B) value of −0.313 and significance of 0.013. All other values did not show statistical significance. The Correlations (Part) values in Table 5 confirm the importance of the two already previously identified variables, thereby providing further evidence on the importance of the two independent variables. The single most important positively related dependent variable is the “Homogeneous—whole winery” labeling approach with a value of 0.107. On the other hand, the single most important negatively related independent variable is the labeling approach “Unique single alc. Product (other than wine)” with a value of −0.099.
The descriptive statistics uncovered the high relevance of the labeling approaches “Same shapes, varied colors”, “Homogeneous—wine line” and “Heterogeneous with some recognition elements”. While the regression analyses could not underline the first two causal effects as being statistically significant, the third one is associated with a statistically significant negative impact on the overall winery rating.
The two regression models only moderately explain expert ratings. However, it was expected that relatively low variation would be explained by labeling approaches, as many other factors come into play in reviewing a winery and its wine. On the other side, the models are statistically significant and provide mutually compatible results. In response to RQ3, it should be noted that despite low R-squared values, the statistically significant standardized coefficients still provide reliable evidence on a real relationship between the independent and dependent variables. In addition, two regression analyses with two different dependent variables from two sources have been conducted. Firstly, the model with source one (presented in Table 3) confirms the statistically significant negative impact of the labeling approach “Heterogeneous with some recognition elements” on the overall winery rating (and, consequently, brand equity). Secondly, the model with expert rating two (presented in Table 5) confirms the statistically significant positive impact of the labeling approach “Homogeneous—whole winery” as well as the statistically significant negative impact of the labeling approach “Unique single alc. product (other than wine)” on the overall winery rating (and, consequently, brand equity).
As visualized by Figure 1, where the independent variables are ordered according to uniformity (branded house) vs. diversity (house of brands), a positive impact of uniform labeling of wines inside a winery on brand equity (measured through expert rating) can be observed (branded house). On the other hand, a negative impact of deploying diverse colors and shapes with some recognition elements on winery brand equity (measured through expert rating of winery) can also be observed (house of brands). These recognition elements include small graphical objects such as badges, logos and stamps. In other words, uniform winery-level labeling (branded house) positively influences winery brand equity, while diversity in colors and shapes with some recognition elements (house of brands) and promoting single alcoholic beverage products other than wine with own unique bottling and labeling (house of brands) negatively impacts winery brand equity. Other portfolio labeling approaches such as labeling wine lines where each line includes line-specific graphical elements (brand family); labeling through same shapes but different colors (house of brands) and labeling single wines with unique labeling and packaging (house of brands) seem to have no direct impact on winery brand equity (measured through expert rating of winery). In order to increase the validity of these results, two independent rating systems were used. The results demonstrate how the two regression models complement each other, thereby increasing the validity of the results.
5. Discussion, Limitations and Future Research Directions
Consistent labeling and packaging have a significant impact on consumer choices [109]. The research builds on this argument and develops it further to posit that the impact of labeling–packaging combinations on consumer choices is mediated by brand equity, therefore researching the link between labeling–packaging and brand equity. Recent research on food marketing and food consumer behavior also highlights the need for deeper understanding of food brands as an important element in this research context [110]. Third-party (expert) evaluations are an important aspect of ensuring subjective product quality, which is an indispensable element of brand equity in the food industry [55]. On the other hand, labeling is essential to branding [4,66].
The positive effect of company brand (umbrella brand) on product brand equity has been established in the literature, influencing brand awareness, brand associations, perceived quality as well as brand loyalty [92]. The results presented in this research provide direct and detailed evidence on the connection between winery portfolio labeling (also termed brand architecture), as one of the most important functions of winery marketing, and winery brand equity. The research results therefore contribute to the literature on food labeling and food brand equity. Methodologically, the insights expand the use of regression analysis in the wine industry. Regression analysis has been used before in the wine industry, primarily for uncovering the impact of vintage year, average temperature and rainfall on wine auction prices and overall wine quality as well as the economic impact of climate change on wine production [111,112,113,114,115]. However, regression analysis has not been deployed yet for solving managerial problems relating to wine business. This paper sought to fill this gap by examining the impact of various labeling approaches on expert rating, thereby providing a number of brand and product portfolio management implications, both managerial as well as theoretical in nature.
Most of the literature on branding and labeling multiple products inside a company takes into consideration only two mutually exclusive categories: branded house and house of brands [102,116,117]. However, there are also more nuanced approaches, such as the one presented by Homburg [103]: umbrella brand, family brand and single brand, which are better suited for examining more complex approaches such as branded house. This research therefore examines both branded house and house of brands as well as family brand approaches. In addition, it also examines four different types of house of brands approaches which are relevant for wine SMEs. The possibilities for house of brands regarding the relation of separate brands to the umbrella (company) brand have not been researched in detail in the previous literature. While branded house is a fairly straightforward concept, the branded house approach opens up numerous possible configurations which have not been previously researched.
Practical implications are relevant for winery managers and other managers in the food and beverage industry. In this sense, the results of the study imply that in order to build brand equity, the priority should not be to put a simple winery logo or a badge on an otherwise completely differently designed label (e.g., for organic wines, as a part of product portfolio). A new wine label should aim to create a unique story which can later develop into a whole wine line, which has strong uniformity and recognizability inside a wine line (both through shapes and colors) and not necessarily a direct graphic connection to the winery brand. Another option for a developing (organic) wine line would be to retain the existing shapes but change the color of the label—for example, green for organic wines. Labeling and offering products other than wine (both alcoholic and non-alcoholic) should be done with care so as to not hurt the winery brand, as this has been demonstrated to diminish the winery brand equity. Keeping in mind that for brands with high equity, the marginal effects of adding an environmental label is lower than for low-equity brands [32], communicating sustainability and environmental claims through a wine label should be reconsidered. The communication of these aspects might be more effective if deployed through other communication channels and formats. This can be done by participating in CSR actions and campaigns which do not include changing the label of the high-equity brand, while addressing sustainability issues on the company brand level.
Taking into account the relatively large sample size of n = 890, the results can be deemed as representative for the German wine market. However, as the generated dataset deploys two external winery rating sources, the focus is on bottled-wine producers, representing rather upscale wines, and this is, therefore, a limitation in the interpretation of the study results. It was important to include two independent rating systems as it was hypothesized that the two rating systems include different methodologies or protocols for evaluating the wineries. The sample consists exclusively of SME wineries, while the large majority are micro-enterprises, which often have no clear, predefined target group orientation for their wines. There are, however, some differences between a micro-winery and a bigger SME winery. A micro-winery can easily have same label design for the whole winery, while bigger wineries face the question of how to introduce additional wines or wine lines on a yearly basis. Data regarding the precise size (turnover, balance sheet and number of employees) and age of the wineries have not been collected, as this could not be done at such a scale with the website data and wine guide data. Future research is needed to uncover the relationship between brand equity and company age and size. Although medium-sized wineries make up a very small proportion of the sample, these aspects of brand portfolio management are worth exploring in further research. Methods deployed could include case studies or qualitative content analyses, where samples tend to be rather small. A possible limitation of the study is that it did not take into account how much a winery sells directly to consumers and how much is sold through retailers, restaurants and specialized traders. Previous research has concurred that B2B (Business to Business) firms tend to develop organizational brands, while B2C firms (Business to Consumer) tend to develop product brands [101]. Although collecting data on sales channels would not be an easy task, it would be interesting to examine if wineries who sell through intermediaries tend to develop organizational, company brands, while wineries who sell directly to consumers tend to have product-level brands.
It can be presumed that the selected wineries represent some of the best and most ambitious wineries in the German market. Furthermore, the study did not assess labeling from a consumer perspective but draws upon the more reliable source of expert ratings of wineries. However, the methodologies and protocols behind these ratings are not open to the public. Besides geographical limitations, the specifics of the researched wine industry need to be considered. Wine belongs to the food and beverage and also the luxury market segments. Since brand building is of utmost importance in the wine industry, where consumers have limited capabilities in judging product quality, the results provide insights into brand-building strategies in this global but highly fragmented market.
6. Conclusions
The majority of labeling research takes a consumer-oriented, functional perspective by trying to uncover the impact of labeling on liking, thereby eventually impacting purchase intention. In addition, there is abundant research on how labeling is deployed for environmental and sustainability issues. Yet, the organizational perspective of labeling, establishing the connection between labeling and organizational product portfolio management, has not been well researched and understood. The article closes this research gap by providing evidence on the impact of strategic labeling approaches on brand building and, therefore, on brand equity.
The results are relevant for sustainable food labeling as it has been demonstrated that certain types of brand portfolio elements have positive and negative influences on the overall winery brand reputation and equity. For example, it is better to introduce a new sustainable wine line with uniform labeling inside this new wine line or to change the color of an existing shape pattern than to introduce a sustainable wine line with completely different shapes and colors while including a winery logo to foster recognition. Communicating sustainability aspects should be no exception to the general rules determined in this research about successfully presenting a coherent winery (organizational) labeling portfolio and thereby building sustainable winery brand reputation and equity.
Previous research on the impact of three major corporate-level branding strategies (branded house, house of brands and mixed branding) on brand equity has confirmed that branded house or corporate-level branding has a positive impact on brand equity and mixed branding has a negative effect, while no direct effect has been established for house of brands branding [101]. The present research confirms, with the example of SME wineries, that the “branded house” approach has a positive impact on brand equity while establishing the negative impact of two different “house of brands” approaches, which has not been done before, and observes no impact of the “brand family” approach and two further “house of brands” approaches on winery brand equity. The main contribution of the present research to the literature on brand architecture is a more diversified approach to different “house of brands” approaches, thereby identifying more precise effects on brand equity.
The results have implications for brand managers in their quest of aligning food product portfolios for higher recognizability, reducing information overload on the side of consumers and deploying packaging and labeling as powerful brand communication tools. The results point to the need to establish a clear labeling connection between the wineries’ products, but not by simply including a logo on an otherwise unrelated label. In this sense, deploying the approach where shapes are the same while colors differ is the most common approach, whereas using the same label on all winery products has a positive effect on expert ratings and, therefore, brand reputation and equity. However, this latter approach is probably more useful for micro-wineries, whereas bigger ones need to find ways of managing more complex portfolios. The labeling approach where differences are pronounced and only some small graphical features are used to establish recognition, as well as including non-wine products with completely different labels, both have a negative impact on winery brand equity. There are, of course, other “middle-of-the-road” labeling approaches, where there is a uniform design inside a wine line, a single wine having a different design, as well the aforementioned approach of keeping the shapes the same while changing the colors. For all of these “middle-of-the-road” approaches, no statistically significant impact on brand equity (measured through expert rating) was identified—hence, being “stuck in the middle” apparently diminishes brand equity exploitation.
The importance of spreading the financial risk of a brand on the firm level by deploying branding strategies beyond branded house should not be underestimated [101]. In this sense, for SME wineries, it is to be expected that developing a brand family or house of brands approach means spreading the entrepreneurial and financial risk. On the other hand, the wine expert community, on whose judgement the brand equity measure is based in this research, is limited in their capability to comprehend all the wine brands which make up product portfolios in wineries who follow the “house of brands” approach. Therefore, in order to enhance their brand equity, SME wineries should put more effort into creating new wines which can fit the existing product portfolio and work on improving the winery brand rather than focusing on just one wine. They should avoid promoting beverages other than wine under the winery brand in order to avoid hurting the winery brand. Creating brand families by creating wine lines with coherent labeling inside a wine line seems to be a promising branding strategy as it has no direct negative influence on brand equity, while providing a certain degree of entrepreneurial risk spread of the winery brand to wine lines.
Author Contributions
Conceptualization, M.D. and I.P.; methodology, I.P.; software, I.P.; validation, M.D.; formal analysis, M.D. and I.P; investigation, I.P.; resources, M.D.; data curation, I.P.; writing—original draft preparation, I.P.; writing—review and editing, M.D.; visualization, I.P.; supervision, M.D.; project administration, M.D.; funding acquisition, M.D. All authors have read and agreed to the published version of the manuscript.
Funding
This research was funded by “Forschungsring des deutschen Weinbaus”, Project IM-GPS.
Institutional Review Board Statement
Not applicable.
Informed Consent Statement
Not applicable.
Data Availability Statement
Not applicable.
Conflicts of Interest
The authors declare no conflict of interest.
References
- Durrieu, F. Impact of brand identity on labeling: The case of regional branding. In Proceedings of the 4th International Conference of the Academy of Wine Business Research, Siena, Italy, 17–19 July 2008; pp. 17–19. [Google Scholar]
- Elliot, S.; Barth, J. Wine label design and personality preferences of millennials. J. Prod. Brand Manag. 2012, 21, 183–191. [Google Scholar] [CrossRef]
- Spence, M.; Essoussi, L.H. SME brand building and management: An exploratory study. Eur. J. Mark. 2010, 44, 1037–1054. [Google Scholar] [CrossRef]
- Kapferer, J. The New Strategic Brand Management: Creating and Sustaining Brand Equity Long Term, 4th ed.; Kogan Page: London, UK; Philadelphia, PA, USA, 2008; p. 560. [Google Scholar]
- Dressler, M.; Paunovic, I. A Typology of Winery SME Brand Strategies with Implications for Sustainability Communication and Co-Creation. Sustainability 2021, 13, 805. [Google Scholar] [CrossRef]
- Williamson, P.O.; Mueller-Loose, S.; Lockshin, L.; Francis, I.L. More hawthorn and less dried longan: The role of information and taste on red wine consumer preferences in China. Aust. J. Grape Wine Res. 2018, 24, 113–124. [Google Scholar] [CrossRef]
- Tang, V.C.M.; Tchetchik, A.; Cohen, E. Perception of wine labels by Hong Kong Chinese consumers. Wine Econ. Policy 2015, 4, 12–21. [Google Scholar] [CrossRef]
- Laeng, B.; Suegami, T.; Aminihajibashi, S. Wine labels: An eye-tracking and pupillometry study. Int. J. Wine Bus. Res. 2016, 28, 327–348. [Google Scholar] [CrossRef]
- Celhay, F.; Remaud, H. What does your wine label mean to consumers? A semiotic approach. In Proceedings of the Academy of Wine Business Research, Adelaide, Australia, 17–18 February 2016. [Google Scholar]
- Mello, L.d.; Borobia, R.P.G.d. Message on a Bottle: Colours and Shapes in Wine Labels. In Proceedings of the 4th International Conference of the Academy of Wine Business Research, Siena, Italy, 17–19 July 2008. [Google Scholar]
- Gmuer, A.; Siegrist, M.; Dohle, S. Does wine label processing fluency influence wine hedonics? Food Qual. Prefer. 2015, 44, 12–16. [Google Scholar] [CrossRef]
- Mueller, S.; Szolnoki, G. The relative influence of packaging, labeling, branding and sensory attributes on liking and purchase intent: Consumers differ in their responsiveness. Food Qual. Prefer. 2010, 21, 774–783. [Google Scholar] [CrossRef]
- Lunardo, R.; Rickard, B. How do consumers respond to fun wine labels? Br. Food J. 2019, 122, 2603–2619. [Google Scholar]
- Kelley, K.; Hyde, J.; Bruwer, J. US wine consumer preferences for bottle characteristics, back label extrinsic cues and wine composition. Asia Pac. J. Mark. Logist. 2015, 27, 516–534. [Google Scholar] [CrossRef]
- Henley, C.D.; Fowler, D.C.; Yuan, J.J.; Stout, B.L.; Goh, B.K. Label design: Impact on millennials’ perceptions of wine. Int. J. Wine Bus. Res. 2011, 23, 7–20. [Google Scholar] [CrossRef]
- Berghoef, N.; Dodds, R. Potential for sustainability eco-labeling in Ontario’s wine industry. Int. J. Wine Bus. Res. 2011, 23, 298–317. [Google Scholar] [CrossRef]
- Loureiro, M.L. Rethinking new wines: Implications of local and environmentally friendly labels. Food Policy 2003, 28, 547–560. [Google Scholar] [CrossRef]
- Berghoef, N.; Dodds, R. Determinants of interest in eco-labeling in the Ontario wine industry. J. Clean. Prod. 2013, 52, 263–271. [Google Scholar] [CrossRef]
- Delmas, M.A.; Grant, L.E. Eco-Labeling Strategies: The Eco-Premium Puzzle in the Wine Industry; UC Santa Barbara: Institute for Social, Behavioral, and Economic Research: Santa Barbara, CA, USA, 2008. [Google Scholar]
- Orth, U.R.; Crouch, R.C. Is Beauty in the Aisles of the Retailer? Package Processing in Visually Complex Contexts. J. Retail. 2014, 90, 524–537. [Google Scholar] [CrossRef]
- Haberstroh, K.; Orth, U.; Bouzdine-Chameeva, T.; Cohen, J.; Corsi, A.; Crouch, R.; De Marchi, R. Designing Culturally Specific Wine Packages: The Case of Visual Harmony. In Proceedings of the 9th Academy of Wine Business Research Conference, University of South Australia, Adelaide, Australia, 17–18 February 2016; p. 342. [Google Scholar]
- Barber, N. “Green” wine packaging: Targeting environmental consumers. Int. J. Wine Bus. Res. 2010, 22, 423–444. [Google Scholar] [CrossRef]
- Celhay, F.; Trinquecoste, J.F. Package graphic gesign: Investigating the gariables that moderate consumer response to atypical designs. J. Prod. Innov. Manag. 2015, 32, 1014–1032. [Google Scholar] [CrossRef]
- Cleary, J. Life cycle assessments of wine and spirit packaging at the product and the municipal scale: A Toronto, Canada case study. J. Clean. Prod. 2013, 44, 143–151. [Google Scholar] [CrossRef]
- Nesselhauf, L.; Deker, J.S.; Fleuchaus, R. Information and involvement: The influence on the acceptance of innovative wine packaging. Int. J. Wine Bus. Res. 2017, 29, 285–298. [Google Scholar] [CrossRef]
- Wilson, D. Identifying successful marketing practices for wine packaging innovations. Bull. L’oiv-Organ. Int. Vigne Vin 2008, 81, 113. [Google Scholar]
- Dekhili, S.; Achabou, M.A. Eco-labeling brand strategy. Eur. Bus. Rev. 2014, 26, 305–329. [Google Scholar] [CrossRef]
- Alonso, A.D.; Ogle, A. Tourism and hospitality small and medium enterprises and environmental sustainability. Manag. Res. Rev. 2010, 33, 818–826. [Google Scholar] [CrossRef]
- Parajuly, K.; Wenzel, H. Product Family Approach in E-Waste Management: A Conceptual Framework for Circular Economy. Sustainability 2017, 9, 768. [Google Scholar] [CrossRef]
- Anagnostou, A.; Ingenbleek, P.T.M.; van Trijp, H.C.M. Sustainability labeling as a challenge to legitimacy: Spillover effects of organic Fairtrade coffee on consumer perceptions of mainstream products and retailers. J. Consum. Mark. 2015, 32, 422–431. [Google Scholar] [CrossRef]
- De Boer, J. Sustainability labeling schemes: The logic of their claims and their functions for stakeholders. Bus. Strategy Environ. 2003, 12, 254–264. [Google Scholar] [CrossRef]
- Larceneux, F.; Benoit-Moreau, F.; Renaudin, V. Why might organic labels fail to influence consumer choices? Marginal labeling and brand equity effects. J. Consum. Policy 2012, 35, 85–104. [Google Scholar] [CrossRef]
- Jaďuďová, J.; Badida, M.; Badidová, A.; Marková, I.; Ťahúňová, M.; Hroncová, E. Consumer Behavior towards Regional Eco-Labels in Slovakia. Sustainability 2020, 12, 5146. [Google Scholar] [CrossRef]
- Cho, Y.-N.; Berry, C. Understanding the effects of retailer- and manufacturer-provided sustainability labels on product evaluations and purchase-related outcomes. J. Bus. Res. 2019, 100, 73–85. [Google Scholar] [CrossRef]
- Silva, A.R.d.A.; Bioto, A.S.; Efraim, P.; Queiroz, G.d.C. Impact of sustainability labeling in the perception of sensory quality and purchase intention of chocolate consumers. J. Clean. Prod. 2017, 141, 11–21. [Google Scholar] [CrossRef]
- Gosselt, J.F.; van Rompay, T.; Haske, L. Won’t Get Fooled Again: The Effects of Internal and External CSR ECO-Labeling. J. Bus. Ethics 2017, 155, 413–424. [Google Scholar] [CrossRef]
- Pérez-Santamaría, S.; Martos-Partal, M.; Garrido-Morgado, Á. Identifying a private-label supplier on national brand. J. Prod. Brand Manag. 2019, 28, 432–443. [Google Scholar] [CrossRef]
- Akcura, M.T.; Sinapuelas, I.C.; Wang, H.-M.D. Effects of multitier private labels on marketing national brands. J. Prod. Brand Manag. 2019, 28, 391–407. [Google Scholar] [CrossRef]
- Söderlund, M.; Colliander, J.; Karsberg, J.; Liljedal, K.T.; Modig, E.; Rosengren, S.; Sagfossen, S.; Szugalski, S.; Åkestam, N. The allure of the bottle as a package: An assessment of perceived effort in a packaging context. J. Prod. Brand Manag. 2017, 26, 91–100. [Google Scholar] [CrossRef]
- Royo-Vela, M.; Vila-López, N.; Küster-Boluda, I. Targeting and Packaging Low Fat Products: Uncontroled and Controled Variables. Nutr. Food Sci. Int. J. 2019, 9, 1–4. [Google Scholar]
- Park, J.; Ma, Y.J. Number-location bias: Do consumers correctly process the number on the product package? J. Prod. Brand Manag. 2019, 28, 80–94. [Google Scholar] [CrossRef]
- Pulker, C.E.; Chew Ching Li, D.; Scott, J.A.; Pollard, C.M. The Impact of Voluntary Policies on Parents’ Ability to Select Healthy Foods in Supermarkets: A Qualitative Study of Australian Parental Views. Int. J. Environ. Res. Public Health 2019, 16, 3377. [Google Scholar] [CrossRef]
- Scrinis, G.; Parker, C. Front-of-pack food labeling and the politics of nutritional nudges. Law Policy 2016, 38, 234–249. [Google Scholar] [CrossRef]
- Drago, E.; Campardelli, R.; Pettinato, M.; Perego, P. Innovations in Smart Packaging Concepts for Food: An Extensive Review. Foods 2020, 9, 1628. [Google Scholar] [CrossRef]
- Melović, B.; Cirović, D.; Backovic-Vulić, T.; Dudić, B.; Gubinova, K. Attracting Green Consumers as a Basis for Creating Sustainable Marketing Strategy on the Organic Market—Relevance for Sustainable Agriculture Business Development. Foods 2020, 9, 1552. [Google Scholar] [CrossRef]
- Ampuero, O.; Vila, N. Consumer perceptions of product packaging. J. Consum. Mark. 2006, 23, 100–112. [Google Scholar] [CrossRef]
- Briand Decré, G.; Cloonan, C. A touch of gloss: Haptic perception of packaging and consumers’ reactions. J. Prod. Brand Manag. 2019, 28, 117–132. [Google Scholar] [CrossRef]
- Del Borghi, A.; Strazza, C.; Magrassi, F.; Taramasso, A.C.; Gallo, M. Life Cycle Assessment for eco-design of product–package systems in the food industry—The case of legumes. Sustain. Prod. Consum. 2018, 13, 24–36. [Google Scholar] [CrossRef]
- Molina-Besch, K. Prioritization guidelines for green food packaging development. Br. Food J. 2016, 118, 2512–2533. [Google Scholar] [CrossRef]
- Klevås, J.; van Hoek, R. Organization of packaging resources at a product-developing company. Int. J. Phys. Distrib. Logist. Manag. 2005, 35, 116–131. [Google Scholar] [CrossRef]
- Buil, P.; Roger-Loppacher, O.; Selvam, R.; Prieto-Sandoval, V. The Involvement of Future Generations in the Circular Economy Paradigm: An Empirical Analysis on Aluminium Packaging Recycling in Spain. Sustainability 2017, 9, 2345. [Google Scholar] [CrossRef]
- Vranjanac, Z.; Spasic, D. Economic and environmental effects of collection and primary recycling of packaging waste from hygiene and cleaning products in Serbia. Serb. J. Manag. 2017, 12, 315–327. [Google Scholar] [CrossRef]
- Borrello, M.; Caracciolo, F.; Lombardi, A.; Pascucci, S.; Cembalo, L. Consumers’ Perspective on Circular Economy Strategy for Reducing Food Waste. Sustainability 2017, 9, 141. [Google Scholar] [CrossRef]
- Jurgilevich, A.; Birge, T.; Kentala-Lehtonen, J.; Korhonen-Kurki, K.; Pietikäinen, J.; Saikku, L.; Schösler, H. Transition towards Circular Economy in the Food System. Sustainability 2016, 8, 69. [Google Scholar] [CrossRef]
- Aaker, D.A. Managing Brand Equity: Capitalizing on the Value of a Brand Name; The Free Press: New York, NY, USA; London, UK; Toronto, ON, Canada; Sydney, Australia, 1991. [Google Scholar]
- Yoo, B.; Donthu, N. Developing and validating a multidimensional consumer-based brand equity scale. J. Bus. Res. 2001, 52, 1–14. [Google Scholar] [CrossRef]
- Thode, S.F.; Maskulka, J.M. A brand equity strategy for ultra-premium California wines. Int. J. Wine Mark. 1996. [Google Scholar] [CrossRef]
- Nowak, L.; Thach, L.; Olsen, J.E. Wowing the millennials: Creating brand equity in the wine industry. J. Prod. Brand Manag. 2006, 15, 316–323. [Google Scholar] [CrossRef]
- Nowak, L.I.; Washburn, J.H. Building Brand Equity: Consumer Reactions to Proactive Environmental Policies by the Winery. Int. J. Wine Mark. 2002, 14, 5–19. [Google Scholar] [CrossRef]
- Blair, A.J.; Atanasova, C.; Pitt, L.; Chan, A.; Wallstrom, Å. Assessing brand equity in the luxury wine market by exploiting tastemaker scores. J. Prod. Brand Manag. 2017, 26, 447–452. [Google Scholar] [CrossRef]
- Orth, U.R.; McGarry Wolf, M.; Dodd, T.H. Dimensions of wine region equity and their impact on consumer preferences. J. Prod. Brand Manag. 2005, 14, 88–97. [Google Scholar] [CrossRef]
- Pitta, D. Building brand equity and share of heart at Nassau Valley Vineyards. J. Prod. Brand Manag. 2007, 16, 148–151. [Google Scholar] [CrossRef]
- Lockshin, L.; Spawton, T. Using Involvement and Brand Equity to Develop a Wine Tourism Strategy. Int. J. Wine Mark. 2001, 13, 72–81. [Google Scholar] [CrossRef]
- Nella, A.; Christou, E. Linking service quality at the cellar door with brand equity building. J. Hosp. Mark. Manag. 2014, 23, 699–721. [Google Scholar] [CrossRef]
- Gómez, M.; Lopez, C.; Molina, A. A model of tourism destination brand equity: The case of wine tourism destinations in Spain. Tour. Manag. 2015, 51, 210–222. [Google Scholar] [CrossRef]
- Gómez, M.; Molina, A. Wine Tourism in Spain: Denomination of Origin Effects on Brand Equity. Int. J. Tour. Res. 2012, 14, 353–368. [Google Scholar] [CrossRef]
- Legendre, S.; Coderre, F. The impact of altruistic attribution and brand equity in food label campaigns. J. Prod. Brand Manag. 2018, 27, 634–646. [Google Scholar] [CrossRef]
- Reinders, M.J.; Bartels, J. The roles of identity and brand equity in organic consumption behavior: Private label brands versus national brands. J. Brand Manag. 2017, 24, 68–85. [Google Scholar] [CrossRef]
- Guzmán, F.; Davis, D. The impact of corporate social responsibility on brand equity: Consumer responses to two types of fit. J. Prod. Brand Manag. 2017, 26, 435–446. [Google Scholar] [CrossRef]
- Washburn, J.H.; Till, B.D.; Priluck, R. Co-branding: Brand equity and trial effects. J. Consum. Mark. 2000, 17, 591–604. [Google Scholar] [CrossRef]
- Kristal, S.; Baumgarth, C.; Behnke, C.; Henseler, J. Is co-creation really a booster for brand equity? The role of co-creation in observer-based brand equity (OBBE). J. Prod. Brand Manag. 2016, 25, 247–261. [Google Scholar] [CrossRef]
- Stojanovic, I.; Andreu, L.; Curras-Perez, R. Effects of the intensity of use of social media on brand equity. Eur. J. Manag. Bus. Econ. 2018, 27, 83–100. [Google Scholar] [CrossRef]
- Lim, J.-S.; Pham, P.; Heinrichs, J.H. Impact of social media activity outcomes on brand equity. J. Prod. Brand Manag. 2020, 29, 927–937. [Google Scholar] [CrossRef]
- Stocchi, L.; Fuller, R. A comparison of brand equity strength across consumer segments and markets. J. Prod. Brand Manag. 2017, 26, 453–468. [Google Scholar] [CrossRef]
- Park, C.W.; MacInnis, D.J.; Priester, J.; Eisingerich, A.B.; Iacobucci, D. Brand attachment and brand attitude strength: Conceptual and empirical differentiation of two critical brand equity drivers. J. Mark. 2010, 74, 1–17. [Google Scholar] [CrossRef]
- Veloutsou, C.; Chatzipanagiotou, K.; Christodoulides, G. The consumer-based brand equity deconstruction and restoration process: Lessons from unliked brands. J. Bus. Res. 2020, 111, 41–51. [Google Scholar] [CrossRef]
- Ishaq, M.I.; Di Maria, E. Sustainability countenance in brand equity: A critical review and future research directions. J. Brand Manag. 2019, 27, 15–34. [Google Scholar] [CrossRef]
- Nam, J.; Ekinci, Y.; Whyatt, G. Brand equity, brand loyalty and consumer satisfaction. Ann. Tour. Res. 2011, 38, 1009–1030. [Google Scholar] [CrossRef]
- Liu, C.-H.S.; Chou, S.-F. Tourism strategy development and facilitation of integrative processes among brand equity, marketing and motivation. Tour. Manag. 2016, 54, 298–308. [Google Scholar] [CrossRef]
- Lin, Y.H. Innovative brand experience’s influence on brand equity and brand satisfaction. J. Bus. Res. 2015, 68, 2254–2259. [Google Scholar] [CrossRef]
- Jahanzeb, S.; Fatima, T.; Butt, M.M. How service quality influences brand equity. Int. J. Bank Mark. 2013, 31, 126–141. [Google Scholar] [CrossRef]
- Górska-Warsewicz, H. Factors Determining City Brand Equity—A Systematic Literature Review. Sustainability 2020, 12, 7858. [Google Scholar] [CrossRef]
- Filieri, R.; Lin, Z.; D’Antone, S.; Chatzopoulou, E. A cultural approach to brand equity: The role of brand mianzi and brand popularity in China. J. Brand Manag. 2018, 26, 376–394. [Google Scholar] [CrossRef]
- Siu, N.Y.-M.; Kwan, H.Y.; Zeng, C.Y. The role of brand equity and face saving in Chinese luxury consumption. J. Consum. Mark. 2016, 33, 245–256. [Google Scholar] [CrossRef]
- Vogel, A.T.; Cook, S.C.; Watchravesringkan, K. Luxury brand dilution: Investigating the impact of renting by Millennials on brand equity. J. Brand Manag. 2018, 26, 473–482. [Google Scholar] [CrossRef]
- Kimpakorn, N.; Tocquer, G. Service brand equity and employee brand commitment. J. Serv. Mark. 2010, 24, 378–388. [Google Scholar] [CrossRef]
- Yoo, B.; Donthu, N.; Lee, S. An examination of selected marketing mix elements and brand equity. J. Acad. Mark. Sci. 2000, 28, 195–211. [Google Scholar]
- Nørskov, S.; Chrysochou, P.; Milenkova, M. The impact of product innovation attributes on brand equity. J. Consum. Mark. 2015, 32, 245–254. [Google Scholar] [CrossRef]
- Spry, A.; Pappu, R.; Cornwell, T.B. Celebrity endorsement, brand credibility and brand equity. Eur. J. Mark. 2011, 45, 882–909. [Google Scholar] [CrossRef]
- Schmidt, H.J.; Baumgarth, C. Strengthening internal brand equity with brand ambassador programs: Development and testing of a success factor model. J. Brand Manag. 2018, 25, 250–265. [Google Scholar] [CrossRef]
- Malhotra, N.; Dash, S.; Kumar, R.S.; Purwar, P.C. The nature and antecedents of brand equity and its dimensions. Mark. Intell. Plan. 2013, 31, 141–159. [Google Scholar]
- Brunetti, F.; Confente, I.; Kaufmann, H.R. The human dimension of a brand influences brand equity: An empirical examination in the context of a luxury and a convenience brand. J. Brand Manag. 2019, 26, 634–645. [Google Scholar] [CrossRef]
- Moise, M.S.; Gil-Saura, I.; Šerić, M.; Ruiz Molina, M.E. Influence of environmental practices on brand equity, satisfaction and word of mouth. J. Brand Manag. 2019, 26, 646–657. [Google Scholar] [CrossRef]
- Ajour El Zein, S.; Consolacion-Segura, C.; Huertas-Garcia, R. The Role of Sustainability in Brand Equity Value in the Financial Sector. Sustainability 2019, 12, 254. [Google Scholar] [CrossRef]
- Naidoo, C.; Abratt, R. Brands that do good: Insight into social brand equity. J. Brand Manag. 2017, 25, 3–13. [Google Scholar] [CrossRef]
- Rahman, M.; Rodríguez-Serrano, M.Á.; Lambkin, M. Brand equity and firm performance: The complementary role of corporate social responsibility. J. Brand Manag. 2019, 26, 691–704. [Google Scholar] [CrossRef]
- Muniz, F.; Guzmán, F.; Paswan, A.K.; Crawford, H.J. The immediate effect of corporate social responsibility on consumer-based brand equity. J. Prod. Brand Manag. 2019, 28, 864–879. [Google Scholar] [CrossRef]
- Font, X.; Buckley, R. Tourism Ecolabeling: Certification and Promotion of Sustainable Management; CABI Publishing: Wallingford, UK, 2001. [Google Scholar]
- Mook, A.; Overdevest, C. Does Fairtrade Certification Meet Producers’ Expectations Related to Participating in Mainstream Markets? An Analysis of Advertised Benefits and Perceived Impact. Sustain. Dev. 2017, 26, 269–280. [Google Scholar] [CrossRef]
- Dodds, R.; Ramsay, G. Is economically incentivized participation creating a greater interest into environmental certification? A case study from Lake Simcoe, Canada. J. Outdoor Recreat. Tour. 2017, 20, 31–33. [Google Scholar] [CrossRef]
- Rao, V.R.; Agarwal, M.K.; Dahlhoff, D. How is manifest branding strategy related to the intangible value of a corporation? J. Mark. 2004, 68, 126–141. [Google Scholar] [CrossRef]
- Strebinger, A. Rethinking brand architecture: A study on industry, company-and product-level drivers of branding strategy. Eur. J. Mark. 2014, 26, 375–385. [Google Scholar] [CrossRef]
- Homburg, C. Marketingmanagement: Strategie—Instrumente—Umsetzung—Unternehmensführung; Springer Gabler: Wiesbaden, Germany, 2017. [Google Scholar]
- Özbölük, T.; Dursun, Y. Online brand communities as heterogeneous gatherings: A netnographic exploration of Apple users. J. Prod. Brand Manag. 2017, 26, 375–385. [Google Scholar] [CrossRef]
- Kozinets, R. Netnography: Redefined; SAGE: Los Angeles, CA, USA; London, UK; New Delhi, India; Singapore; Washington, DC, USA, 2015. [Google Scholar]
- Kozinets, R.V.; Scaraboto, D.; Parmentier, M.-A. Evolving Netnography: How Brand Auto-Netnography, a Netnographic Sensibility, and more-than-Human Netnography Can Transform Your Research; Taylor & Francis: Abingdon, UK, 2018; Volume 34, pp. 231–242. [Google Scholar]
- Alkharusi, H. Categorical variables in regression analysis: A comparison of dummy and effect coding. Int. J. Educ. 2012, 4, 202. [Google Scholar]
- Shrestha, N. Detecting multicollinearity in regression analysis. Am. J. Appl. Math. Stat. 2020, 8, 39–42. [Google Scholar] [CrossRef]
- Li, S.; Zeng, Y.; Zhou, S. The congruence effect of food shape and name typeface on consumers’ food preferences. Food Qual. Prefer. 2020, 86, 104017. [Google Scholar]
- Martinho, V. Food Marketing as a Special Ingredient in Consumer Choices: The Main Insights from Existing Literature. Foods 2020, 9, 1651. [Google Scholar] [CrossRef]
- Ashenfelter, O. Predicting the Quality and Prices of Bordeaux Wines; AAWE-American Association of Wine Economists, 2007. Available online: https://www.wine-economics.org/wp-content/uploads/2012/09/AAWE_WP04.pdf (accessed on 12 November 2020).
- Corsi, A.; Ashenfelter, O. Predicting Italian wine quality from weather data and expert ratings. J. Wine Econ. 2019, 14, 234–251. [Google Scholar] [CrossRef]
- Byron, R.P.; Ashenfelter, O. Predicting the quality of an unborn Grange. Econ. Rec. 1995, 71, 40–53. [Google Scholar] [CrossRef]
- Ashenfelter, O.; Storchmann, K. Using hedonic models of solar radiation and weather to assess the economic effect of climate change: The case of Mosel Valley vineyards. Rev. Econ. Stat. 2010, 92, 333–349. [Google Scholar] [CrossRef]
- Ashenfelter, O.; Storchmann, K. Wine and Climate Change; AAWE-American Association of Wine Economists, 2014. Available online: https://www.wine-economics.org/wp-content/uploads/2014/03/AAWE_WP152.pdf (accessed on 15 November 2020).
- Koschmann, A. Evaluating the House of Brands Strategy Using Brand Equity and Intra-Firm Loyalty. J. Mark. Manag. 2019, 7, 94–104. [Google Scholar]
- Maurya, U.K.; Mishra, P.; Anand, S.; Kumar, N. Corporate identity, customer orientation and performance of SMEs: Exploring the linkages. Iimb Manag. Rev. 2015, 27, 159–174. [Google Scholar] [CrossRef]

Publisher’s Note: MDPI stays neutral with regard to jurisdictional claims in published maps and institutional affiliations. |
© 2021 by the authors. Licensee MDPI, Basel, Switzerland. This article is an open access article distributed under the terms and conditions of the Creative Commons Attribution (CC BY) license (http://creativecommons.org/licenses/by/4.0/).