Article

Sustainable Banking, Market Power, and Efficiency: Effects on Banks’ Profitability and Risk

by
Begoña Torre Olmo
,
María Cantero Saiz
* and
Sergio Sanfilippo Azofra
Business Administration Department, Faculty of Economics and Business, University of Cantabria, Avd. Los Castros S/N, 39005 Santander, Cantabria, Spain
*
Author to whom correspondence should be addressed.
Sustainability 2021, 13(3), 1298; https://doi.org/10.3390/su13031298
Submission received: 22 December 2020 / Revised: 20 January 2021 / Accepted: 22 January 2021 / Published: 26 January 2021

Abstract

:
The financial crisis seriously damaged the reputation of the banking sector, as well as its profitability and risk of insolvency, which led many banks to adopt a sustainable approach aimed at balancing long-term goals with short-term performance pressures. This article analyses how sustainable banking practices affect the profitability and the insolvency risk of banks. Moreover, we examine how sustainable strategies determine the effects of market power and efficiency on bank profitability. We used a two-step System-GMM to analyze an unbalanced panel of 1236 banks from 48 countries over the period 2015–2019. We found that sustainable banking practices increased profitability, and market power was an important determinant of profitability among conventional banks, but not among sustainable banks. Higher levels of cost scale efficiency led to greater profitability for both sustainable and conventional banks. However, there was no significant relationship between sustainable banking and insolvency risk. These results indicate that the traditional determinants of bank profitability are not relevant in explaining the superior profits of sustainable banks, which suggests the emergence of a new paradigm related to sustainability among the drivers of bank profitability.

1. Introduction

During the global financial crisis of 2008, the banking sector focused too much on financial results while disregarding other aspects of business, which led to the banks’ failure and seriously damaged their reputation. Banks have attempted to recoup this damaged reputation and restore trust by implementing sustainable business strategies [1,2]. Sustainable practices are aimed at supporting the environment, society, and the economic benefit of the business simultaneously, which can have important effects on bank profitability [3]. Traditionally, the profitability of the banking sector has been explained mainly by two hypotheses [4]. The market power hypothesis considers that greater market concentration, or market power, facilitates the setting of higher profits for customers, which increases windfall profits for banks, while the efficiency hypothesis assumes a positive relationship between efficiency and bank profits.
Some articles have analyzed the profitability of sustainable banks [1,5,6], but none has considered how sustainable banking affects the traditional hypotheses of market power and efficiency. The first contribution of the article is thus to analyze how sustainable practices determine the effects of market power and efficiency on bank profitability. The analysis of these aspects is very important because the financial crisis not only led banks to adopt sustainable activities; it also reduced the profitability of banks, increased the concentration of the banking industry due to mergers and acquisitions, and strengthened the differences between more and less efficient banks because the former could reduce costs, avoid excessive delinquency, and get better financing conditions [7].
Sustainable business models offer competitive advantages for banks, such as better reputation and brand differentiation, which attracts more loyal customers and increases market share. However, it is likely that sustainable banks will not exploit their greater market power to impose higher prices on customers, as proposed by the market power hypothesis. Instead, these banks would use other competitive advantages, such as emotional factors or differentiated business cultures and values to capture customers’ loyalty and boost profits [8]. We thus propose the following hypothesis:
Hypothesis 1 (H1).
The market power hypothesis is less relevant in explaining bank profitability for sustainable banks than for conventional banks.
Conversely, sustainable practices are costly, which can have adverse effects on bank efficiency [9]. Nevertheless, sustainable actions also improve banks’ reputation, which lowers their funding costs and gives them access to more investments [10,11]. Moreover, these actions also strengthen the sustainability standards of the banking industry, which raises competitors’ costs [12]. Therefore, it is likely that the positive effects of sustainable strategies on bank efficiency compensate for the negative ones and, thus, sustainable banks tend to be as efficient as conventional banks. Consequently, we propose the following hypothesis:
Hypothesis 2 (H2).
The relevance of the efficiency hypothesis in explaining bank profitability is similar for both sustainable and conventional banks.
Not only can sustainable practices determine the relationship between profitability, efficiency, and market power, but they can also affect banks’ insolvency risk: the risk of a bank being unable to fulfil its obligations of repaying its debt. Although studies on the relationship between sustainability and financial performance are relatively numerous, the relationship between sustainability and bank stability has not received enough attention from researchers and remains open to debate even today [13]. The second contribution of this article is thus to analyze how sustainable banking strategies affect insolvency risk. The study of ways to reduce insolvency risk deserves special attention because during the crisis, financial institutions faced huge losses from credit defaults, high levels of uncertainty, and strong funding restrictions [14,15]. This is important as insolvency risk not only affects the bank itself, but also may influence the entire financial system [16].
Sustainable strategies can reduce insolvency risk because they improve brand image and attract customers, which lowers reputational risk [11,17]. Sustainable banks also tend to have a greater degree of transparency and higher moral standards, which mitigates adverse selection and moral hazard problems [18]. Moreover, banks with higher funding stability are more prone to invest in sustainable activities [19,20]. So, we propose the following hypothesis:
Hypothesis 3 (H3).
Sustainable banking practices lead to a reduction in bank risk.
To test Hypotheses 1–3, we performed empirical analysis of a sample of 1236 banks from 48 countries over the period 2015–2019. We defined sustainable banks as those that voluntarily joined the United Nations Principles for Responsible Banking (UNEP Finance Initiative). The analysis was performed using the System-GMM (generalized method of moments) methodology for panel data, which makes it possible to control both unobservable heterogeneity and the problems of endogeneity through the use of instruments [21].
Our results show that sustainable initiatives lead to higher profits. Moreover, conventional banks that operate in more concentrated markets obtain superior profits, whereas this effect is not observed among sustainable banks, and a larger banking concentration does not affect their profitability significantly. On the other hand, higher levels of cost scale efficiency lead to higher profitability for both conventional and sustainable banks. Finally, sustainable strategies do not have a significant impact on insolvency risk. These results show that the traditional determinants of bank profitability are not relevant in explaining the superior profits of sustainable banks, which suggests the emergence of a new paradigm related to sustainability among the drivers of bank profitability.
The remainder of the article is structured as follows: Section 2 reviews the previous literature, Section 3 focuses on the empirical analysis and the discussion of the results and Section 4 presents the conclusions, followed by the bibliography and appendices on the procedures followed in calculating the efficiency and scale economies.

2. Literature Review

2.1. Sustainable Banking and the United Nations Principles for Responsible Banking

Reputation has been always important in banking due to asymmetric information, the qualitative-asset-transformation made by banks and the systemic risk created by the supply of payment and risk management services [22,23]. Since the global crisis of 2008, the banking sector has been especially affected by reputational risk. Several frauds, software failures, and the financial risks of the crisis of 2008 have not helped to improve the negative perceptions among customers and other stakeholders, and have increased skepticism of commercial banks’ motives and actions [1,24].
A possible way to improve banks’ reputation and restore credibility would be to promote banks’ engagement in sustainable activities, which implies integrating environmental protection, social responsibility and financial benefit into management and business operations [25]. Sustainable development has been the priority of many international organizations, but probably one of the most important steps was made in 2015 by the United Nations (UN) with the adoption of Sustainable Development Goals (SDGs) to address several global challenges by the target date of 2030, including the reduction of poverty, inequality, illiteracy, climate change, and environmental degradation, as well as the defending of human rights and dignity.
The banking sector can play a crucial role in achieving these goals because its involvement in sustainable activities has a potential impact on the sustainability of other industries through the lending channel [26,27]. For instance, banks can be directly involved in projects that protect the environment (green finance), orient funds according to the environmental risk of the target companies or promote socially responsible products [28]. Banks can also offer micro-loans and mobile banking to promote financial inclusion and alleviate poverty, or they can provide women’s microcredit to contribute to gender equality [3].
Conscious of these aspects, the UN launched the Principles for Responsible Banking (UNEP Finance Initiative), which banks can voluntarily sign, in September 2019. The purpose of this initiative is to increase lending that supports socially and environmentally sustainable economic activities through six principles that signatory banks must implement within four years [29]. The six principles are, first, alignment: banks must align their business strategy to SDGs, the Paris Climate Agreement and relevant national and regional frameworks. Second, impact and target setting: banks must continuously assess the impact of their activity on people and the environment; moreover, banks have to set and publish targets where they have the most significant impacts. Third, clients and customers: banks must develop sustainable practices with clients and customers and enable economic activities that create prosperity for current and future generations. Fourth, stakeholders: to achieve society’s goals, banks must responsibly consult, engage, and partner with relevant stakeholders. Fifth, governance and culture: banks must implement effective governance and a culture of responsible banking. Finally, transparency and accountability: banks must periodically review the six principles and be transparent about and accountable for their impacts and contributions to society’s goals. The signatories´ progress on these principles is reviewed every year and banks that cannot evidence the necessary changes will lose their status as a signatory.
Apart from the previous obligations, the UNEP Finance Initiative also provides several benefits to its signatories [29]. First, the six principles offer unparalleled opportunities for collaboration within the banking sector. Signatories to the Principles for Responsible Banking benefit from the collective expertise of the largest community of sustainable bankers globally. By working collaboratively under the auspices of the UN, signatory banks jointly deliver tools, methodology and practical guidance far beyond what any conventional bank could achieve on its own. This collaboration is based on 11 Working Groups composed of representatives from across the signatory banks. Each focuses on a different aspect of implementation, including: impact analysis, knowledge sharing, target setting and progress evaluation. These outputs are uniquely positioned to shape global best practice and influence emerging regional regulation. Moreover, collective initiatives create the space for banks to jointly push beyond current practice and define new standards for sustainability leadership. Second, unlike conventional banks, all signatory banks have access to an individual feedback and support provided by the UNEP Finance Initiative. This takes a look across their business and makes recommendations on steps the banks can take to further progress their implementation of the principles. Third, signatory banks are able to access additional tools and resources for implementation that are not available for conventional banks. For instance, the Communications Toolkit is designed to assist signatories with communicating and promoting the Principles for Responsible Banking, and includes infographics, social media cards, graphics and other materials. On the other hand, the Peer Learning Repository allows peers sharing their approaches to implementing the Principles for Responsible Banking.
In short, banks have opted to become signatories because they recognize that the needs and demands of their clients and stakeholders are shifting. By implementing the Principles for Responsible Banking, banks can create sustainability value for society, as well as serve their business interests. Starting with only 30 founding signatory banks, the UNEP Finance Initiative included 193 banks from 56 countries by October 2020, including top international banks, regional leaders, development banks, and specialized environmental banks. Figure 1a represents the geographical distribution of these banks. More than 50% of the signatory banks come from Europe, followed by Asia, but with a much lower representation (14%). The remaining world regions account for about the 30% of the signatory banks. Africa and South America represent 8% each; North America and Central America and the Caribbean account for 6% each; and Oceania contains 3% of the signatory banks. In terms of the year of joining the initiative, 157 banks representing more than 80% of the signatories joined the initiative in 2019. During 2020, only 36 banks were added, mainly from Asia and Europe (see Figure 1b).
Table 1 shows that more than half of the European signatories come from Norway, Spain, the United Kingdom, France, and Germany; in Asia, more than half of the member banks are headquartered in Japan, South Korea, and China. Most of the African banks operate in Nigeria, Egypt, and South Africa; and in South America, signatory banks are concentrated in Ecuador and Brazil. More than 70% of member banks in North America come from Canada and Mexico, whereas in Central America and the Caribbean, this percentage is represented by Panama, El Salvador, and Costa Rica. In Oceania, only Australian banks have joined the UN initiative.

2.2. Sustainable Banking, Market Power, Efficiency, and Profitability

Joining sustainable initiatives, such as the UNEP Finance Initiative, implies integrating social, environmental, and economic aspects, which can have important effects on banks’ profitability. Indeed, many articles have shown that the involvement in sustainable activities improves bank profitability [1,5,6,30]. Traditionally, the profitability of the banking sector has been explained through two main theories: the market power hypothesis and the efficiency hypothesis.
The market power hypothesis considers that greater market concentration or market share facilitates setting higher prices to customers, thereby increasing extraordinary profits [4]. This hypothesis has two versions: the structure-conduct-performance (SCP) hypothesis and the relative market power (RMP) hypothesis. The SCP considers that the greatest profits come from highly concentrated markets due to competition concerns and the existence of entrance barriers [31]. The RMP proposes that only banks with significant market share and differentiated products can exercise effective market power [32].
The efficiency hypothesis suggests that more efficient banks have lower unit costs, so they can attract more customers, because lower unit costs would make it possible to set lower interest rates for loans and higher interest rates for deposits [4,33]. The origin of this greater efficiency could come from superior management skills and production technology (X-efficiency hypothesis) or scale economies (scale-efficiency hypothesis). Both the market power and efficiency hypotheses have found wide empirical support [7,34,35,36,37,38].
Sustainable business models can boost market share because socially and environmentally responsible actions improve reputation, confidence, and customer loyalty [39,40]. Consumers of sustainable products and services are more loyal because they not only care about the consumption experience, but also want to form part of a community or wish to belong to a social group when purchasing goods [41]. This loyalty is especially relevant in the financial sector, because competition is normally very intense, and customers have close business relationships with their banks [42].
Bussoli et al. [43] have shown that social initiatives by European financial institutions capture the trust and the loyalty of customers, while Yip and Bocken [44] and Agirre-Aramburu and Gómez-Pescador [2] have reported the same evidence for the banking industry in Hong Kong and Spain, respectively. Apart from social initiatives, environmental initiatives are also very welcome among customers, and many banks now provide green financial products. Fay [45] has shown that green customers buy more products and spend more when doing so. Mason [46] has argued that green customers are willing to pay a premium price for environmentally friendly products, so banks that finance firms that make such products may indirectly benefit from this green premium. Furthermore, Sun et al. [47] have reported that green banking initiatives strengthen the relationship between corporate social responsibility and consumer loyalty.
According to the market power hypothesis, a larger market share facilitates the setting of higher prices to customers, which increases windfall profits for banks. However, sustainable banks tend not to take direct advantage of their greater market share to impose higher prices for customers. Instead, their competitive advantage is based on emotional factors, such as an appreciated difference in business principles and culture or better scores in non-financial performance indicators than conventional banks [2]. This is because sustainable banks are less concerned with short-term profit-maximization and are rather oriented towards maximizing stakeholder value and client satisfaction by decreasing the harmful effects of economic activities on the environment and society [48].
Matute-Vallejo et al. [8] have found that customers in the banking industry do not perceive a bank’s sustainable engagement as an attempt to instrumentalize social issues in a manner ultimately intended to increase prices. The Global Alliance for Banking on Values (GABV) [49,50] has also found evidence that sustainable banks are more profitable because they attract more deposits and provide more loans than conventional banks. However, their returns are more stable, which reinforces their focus on long-term profitability instead of obtaining immediate rents through higher prices. In this regard, as we proposed in our Hypothesis 1 (H1) in the Introduction section of the article, we expect that sustainable banking practices will weaken the market power hypothesis.
Although the relevance of the market power hypothesis may vary across sustainable and conventional banks, in terms of the efficiency hypothesis, however, the differences between both types of banks would be less pronounced. Sustainable strategies still raise concern among bank managers because the fulfilment of sustainable responsibilities could be at the expense of increased costs and reduced efficiency [25]. Sustainable banks can risk losing efficiency if they put too much emphasis on social and environmental investments [9]. Furthermore, trying to satisfy all stakeholders could adversely affect profitability due to inefficient use of resources [51,52].
Conversely, sustainable practices can also be valuable assets that contribute directly to the recovery of bank efficiency. First, a good, strong relationship with all stakeholders can help sustainable banks find more investments and help them access and use resources more efficiently [10,53]. Second, sustainability may boost banks’ reputation and customer loyalty, which in turn would translate into lower funding costs [11,54]. For instance, green bonds have lower yields and superior ratings than conventional bonds because investors reward environmentally responsible actions [55]. Third, sustainable activities can also help banks to improve efficiency in relation to their competitors. If a bank implements these activities, future industry sustainable standards are strengthened, which raises competitors’ costs [12,56]. Moreover, banks pursuing a proactive sustainable strategy are most likely the ones with greater financial resources and superior management capabilities [57,58]. In this regard, sustainable banks can increase motivation and retention, as employees react positively to the opportunity to weave environmental and social dimension into their work [59]. Therefore, it is likely that these positive effects of sustainable activities on bank efficiency offset the negative ones and, thus, sustainable banks would tend to be as efficient as conventional banks. We therefore propose that the efficiency hypothesis is similar across conventional and sustainable banks, as we suggested in our Hypothesis 2 (H2).

2.3. Sustainable Banking and Risk

Apart from affecting bank profitability, market share, and efficiency, sustainable activities can also have effects on bank risk. These effects are very important because a healthy banking system is the key to sustainable prosperity, and the security and the soundness of banks can create different external benefits for society [60]. Sustainable strategies can thus lead to a reduction in bank risk, as we proposed in our Hypothesis 3 (H3), for several reasons.
First, by becoming sustainable, banks state that their goal is to link decisively the fulfilment of local community needs with environment protection and sound economic prospects [48]. In achieving this goal, they try to avoid excessive risk taking and better manage risks [61,62]. Rajput and Oberoi [63] have shown that establishing good relationships with the community increases local support and attracts customers, thereby reducing bank risk. Other authors revealed that, by implementing environmentally friendly actions, banks reduce their reputational risk and increase customer loyalty, which leads to higher funding stability [11,17].
Second, a higher level of sustainable activism is associated with higher quality of earnings, a greater degree of transparency and higher moral standards. These factors help banks to mitigate adverse selection and moral hazard problems, which are among the main causes of non-performing loans [18,64]. Saïdane and Abdallah [13] have shown that sustainable banks in Europe are better able to absorb shocks and reduce the risk of insolvency. Moreover, Scholtens and van’t Kloose [16] have found that banks with high sustainability scores, especially the social dimension, have lower default risk, as well as lower contribution to financial system risk. Cui et al. [65] have revealed that allocating more green loans to the total loan portfolio reduces the non-performing loan ratio of Chinese banks. Gangi et al. [28], for a sample of 35 countries between 2011 and 2015, have found that banks that are more sensitive to environmental issues also exhibit less risk. The measurement and impact of environmental issues on banking risk has received special attention because crises will increasingly arise from the sheer scale of systemic environmental risks with global effects [66]. Climate-related risks have been identified by the European Central Bank (ECB) as a key risk driver on the Single Supervision Mechanism (SSM) Risk Map for the euro area banking system, and the European Banking Authority (EBA) has been given several mandates to assess how environmental, social, and governance (ESG) risks can be incorporated into the three pillars of prudential supervision [67].
Third, sustainability initiatives normally come from less risky banks. The availability of financial resources incites banks to invest in environmental or social projects, so financial stability is an important condition for investing in responsible activities [19,20]. The GABV [49,50] has found that sustainable banks have stronger capital positions and lower levels of return volatility. Furthermore, Chollet and Sandwidi [68] have reported a virtuous circle between sustainability and risk. In this regard, good social and governance performance reduces financial risk and thereby reinforces commitment to good governance and environmental practices.

3. Empirical Analysis

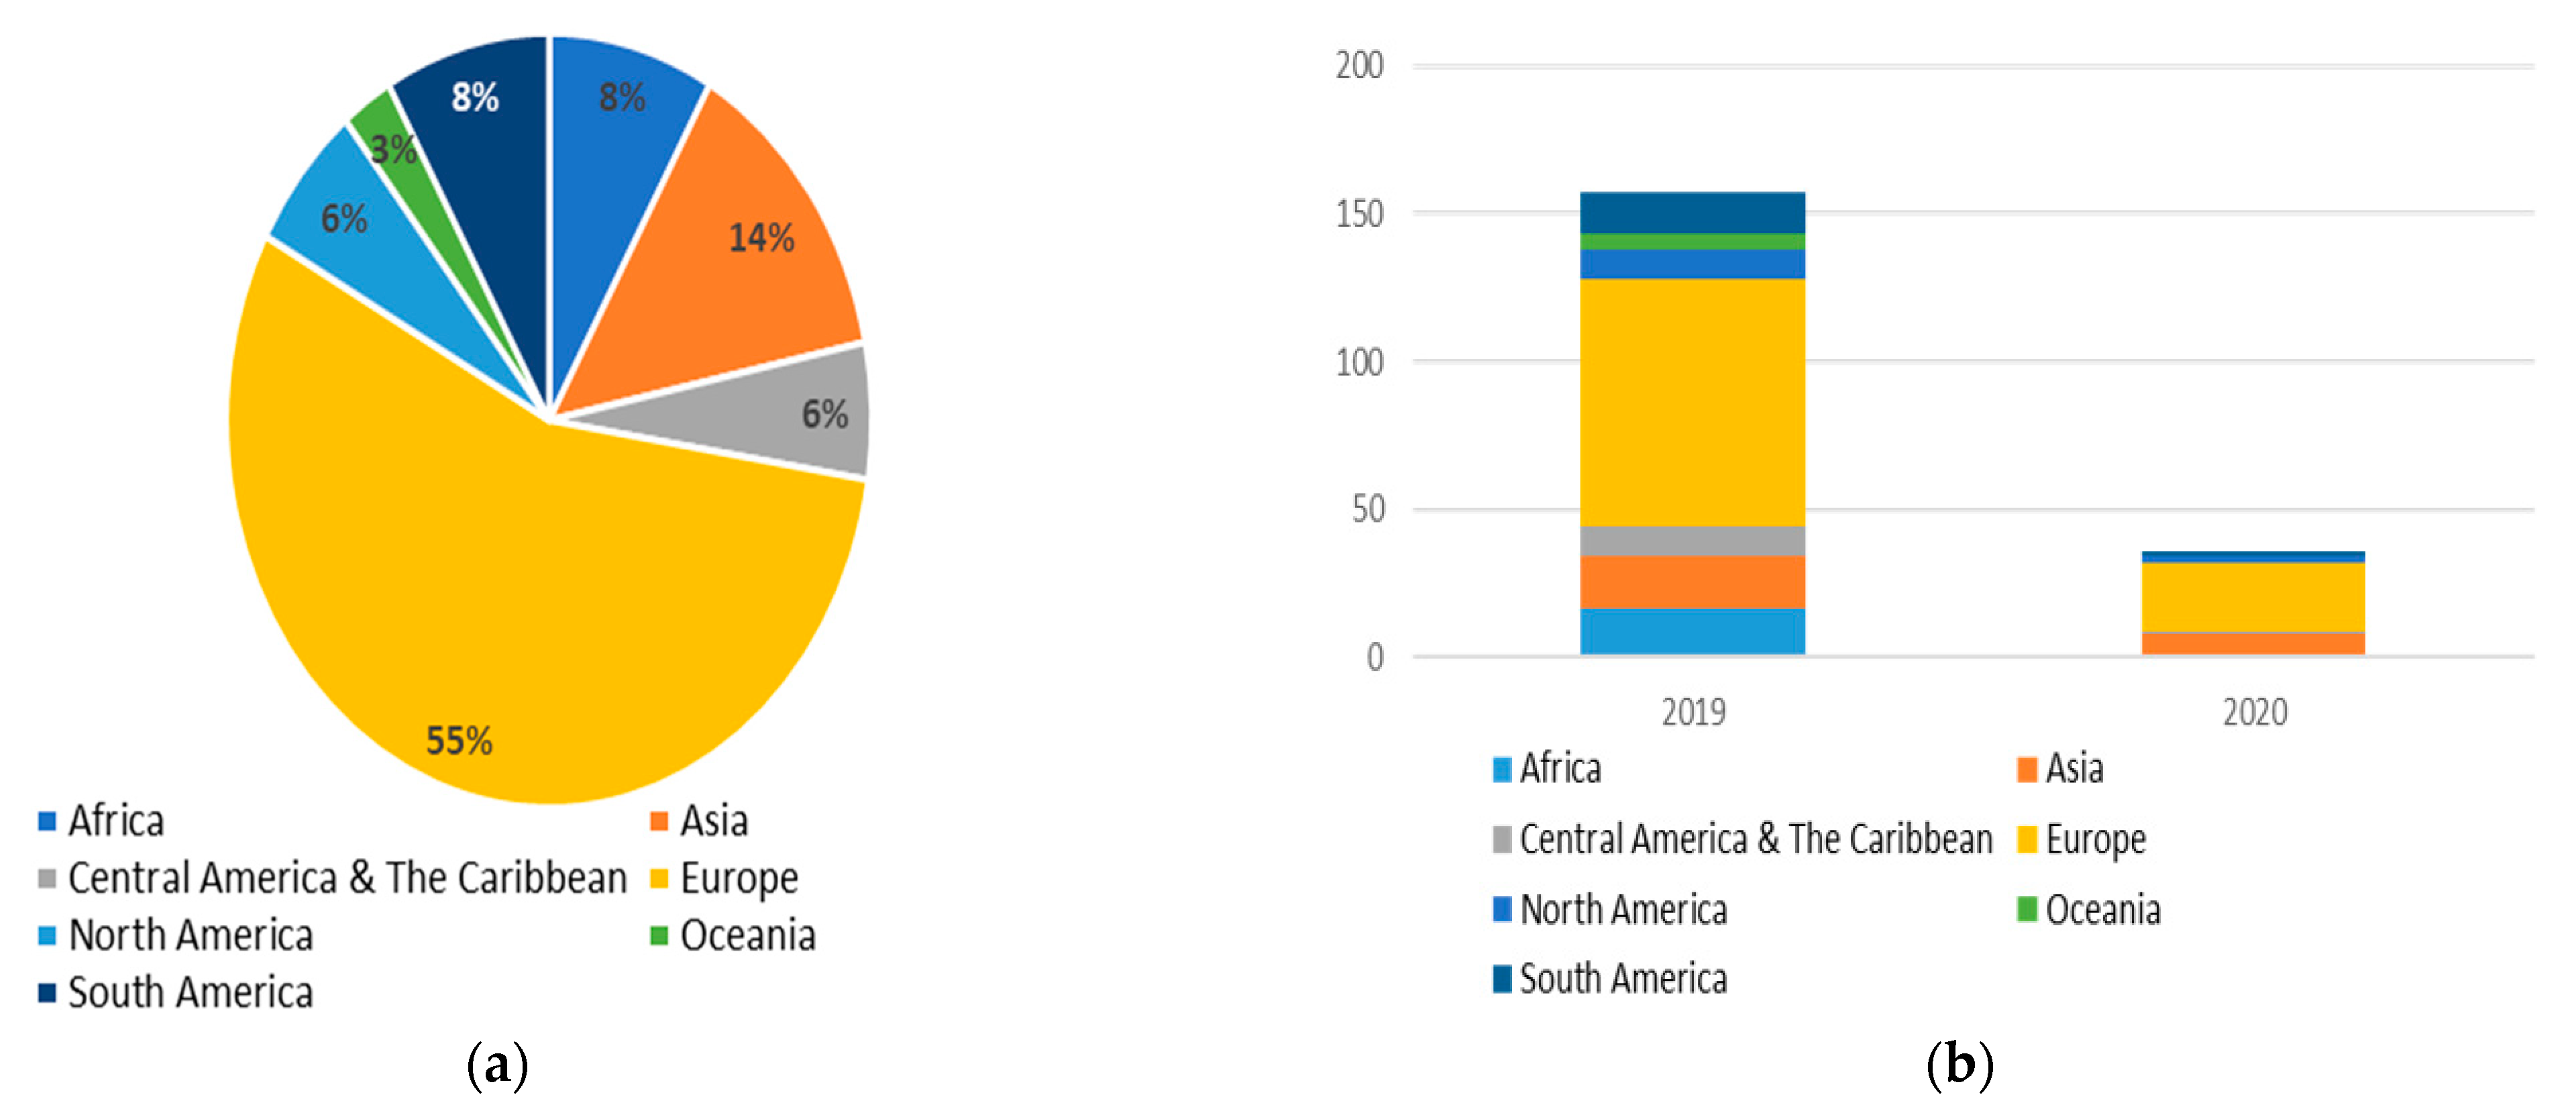
3.1. Selection of the Sample

To test the Hypotheses 1–3 proposed previously, we conducted an empirical analysis, which is reported in this section. To select the sample for the analysis, we started with all of the banks in the S&P Capital IQ database (S&P Global Market Intelligence). First, we eliminated banks with no available data. Then, we removed banks with errors in their financial statements or when their values were unreasonable, such as those with negative values for total assets, total liabilities, equity, loans, deposits, interest, and non-interest, as well as operating expenses, investment securities, fixed assets, total employees, and efficiency.
We also excluded banks with data available for less than four consecutive years between 2015 and 2019, and countries without the necessary macroeconomic data. The former condition is essential to test for second-order serial correlation, which is performed to ensure the robustness of the estimates made by System-GMM [21]. Moreover, this sample period covers all of the years since the UN’s adoption of SDGs. Finally, to avoid bias and spurious correlations between macroeconomic variables and bank level variables, we removed the countries with fewer than five banks in the sample [69].
The final sample consisted of an unbalanced panel of 1236 banks from 48 countries (Austria, Bangladesh, Belgium, Bolivia, Brazil, Bulgaria, Canada, China, Colombia, Costa Rica, Croatia, the Czech Republic, Denmark, Egypt, France, Germany, Greece, Hong Kong, Hungary, Indonesia, Ireland, Israel, Italy, Latvia, Luxembourg, Malaysia, the Netherlands, Nigeria, Norway, Oman, Pakistan, Peru, the Philippines, Poland, Portugal, Romania, Russia, Saudi Arabia, Serbia, Slovenia, South Africa, Spain, Sweden, Switzerland, Turkey, the United Kingdom, the United States, and Vietnam) between 2015 and 2019 (5915 observations). Table 2 shows the number of banks and observations for each country and the temporary distribution of the sample. The financial information on each bank comes from the S&P Capital IQ database (Global Market Intelligence). The macroeconomic information comes from the International Monetary Fund database and the World Bank’s World Development Indicators.

3.2. Profitability Analysis

3.2.1. Econometric Model of the Profitability Analysis

To perform the profitability analysis, we followed Berger [4], who proposed the estimation of the market power and efficiency hypothesis through a single equation. To evaluate these hypotheses for sustainable and conventional banks and to test the differences between both types of banks we proposed the following model:
Ri,t = β0 + β1SBi + (β2 + β3SBi) × CONCm,t + (β4 + β5SBi) × MSi,t + (β6 + β7SBi) × XEFi,t + (β8 + β9SBi) × SEFi,t + β10EQUITYi,t + β11LOANSi,t + β12SIZEi,t + β13ΔGDPm,t + ∑Tt=1YEARt + ∑Mm=1COUNTRYm + εi,t
The dependent variable (Ri,t) is a measure of the profitability of banks: ROA (return on assets) and ROE (return on equity). ROA is the ratio of net income over total assets and captures the earnings that were generated from invested capital (assets). ROE measures how profitable a bank is for its owners and represents the ratio of net income over shareholder equity. So, ROA only depends on the ability of assets to generate income, whereas ROE also depends on how these assets are financed (the level of equity and debt). These measures are the most widely used in the literature [4,7,36,70].
SB is a dummy variable that serves to capture sustainable banks. It takes the value of 1 for the banks that have signed the UN Principles for Responsible Banking, and 0 otherwise. Many articles have shown that sustainable banks are more profitable because customers reward socially and environmentally responsible actions [1,5]. Therefore, we expect that the variable SB will have a significant and positive coefficient.
CONC is the market concentration. We used the Herfindahl–Hirschman index (HHI), which is the sum of the squared market share, measured in terms of assets, of all of the banks operating in a market [71,72,73]. For each country, this index was estimated using all of the banks listed in the S&P Capital IQ database [7,34]. MS is the market share, measured in terms of assets, of bank i at time t [7,35]. XEF and SEF are our measures of efficiency in terms of cost. Cost efficiency is the ratio between the minimum cost at which it is possible to attain a given volume of production and the realized cost. Efficiency ranges over the [0,1] interval, and equals 1 for the best-practice bank in the sample [74]. More precisely, XEF is the cost X-efficiency of bank i at time t. We estimated the Fourier flexible cost function by applying the stochastic frontier approach (SFA) to measure this variable [7,75] (See Appendix A for a description of the procedure for calculating X-efficiency). SEF is the scale efficiency of bank i at time t. We derived the Fourier flexible cost function, with respect to the inputs, to measure this variable [7,76] (See Appendix B for a description of the procedure for calculating scale economies).
To analyze how sustainable banks determine the effects of market power and efficiency on profitability, in Equation (1) we included the interaction terms between the sustainable banks dummy (SB) and the variables CONC, MS, XEF, and SEF (SB × CONC, SB × MS, SB × XEF, and SB × SEF). The effects that CONC had on the profitability of conventional banks (SB = 0) were measured by the coefficient β2. In the case of MS, XEF, and SEF, these effects were captured by the coefficients β4, β6, and β8, respectively. For sustainable banks (SB = 1), the effect of CONC on profitability was measured by the sum of the coefficients (β2 + β3). In the case of MS, XEF, and SEF, this effect was reflected by the sums of the coefficients (β4 + β5), (β6 + β7), and (β8 + β9), respectively.
Conventional banks that operate in more concentrated banking markets or that have a greater market share can obtain non-competitive rents by setting higher prices for customers, so we expect that the coefficients β2 and β4 will have a positive and significant sign [4,31]. Nevertheless, sustainable banks do not normally exploit their greater market share to impose higher prices for clients and their competitive advantage is more based on the emotional factors of their business culture [2,8]. Therefore, the sums of the coefficients (β2 + β3) and (β4 + β5) are expected to be non-significant.
More efficient conventional banks have lower unit costs, so they can attract more customers [4,33]. Therefore, we expect that the coefficients β6 and β8 will have a significant and positive sign. Sustainable practices have both positive and negative effects on efficiency, which is why sustainable banks tend to be as efficient as conventional banks [9,11]. As a result, we expect that the sums of the coefficients (β6 + β7) and (β8 + β9) will have a significant and positive sign also.
EQUITY is the ratio of equity over total assets and serves to capture the risk of insolvency [7]. Banks with lower levels of equity bear higher borrowing costs, which reduces net interest margins and profits [70]. Moreover, banks with higher equity can take advantage of business opportunities more effectively and thus receive a higher return [77]. Therefore, we expect a positive relationship between EQUITY and bank profitability.
The LOANS variable is the ratio of loans to total assets and captures the liquidity risk of the bank and its activity [78,79]. Loans, especially those granted to households and companies, are risky and have a higher expected return than other bank assets such as government securities. Therefore, a positive relationship between LOANS and profitability can be expected [78]. However, another approach suggests that the lower the funds allocated to liquid investments, the higher the profitability obtained [80]. As a result, we can also expect a negative relationship between LOANS and profitability.
SIZE represents the size of the bank and is calculated as the natural logarithm of total assets (deflated) [81,82]. Economies of scale can arise from a larger size, which increases operational efficiency and reduces costs [83]. Therefore, a positive relationship between SIZE and profitability can be expected. Nevertheless, agency costs and bureaucratic expenses tend to be higher in the management of large banks [84]. Consequently, the relationship between SIZE and profitability could also be negative.
ΔGDP represents the Gross Domestic Product (GDP) per capita growth (annual %) and captures the economic cycle [38]. Better economic conditions raise the demand for credit, which boosts bank profitability [77,85]. Therefore, we expect that the GDP growth will have a significant and positive coefficient. Table 3 provides a summary of the independent variables included in Equation (1) and their expected relationships with profitability.
Finally, year- and country-effect dummies were included to capture year- and country-specific factors. The error term is εi,t, and i = 1, 2, …, N indicates a specific bank i; t = 1, 2, …, T indicates a particular year t; and m = 1, 2, …, M indicates a particular country m. Table 4 presents the descriptive statistics of the variables used in the profitability analysis, and Table 5 depicts the correlation between these variables. The software used to evaluate the statistical parameters and the whole empirical models is STATA (version 12). STATA is a program that enables users to analyze, manage, and produce statistical data, and is primarily used by researchers in the fields of economics, biomedicine, and political science.

3.2.2. Methodology

The model in Equation (1) was estimated using a two-step System-GMM with robust errors, which is consistent in the presence of any pattern of heteroscedasticity and autocorrelation. This method allows for controlling the problems of endogeneity and delivers consistent and unbiased estimates by using lagged independent variables as instruments [21]. Additionally, the System-GMM estimator provides stronger instruments and lower bias, by considering both first-differenced and levels equations [86]. This methodology is especially useful in samples that are based on a short time scale and a larger number of countries, as it was our case [87,88]. The GDP growth and the year and country dummies were considered exogenous, while the remaining variables were considered endogenous. Based on the Hansen test of the over-identifying restrictions for endogenous variables, in general second and third lags were used as instruments. The variables EQUITY in levels and CONC in both levels and differences showed over-identification problems according to the Hansen test. To address this issue, we used third lags for the variables EQUITY and CONC (in levels), and fourth lags for the variable CONC (in differences). The exogenous variables were instrumented by themselves.
The large number of endogenous variables in our estimation means that we had many instruments and could inadvertently overfit our endogenous variables. To reduce this possibility, we collapsed the instruments used in our estimation. With the collapse option, one instrument is created for each variable and lag distance, rather than one for each time period, variable, and lag distance. Bowsher [89] found that the use of too many moment conditions can significantly reduce the power of tests of over-identifying restrictions. The collapse option effectively constrains all of the yearly moment conditions to be the same and reduces the instrument count and the number of moment conditions used in the difference-in-Hansen test of exogeneity instrument subsets, which makes this test more powerful [90,91]. Many articles have collapsed the instruments used in the System-GMM estimation [69,92,93].
Finally, we studied each endogenous variable separately to assess whether the instruments provide significant explanatory power over the endogenous variables, focusing on the F-statistics from the first-stage OLS regressions. We ran two different regressions for each endogenous variable: one for the equations in differences (where the instruments are in levels), and the other for the equations in levels (where the instruments are in differences). For the System-GMM regressions, this test is merely indicative of the strength of the instruments since consistency of the GMM estimates relies on the joint estimation of both the levels and the difference equations. Other articles also calculated the F-statistics to analyze the strength of the instruments for System-GMM estimations [92,94,95].
Table 6 shows the results of this analysis. In general, the F-statistics for the first-stage regressions are significant and higher than 10, which is the critical value suggested by Staiger and Stock [96] for assessing instrument strength. It implies that the instruments provide significant explanatory power for the endogenous variables.

3.2.3. Results of the Profitability Analysis

Table 7 shows the results of the profitability analysis. In Table 7, model (a), we analyzed ROA, and in Table 7, model (b), we examined ROE. In both models the dummy variable SB shows a significant and positive coefficient, so sustainable banks obtain higher levels of profitability.
The variable CONC, which measures the effects of banking concentration on the profitability of conventional banks (SB = 0), has a significant and positive coefficient in Table 7, models (a) and (b). Therefore, conventional banks that operate in more concentrated markets can exercise effective market power and obtain more profitability, as the market power hypothesis suggests. To capture the effects of concentration on the profitability of sustainable banks (SB = 1), we carried out the linear restriction test of the sum of the coefficient associated with CONC and the coefficient associated with the interaction between SB and CONC (represented in Table 7 by LR Test. SB × CONC). This linear restriction test is not significant in any of the models, which would support our Hypothesis 1.
The variable MS, which measures the effects of market share on the profitability of conventional banks (SB = 0), is significant and positive in Table 7, model (a), but not in Table 7, model (b). Conventional banks with higher market share can probably exercise effective market power and obtain more profits, but this evidence is not conclusive across estimations. In any case, market share does not affect the profits that sustainable banks make because the linear restriction test of the sum of the coefficient associated with MS and the coefficient associated with the interaction between SB and MS (represented in Table 7 by LR Test. SB × MS) is not significant in any of the models.
The variable SEF, which measures the effects of scale efficiency on the profitability of conventional banks (SB = 0), is positive and significant in Table 7, models (a) and (b). Moreover, the LR Test. SB × SEF, which captures the previous effect for sustainable banks (SB = 1), is positive and significant in both models, too. Consequently, banks with better scale efficiency are more profitable, regardless of their sustainable orientation, which would support our Hypothesis 2.
Regarding the control variables, the variable ΔGDP is significant with a positive sign, so the economic growth boosts bank profitability as other studies suggest [77,85]. The variable EQUITY has a significant and positive coefficient in Table 7, model (a), but is not significant in Table 7, model (b), so in our sample, there is no conclusive evidence of the effects of equity on bank profitability.

3.3. Risk Analysis

3.3.1. Econometric Model of the Risk Analysis

To analyze the relationship between risk and sustainable banking practices, we proposed the following model that is based on the study of Sanfilippo-Azofra et al. [7]:
Zi,t = β0 + β1SBi + (β2 + β3SBi) × CONCm,t + (β4 + β5SBi) × MSi,t + (β6 + β7SBi) × XEFi,t + (β8 + β9SBi) × SEFi,t + β10LOANSi,t + β11SIZEi,t + β12LOANDEPi,t + ∑Tt=1YEARt + ∑Mm=1COUNTRYm + εi,t
The dependent variable (Zi,t) is the Z-score, measured as follows:
Zi,t = (ROA + K/A)/σROA
where ROA is the return on assets, K is the equity capital, A is the total assets, and σROA is the standard deviation of ROA. The Z-score is widely used to measure a bank’s risk [7,28,97,98]; the higher the Z-score, the lower the probability of bankruptcy.
As above, SB is a dummy variable that serves to capture sustainable banks. It takes the value of 1 for the banks that have signed the UN Principles for Responsible Banking, and 0 otherwise. Sustainable banks are more transparent and have more stable returns and higher moral standards, and these characteristics allow them to manage risk more effectively [13,28]. As a result, we expect that the variable SB will have a significant and positive coefficient. The variables CONC, MS, XEF, and SEF have the same definitions as in Section 3.2.1.
To analyze how sustainable banks determine the effects of market power and efficiency on risk, in Equation (2) we included the interaction terms between the sustainable banks dummy (SB) and the variables CONC, MS, XEF, and SEF (SB × CONC, SB × MS, SB × XEF, and SB × SEF). The effects that CONC had on the risk of conventional banks (SB = 0) were measured by the coefficient β2. In the case of MS, XEF, and SEF, these effects were captured by the coefficients β4, β6, and β8, respectively. For sustainable banks (SB = 1), the effect of CONC on risk was measured by the sum of the coefficients (β2 + β3). In the case of MS, XEF, and SEF, this effect was reflected by the sums of the coefficients (β4 + β5), (β6 + β7), and (β8 + β9), respectively.
It is not clear what the expected signs of the coefficients β2 and β4 will be, nor the sums of the coefficients (β2 + β3) and (β4 + β5). On the one hand, banks with a larger market share that operate in more concentrated markets can reduce financial instability through the provision of greater capital reserves, which protect them against economic and liquidity shocks [99]. Large banks also have a comparative advantage in monitoring loans and can achieve greater diversification of both the loan portfolio and the geographical distribution [100]. On the other hand, a higher concentration can lead to an increase in interest rates on loans, so borrowers will have to undertake riskier projects to repay their loans [101]. Moreover, banks with a higher market share in concentrated markets are usually more protected by governments, which may lead them to take greater risks [102]. Conversely, more efficient banks tend to become more capitalized, which contributes to bank stability. At the same time, less efficient banks may be tempted to take on higher risks to compensate for increased costs and lost returns [103,104]. As a result, we expect that the coefficients β6 and β8, and the sums of the coefficients (β6 + β7) and (β8 + β9) will have a significant and positive sign.
The variable LOANS is the ratio of loans to total assets and captures the liquidity risk of the bank and its activity [78,79]. Because the variable LOANS represents the liquidity risk of the bank, there should be a negative relationship between LOANS and bank risk [105]. Nevertheless, the loan-to-assets ratio is also an indicator of banks’ retail orientation. Retail banks are perceived as less risky than non-retail ones, especially during crises. Additionally, banks with higher levels of loans have a lower proportion of securities, which reduces their exposure to other risks, such as sovereign risk [106]. Therefore, we can also expect a positive and significant relationship between the variable LOANS and bank risk.
SIZE represents the size of the bank and is calculated as the natural logarithm of total assets (deflated) [81,82]. Larger banks are likely to have a higher degree of product and loan diversification than smaller banks, which reduces risk [37]. As a result, we can expect a positive relationship between SIZE and bank risk. However, a negative relationship between these two variables can also be expected because a larger size can lead to reduced efficiency in management, less effective internal control and increased organizational complexity, which can lead to higher operational risk [107].
LOANDEP controls for differences in the intermediation ratio and represents the ratio of loans to deposits [108]. When loans exceed the deposit base, banks face a funding gap for which they must access financial markets. Financial markets are more volatile than retail funding, so we expect a negative relationship between LOANDEP and bank risk [109]. Table 8 provides a summary of the independent variables included in Equation (2) and their expected relationships with risk.
Finally, year- and country-effect dummies were included to capture year- and country-specific factors. The error term is εi,t, and i = 1, 2, …, N indicates a specific bank i; t = 1, 2, …, T indicates a particular year t; and m = 1, 2, …, M indicates a particular country m. Table 9 presents the descriptive statistics of the variables used in the risk analysis, and Table 10 depicts the correlation between these variables.

3.3.2. Methodology

Like the profitability analysis, the model in Equation (2) was estimated using two-step System-GMM with robust errors [21]. The year and country dummies were considered exogenous, while the remaining variables were considered endogenous. Based on the Hansen test of the over-identifying restrictions for the endogenous variables, in general second and third lags were used as instruments. To avoid over-identification problems based on the Hansen test, we used third and fourth lags for the variable MS in differences. The exogenous variables were instrumented by themselves. We also collapsed the instruments used in our estimation [92,93]. Moreover, we carried out the F-statistics test to assess instrument strength. These results, which are shown in Table 11, reveal that in general, the instruments provide significant explanatory power for the endogenous variables.

3.3.3. Results of the Risk Analysis

Table 12 shows the results of the risk analysis. Regarding the objective of this analysis, the influence of sustainable banks, the variable SB is not significant, which suggests that sustainable initiatives do not alter bank risk. This does not support our Hypothesis 3.
As far as the control variables are concerned, the variable LOANS has a significant and positive coefficient, which denotes that banks with more loans are less exposed to risk [106]. Moreover, the variable SIZE also shows a significant and positive coefficient, so larger banks can achieve greater diversification, which reduces risk [37].

3.4. Discussion

This article analyses how sustainable practices affect bank profitability, both directly and through the market power and efficiency hypotheses. Moreover, it examines the impact of sustainable banking on insolvency risk.
Firstly, we find that sustainable banks obtain more profits. These results are in line with other studies that suggest that sustainable banks are more profitable than conventional banks. According to these studies, sustainable banks have a better reputation, provide more confidence, and can attract more loyal customers, which is why they earn superior profits [43,44].
Secondly, conventional banks that operate in more concentrated markets make more profits, as proposed by the market power hypothesis. Nevertheless, for sustainable banks, banking concentration does not affect profitability significantly. These results support the evidence of Matute-Vallejo et al. [8], which suggests that banks do not use sustainability as an attempt to instrumentalize social issues in a manner ultimately intended to increase prices. Instead of taking advantage of their market power to set higher prices for customers, sustainable banks would use other attributes to attract clients and earn profits, such as different business culture, lower reputational risk, or compromise with social and environmental values [2].
Thirdly, banks with superior cost scale efficiency are more profitable, regardless of their sustainable orientation, as the efficiency hypothesis suggest. The positive effects of sustainable strategies on efficiency would compensate for the negative ones and, hence, sustainable banks tend to be as efficient as conventional banks. The findings of many previous studies support this idea. On the one hand, Nidumolu et al. [9] reveal that social and environmental compromises are costly, which can reduce efficiency. On the other hand, as Bassen et al. [11] propose, these compromises can also improve the reputation of the banks that acquire them, which reduces their funding costs. Furthermore, Clarkson et al. [12] show that sustainable initiatives strengthen the sustainable standards of the industry, which raises competitors’ costs.
Fourthly, our results show that sustainable banking practices do not have a significant impact on insolvency risk. According to García-Benau et al. [110], the financial crisis seriously damaged the reputation and the confidence of banks, which forced them to implement sustainable strategies despite their risks and costs. This aspect, along with the fact that real sustainability concerns have not emerged until recently, could explain why sustainable banks still do not exhibit lower insolvency risk.

4. Conclusions

The financial crisis had strongly adverse effects on the image and confidence of the banking sector, which led many banks to implement sustainable business strategies to improve their reputation. These strategies might affect the relationship between market power, efficiency, and profitability, as well as the relationship between sustainable banks and risk. To analyze these changes, we performed an empirical analysis on a sample of 1236 banks from 48 countries over the period 2015–2019. The results of this analysis indicate that sustainable banking practices lead to higher profitability. Moreover, conventional banks that operate in markets with higher concentration are more profitable, as proposed by the market power hypothesis. However, for sustainable banks, market concentration does not affect profits significantly. Higher levels of cost scale efficiency lead to more profitability for both conventional and sustainable banks. There does not appear to be a significant relationship between sustainable banks and risk.
These results have important implications for the implementation of sustainable business models and the research agenda for sustainability in banking. Our results suggest that the traditional determinants of bank profitability are not relevant in explaining the superior profits made by sustainable banks. This suggests the emergence of a new paradigm related to sustainability in the drivers of bank profitability, where intangible competitive advantages such as brand image, customer loyalty, lower reputational risk, or ethical issues could play a key role.
Moreover, sustainable activities still do not affect bank risk, probably because the severe consequences of the financial crisis forced banks to adopt a sustainable approach regardless of their risks. It is possible that sustainable practices will reduce bank risk in the future when banks will have completely restored their image and the confidence lost during the 2008 financial crisis.
On the other hand, our sample includes banks from many world regions with differences in regulation, which could also determine the relationship between sustainability and the market power and efficiency hypotheses, as well as the relationship between sustainability and credit risk. For instance, regulatory factors and legal requirements can have important effects on bank efficiency and solvency. Additionally, legal impediments to competition can alter the degree of concentration. Further research is therefore needed to fully understand the determinants of profitability and risk among sustainable banks, especially in the long run.

Author Contributions

Conceptualization, B.T.O., S.S.A., M.C.S.; Methodology, S.S.A.; Software, S.S.A., M.C.S.; Validation, B.T.O., S.S.A., M.C.S.; Formal Analysis, B.T.O., S.S.A.; Investigation, B.T.O., S.S.A., M.C.S.; Resources, B.T.O., M.C.S.; Data Curation, S.S.A., M.C.S.; Writing—Original Draft Preparation, M.C.S.; Writing—Review & Editing, M.C.S.; Visualization, B.T.O., S.S.A., M.C.S.; Supervision, B.T.O., S.S.A.; Project Administration, B.T.O.; Funding Acquisition, B.T.O. All authors have read and agreed to the published version of the manuscript.

Funding

This research was funded by the Santander Financial Institute (SANFI), at the University of Cantabria Foundation for Education and Research in the Financial Sector (UCEIF Foundation).

Data Availability Statement

S&P Capital IQ database (www.capitaliq.com); International Monetary Fund database (www.imf.org); World Bank´s World Development Indicators (https://databank.worldbank.org).

Conflicts of Interest

The authors declare no conflict of interest.

Appendix A

To estimate cost efficiency, we used the Fourier flexible functional form under the alternative specification. We estimated the efficiency frontier using the stochastic frontier approach (SFA). In addition, we followed the intermediation approach that considers three outputs, three input prices, financial capital (equity) as a correction factor and four environmental variables [7,74,111,112,113]. We also incorporated the time trend as a measure to control for technological progress [114]. Our specification of the cost function is as follows:
ln(C) = α + ∑3i=1ϐiln(wi) + 1/2∑3i=13j=1ϐijln(wi)ln(wj) + ∑3k=1γkln(yk) + 1/2∑3k=13n=1γknln(yk)ln(yn) + ωln(E) + 1/2ψln(Ei)2 + τ1T + 1/2τ2T2 + ∑3i=13k=1ρikln(wi)ln(yk)∑3i=1ηiEln(wi)ln(E) + ∑3i=1ζiTln(wi) + ∑3k=1ρkEln(yk)ln(E) + ∑3m=13k=1ϑkTln(yk) + ∑4s=1μkln(vs) + ∑4q=1qcos(xq) + wqsin(xq)] + ∑4q=14r=1qrcos(xq + xr) + wqrsin(xq + xr)] + ∑4q=1qqqcos(xq + xq + xq) + wqqqsin(xq + xq + xq)] + lnu + lnε
The dependent variable is total cost (interest and non-interest expenses).
Outputs:
  • y1 = loans.
  • y2 = securities.
  • y3 = deposits.
Input prices:
  • w1 = cost of lendable funds: interest expenses over liabilities (deposits, money market funding and other funding).
  • w2 = cost of physical capital: defined as the ratio of non-interest expenses and the book value of physical capital.
  • w3 = cost of labor: operating expenses to total employees.
Fixed netput:
E = financial capital (equity).
Environmental variables of the country:
  • v1 = outstanding loans from commercial banks to GDP.
  • v2 = per capita GDP.
  • v3 = population density.
  • v4 = Herfindahl concentration index to assets.
Time trend:
T = time trend.
The variables xq, q = 1, 2, 3, 4 are rescaled values of the variables (lnyk), k = 1, 2, 3, and ln(E) such that xq is in the [0.2π] interval, where π is the number of radians and not the profits. Moreover, we cut 10% off each end of the [0.2π] interval such that the xq span is [0.1 × 2π, 0.9 × 2π]. This eliminates problems of approximation to the extremes. The formula for xq is 0.2π − μ × a + μ × variable, where μ ≡ (0.9 × 2π − 0.1 × 2π)/(b − a), and [a, b] is the range of the variable.
Because the duality theorem requires that the cost function is linearly homogeneous in input prices and continuity requires that the second-order parameters are symmetric, the following restrictions apply to the parameters:
3i = 1βi = 1; ∑3i=1βij = 0; ∑3i=1ρik = 0; ∑3i=1ηim = 0
The inefficiency term is assumed to be distributed as half-normal.
ϐij = ϐji; γik = γki

Appendix B

We estimated the scale economies by deriving the cost function with respect to the inputs:
SCALE = ∑3n=1(δlnC/δlnyi)
This measure was calculated with the mean of the input and output values in various size classes [7,76] and for each of the years analyzed. We considered six intervals: (1) less than $500 m; (2) between $500 m and $1 bn; (3) between $1 bn and $3 bn; (4) between $3 bn and $5 bn; (5) between $5 bn and $10 bn; and (6) more than $10 bn.
A bank operates under increasing, constant, or decreasing returns to scale when this measure is greater than, equal to, or less than 1, respectively.

References

  1. Cornett, M.M.; Erhemjamts, O.; Tehranian, H. Greed or good deeds: An examination of the relation between corporate social responsibility and the financial performance of U.S. commercial banks around the financial crisis. J. Bank. Financ. 2016, 70, 137–159. [Google Scholar] [CrossRef]
  2. Agirre-Aramburu, I.; Gómez-Pescador, I. The effects of corporate social responsibility on customer loyalty: The mediating effect of reputation in cooperative banks versus commercial banks in the Basque Country. J. Bus. Ethics 2019, 154, 701–719. [Google Scholar] [CrossRef]
  3. Nosratabadi, S.; Pinter, G.; Mosavi, A.; Semperger, S. Sustainable banking; Evaluation of the European business models. Sustainability 2020, 12, 2314. [Google Scholar] [CrossRef] [Green Version]
  4. Berger, A.N. The profit-structure relationship in banking-tests of market-power and efficient-structure hypotheses. J. Money Credit Bank. 1995, 27, 404–431. [Google Scholar] [CrossRef]
  5. Platonova, E.; Asutay, M.; Dixon, R.; Mohammad, S. The impact of corporate social responsibility disclosure on financial performance: Evidence from the GCC Islamic banking sector. J. Bus. Ethics 2018, 151, 451–471. [Google Scholar] [CrossRef] [Green Version]
  6. Szegedi, K.; Khan, Y.; Lentner, C. Corporate social responsibility and financial performance: Evidence from Pakistani listed banks. Sustainability 2020, 12, 4080. [Google Scholar] [CrossRef]
  7. Sanfilippo-Azofra, S.; Cantero-Saiz, M.; Torre-Olmo, B.; López-Gutiérrez, C. Financial crises, concentration and efficiency: Effects on performance and risk of banks. Financ. Uver 2013, 63, 537–558. [Google Scholar]
  8. Matute-Vallejo, J.; Bravo, R.; Pina, J.M. The influence of corporate social responsibility and price fairness on customer behaviour: Evidence from the financial sector. Corp. Soc. Responsib. Environ. Manag. 2011, 18, 317–331. [Google Scholar] [CrossRef]
  9. Nidumolu, R.; Prahalad, C.K.; Rangaswami, M.R. Why sustainable is now the key driver of innovation? Harv. Bus. Rev. 2009, 87, 56–64. [Google Scholar]
  10. Hambrick, D.C. Some tests of the effectiveness and functional attributes of miles and snow’s strategic types. Acad. Manag. J. 1983, 26, 5–26. [Google Scholar]
  11. Bassen, A.; Meyer, K.; Schlange, J. The Influence of Corporate Responsibility on the Cost of Capital. Available online: https://papers.ssrn.com/sol3/papers.cfm?abstract_id=984406 (accessed on 25 November 2020).
  12. Clarkson, P.; Li, Y.; Richardson, G.; Vasvari, F. Does it pay to be green? Determinants and consequences of proactive environmental strategies. J. Account. Public Policy 2011, 30, 122–144. [Google Scholar] [CrossRef]
  13. Saïdane, D.; Abdallah, S.B. Sustainability and financial stability: Evidence from European banks. Econ. Bull. 2020, 40, 1769–1780. [Google Scholar]
  14. Bouis, R.; Rawdanowicz, L.; Renne, J.P.; Watanabe, S.; Christensen, A.K. The Effectiveness of Monetary Policy Since the Onset of the Financial Crisis; OECD Economics Department Working Paper No. 1081; OECD Publishing: Paris, France, 2013. [Google Scholar]
  15. Valencia, F. Aggregate Uncertainty and the Supply of Credit. J. Bank. Financ. 2017, 81, 150–165. [Google Scholar] [CrossRef] [Green Version]
  16. Scholtens, B.; Van’t Klooster, S. Sustainability and bank risk. Palgrave Commun. 2019, 5, 1–8. [Google Scholar] [CrossRef] [Green Version]
  17. Ruiz, B.; García, J.A.; Revilla, A.J. Antecedents and consequences of bank reputation: A comparison of the United Kingdom and Spain. Int. Mark. Rev. 2016, 33, 781–805. [Google Scholar] [CrossRef]
  18. Lopatta, K.; Buchholz, F.; Kaspereit, T. Asymmetric information and corporate social responsibility. Bus. Soc. 2016, 55, 458–488. [Google Scholar] [CrossRef]
  19. Endrikat, J.; Guenther, E.; Hoppe, H. Making sense of conflicting empirical findings: A meta-analytic review of the relationship between corporate environmental and financial performance. Eur. Manag. J. 2014, 32, 735–751. [Google Scholar] [CrossRef]
  20. Tregidga, H.; Milne, M.; Kearins, K. (Re) presenting sustainable organizations. Account. Organ. Soc. 2014, 39, 477–494. [Google Scholar] [CrossRef]
  21. Arellano, M.; Bond, S. Some tests of specification for panel data: Monte Carlo evidence and an application to employment equations. Rev. Econ. Stud. 1991, 58, 277–297. [Google Scholar] [CrossRef] [Green Version]
  22. Allen, F.; Santomero, A.M. The theory of financial intermediation. J. Bank. Financ. 1997, 21, 1461–1485. [Google Scholar] [CrossRef]
  23. Allen, F.; Santomero, A.M. What do financial intermediaries do? J. Bank. Financ. 2001, 25, 271–294. [Google Scholar] [CrossRef] [Green Version]
  24. Polonskaya, J.; Babenko, M. Best Practice Guide on Sustainable Finance: A Practical Toolkit for Russian Financial Sector; Sustainable Finance Programme Report; WWF—World Wide Fund For Nature: Gland, Switzerland, 2012. [Google Scholar]
  25. Shah, A.A.; Wu, D.; Korotkov, V. Are sustainable banks efficient and productive? A data envelopment analysis and the Malmquist productivity index analysis. Sustainability 2019, 11, 2398. [Google Scholar] [CrossRef] [Green Version]
  26. Scholtens, B. Corporate social responsibility in the international banking industry. J. Bus. Ethics 2012, 86, 159–175. [Google Scholar] [CrossRef]
  27. Weber, O. Environmental credit risk management in banks and financial service institutions. Bus. Strateg. Environ. 2009, 21, 248–263. [Google Scholar] [CrossRef]
  28. Gangi, F.; Meles, A.; D’Angelo, E.; Daniele, L.M. Sustainable development and corporate governance in the financial system: Are environmentally friendly banks less risky? Corp. Soc. Responsib. Environ. Manag. 2019, 26, 529–547. [Google Scholar] [CrossRef]
  29. UNEP Finance Initiative (UNEP FI). Available online: www.unepfi.org (accessed on 18 January 2021).
  30. Keffas, G.; Olulu-Briggs, O.V. Corporate social responsibility: How does it affect the financial performance of banks? Empirical evidence from US, UK and Japan. J. Manag. Gov. 2011, 3, 8–26. [Google Scholar]
  31. Demsetz, H. Barriers to entry. Am. Econ. Rev. 1982, 72, 47–57. [Google Scholar]
  32. Shepherd, W.G. Economies of scale and monopoly profits. In Industrial Organization, Antitrust, and Public Policy; Craven, J.V., Ed.; Kluwer Nijhoff: Boston, MA, USA; Springer: Dordrecht, The Netherlands, 1983; pp. 165–204. [Google Scholar]
  33. Peltzman, S. The gains and losses from industrial concentration. J. Law Econ. 1977, 20, 229–263. [Google Scholar] [CrossRef]
  34. Corvoisier, S.; Gropp, R. Bank concentration and retail interest rates. J. Bank. Financ. 2002, 26, 2155–2189. [Google Scholar] [CrossRef] [Green Version]
  35. De Jonghe, O.; Vander Vennet, R. Competition versus efficiency: What drives franchise values in European banking? J. Bank. Financ. 2008, 32, 1820–1835. [Google Scholar] [CrossRef]
  36. Hsieh, M.F.; Lee, C.C. The Puzzle between banking competition and profitability can be solved: International evidence from bank-level data. J. Financ. Serv. Res. 2010, 38, 135–157. [Google Scholar] [CrossRef]
  37. Dietrich, A.; Wanzenried, G. Determinants of bank profitability before and during the crisis: Evidence from Switzerland. J. Int. Financ. Mark. Inst. 2011, 21, 307–327. [Google Scholar] [CrossRef]
  38. Tan, Y.; Floros, C.; Anchor, J. The profitability of Chinese banks: Impacts of risk, competition and efficiency. Rev. Account. Financ. 2017, 16, 86–105. [Google Scholar] [CrossRef]
  39. Gatzert, N. The impact of corporate reputation and reputation damaging events on financial performance: Empirical evidence from the literature. Eur. Manag. J. 2015, 33, 485–499. [Google Scholar] [CrossRef]
  40. Igbudu, N.; Garanti, Z.; Popoola, T. Enhancing bank loyalty through sustainable banking practices: The mediating effect of corporate image. Sustainability 2018, 10, 4050. [Google Scholar] [CrossRef] [Green Version]
  41. Daub, C.H.; Ergenzinger, R. Enabling sustainable management through a new multi-disciplinary concept of customer satisfaction. Eur. J. Mark. 2005, 39, 998–1012. [Google Scholar] [CrossRef]
  42. Ferreira, F.; Jalali, M.; Meiudute-Kavaliauskiene, I.; Viana, B. A metacognitive decision making based-framework for bank customer loyalty measurement and management. Technol. Econ. Dev. Econ. 2015, 21, 280–300. [Google Scholar] [CrossRef]
  43. Bussoli, C.; Conte, D.; Letorri, G.; Barone, M. Does it pay to be sustainable? Evidence from European banks. Int. J. Bus. Manag. 2019, 14, 128–146. [Google Scholar] [CrossRef] [Green Version]
  44. Yip, A.W.; Bocken, N.M. Sustainable business models archetypes for the banking industry. J. Clean. Prod. 2018, 174, 150–169. [Google Scholar] [CrossRef]
  45. Fay, P. Sustainability Gains Consumer Traction as Modo Anticipates Eco 2.0. Available online: Visionmonday.com (accessed on 25 November 2020).
  46. Mason, C.F. The economics of eco-labeling: Theory and empirical implications. Int. Rev. Environ. Resour. Econ. 2012, 6, 341–372. [Google Scholar] [CrossRef]
  47. Sun, H.; Rabbani, M.R.; Ahmad, N.; Sial, M.S.; Cheng, G.; Zia-Ud-Din, M.; Fu, Q. CSR, co-creation and green consumer loyalty: Are green banking initiatives important? A moderated mediation approach from an emerging economy. Sustainability 2020, 12, 10688. [Google Scholar] [CrossRef]
  48. Boitan, I.A. Determinants of sustainable banks’ profitability, evidence from EU countries. Financ. Stud. 2015, 19, 21–39. [Google Scholar]
  49. Global Alliance for Banking on Values (GABV). Strong, Straightforward and Sustainable Banking; GABV: Amsterdam, The Netherlands, 2012. [Google Scholar]
  50. Global Alliance for Banking on Values (GABV). Real Banking for the Real Economy: Comparing Sustainable Bank Performance with the Largest Banks in the World; GABV: Amsterdam, The Netherlands, 2013. [Google Scholar]
  51. Aupperle, K.E.; Carroll, A.B.; Hatfield, J.D. An empirical examination of the relationship between corporate social responsibility and profitability. Acad. Manag. J. 1985, 28, 446–463. [Google Scholar]
  52. Ullman, A.A. Data in search of a theory: A critical examination of the relationships among social performance, social disclosure, and economic performance of US firms. Acad. Manag. Rev. 1985, 10, 540–557. [Google Scholar]
  53. Burgstahler, D.; Dichev, I. Earnings management to avoid earnings decreases and losses. J. Account. Econ. 1997, 24, 99–126. [Google Scholar] [CrossRef]
  54. El Ghoul, S.; Guedhami, O.; Kwok, C.; Mishra, D. Does corporate social responsibility affect the cost of capital? J. Bank. Financ. 2011, 35, 2388–2408. [Google Scholar] [CrossRef]
  55. Hachenberg, B.; Schiereck, D. Are green bonds priced differently from conventional bonds? J. Asset Manag. 2018, 19, 371–383. [Google Scholar] [CrossRef]
  56. Hart, S. A natural-resource-based view of the firm. Acad. Manag. Rev. 1995, 20, 986–1014. [Google Scholar] [CrossRef] [Green Version]
  57. Sharma, S.; Vredenburg, H. Proactive corporate environmental strategy and the development of competitively valuable organizational capabilities. Strateg. Manag. J. 1998, 19, 729–753. [Google Scholar] [CrossRef]
  58. Christmann, P. Effects of “best practices” of environmental management on cost advantage: The role of complementary assets. Acad. Manag. J. 2000, 43, 663–680. [Google Scholar]
  59. Pampurini, F.; Quaranta, A.G. Sustainability and efficiency of the European banking market after the global crisis: The impact of some strategic choices. Sustainability 2018, 10, 2237. [Google Scholar] [CrossRef] [Green Version]
  60. Wu, M.; Shen, C. Corporate social responsibility in the banking industry: Motives and financial performance. J. Bank. Financ. 2011, 37, 3529–3547. [Google Scholar] [CrossRef]
  61. Harjoto, M.A.; Laksmana, I. The impact of corporate social responsibility on risk taking and firm value. J. Bus. Ethics 2016, 151, 353–373. [Google Scholar] [CrossRef]
  62. Monti, A.; Pattitoni, P.; Petracci, B.; Randl, O. Does Corporate Social Responsibility Impact Equity Risk? International Evidence. 31 January 2019. Available online: https://papers.ssrn.com/sol3/papers.cfm?abstract_id=3167883 (accessed on 25 November 2020).
  63. Rajput, N.; Oberoi, S. Does corporate social responsibility give long term sustainability and stability? An empirical validation. J. Indian Manag. Strategy 2015, 20, 36–40. [Google Scholar] [CrossRef]
  64. Goss, A.; Roberts, G.S. The impact of corporate social responsibility on the cost of bank loans. J. Bank. Financ. 2011, 35, 1794–1810. [Google Scholar] [CrossRef]
  65. Cui, Y.; Geobey, S.; Weber, O.; Lin, H. The impact of green lending on credit risk in China. Sustainability 2018, 10, 2008. [Google Scholar] [CrossRef] [Green Version]
  66. Homer-Dixon, T.; Walker, B.; Biggs, R.; Crépin, A.S.; Folke, C.; Lambin, E.F.; Peterson, G.D.; Rockström, J.; Scheffer, M.; Steffen, W.; et al. Synchronous failure: The emerging causal architecture of global crisis. Ecol. Soc. 2015, 20, 6. [Google Scholar] [CrossRef]
  67. European Central Bank (ECB). Guide on Climate-Related and Environmental Risks. Supervisory Expectations Relating to Risk Management and Disclosure; ECB: Frankfurt, Germany, 2020. [Google Scholar]
  68. Chollet, P.; Sandwidi, B.W. CSR engagement and financial risk: A virtuous cycle? International evidence. Glob. Financ. J. 2018, 38, 65–81. [Google Scholar] [CrossRef]
  69. Sanfilippo-Azofra, S.; Torre-Olmo, B.; Cantero-Saiz, M.; López-Gutiérrez, C. Financial development and the bank lending channel in developing countries. J. Macroecon. 2018, 55, 215–234. [Google Scholar] [CrossRef]
  70. Tregenna, F. The fat years: The structure and profitability of the US banking sector in the precrisis period. Camb. J. Econ. 2009, 33, 609–632. [Google Scholar] [CrossRef]
  71. De Nicoló, G.; Bartholomew, P.; Zaman, J.; Zephirin, M. Bank consolidation, internationalization, and conglomerization: Trends and implications for financial risk. Financ. Mark. Inst. Instrum. 2004, 13, 173–217. [Google Scholar] [CrossRef] [Green Version]
  72. Barth, J.R.; Caprio, G., Jr.; Levine, R. Bank regulation and supervision: What works best? J. Financ. Intermediat. 2004, 13, 205–248. [Google Scholar] [CrossRef] [Green Version]
  73. Beck, T.; Demirgüç-Kunt, A.; Levine, R. Bank concentration, competition and crises: First results. J. Bank. Financ. 2006, 30, 1581–1603. [Google Scholar] [CrossRef] [Green Version]
  74. Maudos, J.; Pastor, J.M.; Pérez, F.; Quesada, J. Cost and profit efficiency in European banks. J. Int. Financ. Mark. Inst. 2002, 12, 33–58. [Google Scholar] [CrossRef]
  75. Kohers, T.; Huang, M.; Kohers, N. Market perception of efficiency in bank holding company mergers: The roles of the DEA and SFA models in capturing merger potential. Rev. Financ. Econ. 2000, 9, 101–120. [Google Scholar] [CrossRef]
  76. Vander Vennet, R. Cost and profit efficiency of financial conglomerates and universal banks in Europe. J. Money Credit Bank. 2002, 34, 254–282. [Google Scholar] [CrossRef]
  77. Athanasoglou, P.; Brissimis, S.; Delis, M. Bank-specific, industry-specific and macroeconomic determinants of bank profitability. J. Int. Financ. Mark. Inst. 2008, 18, 121–136. [Google Scholar] [CrossRef] [Green Version]
  78. Bourke, P. Concentration and other determinants of bank profitability in Europe, North America and Australia. J. Bank. Financ. 1989, 13, 65–79. [Google Scholar] [CrossRef]
  79. Wheelock, D.C.; Wilson, P.W. Consolidation in US banking: Which banks engage in mergers? Rev. Financ. Econ. 2004, 13, 7–39. [Google Scholar] [CrossRef] [Green Version]
  80. Eichengreen, B.J.; Gibson, H.D. Greek Banking at the Dawn of the New Millennium; Centre for Economic Policy Research: London, UK, 2001. [Google Scholar]
  81. Goldberg, L.G.; Rai, A. The structure-performance relationship for European banking. J. Bank. Financ. 1996, 20, 745–771. [Google Scholar] [CrossRef]
  82. Behr, P.; Schmidt, R.H.; Xie, R. Market structure, capital regulation and bank risk taking. J. Financ. Serv. Res. 2010, 37, 131–158. [Google Scholar] [CrossRef]
  83. Smirlock, M. Evidence on the (non) relationship between concentration and profitability in banking. J. Money Credit Bank. 1985, 17, 69–83. [Google Scholar] [CrossRef]
  84. Pasiouras, F.; Kosmidou, K. Factors influencing the profitability of domestic and foreign commercial banks in the European Union. Res. Int. Bus. Financ. 2007, 21, 222–237. [Google Scholar] [CrossRef]
  85. Bikker, J.A.; Hu, H. Cyclical patterns in profits, provisioning and lending of banks and procyclicality of the new Basel capital requirements. BNL Q. Rev. 2002, 55, 143–175. [Google Scholar]
  86. Blundell, R.; Bond, S. Initial conditions and moment restrictions in dynamic panel data models. J. Econom. 1998, 87, 115–143. [Google Scholar] [CrossRef] [Green Version]
  87. Arellano, M.; Bover, O. Another look at the instrumental variable estimation of error component models. J. Econom. 1995, 68, 29–51. [Google Scholar] [CrossRef] [Green Version]
  88. Nagarajan, N.R.; Teixeira, A.A.C.; Silva, S.T. Ageing population: Identifying the determinants of ageing in the least developed countries. Popul. Res. Policy Rev. 2020, 1–24. [Google Scholar] [CrossRef]
  89. Bowsher, C.G. On testing overidentifying restrictions in dynamic panel data models. Econ. Lett. 2002, 77, 211–220. [Google Scholar] [CrossRef] [Green Version]
  90. Roodman, D.M. How to do xtabond2: An introduction to difference and system GMM in stata. Stata J. 2009, 9, 86–136. [Google Scholar] [CrossRef] [Green Version]
  91. Mehrhoff, J. A Solution to the Problem of Too Many Instruments in Dynamic Panel Data GMM; Discussion Paper Series 1: Economic Studies (2009, 31); Deutsche Bundesbank: Frankfurt, Germany, 2009. [Google Scholar]
  92. Wintoki, M.B.; Linck, J.S.; Netter, J.M. Endogeneity and the dynamics of internal corporate governance. J. Financ. Econ. 2012, 105, 581–606. [Google Scholar] [CrossRef]
  93. Torre-Olmo, B.; Sanfilippo-Azofra, S.; Cantero-Saiz, M. Creditor rights and the bank lending channel of monetary policy. In Corporate Governance in Banking and Investor Protection. From Theory to Practice; CSR, Sustainability, Ethics & Governance; Díaz-Díaz, B., Idowu, S.O., Molyneux, P., Eds.; Springer International Publishing: Cham, Switzerland, 2018; Chapter 6. [Google Scholar]
  94. Keasey, K.; Martínez, B.; Pindado, J. Young family firms: Financing decisions and the willingness to dilute control. J. Corp. Financ. 2015, 24, 47–63. [Google Scholar] [CrossRef] [Green Version]
  95. Cantero-Sáiz, M.; Sanfilippo-Azofra, S.; Torre-Olmo, B.; López-Gutiérrez, C. Trade credit, sovereign risk and monetary policy in Europe. Int. Rev. Econ. Financ. 2017, 52, 39–54. [Google Scholar] [CrossRef] [Green Version]
  96. Staiger, D.; Stock, J.H. Instrumental variables regression with weak instruments. Econometrica 1997, 65, 557–586. [Google Scholar] [CrossRef]
  97. Laeven, L.; Levine, R. Bank governance, regulation and risk taking. J. Financ. Econ. 2009, 93, 259–275. [Google Scholar] [CrossRef] [Green Version]
  98. Goetz, M.R.; Laeven, L.; Levine, R. Does the geographical expansion of banks reduce risk? J. Financ. Econ. 2016, 120, 346–362. [Google Scholar] [CrossRef]
  99. Boyd, J.H.; de Nicoló, G.; Smith, B.D. Crises in competitive versus monopolistic banking systems. J. Money Credit Bank. 2004, 36, 487–506. [Google Scholar] [CrossRef]
  100. Méon, P.G.; Weill, L. Can mergers in Europe help banks hedge against macroeconomic risk? Appl. Financ. Econ. 2005, 15, 315–326. [Google Scholar] [CrossRef] [Green Version]
  101. Boyd, J.H.; de Nicoló, G. The theory of bank risk taking and competition revisited. J. Financ. 2005, 60, 1329–1343. [Google Scholar] [CrossRef]
  102. Mishkin, S. Financial consolidation: Dangers and opportunities. J. Bank. Financ. 1999, 23, 675–691. [Google Scholar] [CrossRef] [Green Version]
  103. Hughes, J.P.; Mester, L.J. Efficiency in banking: Theory, practice and evidence. In Oxford Handbook of Banking; Berger, A.N., Molyneux, P., Wilson, J.O.S., Eds.; Oxford University Press: Oxford, UK, 2012. [Google Scholar]
  104. Fiordelisi, F.; Marques-Ibanez, D.; Molyneux, P. Efficiency and risk in European banking. J. Bank. Financ. 2011, 35, 1315–1326. [Google Scholar] [CrossRef] [Green Version]
  105. Diamond, D.W.; Rajan, R.G. Liquidity risk, liquidity creation, and financial fragility: A theory of banking. J. Political Econ. 2001, 109, 287–327. [Google Scholar] [CrossRef]
  106. De Bruyckere, V.; Gerhardt, M.; Schephens, G.; Vander Vennet, R. Bank/sovereign risk spillovers in the European debt crisis. J. Bank. Financ. 2013, 37, 4793–4809. [Google Scholar] [CrossRef] [Green Version]
  107. Cetorelli, N.; Hirtle, B.; Morgan, D.; Peristiani, S.; Santos, J. Trends in financial market concentration and their implications for market stability. Econ. Policy Rev. 2007, 13, 33–51. [Google Scholar]
  108. Fries, S.; Taci, A. Cost efficiency of banks in transition: Evidence from 289 banks in 15 post-communist countries. J. Bank. Financ. 2005, 29, 55–81. [Google Scholar] [CrossRef]
  109. Van den End, J.W. A macroprudential approach to address liquidity risk with the loan-to-deposit ratio. Eur. J. Financ. 2016, 22, 237–253. [Google Scholar] [CrossRef]
  110. García-Benau, A.; Sierra-García, L.; Zorio, A. Financial crisis impact on sustainability reporting. Manag. Decis. 2013, 51, 1528–1542. [Google Scholar] [CrossRef]
  111. Altunbas, Y.; Molyneux, P. Economies of scale and scope in European banking. Appl. Financ. Econ. 1996, 6, 367–375. [Google Scholar] [CrossRef]
  112. Berger, A.N.; Mester, L.J. Explaining the dramatic changes in performance of US banks: Technological change, deregulation, and dynamic changes in competition. J. Financ. Intermediat. 2003, 12, 57–95. [Google Scholar] [CrossRef] [Green Version]
  113. Carbó-Valverde, S.; Humphrey, D.B.; López del Paso, R. Do cross-country differences in bank efficiency support a policy of “national champions”? J. Bank. Financ. 2007, 31, 2173–2188. [Google Scholar] [CrossRef]
  114. Altunbas, Y.; Gardener, E.P.M.; Molyneux, P.; Moore, B. Efficiency in European banking. Eur. Econ. Rev. 2001, 45, 1931–1955. [Google Scholar] [CrossRef]
Figure 1. (a) Geographical distribution of signatory banks of the United Nations (UN) Principles for Responsible Banking; (b) Number of banks by year of signature of the UN Principles for Responsible Banking.
Sustainability 13 01298 g001
Table 1. Countries that have joined the UN Principles for Responsible Banking.
Region/CountryNo. of BanksRegion/CountryNo. of Banks
EUROPE107AFRICA16
Norway18Nigeria5
Spain11Egypt4
United Kingdom9South Africa3
France8Kenya1
Germany8Mauritius1
Switzerland6Morocco1
Netherlands5Togo1
Turkey5ASIA26
Denmark4Japan7
Finland4South Korea5
Greece4China4
Italy4Bahrain2
Sweden4Malaysia2
Iceland3Bangladesh1
Belgium2India1
Ireland2Mongolia1
Luxembourg2Myanmar1
Russia2Philippines1
Bulgaria1Thailand1
Estonia1NORTH AMERICA12
Liechtenstein1Mexico5
Portugal1Canada4
Slovenia1United States3
Ukraine1SOUTH AMERICA16
CENTRAL AMERICA and THE CARIBBEAN11Ecuador8
Panama4Brazil4
Costa Rica2Argentina2
El Salvador2Colombia1
Dominican Republic1Paraguay1
Nicaragua1OCEANIA5
Trinidad and Tobago1Australia5
Table 2. Sample description.
Panel A: Number of Banks and Observations per Country
CountryNo. of BanksNo. of Obs.CountryNo. of BanksNo. of Obs.
Austria32153Luxembourg733
Bangladesh1153Malaysia839
Belgium839Netherlands944
Bolivia524Nigeria1352
Brazil1570Norway1782
Bulgaria838Oman520
Canada734Pakistan21103
China98459Peru944
Colombia1468Philippines629
Costa Rica944Poland839
Croatia1045Portugal839
Czech Republic1050Romania941
Denmark840Russia629
Egypt936Saudi Arabia1259
France81385Serbia629
Germany105500Slovenia733
Greece630South Africa731
Hong Kong944Spain2098
Hungary628Sweden837
Indonesia40193Switzerland41197
Ireland630Turkey838
Israel629United Kingdom34167
Italy41182United States4021961
Latvia1151Vietnam1046
Number of total banks and Obs.12365915
Panel B: Temporary Disribution of the Sample
20152016201720182019Total Obs.
No. of Obs.112912361236123610785915
Obs.: Observations.
Table 3. Summary of the independent variables of the profitability analysis.
VariableDescriptionExpected Relationship with Profitability (R)
SBDummy that takes the value of 1 if a bank has signed the UN Principles for Responsible Banking, and 0 otherwisePositive
CONCHerfindahl-Hirschman index (HHI) in terms of assetsPositive
MSMarket share in terms of assetsPositive
XEFCost X-efficiencyPositive
SEFScale efficiency with respect to the inputsPositive
SB × CONCInteraction between sustainable banks and market concentrationNon-significant
SB × MSInteraction between sustainable banks and market shareNon-significant
SB × XEFInteraction between sustainable banks and cost X-efficiencyPositive
SB × SEFInteraction between sustainable banks and scale efficiencyPositive
EQUITYEquity/Total assetsPositive
LOANSLoans/Total assetsPositive/Negative
SIZELog (Total assets)Positive/Negative
ΔGDPGDP per capita growthPositive
Table 4. Sample statistics of the profitability analysis.
VariableMeanStandard DeviationMinimumMaximum
ROA0.00720.0086−0.11730.1491
ROE0.07310.0786−0.91240.7087
CONC0.07920.05240.03060.2914
MS0.02610.05701.69 × 10−60.4602
XEF0.81610.05790.38960.9470
SEF0.74550.09980.00410.7813
EQUITY0.09960.04580.01920.7450
LOANS0.63400.15960.01950.9747
SIZE8.94092.00313.117914.7620
ΔGDP2.15721.9563−4.351523.9855
Table 5. Correlations of the profitability analysis.
CONCMSXEFSEFEQUITYLOANSSIZEΔGDP
CONC1
MS0.50021
XEF−0.0792−0.09061
SEF−0.0137−0.2421−0.01011
EQUITY0.0153−0.03150.03010.13021
LOANS−0.1249−0.12220.12230.1928−0.00041
SIZE0.22040.4497−0.0141−0.4382−0.2631−0.15591
ΔGDP−0.0486−0.0053−0.0032−0.0051−0.0679−0.22360.03501
Table 6. First-stage OLS regressions for System-GMM estimates (profitability analysis).
RF-Statisticp-ValueR2
Panel A. Dependent variable in levels, explanatory variables (instruments) in differences
SB254.40.00000.9832
CONC10.90.00100.4071
SB × CONC570.00000.9134
MS43.60.00000.5870
SB × MS58.50.00000.7957
XEF28.50.00000.1375
SB × XEF58.60.00000.9858
SEF16.30.00000.5226
SB × SEF6.50.00160.9371
EQUITY940.00000.1873
LOANS13.30.00000.1419
SIZE1.90.14560.4103
Panel B. Dependent variable in differences, explanatory variables (instruments) in levels
ΔSB22,222.90.00000.9344
ΔCONC33.90.00000.4108
Δ(SB × CONC)39.80.00000.5180
ΔMS67.10.00000.4418
Δ(SB × MS)6.90.00100.4927
ΔXEF30.10.00000.1146
Δ(SB × XEF)87.30.00000.2539
ΔSEF59.50.00000.3644
Δ(SB × SEF)75.70.00000.4049
ΔEQUITY200.00000.0739
ΔLOANS420.00000.0853
ΔSIZE850.00000.2191
Table 7. Results of the profitability analysis.
ROA (a) ROE (b)
CoefficientStandard ErrorT-Studentp-ValueCoefficientStandard ErrorT-Studentp-Value
SB0.00070.00023.140.002 ***0.00860.00322.710.007 ***
CONC0.03570.02161.660.098 *0.52860.20042.640.008 ***
SB × CONC−0.04070.0388−1.050.295−0.32070.3826−0.840.402
MS0.02940.01721.710.087 *0.14220.13661.040.298
SB × MS−0.00620.0359−0.170.8640.14720.26370.560.577
XEF0.01780.01661.080.2820.03360.13630.250.805
SB × XEF0.00020.00720.020.982−0.02350.0725−0.320.746
SEF0.01200.00691.740.081 *0.16790.09961.690.092 *
SB × SEF0.00360.01090.330.740−0.00150.1004−0.020.988
EQUITY0.04270.01692.520.012 **0.00600.17130.040.972
LOANS0.00200.00440.460.646−0.00010.0548−0.000.999
SIZE−0.00010.0007−0.120.9040.00660.00860.770.441
ΔGDP0.00030.00022.090.036 **0.00300.00161.890.058 *
LR Test. SB × CONC−0.00500.0384−0.130.8960.20780.41170.500.614
LR Test. SB × MS0.02330.02660.880.3810.28940.23381.240.216
LR Test. SB × XEF0.01800.00870.860.3900.01010.16140.060.950
LR Test. SB × SEF0.01560.02091.800.071 *0.16640.08611.930.053 *
CONS−0.02580.0181−1.420.154−0.18230.2059−0.890.376
Year dummies Yes Yes
Country dummies Yes Yes
M2 0.654 0.599
Hansen 0.133 0.168
*** indicates a level of significance of 0.01, ** indicates a level of significance of 0.05, * indicates a level of significance of 0.1. LR Test. SB × CONC is the linear restriction test of the sum of the coefficients associated with SB and CONC. LR Test. SB × MS is the linear restriction test of the sum of the coefficients associated with SB and MS. LR Test. SB × XEF is the linear restriction test of the sum of the coefficients associated with SB and XEF. LR Test. SB × SEF is the linear restriction test of the sum of the coefficients associated with SB and SEF. CONS is the regression intercept. M2 is the p-value of the 2nd order serial correlation statistic. Hansen is the p-value of the over-identifying restriction test.
Table 8. Summary of the independent variables of the risk analysis.
VariableDescriptionExpected Relationship with Risk (Z)
SBDummy that takes the value of 1 if a bank has signed the UN Principles for Responsible Banking, and 0 otherwisePositive
CONCHerfindahl-Hirschman index (HHI) in terms of assetsPositive/Negative
MSMarket share in terms of assetsPositive/Negative
XEFCost X-efficiencyPositive
SEFScale efficiency with respect to the inputsPositive
SB × CONCInteraction between sustainable banks and market concentrationPositive/Negative
SB × MSInteraction between sustainable banks and market sharePositive/Negative
SB × XEFInteraction between sustainable banks and cost X-efficiencyPositive
SB × SEFInteraction between sustainable banks and scale efficiencyPositive
LOANSLoans/Total assetsPositive/Negative
SIZELog (Total assets)Positive/Negative
LOANDEPLoans/DepositsNegative
Table 9. Sample statistics of the risk analysis.
VariableMeanStandard DeviationMinimumMaximum
Z95.9222196.72970.16613975.0530
CONC0.07920.05240.03060.2914
MS0.02610.05701.69 × 10−60.4602
XEF0.81610.05790.38960.9470
SEF0.74550.09980.00410.7813
LOANS0.63400.15960.01950.9747
SIZE8.94092.00313.117914.7620
LOANDEP7.0419398.67750.020230,647.1700
Table 10. Correlations of the risk analysis.
CONCMSXEFSEFLOANSSIZELOANDEP
CONC1
MS0.50021
XEF−0.0792−0.09061
SEF−0.0137−0.2421−0.01011
LOANS−0.1249−0.12220.12230.19281
SIZE0.22040.4497−0.0141−0.4382−0.15591
LOANDEP−0.0122−0.00460.01460.00240.00200.01511
Table 11. First-stage OLS regressions for System-GMM estimates (risk analysis).
ZF-Statisticp-ValueR2
Panel A. Dependent variable in levels, explanatory variables (instruments) in differences
SB2550.00000.9832
CONC40.40.00000.4481
SB × CONC570.00000.9134
MS42.60.00000.5859
SB × MS58.40.00000.7958
XEF30.60.00000.1327
SB × XEF58.90.00000.9858
SEF16.50.00000.5247
SB × SEF6.50.00160.9371
LOANDEP139.10.00000.2518
LOANS13.50.00000.1401
SIZE4.60.00990.3930
Panel B. Dependent variable in differences, explanatory variables (instruments) in levels
ΔSB22,235.20.00000.9344
ΔCONC92.50.00000.4163
Δ(SB × CONC)39.80.00000.5181
ΔMS43.50.00000.4725
Δ(SB × MS)6.90.00100.4924
ΔXEF28.60.00000.0937
Δ(SB × XEF)87.40.00000.2539
ΔSEF59.30.00000.3643
Δ(SB × SEF)75.70.00000.4049
ΔLOANDEP366.40.00000.2561
ΔLOANS420.00000.0904
ΔSIZE82.30.00000.2020
Table 12. Results of the risk analysis.
CoefficientStandard ErrorT-Studentp-Value
SB2.18202.98060.730.464
CONC−181.4364159.8146−1.140.256
SB × CONC241.6333485.70080.500.619
MS−223.2634180.3790−1.240.216
SB × MS−169.0902340.5535−0.500.620
XEF173.6664145.40641.190.232
SB × XEF−178.9392120.7129−1.480.138
SEF−87.7759157.7984−0.560.578
SB × SEF137.3545156.44590.880.380
LOANS87.17932.24231.690.091 *
SIZE15.737551.59451.930.054 *
LOANDEP0.10842.24230.050.961
LR Test. SB × CONC60.1970474.89230.130.899
LR Test. SB × MS−392.3537298.9900−1.310.189
LR Test. SB × XEF−5.2728139.2918−0.040.970
LR Test. SB × SEF49.578395.72280.520.605
CONS−133.1983156.7711−0.850.396
Year dummiesYes
Country dummiesYes
M2 0.442
Hansen 0.102
* indicates a level of significance of 0.1. LR Test. SB × CONC is the linear restriction test of the sum of the coefficients associated with SB and CONC. LR Test. SB × MS is the linear restriction test of the sum of the coefficients associated with SB and MS. LR Test. SB × XEF is the linear restriction test of the sum of the coefficients associated with SB and XEF. LR Test. SB × SEF is the linear restriction test of the sum of the coefficients associated with SB and SEF. CONS is the regression intercept. M2 is the p-value of the 2nd order serial correlation statistic. Hansen is the p-value of the over-identifying restriction test.
Publisher’s Note: MDPI stays neutral with regard to jurisdictional claims in published maps and institutional affiliations.

