Abstract
This study aimed to assess the level of biodiversity in selected local cattle populations as important food resources in Slovakia. The biodiversity level was derived from the genome-wide data collected for dairy (Jersey), dual-purpose (Slovak Pinzgau, Slovak Spotted), and beef breeds (Charolais, Limousine). The commonly used indices, genomic inbreeding (FROH, FGRM, FHOM, FUNI) and effective population size (NeLD), were used to quantify the impact of relatives mating on the genome of analysed populations. Even if the low NeLD estimates signalise significant loss of genetic variability within populations, the genomic inbreeding under 1% (except Jersey) showed that the intensity of diversity loss is not so rapid and can be managed by the re-arrangement of long-term breeding strategies. The analysis of genetic differentiation degree across populations assumed that the specialisation of breeds during their grading-up led to the specific nucleotide changes, especially in genes responsible for preferred phenotypic traits. The breed-specific differences observed mainly in the genome of Charolais (carcass traits) and Jersey (milk production traits) populations resulted from the polymorphisms in CAPN1 (μ-calpain) and CSN1S2 (casein alpha s2) genes, respectively. Obtained results confirmed that the specific haplotypes are strongly associated with the genetic nature of breed depending on production type.
1. Introduction
Animal biodiversity has a significant impact on the functioning of the surrounding food systems and livelihoods. It ensures numerous ecological functions and directly contributes to well-being, nutrition and food safety by providing a variety of species from domesticated and wild resources. In connection to livestock, it makes agricultural production systems more resistant to shocks and stresses, including those caused by environmental changes [1,2,3].
In general, the term animal biodiversity expresses the differences between species, breeds, sire lines or maternal families. This term can also be used to denote differences between animals at the phenotype level, e.g., performance and reproduction traits, health status, or generally animals fitness that are visible and easily measurable. However, the biodiversity arose as a result of various genetic changes shaping the genome of livestock species during their domestication and grading-up of particular breeds, which are not visually measurable. The level of livestock genetic diversity has to be therefore quantified in other ways, e.g., by analysis of inbreeding intensity, effective population size or intra- and inter-population genetic differentiation [4,5,6].
A significant decline of livestock genetic diversity on a global scale has been demonstrated in recent decades. This genetic erosion was caused mainly by the specialisation of production, which favours the world’s most widespread and highly productive breeds [7]. It should be emphasised that the intensive selection of the "best sires" for the insemination of large numbers of cows has led to a reduction in genetic diversity within breeds. Thus, the genetic diversity monitoring has taken on an essential role in the breeding programs, mainly in case of small endangered local populations that are an important part of small homelands [8].
Each form of selection causes specific changes reflected in both the selected loci and the neutral loci linked with them. Positive selection leads to the fixation of alleles with certain advantages over other alleles because they control a specific phenotypic expression important, for example, for the individual’s survival. In addition to increasing the frequency of such alleles, the frequency of neutral alleles located near them in the genome also increases (loci are linked to each other). This phenomenon is referred to as the hitchhiking effect or footprints of selection. The occurrence of such selection-affected regions may lead to a reduction in heterozygosity in a given genomic region belonging to the selected locus or an increase in the average linkage disequilibrium leading to the formation of long haplotypes. The level of diversity in the genomic area of selection footprints tends to decrease at the intra-population level and, conversely, increase at the interpopulation level. Recently, there has been an increase in the intensity of selection and breeding programs, especially in dairy cattle. The increased use of only a certain type of animal with the desired phenotype has contributed to an increasing rate of inbreeding and reducing the effective size of the population. The low effective size of the population increases the impact of inbreeding and genetic drift and, conversely, reduces the level of genetic variability which may at the same time reduce population viability in the long term.
Rapid advances in genome sequencing and high-throughput DNA techniques have led to new and more accurate estimates of genetic diversity parameters, including the inbreeding intensity, the effective population size, and genetic relatedness. These new methods can be used to increase the efficiency of genetic management of livestock populations [9]. Most established methods for detecting and estimating genetic relationships at intra- and inter-population level are based on the whole-genome average of the estimated number of identity by descent (IBD) segments between individuals. Estimating the probability of IBD is especially useful in situations where even if the individuals are inbred, the degree of relatedness does not correspond to any of the standard cases of full siblings or semi-siblings [10,11].
In general, inbreeding can be defined as the mating of individuals that are related through an ancestor, or in other words, the probability that an individual has acquired two identical alleles from an ancestor [12]. Thus, the inbreeding coefficient essentially expresses the probability that an allele pair is identical by descent. In the past, geneticists have analysed this probability primarily using pedigree data, but the currently available genomic information should lead to much more accurate estimates [13,14]. From a genomic point of view, an increased level of inbreeding means an increase in the frequency of homozygous genotypes essentially. One of the ways how to estimate the proportion of inbred animals in a population using genomic data is the calculation of Wright’s fixation index (FIS) that reflects the proportion of heterozygosity stored in the population [15]. This method does not allow to distinguish between the identity by state (IBS) and IBD alleles; thus, all these segments are included in the inbreeding estimate. An alternative method is the identification of runs of homozygosity in the genome (ROH), which takes into account the difference between the IBD and IBS segments [16,17]. Shorter ROH segments represent historical inbreeding (the founder population occurred many generations ago), while longer ROHs reflect only current inbreeding (founders only a few generations ago) [14,18]. In livestock, the selection of preferred individuals can cause large phenotypic variations and alter ROH segments distribution in different genomic regions. Selection increases the homozygosity of target loci, while at the same time increasing the frequency of potentially undesired ROH segments. The involvement of ROH segments distribution analysis in the assessment of biodiversity provides valuable knowledge about the genetic potential and overall gene pool of a population. Mapping specific molecular changes in the genome that control a desired phenotypic traits of a particular population is essential for understanding the impact of intense selection on the genome architecture and preserving the diversity and fitness of endangered populations.
The effective population size (Ne) express the number of individuals in an ideal population in which random mating would lead to the same distribution of allele frequencies or the amount of inbreeding as in the real population [19]. The effective population size helps to explain the amount of genetic diversity variance conserved in a population from a retrospective point of view, to predict the loss of genetic diversity and the survival of small endangered populations. The linkage disequilibrium (LD) between loci is most often used to estimate the historical effective population size because it provides an overview of the evolutionary history of the population [20]. The process referred to as linkage disequilibrium between two loci means that the two loci are transmitted to the offspring as a pair more likely than the other loci, e.g., in complete linkage they can be as informative as one locus. When two loci are very close to each other on a chromosome, they can be transmitted to offspring as a pair. Even loci that are not physically bound can be functionally linked due to selection and transmitted as a pair [21]. The linkage disequilibrium and the persistence of its phase between populations are important for genomic selection as well as mapping of quantitative trait loci (QTLs). Flury et al. [22] used the information about the LD variance in the genome for estimation of the effective population size of local cattle breeds. They confirmed that the single nucleotide polymorphisms (SNPs) are a powerful tool for monitoring of the small populations. The effective population size should not be less than 50 animals in the short term to avoid the risk of extinction due to loss of genetic diversity. However, the long-term effective population size should be higher than 500 animals. Surprisingly, some of the breeders responsible for managing the populations of many commercial cattle breeds do not consider such a low number to be alarming, perhaps because low Ne is beneficial for short-term genetic selection and improved production [23]. Rapid Ne decrease despite a sufficiently large population of ancestors can be explained by several bottlenecks associated with domestication, selection, and ultimately grading-up of breeds formation [22].
Intraspecific genetic diversity can be characterised based on the genetic differences between populations or between individuals within one population. The existence of intrapopulation polymorphism plays a significant role in ecological, micro, and macroevolutionary processes. From an ecological point of view, polymorphic populations can use a variety of resources; thus, use their production environment more efficiently. Besides, the polymorphic species or populations are less vulnerable to environmental changes (such as climate change), because it can survive due to the sufficient adaptability of their genome to new environmental conditions. The polymorphism also changes the evolutionary potential of the population and species, i.e., the ability of the population and species to respond to short-term environmental selection pressures [24,25]. From an evolutionary point of view, breed formation has taken place relatively recently. Therefore genetic variability between populations is usually quantified by genetic distances calculated only from genetic drift, ignoring the effect of the mutation. The uniqueness of the breed expressed by genetic distances may be the result of the predominance of rare alleles due to inbreeding, the founder effect or strict genetic isolation [26,27]. One of the other ways to quantify the amount of genetic variability between population is principal component analysis (PCA). The PCA analysis is an important statistical technique used to determine key variables in a vast amount of data to explain the differences in observations. PCA analysis can be used to simplify calculations and visualise an extensive data set, obtained, e.g., by applying whole-genome SNP microarrays. This method has become an important part of analyses of population structure and distribution of individuals into clusters depending on their genetic background [28].
The aim of the study was to assess the biodiversity level in selected local cattle populations considered as important animal genetic resources in Slovakia in the context of the sustainable management of food resources in the Baltic region.
2. Materials and Methods
2.1. Data Source and Cleaning Procedure
The biodiversity level of five local cattle populations bred in Slovakia was tested using genomic data. In a total of 356 DNA samples were collected and subsequently genotyped by different SNP microarrays depending on the production type of each breed (Table 1). Animals for SNP genotyping were selected in cooperation with particular breeders’ organisations to reliable describe the gene pool of analysed breeds and cover most frequently used paternal lines and maternal families in Slovakia. Data cleaning was performed using software PLINK 1.9 [29] to select only common autosomal SNP markers with known chromosomal position across different SNP microarrays. Then, only animals and common autosomal SNP markers with a call rate higher than 95% across all breeds were retained in the database.

Table 1.
Source of genome-wide data and sample size of analysed populations.
2.2. State of Intra-Population Genetic Diversity
The observed (Ho) and expected heterozygosity (He) and minor allele frequency (MAF) as basic diversity indices were initially used to describe the level of biodiversity within analysed populations. Each of these indices was calculated using PLNIK 1.9 [29] separately for SNP markers within populations and then averaged to compare the level of biodiversity between them.
The genomic-based inbreeding coefficient was used to express the impact of relatives mating on the genome of analysed populations. Four estimators of inbreeding coefficient were calculated. The first estimator (FROH) was derived from the proportion of ROH segments in the genome of analysed populations. The ROH segments were defined as the regions with a specific minimum number of continuous homozygous SNPs and specific length (>4 Mbp, >8 Mbp, >16 Mbp) reflecting different generations of ancestors in the past. The minimum number of SNP markers in ROH segments was calculated according to Lencz et al. [30] to reduce the number of false-positive ROH as follows:
where ns is the total number of SNP markers in the dataset, ni is the number of individuals, is the average SNP heterozygosity, and α is the percentage of false-positive ROH segments. The α was set to 0.05 [31,32]. The distribution of ROH segments in the autosomal genome was scanned by PLINK 1.9 [29] separately for each breed and ROH length class. The different proportion of missing calls within homozygous regions were allowed depending on the ROH length class (>4 Mbp 1 call, >8 Mbp 2 calls, >16 Mbp 4 calls). The one heterozygous call was allowed only for ROH segments > 16 Mbp. The FROH coefficient was then calculated according to the approach proposed by McQuillan et al. [16] by dividing the total ROH length for each individual in the particular class by the total length of the autosomal genome covered by SNP markers.
The other three inbreeding estimators (FGRM, FHOM, FUNI) were calculated by GCTA 1.93.2beta [33]. The FGRM reflecting the variance of additive genetic values (diagonal of the SNP-derived genetic relationship matrix) was calculated according to VanRaden [34] as follows:
where xi is the number of reference allele copies (1, 2, or 0) for ith SNP marker, pi is the observed fraction of the first allele at SNP marker i and . The FHOM expressing the excess of homozygosity was derived following Wright [35] as:
where O(#hom) is the observed number of homozygous genotypes, and E(#hom) is the expected number of homozygous genotypes in an individual. The FUNI was derived based on the correlation between uniting gametes [33] as follows:
where xi and hi are the same as for FGRM. The FGRM, FHOM, and FUNI were calculated for each individual in the dataset and then averaged separately within a particular population.
The effective size of a population with the known extent of linkage disequilibrium (NeLD) for specific length interval was defined by Makina et al. [36] as the size of hypothetical ideal population which would show in case of genetic equilibrium the same level of linkage disequilibrium as analysed population. The calculation of NeLD was based on the functional relationship [E( ) ≈ f(c, NeLD)] among effective population size, linkage disequilibrium () and recombination rate (c) expressed by physical genetic distance between syntenic SNP markers (1 cM ~ 1 Mbp). The LD-based effective size of analysed populations was calculated by SNeP [37] as follows:
where α is mutation rate correction (α = 2.2), k is inheritance model (in biallelic markers k = 4), ng is the sample size of gametes (twice the number of sampled individuals), and c is the physical genetic distance between two syntenic SNP markers in Morgans. Assuming a linear increase in the effective population size with time represented by past generations, the historical effective size of the analysed population was expressed as a function of time and physical genetic distance between two syntenic SNP markers [38]. Subsequently, the current effective population size was calculated by linear regression of NeLD estimates for 10–50 past generations [6].
2.3. State of Inter-Population Genetic Diversity
The state of genetic diversity among populations was derived based on the analysis of inter-population relationships by calculation of Wright’s FST fixation index [15] and Nei’s genetic distances [39]. The genetic differentiation of populations due to different production type was then tested by the factor (FA) and principal component analyses (PCA).
The Wright’s FST fixation index is mainly used to assess genetic variability between populations determining the level of heterozygosity. Generally, this index is considered as a measure of the fragmentation of the total population (metapopulation) derived from the reduction in heterozygosity in fragments or subpopulations due to gene drift. The FST fixation index was calculated by R package StAMPP [40] as follows:
where HT is the expected heterozygosity in metapopulation and HS is the average expected heterozygosity in subpopulations.
Nei’s genetic distance [39] is defined as the difference in genetic composition between two populations. This theory assumes that if two populations with a small genetic distance between them are similar, they most likely come from a common ancestor. The standard genetic distance (Da) was calculated by R package StAMPP [40] according to the formula:
where I is the normalised gene identity between population X and Y.
The analysis of genetic differentiation was based on the assumption that the frequency of specific alleles (haplotypes) differs among evaluated populations due to artificial selection focused on different phenotypic traits. Thus, the specialisation of breeds during the breeding processes led to the specific changes in their genomes, mainly in DNA sequences of genes responsible for economically important traits. The genetic differentiation was analysed separately for three categories of performance traits (carcass traits, fatty acid composition in muscle and milk production traits). In the first step, the most important protein-coding genes significantly associated with each category of performance traits were found based on the literature survey (Table 2). The chromosomal positions of selected genes were then identified using R package ensembldb [41]. In the second step, only SNP markers located directly in genomic sequences of selected genes were retained in the database. This database was then divided into four separate datasets according to each category and responsible genes. Finally, the genetic differentiation of populations was tested by principal component and factor analyses for each category separately by R software [42]. In factor analysis, each of the selected genes was considered as a factor that potentially affected the genetic structure (frequency of particular alleles in haplotypes) of analysed populations.
Table 2.
Description of protein-coding genes selected for factorial analysis of population differentiation.
3. Results
3.1. State of Intra-Population Genetic Diversity
Due to low genotyping call rate, six animals were filtered out from the database. The final dataset consisted of 350 animals and 34384 SNP markers covering 2503272.76 kbp of the autosomal genome. The average spacing between adjacent syntenic SNP markers was 72.86 ± 80.15 kbp. The average call rate was at level 98.97%.
The minor allele frequency was relatively low and ranged from 0.23 (Jersey) to 0.27 (Charolais and Slovak Pinzgau). The average observed and expected heterozygosity showed the lowest proportion of heterozygous genotypes in the genome of the Jersey population. In contrast, the highest proportion was found in the Slovak Pinzgau population (Table 3). Generally, the results confirmed the increase of genomic homozygosity in each of analysed populations as a consequence of intense selection pressure on their genome. Due to such selection pressure, only specific alleles controlling desired phenotypic traits are selected to achieve the breeding standards and increase the genetic gain of a particular breed. The increase of homozygosity can lead to the loss of genetic diversity accompanied by a reduced adaptive potential of the population. Preservation of adaptation potential is essential, especially from the point of view of breed competitiveness as well as climatic changes.
Table 3.
Genetic diversity indices observed for analysed populations.
The effect of relatives mating on the genome of analysed populations was expressed by the determination of the genomic-based inbreeding coefficient. Four estimators of inbreeding coefficient were calculated (FROH, FGRM, FHOM, and FUNI).
Due to the fact that the ROH segments of specific length reflect different generations of ancestors from which genetic information was inherited, the FROH was calculated separately for three ROH length classes; ROH > 4 Mbp (date back ~12 generations of ancestors), ROH > 8 Mbp (~6 generations of ancestors), and ROH > 16 Mbp (~3 generations of ancestors) [13,14]. As can be seen in Table 4, the FROH values decreased with the increasing length of ROH segments. The highest value of historical and recent genomic inbreeding was found in the Jersey population (Table 4) that confirmed the decrease of its overall heterozygosity expressed by the Ho and He indices. The obtained FROH values also indicated that the genomes of other populations in the analysis were not strongly affected by the relatives mating. The results showed that the recent genomic inbreeding (derived from ROH > 16 Mbp) could be expected at the level of 0.58% in the Charolais population and 0.43% in the Limousin population. In Slovak Spotted and Slovak Pinzgau cattle, the recent inbreeding at level 0.44% and 0.79% was found.
Table 4.
Comparison of four genomic inbreeding coefficient estimators calculated for analysed populations.
Obtained negative values of FGRM, FHOM, and FUNI were almost close to zero in all populations and showed significant difference compared to FROH estimates (p < 0.05) (Table 4). The GRM-based inbreeding coefficient ranged from −0.21 (Jersey) to −0.01 (Slovak Pinzgau), which indicated that the proportion of diversity loss due to relatives mating and low population size was higher in Jersey population compared to others. The FHOM and FUNI estimates showed only low differences in genomic inbreeding level within populations and ranged from −0.01 (Slovak Spotted and Slovak Pinzgau) to −0.06 (Limousin).
Obtained results confirmed that the distribution of runs of homozygosity (ROH) with different length in the cattle genome is a better indicator of genomic inbreeding compared to other estimators. Considering the sustainable use of animal genetic resources, the proportion of ROH segments in an individual’s genome is a reliable indicator for determining its suitability for mating plans, especially in small endangered populations where it is necessary to minimise the loss of genetic diversity and maintain or increase the effective size of the population [43].
The NeLD estimates confirmed a continuous decrease in effective size with the increasing number of generations in each analysed population (Figure 1). The lowest recent effective population size was found for Limousin (14.52 animals), while the highest NeLD showed Slovak Spotted cattle (77.99 animals). Even if the effective population size of Slovak Pinzgau was higher compared to Jersey, Charolais, or Limousin, it showed the most intensive decrease of animals’ number per generation (7.10 animals). The fact that the current effective size of analysed populations was low means that populations could be partially considered as significantly endangered by the loss of genetic diversity. According to Franklin [44], populations with Ne lower than 50 animals may be at immediate risk of extinction. Other authors also refer to this value as the threshold for the long-term survival of the population. For example, Meuwissen [45] stated that a minimum effective size of 100 individuals is needed to ensure the long-term viability of an animal population. This is because small populations are subject to a loss of genetic variability due to inbreeding or genetic drift much faster than populations with higher numbers of individuals. The significant loss of genetic diversity in a small population can lead to reducing its competitiveness and adaptability in a changing production environment.
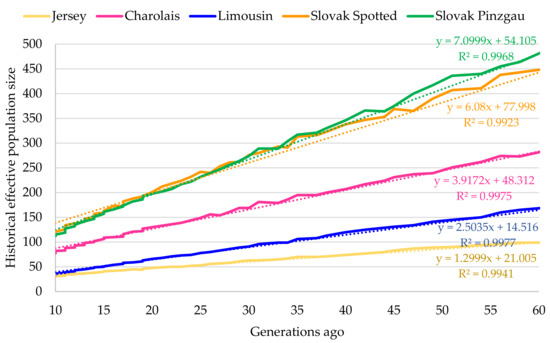
Figure 1.
Linkage disequilibrium (LD)-based effective population size.
3.2. State of Inter-Population Genetic Diversity
Both, the average Wright’s FST index (0.11 ± 0.08) and average genetic distances (0.07 ± 0.05) pointed to the high overall genetic similarity among analysed populations. As expected due to the common breeding history, the highest similarity showed Slovak Spotted and Slovak Pinzgau cattle (Table 5). The Slovak Spotted and Slovak Pinzgau cattle were created by crossing the autochthonous breeds (mainly Carpathian red and Carpathian grey) with Simmental and Austrian Pinzgau breeds, respectively. A relatively high proportion of genetic similarity to the gene pool of Slovak Spotted and Slovak Pinzgau cattle showed Charolais population. This is probably a consequence of crossbreeding with beef cattle during the grading-up of Slovak Spotted and Slovak Pinzgau cattle to strengthen their dual-purpose nature and improve the quality of beef production. The Jersey population as only one representative group of dairy cattle in this study showed clearly the highest genetic distance from others.
Table 5.
Interpopulation genetic relationship based on genetic distance (above the diagonal) and Wright’s FST index (under the diagonal).
Figure 2 shows the genetic differentiation of analysed populations due to SNP polymorphisms (specific frequency of haplotypes) in genes responsible for carcass traits. Carcass traits, including marbling, tenderness, and meat colour are critical parameters that are usually used to assess the freshness, eating quality, and safety of beef products. As can be seen in Figure 2, the diversity based on the genetic polymorphism of the monitored genes showed individual differences among breeds, mainly in the case of Charolais population. The Charolais cattle was separated from other populations due to the genetic polymorphisms of CAPN1 gene (μ-calpain) that is responsible for the post-mortem tenderisation process [46]. Calpains (CAPN1, CAPN2, CAPN3) together with their endogenous inhibitor calpastatin (CAST) were significantly associated in previous studies with meat tenderness [47,48] and marbling score [49]. The genetic polymorphisms in PLAG1, SREBP1, LCORL, MYF5, and MYOD1 genes resulted in partial genetic differentiation of Slovak Spotted cattle from other populations in the analysis. The PLAG1 and LCORL genes were associated with carcass weight in several breeds, including Simmental, Charolais and Limousin cattle [50,51,52]. The SREBP1 gene has an essential role in the lipogenesis and fatty acid composition in fat cells and was consequently considered to influence the beef nutritional quality [53]. The genetic variants of MYF5 genes were associated with growth traits, genetic indices, morphological scores, backfat thickness and meat tenderness [54,55,56]. The polymorphisms of MYOD1 and MYF6 genes were found to be important for growth and muscle development, carcass traits and beef quality [57]. In the case of Limousin population, partial genetic differentiation was detected because of polymorphisms in the MSTN and CAST genes. The MSTN (myostatin) gene is responsible for the double-muscle phenotype in several breeds, including Limousine [58]. In the middle of genetic clusters were located Jersey and Slovak Pinzgau populations which genetic variability was affected by polymorphisms in LEP, OLR1, CAPN3, CAPN2, TG, MYF6, and MYOG genes. The leptin (LEP) as metabolism-related hormone influencing animal growth and fattening was found in cattle to be related to various carcass traits [59]. The OLR1 gene is involved in lipid synthesis and fat accumulation in adipose tissue. This gene was significantly associated with rump fat thickness and weaning weight [60]. The thyroglobulin (TG) gene was studied as an important gene for fat deposition in cattle [61].
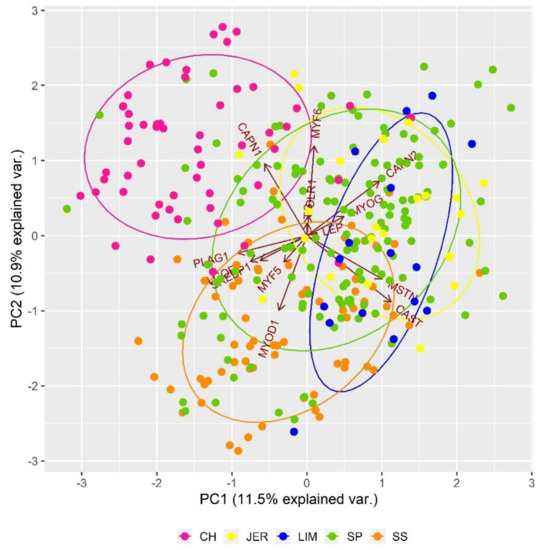
Figure 2.
Impact of single nucleotide polymorphisms (SNPs) in genes responsible for carcass traits on the genetic structure of analysed populations.
Figure 3 shows the impact of SNP polymorphisms in genes connected to fatty acid composition in a muscle on inter-population genetic differentiation. The composition of fatty acids in bovine adipose tissue is a very important trait that affects the taste, tenderness, and overall eating quality of beef. Based on the observed results, it can be stated only individual variability that cannot be generalised to the population (breed) level. Overall, SNP polymorphisms of seven genes associated with fatty acid composition were studied (Table 2). The FABP gene family, in this study represented by FABP1, FABP3 and FAPB4 genes, affect various cellular processes, including lipid metabolism. The FABP3 protein was identified in several tissues with a high demand for fatty acids such as cardiac and skeletal muscle and lactating mammary gland. The FABP4 protein, expressed in adipose tissue, was associated with lipid metabolism (lipolysis and lipogenesis), marbling, and back fat deposition [62]. The polymorphisms in SLC27A6, FABP3, and FABP4 genes can affect the sensitivity of fatty acid uptake from the blood and its transport into the epithelial cells [63]. The polymorphisms in FASN gene encoding fatty acid synthetase affected the concentration of monounsaturated and saturated fatty acids in beef [64]. Various studies confirmed the effect of bovine stearoyl-CoA desaturase (SCD) and sterol regulatory element-binding protein (SREBP1) genes on the fatty acid composition [65,66].
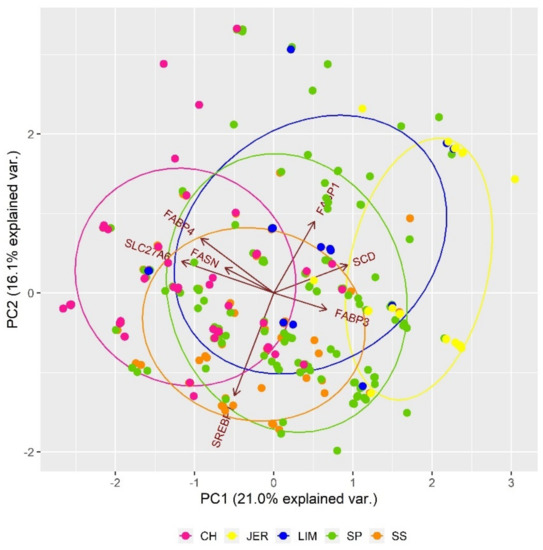
Figure 3.
Impact of SNP polymorphisms in genes responsible for fatty acid composition on the genetic structure of analysed populations.
The PCA analysis of genetic differentiation based on SNP polymorphisms in genes related to milk production traits (Figure 4) indicated that the Jersey population is separated from others, mainly due to the polymorphisms in CSN1S2 gene. In general, the casein family consists of several molecular forms, including insoluble (CSN1S1, CSN1S2, CSN2, CSN3) and soluble fractions (LGB, LALBA). The casein alpha s1 (CSN1S1) and casein alpha s2 (CSN1S2) play an important role in the capacity of milk to transport calcium phosphate. The casein beta (CSN2) is responsible for the structure of casein micelles, and casein kappa (CSN3) has an impact on the rheological quality of bovine milk [67,68]. The α-lactalbumin (LALBA) forms a regulatory subunit of lactose-synthase that is responsible for lactose production and changes the substrate specificity of galactosyltransferase in the mammary gland [69].
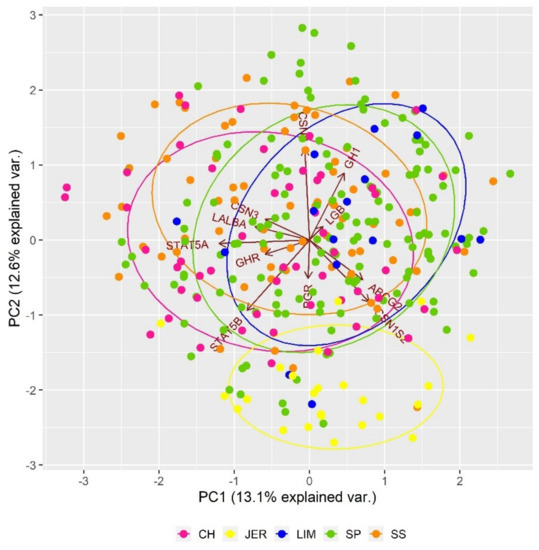
Figure 4.
Impact of SNP polymorphisms in genes responsible for milk production traits on the genetic structure of analysed populations.
4. Discussion
As expected according to previous studies (e.g., [70,71]), the high genotyping call rate observed across animals and SNP markers in the database reflected the fact that the applied SNP microarrays were primarily developed for commercial genotyping of highly informative markers uniformly distributed in the genome of the most commonly used dairy, dual-purpose and beef breeds worldwide. Several studies reported that these microarrays could be possibly used to assess the biodiversity of a phylogenetically closely related model and non-model species [72,73,74], but with significantly lower genotyping call rate compared to taurine cattle breeds.
The basic genetic diversity indices (Ho, He, and MAF) pointed to the increase of overall genomic homozygosity in each analysed population consistent with Matukumalli et al. [75], which developed and characterised the high-density bovine SNP microarray. Similarly, various other genomic studies reported the decrease of overall heterozygosity in European cattle breeds [6,70,76,77]. Heterozygosity can range from 0 (no heterozygosity) to 1 (populations with a large number of alleles with approximately the same frequency). High heterozygosity values for a particular breed may indicate long-term natural selection due to adaptation, cross-breeding with different breeds, or historical cross-breeding of different populations. On the other hand, a low level of heterozygosity may be due to isolation of population with consequent loss of unexplained genetic potential or intense artificial selection to improve economically important phenotypic traits.
An important goal of breeding programs in small local cattle populations is to maximize genetic variability and minimize the increase of inbreeding per generations, as reducing genetic variability could lead to deterioration of production and fitness traits. The high proportion of inbreed animals in a population usually leads to an increase of genomic homozygosity on the population level and the intensity of the manifestation of undesirable alleles mostly associated with inherited diseases. The genomic-based inbreeding coefficient confirmed the high proportion of homozygosity, especially in the Jersey population. A similar high level of recent inbreeding in Jersey was reported by Makanjuola et al. [78]. In other breeds in analysis, the FROH estimates under 1% were found. These results indicate good breeding practices on farms and a sufficient degree of genetic diversity for long-term sustainable use of analysed populations as important food resources in Slovakia. The level of recent inbreeding in Charolais and Limousin populations was in sound with Mastrangelo et al. [79]. The obtained estimates of recent inbreeding in Slovak Spotted and Slovak Pinzgau populations correspond to the pedigree estimates found by Kadlečík et al. [80] and Kadlečík et al. [81], respectively. The other three estimates (FGRM, FHOM, and FUNI) of inbreeding indicated a non-significant effect of relatives mating on the genome of analysed populations. Similar average FGRM, FHOM, and FUNI inbreeding estimates were reported by Zhang et al. [82] and Mastrangelo et al. [79] for several local cattle populations. Various studies showed that the FROH could be considered as the most precise estimators of genomic inbreeding compared to others tested in this study mainly due to the fact that it measures homozygosity directly from the molecular data and is less sensitive to selection effects and errors caused by sample variations [13,82,83]. The analysis of ROH segments spread across the genome of small local populations also has practical application in conservation programs. In endangered populations or populations with low effective size, individuals with high ROH proportion in the genome may be excluded from breeding strategy or used less frequently in mating schemes. Mating and cross-breeding of outbred individuals or populations can increase overall genetic diversity and reduce the proportion of long ROH regions in the genome that indicate inbreeding in the current generation. Preservation of genetic diversity within and between breeds is crucial for conservation genetics and the maintenance of production potential of the population. Intense selection, low effective population size, and increase of inbreeding per generation can adversely affect the level of genetic diversity conserved in population, thus breeding programs have to continuously monitor the state of genetic variability in order to prevent irreversible erosion of genetic diversity and maximize the ability of a population to adapt to changes of the production environment.
The effective population size determines the intensity of the degradation of neutral genetic variance in the population. It influences the behaviour of genes due to selection effects and other systematic influences, as well as differences in genetic gain, selection limits, short and long-term survival of endangered populations. The effective population size is usually lower than the real size of the population mainly due to unequal gender ratio, variation in family size, and population size fluctuations between generations. The real population size has only informative value for most endangered species, but the effective population size determines the loss of genetic diversity and inbreeding. It helps predict the loss and distribution of neutral genetic variability, the likelihood of fixation of desirable or loss of undesirable alleles, fitness, and the survival of small populations. The analysis of the effective population size allows for the development of effective selection programs and at the same time, their management, especially in the case of endangered populations. The LD-based effective population size (NeLD) was estimated based on the functional relationship among effective population size, linkage disequilibrium, and recombination rate expressed by physical genetic distance between syntenic SNP markers. The level of linkage disequilibrium that arises because of the formation of genetic linkage between loci on chromosomes can differ between populations as well as livestock species. In general, linkage disequilibrium is caused by various factors affecting the structure of the genome, such as genetic drift, admixture, and natural or artificial selection. Determining the LD extent in the genome allows for the mapping of genetic variants controlling performance traits in livestock or estimating the trend of effective population size [84]. Currently, the determination of the LD extent is routinely used to assess the demographic history of a large number of species, including cattle, sheep and humans [85,86,87]. Even if the NeLD estimates indicate the significant loss of genetic diversity in each of analysed populations, the genomic inbreeding showed that the intensity of diversity loss is not so rapid as expected. The effective population size can be still successfully managed by the development of long-term breeding strategies depending on the specific breeding goals and farmers requirements.
The Slovak Spotted and Slovak Pinzgau populations showed a higher level of a genetic connection compared to others. These breeds are in Slovakia considered as national animal genetic resources important mainly for small homelands. The Slovak Spotted breed is a dual-purpose breed with a moderate to large body size, harmonic body shape and excellent muscles. This breed is typical by robust, well-shaped udder enabling ease milking, the correct, dry legs with strong neat, well-developed muscles, and adequate physical shape. The Slovak Pinzgau cattle is a dual-purpose breed valuable mainly for its ability to produce milk and dairy products with high quality under intense as well as ecological production systems. Although the milk yield of Slovak Pinzgau cattle does not reach the level of cosmopolitan dairy breeds, milk contains a high proportion of fat and protein. It is ideal for making cheese. The meat of this breed is tender and juicy. Although both breeds have certain advantages compared to cosmopolitan breeds, their effective population size is still declining. One of the reason can be the intensive use of artificial selection to increase the profitability of farms and genetic gain at the expense of their unique gene pool. Due to this, their gene pool has to be continuously monitored to preserve mainly genetic variants that are responsible for their typical phenotypic traits, e.g. adaptation potential to harsh production environments. The ability of populations to adapt to the conditions of a changing production environment is one of the key traits necessary for its sustainable use in the future, especially in connection with the ever-increasing demand for healthy foods.
The effect of breed specialisation and different selection pressure on the particular genomic regions was most evident in Charolais and Jersey populations. Obtained results confirmed the tested assumption that the different production type of analysed breeds could cause an increase in the frequency of specific alleles (haplotypes) responsible for desired phenotypic traits. The strong impact of selection on the genomic region related to carcass traits in beef cattle was also reported by Moravčíková et al. [88], Jahuey-Martínez et al. [89] or Paim et al. [90]. In dairy cattle, the most significant selection signatures were found mainly on chromosome 6 that is strongly connected to milk production and composition [91,92]. The functional analyses of known and novel genetic variants continuously improve the knowledge of genetic control of these complex traits that are usually affected by several genes or quantitative trait loci. In addition, such analyses of specific genetic variants can help to preserve the genetic nature of the local cattle population in their origin phenotypes.
Author Contributions
Conceptualisation, R.K.; methodology, R.K. and N.M.; formal analysis, N.M., K.C., H.V.-V. and L.V.; data curation, N.M.; writing—original draft preparation, N.M.; writing—review and editing, R.K. and L.V.; visualisation, N.M. All authors have read and agreed to the published version of the manuscript.
Funding
This research was funded by Slovak Research and Development Agency (grant numbers APVV-14-0054 and APVV-17-0060) and by the Ministry of Agriculture of the Czech Republic (grant number QK1810253).
Institutional Review Board Statement
Ethical review and approval were waived for this study, due to this study did not involve biological human experiment and patient data.
Informed Consent Statement
Informed consent was obtained from all subjects involved in the study.
Date Availability Statement
Derived data supporting the findings of this study are available from the corresponding author on request.
Acknowledgments
The authors would like to thank anonymous reviewers and journal editors whose comments/suggestions helped improve and clarify this manuscript.
Conflicts of Interest
The authors declare no conflict of interest.
References
- Féron, E.M. New food sources, conservation of biodiversity and sustainable development: Can unconventional animal species contribute to feeding the world? Biodivers. Conserv. 1995, 4, 233–240. [Google Scholar] [CrossRef]
- Thrupp, L.A. Linking Agricultural Biodiversity and Food Security: The Valuable Role of Sustainable Agriculture. Int. Aff. 2000, 2, 265–281. [Google Scholar] [CrossRef] [PubMed]
- Food and Agriculture Organization of the United Nations. Available online: http://www.fao.org/news/story/en/item/1180463/icode/ (accessed on 5 October 2020).
- Wang, J.; Santiago, E.; Caballero, A. Prediction and estimation of effective population size. Heredity 2016, 117, 193–206. [Google Scholar] [CrossRef] [PubMed]
- Baes, C.F.; Makanjuola, B.O.; Miglior, F.; Marras, G.; Howard, J.T.; Fleming, A.; Maltecca, C. Symposium review: The genomic architecture of inbreeding: How homozygosity affects health and performance. J. Dairy Sci. 2019, 102, 2807–2817. [Google Scholar] [CrossRef] [PubMed]
- Kukučková, V.; Moravčíková, N.; Ferenčaković, M.; Simčič, M.; Mészáros, G.; Sölkner, J.; Trakovická, A.; Kadlečík, O.; Curik, I.; Kasarda, R. Genomic characterisation of Pinzgau cattle: Genetic conservation and breeding perspectives. Conserv. Genet. 2017, 18, 893–910. [Google Scholar] [CrossRef]
- Hoffmann, I. Livestock biodiversity and sustainability. Livest. Sci. 2011, 139, 1–2. [Google Scholar] [CrossRef]
- Kasarda, R.; Jamborová, L.; Moravčíková, N. Genetic diversity and production potential of animal food resources. Acta Fytotech. Zootech. 2020, 23, 102–108. [Google Scholar] [CrossRef]
- Toro, M.A.; Villanueva, B.; Fernández, J. Genomics applied to management strategies in conservation programmes. Livest. Sci. 2014, 166, 48–53. [Google Scholar] [CrossRef]
- Weir, B.S.; Anderson, A.D.; Hepler, A.B. Genetic relatedness analysis: Modern data and new challenges. Nat. Rev. Genet. 2006, 7, 771–780. [Google Scholar] [CrossRef]
- Doekes, H.P.; Veerkamp, R.F.; Bijma, P.; Hiemstra, S.J.; Windig, J.J. Trends in genome-wide and region-specific genetic diversity in the Dutch-Flemish Holstein–Friesian breeding program from 1986 to 2015. Genet. Sel. Evol. 2018, 50, 15. [Google Scholar] [CrossRef]
- Gutiérrez, J.P.; Goyache, F. A note on ENDOG: A computer program for analysing pedigree information. J. Anim. Breed. Genet. 2005, 122, 172–176. [Google Scholar] [CrossRef] [PubMed]
- Ferenčaković, M.; Sölkner, J.; Curik, I. Estimating autozygosity from high-throughput information: Effects of SNP density and genotyping errors. Genet. Sel. Evol. 2013, 45, 1–9. [Google Scholar] [CrossRef]
- Curik, I.; Ferenčaković, M.; Sölkner, J. Inbreeding and runs of homozygosity: A possible solution to an old problem. Livestock Science 2014, 166, 26–34. [Google Scholar] [CrossRef]
- Weir, B.S.; Cockerham, C.C. Estimating F-Statistics for the analysis of population structure. Evolution 1984, 38, 1358–1370. [Google Scholar] [PubMed]
- McQuillan, R.; Leutenegger, A.L.; Abdel-Rahman, R.; Franklin, C.S.; Pericic, M.; Barac-Lauc, L.; Smolej-Narancic, N.; Janicijevic, B.; Polasek, O.; Tenesa, A.; et al. Runs of homozygosity in European populations. Am. J. Hum. Genet. 2008, 83, 359–372. [Google Scholar] [CrossRef]
- Kirin, M.; McQuillan, R.; Franklin, C.S.; Campbell, H.; McKeigue, P.M.; Wilson, J.F. Genomic runs of homozygosity record population history and consanguinity. PLoS ONE 2010, 5, e13996. [Google Scholar] [CrossRef]
- Bjelland, D.W.; Weigel, K.A.; Vukasinovic, N.; Nkrumah, J.D. Evaluation of inbreeding depression in Holstein cattle using whole-genome SNP markers and alternative measures of genomic inbreeding. J. Dairy Sci. 2013, 96, 4697–4706. [Google Scholar] [CrossRef]
- Charlesworth, D.; Willis, J.H. The genetics of inbreeding depression. Nat. Rev. Genet. 2009, 10, 783–796. [Google Scholar] [CrossRef]
- Qanbari, S.; Pimentel, E.C.G.; Tetens, J.; Thaller, G.; Lichtner, P.; Sharifi, A.R.; Simianer, H. The pattern of linkage disequilibrium in German Holstein cattle. Anim. Genet. 2010, 41, 346–356. [Google Scholar] [CrossRef]
- Selkoe, K.A.; Toonen, R.J. Microsatellites for ecologists: A practical guide to using and evaluating microsatellites markers. Ecol. Lett. 2006, 9, 615–629. [Google Scholar] [CrossRef]
- Flury, C.; Tapio, M.; Sonstegard, C.; Drogemuller, C.; Leeb, T.; Simianer, H.; Hanotte, O.; Rieder, S. Effective population size of an indigenous Swiss cattle breed estimated from linkage disequilibrium. J. Anim. Breed. Genet. 2010, 127, 339–347. [Google Scholar] [CrossRef] [PubMed]
- Taberlet, P.; Coissac, E.; Pansu, J.; Pompanon, F. Conservation genetics of cattle, sheep and goats. Comptes Rendus Biol. 2011, 334, 247–254. [Google Scholar] [CrossRef] [PubMed]
- Vellend, M.; Geber, M.A. Connections between species diversity and genetic diversity. Ecol. Lett. 2005, 8, 767–781. [Google Scholar] [CrossRef]
- Wennersten, L.; Forsman, A. Population-level consequences of polymorphism, plasticity and randomised phenotype switching: A review of predictions. Biol. Rev. Camb. Philos. Soc. 2012, 87, 756–767. [Google Scholar] [CrossRef] [PubMed]
- Eding, H. Conservation of Genetic Diversity: Assessing Genetic Variation Using Marker Estimated Kinships. Ph.D. Thesis, Wageningen University, Wagening, Netherlands, 2008; 120p. [Google Scholar]
- Hall, S.J.G.; Lenstra, J.A.; Deeming, D.C. The European Cattle Genetic Diversity Consortium. Prioritisation based on neutral genetic diversity may fail to conserve important characteristics in cattle breeds. J. Anim. Breed. Genet. 2012, 129, 218–225. [Google Scholar] [CrossRef]
- Gauch, H.G.; Qian, S.; Piepho, H.P.; Zhou, L.; Chen, R. Consequences of PCA graphs, SNP codings, and PCA variants for elucidating population structure. PloS ONE 2019, 14, e0218306. [Google Scholar] [CrossRef]
- Chang, C.C.; Chow, C.C.; Tellier, L.C.A.M.; Vattikuti, S.; Purcell, S.M.; Lee, J.J. Second-generation PLINK: Rising to the challenge of larger and richer datasets. GigaScience 2015, 4, 7. [Google Scholar] [CrossRef]
- Lencz, T.; Lambert, C.; DeRosse, P.; Burdick, K.E.; Morgan, T.V.; Kane, J.M.; Kucherlapati, R.; Malhotra, A.K. Runs of homozygosity reveal highly penetrant recessive loci in schizophrenia. Proc. Natl. Acad. Sci. USA 2007, 104, 19942–19947. [Google Scholar] [CrossRef]
- Mastrangelo, S.; Tolone, M.; Sardina, M.T.; Sottile, G.; Sutera, A.M.; Di Gerlando, R.; Portolano, B. Genome-wide scan for runs of homozygosity identifies potential candidate genes associated with local adaptation in Valle del Belice sheep. Genet. Sel. Evol. 2017, 49, 84. [Google Scholar] [CrossRef]
- Purfield, D.C.; Berry, D.P.; McParland, S.; Bradley, D.G. Runs of homozygosity and population history in cattle. BMC Genet. 2012, 13, 70. [Google Scholar] [CrossRef]
- Yang, J.; Lee, S.H.; Goddard, M.E.; Visscher, P.M. GCTA: A Tool for Genome-wide Complex Trait Analysis. Am. J. Hum. Genet. 2011, 88, 76–82. [Google Scholar] [CrossRef] [PubMed]
- VanRaden, P.M. Efficient methods to compute genomic predictions. J. Dairy Sci. 2008, 91, 4414–4423. [Google Scholar] [CrossRef] [PubMed]
- Wright, S. Genetics of populations. Encycl. Br. 1948, 10, 111–112. [Google Scholar]
- Makina, S.O.; Muchadeyi, F.C.; van Marle-Köster, E.; Taylor, J.F.; Makgahlela, M.L.; Maiwashe, A. Genome-wide scan for selection signatures in six cattle breeds in South Africa. Genet. Sel. Evol. 2015, 47, 1–14. [Google Scholar] [CrossRef] [PubMed]
- Barbato, M.; Orozco-terWengel, P.; Tapio, M.; Bruford, M.W. SNeP: A tool to estimate trends in recent effective population size trajectories using genome-wide SNP data. Front. Genet. 2015, 6, 109. [Google Scholar] [CrossRef]
- Hayes, B.J.; Visscher, P.M.; McPartlan, H.C.; Goddard, M.E. Novel multilocus measure of linkage disequilibrium to estimate past effective population size. Genome Res. 2003, 13, 635–643. [Google Scholar] [CrossRef]
- Nei, M. Genetic distance between populations. Am. Nat. 1972, 106, 283–285. [Google Scholar] [CrossRef]
- Pembleton, L.W.; Cogan, N.O.; Forster, J.W. StAMPP: An R package for calculation of genetic differentiation and structure of mixed-ploidy level populations. Mol. Ecol. Res. 2013, 13, 946–952. [Google Scholar] [CrossRef]
- Rainer, J.; Gatto, L.; Weichenberger, C.X. ensembldb: An R package to create and use Ensembl-based annotation resources. Bioinformatics 2019, 35, 3151–3153. [Google Scholar] [CrossRef]
- R Core Team. R: A Language and Environment for Statistical Computing; R Foundation for Statistical Computing: Vienna, Austria, 2020. [Google Scholar]
- Herrero-Medrano, J.M.; Megens, H.J.; Groenen, M.A.M.; Ramis, G.; Bosse, M.; Pérez-Enciso, M.; Crooijmans, R.P.M.A. Conservation genomic analysis of domestic and wild pig populations from the Iberian Peninsula. BMC Genetics 2013, 14, 106. [Google Scholar] [CrossRef]
- Franklin, I.R. Evolutionary change in small populations. In Conservation Biology: An Evolutionary-Ecological Perspective; Sinauer Associates: Sunderland, UK, 1980; pp. 135–140. [Google Scholar]
- Meuwissen, T.H.E. Genetic management of small populations: A review. Acta. Agric. Scand. Sect. Anim. Sci. 2009, 59, 71–79. [Google Scholar] [CrossRef]
- Koohmaraie, M. Biochemical factors regulating the tougheningand tenderisation processes of meat. Meat Sci. 1996, 43, 193–201. [Google Scholar] [CrossRef]
- Casas, E.; Shackelford, S.D.; Keele, J.W.; Koohmaraie, M.; Smith, T.P.; Stone, R.T. Detection of quantitative trait loci for growth and carcass composition in cattle. J. Anim. Sci. 2003, 81, 2976–2983. [Google Scholar] [CrossRef] [PubMed][Green Version]
- Li, X.; Ekerljung, M.; Lundström, K.; Lundén, A. Associationof polymorphisms at DGAT1, leptin, SCD1, CAPN1 and CAST genes with color, marbling and water holding capacity in meatfrom beef cattle populations in Sweden. Meat Sci. 2013, 94, 153–158. [Google Scholar] [CrossRef]
- Cheong, H.; Yoon, D.H.; Park, B.; Kim, L.; Bae, J.; Namgoong, S.; Lee, H.; Han, C.; Kim, J.; Cheong, I.C.; et al. A single nucleotide polymorphism in CAPN1 associated with marbling score in Korean cattle. BMC Genetics 2008, 9, 33. [Google Scholar] [CrossRef]
- Lee, S.; Choi, B.H.; Lim, D.; Gondro, C.; Cho, Y.M.; Dang, C.G.; Sharma, A.; Jang, G.W.; Lee, K.T.; Yoon, D.; et al. Genome-wide association study identifies major loci for carcass weight on BTA14 in Hanwoo (Korean cattle). PLoS ONE 2013, 8, e74677. [Google Scholar] [CrossRef]
- Song, Y.; Xu, L.; Chen, Y.; Zhang, L.; Gao, H.; Zhu, B.; Niu, H.; Zhang, W.; Xia, J.; Gao, X.; et al. Genome-Wide Association Study Reveals the PLAG1 Gene for Knuckle, Biceps and Shank Weight in Simmental Beef Cattle. PLoS ONE 2016, 11, e0168316. [Google Scholar] [CrossRef]
- Purfield, D.C.; Evans, R.D.; Berry, D.P. Reaffirmation of known major genes and the identification of novel candidate genes associated with carcass-related metrics based on whole genome sequence within a large multi-breed cattle population. BMC Genom. 2019, 20, 720. [Google Scholar] [CrossRef]
- Gamarra, D.; Aldai, N.; Arakawa, A.; de Pancorbo, M.M.; Taniguchi, M. Association of a polymorphism in SREBP1 with fatty acid composition and lipogenic gene expression in beef cattle breeds. Res. Sq. 2019. [Google Scholar] [CrossRef]
- Ujan, J.A.; Zan, L.S.; Shengjuan, W.; Adoligbe, C.; Wang, H.B. Meat tenderness and water holding capacity are associated with a 959 A G mutation in the MYOG gene of Chinese indigenous cattle. Afr. J. Biotechnol. 2011, 10, 5654–5660. [Google Scholar]
- Sarti, F.M.; Lasagna, E.; Ceccobelli, S.; Di Lorenzo, P.; Filippini, F.; Sbarra, F.; Giontella, A.; Pieramati, C.; Panella, F. Influence of single nucleotide polymorphisms in the myostatin and myogenic factor 5 muscle growth-related genes on the performance traits of Marchigiana beef cattle. J. Anim. Sci. 2014, 92, 3804–3810. [Google Scholar] [CrossRef] [PubMed]
- Zhao, C.; Raza, S.H.A.; Khan, R.; Sabek, A.; Khan, S.; Ullah, I.; Memon, S.; Abd El-Aziz, A.H.; Shah, M.A.; Shijun, L.; et al. Genetic variants in MYF5 affected growth traits and beef quality traits in Chinese Qinchuan cattle. Genomics 2020, 112, 2804–2812. [Google Scholar] [CrossRef] [PubMed]
- Du, X.H.; Gan, Q.F.; Yuan, Z.R.; Gao, X.; Zhang, L.P.; Gao, H.J.; Li, J.Y.; Xu, S.Z. Polymorphism of MyoD1 and Myf6 genes and associations with carcass and meat quality traits in beef cattle. Genet. Mol. Res. 2013, 12, 6708–6717. [Google Scholar] [CrossRef] [PubMed]
- Fiems, L.O. Double Muscling in Cattle: Genes, Husbandry, Carcasses and Meat. Animals 2012, 2, 472–506. [Google Scholar] [CrossRef] [PubMed]
- He, M.L.; Stanford, K.; Dugan, M.E.R.; Marquess, L.; McAllister, T.A. Association of leptin genotype with growth performance, adipocyte cellularity, meat quality, and fatty acid profile in beef steers fed flaxseed or high-oleate sunflower seed diets with or without triticale dried distiller’s grains. Meat Sci. 2020, 98, 1–13. [Google Scholar] [CrossRef]
- Fonseca, P.D.S.; de Souza, F.R.P.; de Camargo, G.M.F.; Gil, F.M.M.; Cardoso, D.F.; Zetouni, L.-; Braz, C.U.; Boligon, A.A.; Branco, R.H.; de Albuquerque, L.G.; et al. Association of ADIPOQ, OLR1 and PPARGC1A gene polymorphisms with growth and carcass traits in Nelore cattle. Meta Gene 2015, 4, 1–7. [Google Scholar] [CrossRef]
- Zhang, L.; Ren, H.; Yang, J.; Gan, Q.; Thao, F.; Gao, H.; Li, J. Effect of thyroglobulin gene polymorphisms on growth, carcass composition and meat quality traits in Chinese beef cattle. Mol. Biol. Rep. 2015, 42, 1403–1407. [Google Scholar] [CrossRef]
- Blecha, I.M.Z.; Siqueira, F.; Ferreira, A.B.R.; Feijó, G.L.D.; Torres Junior, R.A.A.; Medeiros, S.R.; Sousa, I.I.; Santiago, G.G.; Ferraz, A.L.J. Identification and evaluation of polymorphisms in FABP3 and FABP4 in beef cattle. Genet. Mol. Res. 2015, 14, 16353–16363. [Google Scholar] [CrossRef]
- Nafikov, R.A.; Schoonmaker, J.P.; Korn, K.T.; Noack, K.; Garrick, D.J.; Koehler, K.J.; Minick-Bormann, J.; Reecy, J.M.; Sputlock, D.E.; Beitz, D.C. Association of polymorphisms in solute carrier family 27, isoform A6 (SLC27A6) and fatty acid-binding protein-3 and fatty acid-binding protein-4 (FABP3 and FABP4) with fatty acid composition of bovine milk. J. Dairy Sci. 2013, 96, 6007–6021. [Google Scholar] [CrossRef]
- Oh, D.; Lee, Y.; La, B.; Yeo, E.; Kim, Y.; Lee, C. Fatty acid composition of beef is associated with exonic nucleotide variants of the gene encoding FASN. Mol. Biol. Rep. 2012, 39, 4083–4090. [Google Scholar] [CrossRef]
- Rincon, G.; Islas-Trejo, A.; Castillo, A.R.; Bauman, D.E.; German, B.J.; Medrano, J.F. Polymorphisms in genes in the SREBP1 signalling pathway and SCD are associated with milk fatty acid composition in Holstein cattle. J. Dairy Sci. 2012, 79, 66–75. [Google Scholar] [CrossRef] [PubMed]
- Gamarra, D.; Aldai, N.; Arakawwa, A.; Barron, L.J.R.; López-Oceja, A.; de Pancorbo, M.M.; Taniguchi, M. Distinct correlations between lipogenic gene expression and fatty acid composition of subcutaneous fat among cattle breeds. BMC Vet. Res. 2018, 14, 167. [Google Scholar] [CrossRef] [PubMed]
- Kučerová, J.; Matějíček, A.; Jandurová, O.M.; Sørensen, P.; Němcová, E.; Štípková, M.; Kott, T.; Bouška, J.; Frelich, J. Milk protein genes CSN1S1, CSN2, CSN3, LGB and their relation to genetic values of milk production parameters in Czech Fleckvieh. Czech J. Anim. Sci. 2006, 51, 241–247. [Google Scholar] [CrossRef]
- Caroli, A.M.; Chessa, S.; Erhardt, G.J. Invited review: Milk protein polymorphisms in cattle: Effect on animal breeding and human nutrition. J. Dairy Sci. 2009, 92, 5335–5352. [Google Scholar] [CrossRef] [PubMed]
- Martins, L.F.; Milazzotto, M.P.; Feitosa, W.B.; Coutinho, A.R.S.; Simoes, R.; Marques, M.G.; Assumpcao, M.E.O.A.; Visintin, J.A. Sequence variation of the alpha-lactalbumin gene in Holstein and Nellore cows. Anim. Biotechnol. 2008, 19, 194–198. [Google Scholar] [CrossRef]
- McClure, M.C.; McCarthy, J.; Flynn, P.; McClure, J.C.; Dair, E.; O’Connel, D.K.; Kearney, J.F. SNP Data Quality Control in a National Beef and Dairy Cattle System and Highly Accurate SNP Based Parentage Verification and Identification. Front Genet. 2018, 9, 84. [Google Scholar] [CrossRef]
- Sasaki, S.; Yoshinari, K.; Uchiyama, K.; Takeda, M.; Kojima, T. Relationship between call rate per individual and genotyping accuracy of bovine single-nucleotide polymorphism array using deoxyribonucleic acid of various qualities. J. Anim. Sci. 2018, 89, 1533–1539. [Google Scholar] [CrossRef]
- Kharzinova, V.; Sermyagin, A.A.; Gladyr, E.A.; Okhlopkov, I.M.; Brem, G.; Zinovieva, N.A. A Study of Applicability of SNP Chips Developed for Bovine and Ovine Species to Whole-Genome Analysis of Reindeer Rangifer tarandus. J. Hered. 2015, 106, 758–761. [Google Scholar]
- Moravčíková, N.; Kirchner, R.; Šidlová, V.; Kasarda, R.; Trakovická, A. Estimation of genomic variation in cervids using cross-species application of SNP arrays. Poljoprivreda 2015, 21, 33–36. [Google Scholar] [CrossRef]
- More, M.; Gutiérrez, G.; Rothschild, M.; Bertolini, F.; Abel Ponce de León, F. Evaluation of SNP genotyping in alpacas using the bovine HD genotyping beadchip. Front. Genet. 2019, 10, 361. [Google Scholar] [CrossRef]
- Matukumalli, L.K.; Lawley, C.T.; Schnabel, R.D.; Taylor, J.F.; Allan, M.F.; Heaton, M.P.; O’Connell, J.; Moore, S.S.; Smith, T.P.L.; Sonstegard, T.S.; et al. Development and characterisation of a high density SNP genotyping assay for cattle. PloS ONE 2009, 4, e5350. [Google Scholar] [CrossRef] [PubMed]
- Sermyagin, A.A.; Dotsev, A.V.; Gladyr, E.A.; Traspov, A.A.; Deniskova, T.E.; Kostyunina, O.V.; Reyer, H.; Wimmers, K.; Barbato, M.; Paronyan, I.A.; et al. Whole-genome SNP analysis elucidates the genetic structure of Russian cattle and its relationship with Eurasian taurine breeds. Genet. Sel. Evol. 2018, 50, 37. [Google Scholar] [CrossRef] [PubMed]
- Ilie, D.E.; Gao, Y.; Nicolae, I.; Dun, D.; Li, J.; Han, B.; Gavojdian, D. Evaluation of single nucleotide polymorphisms identified through the use of SNP assay in Romanian and Chinese Holstein and Simmental cattle breeds. Acta Biochim. Pol. 2020, 67, 341–346. [Google Scholar] [CrossRef] [PubMed]
- Makanjuola, B.O.; Miglior, F.; Abdalla, E.A.; Maltecca, C.; Schenkel, F.S.; Baes, C.F. Effect of genomic selection on rate of inbreeding and coancestry and effective population size of Holstein and Jersey cattle populations. J. Dairy Sci. 2020, 103, 5183–5199. [Google Scholar] [CrossRef] [PubMed]
- Mastrangelo, S.; Ciani, E.; Marsan, P.A.; Bagnato, A.; Battaglini, L.; Bozzi, R.; Carta, A.; Catillo, G.; Cassandro, M.; Casu, S.; et al. Conservation status and historical relatedness of Italian cattle breeds. Genet. Sel. Evol. 2018, 50, 35. [Google Scholar] [CrossRef]
- Kadlečík, O.; Hazuchová, E.; Moravčíková, N.; Kukučková, V.; Kasarda, R. Genetic Diversity in Slovak Spotted breed. AGROFOR Int. J. 2017, 2, 124–131. [Google Scholar] [CrossRef]
- Kadlečík, O.; Moravčíková, N.; Kukučková, V.; Kasarda, R. Inbreeding and Genetic Diversity Loss in Slovak Pinzgau Breed. Agric. Conspec. Sci. 2017, 82, 259–262. [Google Scholar]
- Zhang, Q.; Calus, M.P.L.; Guldbrandtsen, B.; Lund, M.S.; Sahana, G. Estimation of inbreeding using pedigree, 50k SNP chip genotypes and full sequence data in three cattle breeds. Bmc Genet. 2015, 16, 88. [Google Scholar] [CrossRef]
- Marras, G.; Gaspa, G.; Sorbolini, S.; Dimauro, C.; Ajmone-Marsan, P.; Valentini, A.; Williams, J.L.; Macciotta, N.P. Analysis of runs of homozygosity and their relationship with inbreeding in five cattle breeds farmed in Italy. Anim. Genet. 2017, 46, 110–121. [Google Scholar] [CrossRef]
- Jemaa, S.B.; Thamri, N.; Mnara, S.; Rebours, E.; Rocha, D.; Boussaha, M. Linkage disequilibrium and past effective population size in native Tunisian cattle. Genet. Mol. Biol. 2019, 42, 52–56. [Google Scholar] [CrossRef]
- Porto-Neto, L.R.; Lee, S.H.; Sonstegard, T.S.; Van Tassell, C.P.; Lee, H.K.; Gibson, J.P.; Gondro, C. Genome-wide detection of signatures of selection in Korean Hanwoo cattle. Anim. Genet. 2014, 2, 2–190. [Google Scholar] [CrossRef] [PubMed]
- Al-Mamun, H.A.; Clark, S.A.; Kwan, P.; Gondro, C. Genome-wide linkage disequilibrium and genetic diversity in five populations of Australian domestic sheep. Genet. Sel. Evol. 2015, 47, 90. [Google Scholar] [CrossRef] [PubMed]
- McEvoy, B.P.; Powell, J.E.; Goddard, M.E.; Visscher, P.M. Human population dispersal "Out of Africa" estimated from linkage disequilibrium and allele frequencies of SNPs. Genome Res. 2011, 21, 821–829. [Google Scholar] [CrossRef] [PubMed]
- Moravčíková, N.; Kasarda, R.; Vostrý, L.; Krupová, Z.; Krupa, E.; Lehocká, K.; Olšanská, B.; Trakovická, A.; Nádaský, R.; Židek, R.; et al. Analysis of selection signatures in the beef cattle genome. Czech J. Anim. Sci. 2019, 64, 491–503. [Google Scholar] [CrossRef]
- Jahuey-Martínez, F.J.; Parra-Bracamonte, G.M.; Sifuentes-Rincón, A.M.; Moreno-Medina, V.R. Signatures of selection in Charolais beef cattle identified by genome-wide analysis. J. Anim. Breed. Genet. 2019, 136, 378–389. [Google Scholar] [CrossRef]
- Paim, T.D.P.; Hay, E.H.A.; Wilson, C.; Thomas, M.G.; Kuehn, L.A.; Paiva, S.R.; McManus, C.; Blackburn, H. Genomic Breed Composition of Selection Signatures in Brangus Beef Cattle. Front. Genet. 2020, 11, 710. [Google Scholar] [CrossRef]
- Hayes, B.J.; Lien, S.; Nilsen, H.; Olsen, H.G.; Berg, P.; Maceachern, S.; Potter, S.; Meuwissen, T.H.E. The origin of selection signatures on bovine chromosome 6. Anim. Genet. 2008, 39, 105–111. [Google Scholar] [CrossRef]
- Naderi, S.; Moradi, M.H.; Farhadian, M.; Yin, T.; Jaeger, M.; Scheper, C.; Korkuc, P.; Brockmann, G.A.; König, S.; May, K. Assessing selection signatures within and between selected lines of dual-purpose black and white and German Holstein cattle. Anim. Genet. 2020, 51, 391–408. [Google Scholar] [CrossRef]


Publisher’s Note: MDPI stays neutral with regard to jurisdictional claims in published maps and institutional affiliations. |
© 2021 by the authors. Licensee MDPI, Basel, Switzerland. This article is an open access article distributed under the terms and conditions of the Creative Commons Attribution (CC BY) license (http://creativecommons.org/licenses/by/4.0/).