How Different Are the Nordics? Unravelling the Willingness to Make Economic Sacrifices for the Environment


Abstract
1. Introduction
- What is the distribution of the different respondent positions in the Nordic region for the three forms of willingness to make economic sacrifices, and what are the factors that predict these positions?
- Is the midpoint (neither–nor category) of the unwilling–willing scale a distinct ambivalent position towards willingness to make economic sacrifices? Are there differences between the significant factors influencing the two groups (“Fairly willing and Very willing”, “Neither willing nor unwilling”) that are not opposed to making sacrifices for the environment?
2. Materials and Methods
2.1. Sample
2.2. Variables
2.3. Model Specification and Tests
3. Results
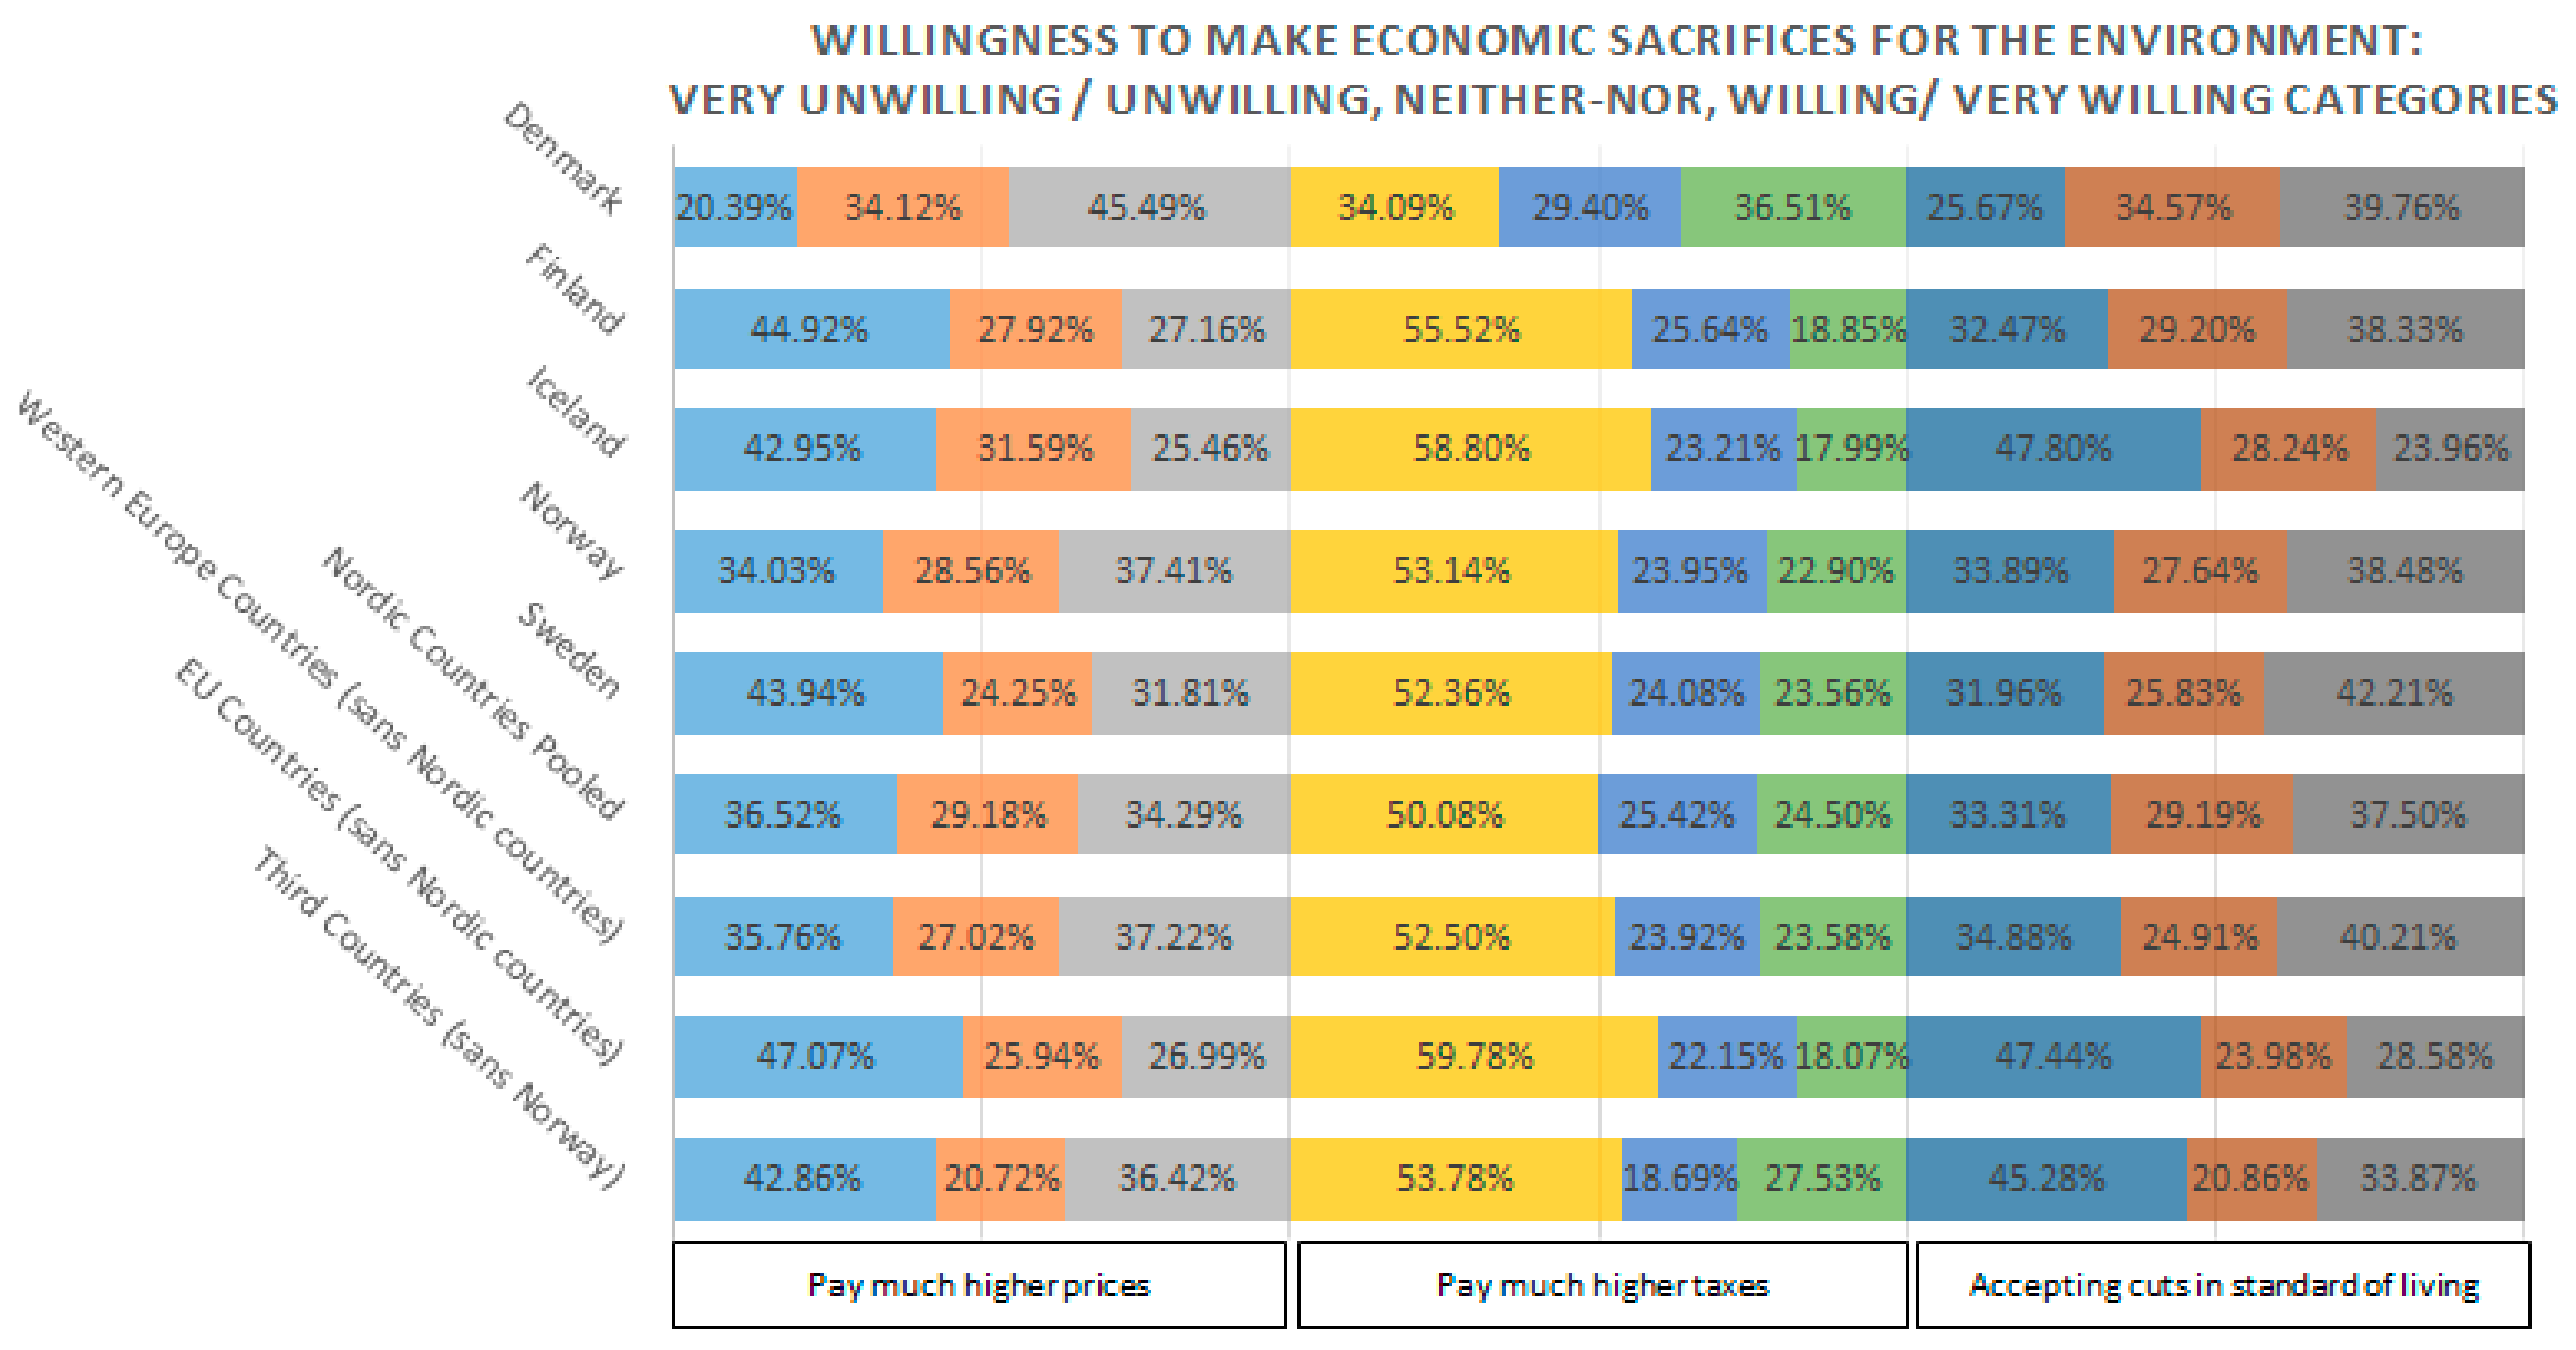
3.1. Distribution of Different Respondent Positions
3.2. Which Factors Predict Willingness to Make Economic Sacrifices for the Environment?
3.3. Differences Between Neither–Nor and the Two Asserted Positions of Unwilling and Willing to Make Economic Sacrifices
3.4. What Distinguishes the Willing and Unwilling in the Nordic Region?
3.5. What Distinguishes the Neither–Nors and the Unwilling?
4. Discussion
5. Conclusions
5.1. Policy Implications
5.2. Limitations
5.3. Further Research
Funding
Institutional Review Board Statement
Informed Consent Statement
Data Availability Statement
Acknowledgments
Conflicts of Interest
Appendix A

| N | Country Grouping | |||
|---|---|---|---|---|
| Nordic Countries | EU, EFTA Countries (Sans Nordic) | Third Countries | ||
| Argentina | 1130 | X | X | ✓ |
| Australia | 1946 | X | X | ✓ |
| Austria | 1019 | X | ✓ | X |
| Belgium | 1142 | X | ✓ | X |
| Bulgaria | 1003 | X | ✓ | X |
| Canada | 985 | X | X | ✓ |
| Chile | 1436 | X | X | ✓ |
| Taiwan | 2209 | X | X | ✓ |
| Croatia | 1210 | X | X | ✓ |
| Czech Republic | 1428 | X | ✓ | X |
| Denmark | 1305 | ✓ | X | X |
| Finland | 1211 | ✓ | X | X |
| France | 2253 | X | ✓ | X |
| Germany | 1407 | X | ✓ | X |
| Iceland | 798 | ✓ | X | X |
| Israel | 1216 | X | X | ✓ |
| Japan | 1307 | X | X | ✓ |
| Korea (South) | 1576 | X | X | ✓ |
| Latvia | 1000 | X | ✓ | X |
| Lithuania | 1023 | X | ✓ | X |
| Mexico | 1637 | X | X | ✓ |
| Netherlands | 1472 | X | ✓ | X |
| New Zealand | 1172 | X | X | ✓ |
| Norway | 1382 | ✓ | X | X |
| Philippines | 1200 | X | X | ✓ |
| Portugal | 1022 | X | ✓ | X |
| Russia | 1619 | X | X | ✓ |
| Slovakia | 1159 | X | ✓ | X |
| Slovenia | 1082 | X | ✓ | X |
| South Africa | 3112 | X | X | ✓ |
| Spain | 2560 | X | ✓ | X |
| Sweden | 1181 | ✓ | X | X |
| Switzerland | 1212 | X | X | ✓ |
| Turkey | 1665 | X | X | ✓ |
| United Kingdom | 928 | X | ✓ | X |
| United States | 1430 | X | X | ✓ |
| Total | 50,437 | 5877 | 18,498 | 26,062 |
| Pay Much Higher Prices | Pay Much Higher Taxes | Accept Cuts in Standard of Living | Environmental Concern | Public Behaviours | Consumer Behaviours | International Agreements | Future Energy | Environmental Concern as Operationalized by Franzen & Vogl 2013 | 2018 EPI | SGI 2019 Policy Performance | SSI 2016 Environmental Wellbeing | ||
|---|---|---|---|---|---|---|---|---|---|---|---|---|---|
| Pay much higher prices | Correlation Coefficient | 1.000 | 0.905 ** | 0.736 ** | −0.389 * | −0.574 ** | −0.576 ** | 0.040 | −0.512 ** | −0.833 ** | −0.457 ** | −0.354 | 0.446 ** |
| N | 36 | 36 | 36 | 36 | 36 | 36 | 36 | 36 | 33 | 36 | 31 | 36 | |
| Pay much higher taxes | Correlation Coefficient | 0.905 ** | 1.000 | 0.701 ** | −0.255 | −0.448 ** | −0.404 * | −0.046 | −0.339 * | −0.720 ** | −0.243 | −0.187 | 0.386 * |
| N | 36 | 36 | 36 | 36 | 36 | 36 | 36 | 36 | 33 | 36 | 31 | 36 | |
| Accept cuts in standard of living | Correlation Coefficient | 0.736 ** | 0.701 ** | 1.000 | −0.250 | −0.605 ** | -0.625 ** | 0.257 | −0.537 ** | −0.783 ** | −0.483 ** | −0.475 ** | 0.187 |
| N | 36 | 36 | 36 | 36 | 36 | 36 | 36 | 36 | 33 | 36 | 31 | 36 | |
| Environmental concern | Correlation Coefficient | −0.389 * | −0.255 | −0.250 | 1.000 | 0.135 | 0.443 ** | −0.043 | 0.291 | 0.374 * | 0.045 | −0.026 | −0.177 |
| N | 36 | 36 | 36 | 36 | 36 | 36 | 36 | 36 | 33 | 36 | 31 | 36 | |
| Public Behaviours | Correlation Coefficient | −0.574 ** | −0.448 ** | −0.605 ** | 0.135 | 1.000 | 0.639 ** | 0.038 | 0.373 * | 0.644 ** | 0.724 ** | 0.619 ** | −0.214 |
| N | 36 | 36 | 36 | 36 | 36 | 36 | 36 | 36 | 33 | 36 | 31 | 36 | |
| Consumer behaviours | Correlation Coefficient | −0.576 ** | −0.404 * | −0.625 ** | 0.443 ** | 0.639 ** | 1.000 | −0.343 * | 0.517 ** | 0.723 ** | 0.582 ** | 0.458 ** | −0.171 |
| N | 36 | 36 | 36 | 36 | 36 | 36 | 36 | 36 | 33 | 36 | 31 | 36 | |
| International agreements | Correlation Coefficient | 0.040 | −0.046 | 0.257 | −0.043 | 0.038 | −0.343 * | 1.000 | −0.196 | −0.289 | −0.246 | −0.169 | −0.082 |
| N | 36 | 36 | 36 | 36 | 36 | 36 | 36 | 36 | 33 | 36 | 31 | 36 | |
| Future energy | Correlation Coefficient | −0.512 ** | −0.339 * | −0.537 ** | 0.291 | 0.373 * | 0.517 ** | −0.196 | 1.000 | 0.696 ** | 0.531 ** | 0.395 * | 0.033 |
| N | 36 | 36 | 36 | 36 | 36 | 36 | 36 | 36 | 33 | 36 | 31 | 36 | |
| Environmental concern as operationalized by Franzen & Vogl 2013 | Correlation Coefficient | −0.833 ** | −0.720 ** | −0.783 ** | 0.374 * | 0.644 ** | 0.723 ** | −0.289 | 0.696 ** | 1.000 | 0.657 ** | 0.589 ** | −0.326 |
| N | 33 | 33 | 33 | 33 | 33 | 33 | 33 | 33 | 33 | 33 | 28 | 33 | |
| 2018 EPI | Correlation Coefficient | −0.457 ** | −0.243 | −0.483 ** | 0.045 | 0.724 ** | 0.582 ** | −0.246 | 0.531 ** | 0.657 ** | 1.000 | 0.748** | −0.081 |
| N | 36 | 36 | 36 | 36 | 36 | 36 | 36 | 36 | 33 | 36 | 31 | 36 | |
| SGI 2019 Policy Performance | Correlation Coefficient | −0.354 | −0.187 | −0.475 ** | −0.026 | 0.619 ** | 0.458 ** | −0.169 | 0.395 * | 0.589 ** | 0.748 ** | 1.000 | −0.112 |
| N | 31 | 31 | 31 | 31 | 31 | 31 | 31 | 31 | 28 | 31 | 31 | 31 | |
| SSI 2016 Environmental Wellbeing | Correlation Coefficient | 0.446 ** | 0.386 * | 0.187 | −0.177 | −0.214 | −0.171 | −0.082 | 0.033 | −0.326 | −0.081 | −0.112 | 1.000 |
| N | 36 | 36 | 36 | 36 | 36 | 36 | 36 | 36 | 33 | 36 | 31 | 36 | |
Appendix B. Further Information on Variables
- Trust in people (Social trust) and Trust in government (Institutional trust) is measured by two variables with a 5-point Likert type option for respondent’s sentiments pertaining to the statements “Generally speaking, would you say that most people can be trusted, or that you can’t be too careful in dealing with people” and “Most of the time we can trust people in government to do what is right” [38,41,49].
- Substantive ISSP variables that relates to environmental efficacy and skepticism had been incorporated for the analyses are measured with the agreement of respondents’ via a 5-point Likert type scale to statements such as: “It is just too difficult for someone like me to do much about the environment” (Perceived activity arena). Another statement is “I do what is right for the environment, even when it costs more money or takes more time” (Environmental efficacy)—which could be considered as an altruistic perspective (Reyes 2016, p.1597) and was also described as a “behavioral disposition to act in a value-rational manner” [33]. A variable (Importance of environmental protection) that could also be potentially linked with the concept of the pool of finite worries within the survey questions asks respondents whether there are “more important things to do than protect the environment” (Butkevičienė, 2017; Tam and Chan, 2018).
- For the item on Perceived dangers from environmental issues, A mean score is derived to measure dangers perceived by respondents from specific environmental problems such as “air pollution caused by cars”, “air pollution caused by industry”, “pesticides and chemicals used in farming“, “pollution of COUNTRY’S rivers, lakes and streams” and “the rise in the world temperature caused by climate change [64].
Appendix C. Additional Descriptives, Analyses of Differences and Similarities of Nordic Countries to Others
| Dependent Variables | Independent Variables | ||||||||||||||||
|---|---|---|---|---|---|---|---|---|---|---|---|---|---|---|---|---|---|
| Pay Much Higher Prices | Pay Much Higher Taxes | Accept Cuts in Standard of Living | Environmental Concern | Social Trust | Institutional Trust | Perceived Activity Arena | Environmental Efficacy | Importance of Environmental Protection | Modern Science | International Agreements | Future Energy (Solar, Wind, Water) | Postmaterialism | Public Behaviours | Perceived Dangers | Consumer Behaviours | ||
| % No | % Yes | ||||||||||||||||
| Denmark | 2.76 | 3.05 | 2.88 | 3.37 | 3.65 | 2.96 | 3.44 | 2.66 | 3.57 | 3.02 | 1.61 | 16.1 | 83.9 | 1.04 | 0.49 | 3.62 | 8.71 |
| Finland | 3.31 | 3.58 | 3.00 | 3.72 | 3.15 | 3.27 | 3.63 | 2.74 | 3.12 | 3.76 | 1.80 | 33.8 | 66.2 | 1.01 | 0.47 | 3.51 | 8.40 |
| Iceland | 3.29 | 3.67 | 3.39 | 3.41 | 3.54 | 3.51 | 3.69 | 2.71 | 3.08 | 3.33 | 2.25 | 14.6 | 85.4 | 0.62 | 0.45 | 3.44 | 6.58 |
| Norway | 3.04 | 3.51 | 3.01 | 3.43 | 3.75 | 2.88 | 3.55 | 2.81 | 3.43 | 3.14 | 1.88 | 15.5 | 84.5 | 0.86 | 0.46 | 3.32 | 7.07 |
| Sweden | 3.21 | 3.46 | 2.93 | 3.37 | 3.54 | 2.88 | 3.48 | 2.78 | 3.58 | 3.85 | 1.77 | 29.6 | 70.4 | 0.96 | 0.50 | 3.64 | 7.66 |
| Nordic countries | 3.10 | 3.44 | 3.01 | 3.46 | 3.53 | 3.06 | 3.55 | 2.74 | 3.38 | 3.41 | 1.83 | 22.0 | 78.0 | 0.92 | 0.48 | 3.51 | 7.76 |
| Western European countries (sans Nordic countries) | 3.08 | 3.53 | 3.04 | 3.69 | 2.90 | 3.28 | 3.32 | 2.59 | 3.41 | 3.40 | 1.71 | 21.8 | 78.2 | 0.88 | 0.56 | 3.65 | 9.45 |
| EU Countries (sans Nordic countries) | 3.39 | 3.71 | 3.38 | 3.61 | 2.61 | 3.55 | 3.12 | 2.70 | 3.09 | 3.29 | 1.72 | 28.7 | 71.3 | 0.80 | 0.37 | 3.80 | 7.90 |
| Third Countries | 3.24 | 3.51 | 3.31 | 3.67 | 2.55 | 3.29 | 3.08 | 2.67 | 2.98 | 3.05 | 1.92 | 35.4 | 64.6 | 0.75 | 0.30 | 3.95 | 6.87 |
| All (36) Country Samples | 3.26 | 3.57 | 3.28 | 3.63 | 2.70 | 3.34 | 3.16 | 2.68 | 3.08 | 3.20 | 1.83 | 30.7 | 69.3 | 0.79 | 0.36 | 3.84 | 7.42 |
References
- Sovacool, B.K. Contestation, contingency, and justice in the Nordic low-carbon energy transition. Energy Policy 2017, 102, 569–582. [Google Scholar] [CrossRef]
- European Commission. Nordic countries demonstrate the potential of low-carbon energy policies. Sci. Environ. Policy 2017, 2. [Google Scholar]
- Bird, T. Nordic Action on Climate Change; Nordic Council of Ministers: Copenhagen, Denmark, 2017; ISBN 9789289351829.
- Tunkrova, L. The Nordic Countries’ “Exceptionalism” in EU Environmental Policy. Contemp. Eur. Stud. 2008, 2, 21–46. [Google Scholar]
- Welsch, H.; Kühling, J. Pan-European patterns of environmental concern: The role of proximity and international integration. J. Environ. Stud. Sci. 2017, 7, 473–489. [Google Scholar] [CrossRef]
- Sääksjärvi, S.C. Positioning the Nordic Countries in European Union Environmental Policy. J. Environ. Dev. 2020, 29, 393–419. [Google Scholar] [CrossRef]
- Greaker, M.; Golombek, R.; Hoel, M. Global impact of national climate policy in the Nordic countries. Clim. Policies 2019, 157. [Google Scholar] [CrossRef]
- Vainio, A.; Paloniemi, R. The complex role of attitudes toward science in pro-environmental consumption in the Nordic countries. Ecol. Econ. 2014, 108, 18–27. [Google Scholar] [CrossRef]
- Franzen, A.; Vogl, D. Two decades of measuring environmental attitudes: A comparative analysis of 33 countries. Glob. Environ. Chang. 2013, 23, 1001–1008. [Google Scholar] [CrossRef]
- Andersson, D.; Nässén, J.; Larsson, J.; Holmberg, J. Greenhouse gas emissions and subjective well-being: An analysis of Swedish households. Ecol. Econ. 2014, 102, 75–82. [Google Scholar] [CrossRef]
- Marti, L.; Puertas, R. Assessment of sustainability using a synthetic index. Environ. Impact Assess. Rev. 2020, 84, 106375. [Google Scholar] [CrossRef]
- Naylor, M. How the Nordics are Standing up to Climate Change. Available online: https://stptrans.com/how-nordics-are-standing-up-to-climate-change/ (accessed on 17 November 2020).
- Bertelsmann Foundation Sustainable Governance Indicators. 2016 Global Environmental Protection Report Global Environmental Policy. Global Environmental Policy; Bertelsmann Stiftung: Gütersloh, Germany, 2016. [Google Scholar]
- Mayerl, J. Environmental Concern in Cross-National Comparison—Methodological Threats and Measurement Equivalence. In Green European: Environmental Behaviour and Attitudes in Europe in a Historical and Cross-Cultural Comparative Perspective; Telesiene, A., Gross, M., Eds.; Routledge: New York, NY, USA; Taylor & Francis: New York, NY, USA, 2017; ISBN 978-1138123953. [Google Scholar]
- Bertelsmann Foundation. Policy Performance and Governance Capacities in the OECD and EU. Sustainable Governance Indicators 2016; Bertelsmann Stiftung: Gütersloh, Germany, 2016. [Google Scholar]
- Hsu, A.; Esty, D.; Levy, M.; de Sherbinin, A.; Al, E. The 2016 Environmental Performance Index Report; Yale Center for Environmental Law and Policy: New Haven, CT, USA, 2016. [Google Scholar]
- Sustainable Society Foundation Sustainable Society Index; Sustainable Society Foundation: The Hague, The Netherlands, 2016.
- de las Heras-Rosas, C.J.; Herrera, J. Towards Sustainable Mobility through a Change in Values. Evidence in 12 European Countries. Sustainability 2019, 11, 4274. [Google Scholar] [CrossRef]
- Christiansen, P.M.; Lundqvist, L.J. Conclusions: A Nordic environmental policy model? In Governing the Environment: Politics, Policy and Organization in the Nordic Countries; Nord: Copenhagen, Denmark, 1996; Volume 5, pp. 339–363. ISBN 9291208191. [Google Scholar]
- Olofsson, A.; Öhman, S. General beliefs and environmental concern: Transatlantic comparisons. Environ. Behav. 2006, 38, 768–790. [Google Scholar] [CrossRef]
- Inglehart, R. Public Support for Environmental Protection: Objective Problems and Subjective Values in 43 Societies. PS Polit. Sci. Polit. 1995, 28, 57. [Google Scholar] [CrossRef]
- Telešiene, A.; Balžekiene, A. The influence of biographical situational factors upon environmental activist behaviour: Empirical evidence from CEE countries. Soc. Stud. Stud. 2015, 12, 159–178. [Google Scholar] [CrossRef]
- Willy, C.J. Among Wealthy Nations, Nordic Countries are Leading the Pack on Sustainable Development. Available online: https://blogs.worldbank.org/governance/among-wealthy-nations-nordic-countries-are-leading-pack-sustainable-development (accessed on 14 October 2020).
- Franzen, A.; Vogl, D. Acquiescence and the willingness to pay for environmental protection: A comparison of the ISSP, WVS, and EVS. Soc. Sci. Q. 2013, 94, 637–659. [Google Scholar] [CrossRef]
- Sonnenschein, J.; Mundaca, L. Is one carbon price enough? Assessing the effects of payment vehicle choice on willingness to pay in Sweden. Energy Res. Soc. Sci. 2019, 52, 30–40. [Google Scholar] [CrossRef]
- Lienhoop, N.; MacMillan, D. Valuing wilderness in Iceland: Estimation of WTA and WTP using the market stall approach to contingent valuation. Land Use Policy 2007, 24, 289–295. [Google Scholar] [CrossRef]
- Grimsrud, K.M.; Lindhjem, H.; Sem, I.V.; Rosendahl, K.E. Public acceptance and willingness to pay cost-effective taxes on red meat and city traffic in Norway. J. Environ. Econ. Policy 2020, 9, 251–268. [Google Scholar] [CrossRef]
- Christensen, T.; Pedersen, A.B.; Nielsen, H.O.; Mørkbak, M.R.; Hasler, B.; Denver, S. Determinants of farmers’ willingness to participate in subsidy schemes for pesticide-free buffer zones—A choice experiment study. Ecol. Econ. 2011, 70, 1558–1564. [Google Scholar] [CrossRef]
- Çarkoğlu, A.; Kentmen-Çin, Ç. Economic development, environmental justice, and pro-environmental behavior. Environ. Polit. 2015, 24, 575–597. [Google Scholar] [CrossRef]
- Davidovic, D.; Harring, N.; Jagers, S.C. The contingent effects of environmental concern and ideology: Institutional context and people’s willingness to pay environmental taxes. Environ. Polit. 2020, 29, 674–696. [Google Scholar] [CrossRef]
- Ivanova, G.; Tranter, B. Paying for Environmental Protection in a Cross-national Perspective. Aust. J. Polit. Sci. 2008, 43, 169–188. [Google Scholar] [CrossRef]
- Fairbrother, M. Trust and Public Support for Environmental Protection in Diverse National Contexts. Sociol. Sci. 2016, 3, 359–382. [Google Scholar] [CrossRef]
- Engel, U.; Pötschke, M. Willingness to pay for the environment: Social structure, value orientations and environmental behaviour in a multilevel perspective. Innov. Eur. J. Soc. Sci. Res. 1998, 11, 315–332. [Google Scholar] [CrossRef]
- Schumacher, I. How Beliefs Influence the Willingness to Contribute to Prevention Expenditure. Am. J. Agric. Econ. 2015, 97, 1417–1432. [Google Scholar] [CrossRef]
- Johnson, E.; Nemet, G.F. Willingness to Pay for Climate Policy: A Review of Estimates; La Follette School of Public Affairs, University of Wisconsin: Madison, WI, USA, 2010. [Google Scholar]
- Diederich, J.; Goeschl, T. Willingness to Pay for Voluntary Climate Action and Its Determinants: Field-Experimental Evidence. Environ. Resour. Econ. 2014, 57, 405–429. [Google Scholar] [CrossRef]
- Ryan, A.M.; Spash, C.L. Is WTP an attitudinal measure? Empirical analysis of the psychological explanation for contingent values. J. Econ. Psychol. 2011, 32, 674–687. [Google Scholar] [CrossRef]
- Jin, M.H.; Shriar, A.J. Linking Environmental Citizenship and Civic Engagement to Public Trust and Environmental Sacrifice in the Asian Context. Environ. Policy Gov. 2013, 23, 259–273. [Google Scholar] [CrossRef]
- Hao, F.; Song, L. Environmental Concern in China: A Multilevel Analysis. Chin. Sociol. Rev. 2020, 52, 1–26. [Google Scholar] [CrossRef]
- Domazet, M.; Marinović Jerolimov, D. Sustainability Perspectives from the European Semi-Periphery; Domazet, M., Marinović Jerolimov, D., Eds.; Institute for Social Research: Zagreb, Croatia, 2014; ISBN 9536218585. [Google Scholar]
- Harring, N. Understanding the Effects of Corruption and Political Trust on Willingness to Make Economic Sacrifices for Environmental Protection in a Cross-National Perspective. Soc. Sci. Q. 2013, 94, 660–671. [Google Scholar] [CrossRef]
- Kemmelmeier, M.; Król, G.; Kim, Y.H. Values, Economics, and Proenvironmental Attitudes in 22 Societies. Cross-Cult. Res. 2002, 36, 256–285. [Google Scholar] [CrossRef]
- Marbuah, G. Is willingness to contribute for environmental protection in Sweden affected by social capital? Environ. Econ. Policy Stud. 2019, 21, 451–475. [Google Scholar] [CrossRef]
- Pädam, S.; Bali Swain, R. Attitudes Towards Paying for Environmental Protection in the Baltic Sea Region. In Environmental Challenges in the Baltic Region; Springer International Publishing: Cham, Germany, 2017; pp. 201–220. [Google Scholar]
- Cho, B.; Moon, M.J. The determinants of citizens’ preference of policy instruments for environmental policy: Do social trust, government capacity, and state-society relations matter? Int. Rev. Public Adm. 2019, 24, 205–224. [Google Scholar] [CrossRef]
- Harring, N.; Jagers, S. Should We Trust in Values? Explaining Public Support for Pro-Environmental Taxes. Sustainability 2013, 5, 210–227. [Google Scholar] [CrossRef]
- Davidovic, D. Trust, Values and Quality of Government. Exploring Interactions Between Individual and Contextual Level Determinants of Environmental Tax Support; QOG Working Paper Series; The Quality of Government Institute: Gothenburg, Sweden, 2018.
- Harring, N. Reward or Punish? Understanding Preferences toward Economic or Regulatory Instruments in a Cross-National Perspective. Polit. Stud. 2016, 64, 573–592. [Google Scholar] [CrossRef]
- ISSP Research Group. International Social Survey Programme: Environment III—ISSP 2010. GESIS Data Archive, Cologne. ZA5500 Data File Version 3.0.0. 2019. Available online: https://dbk.gesis.org/dbksearch/sdesc2.asp?no=5500&db=e&doi=10.4232/1.13271 (accessed on 17 November 2020).
- Franzen, A.; Meyer, R. Environmental Attitudes in Cross-National Perspective: A Multilevel Analysis of the ISSP 1993 and 2000. Eur. Sociol. Rev. 2010, 26, 219–234. [Google Scholar] [CrossRef]
- Reyes, J.A.L. Cross-section analyses of attitudes towards science and nature from the International Social Survey Programme 1993, 2000, and 2010 surveys. Public Underst. Sci. 2015, 24, 338–357. [Google Scholar] [CrossRef]
- Hadler, M.; Haller, M. Global activism and nationally driven recycling: The influence of world society and national contexts on public and private environmental behavior. Int. Sociol. 2011, 26, 315–345. [Google Scholar] [CrossRef]
- Doyle, J. Institutionalized collective action and the relationship between beliefs about environmental problems and environmental actions: A cross-national analysis. Soc. Sci. Res. 2018, 75, 32–43. [Google Scholar] [CrossRef]
- Valarino, I.; Duvander, A.-Z.; Haas, L.; Neyer, G. Exploring Leave Policy Preferences: A Comparison of Austria, Sweden, Switzerland, and the United States. Soc. Polit. Int. Stud. Gender State Soc. 2018, 25, 118–147. [Google Scholar] [CrossRef]
- Chapman, J.; Parvazian, S.; Skinner, N. How do Australians rate as environmental citizens? An international comparative analysis of environmental concern and action. Australas. J. Environ. Manag. 2017, 24, 117–132. [Google Scholar] [CrossRef]
- Butkevičienė, E. Pro-environmental Behaviours and Activism in a Comparative European Perspective. Filos. Sociol. 2017, 119–127. [Google Scholar]
- Jin, M.H.; Shriar, A.J. Exploring the Relationship Between Social Capital and Individuals’ Policy Preferences for Environmental Protection: A Multinomial Logistic Regression Analysis. J. Environ. Policy Plan. 2013, 15, 427–446. [Google Scholar] [CrossRef]
- Motherway, B.; Kelly, M.; Faughnan, P.; Tovey, H. Trends in Irish Environmental Attitudes Between 1993 and 2002; University College Dublin: Dublin, Ireland, 2003. [Google Scholar]
- Reyes, J.A.L. Exploring relationships of environmental attitudes, behaviors, and sociodemographic indicators to aspects of discourses: Analyses of International Social Survey Programme data in the Philippines. Environ. Dev. Sustain. 2016, 18, 1575–1599. [Google Scholar] [CrossRef]
- Struwig, J. South Africans’ attitudes towards the environment. In South African Social Attitudes: 2nd Report: Reflections on the Age of Hope; Roberts, B., wa Kivilu, M., Davids, Y.D., Eds.; South African Social Attitudes Survey (SASAS); HSRC Press: Cape Town, South Africa, 2010; pp. 198–219. [Google Scholar]
- Tjernström, E.; Tietenberg, T. Do differences in attitudes explain differences in national climate change policies? Ecol. Econ. 2008, 65, 315–324. [Google Scholar] [CrossRef]
- Ivanova, G.; Tranter, B. Willingness to pay for ‘the Environment’ in cross-national perspective. In Proceedings of the Australasian Political Studies Association Conference, Adelaide, Australia, 29 September–1 October 2004; pp. 1–27. [Google Scholar]
- Pisano, I.; Lubell, M. Environmental Behavior in Cross-National Perspective. Environ. Behav. 2017, 49, 31–58. [Google Scholar] [CrossRef]
- Tam, K.-P.; Chan, H.-W. Generalized trust narrows the gap between environmental concern and pro-environmental behavior: Multilevel evidence. Glob. Environ. Chang. 2018, 48, 182–194. [Google Scholar] [CrossRef]
- Pielke, R., Jr. The Climate Fix: What Scientists and Politicians Won’t Tell You about Global Warming; Basic Books: New York, NY, USA, 2010; ISBN 0465022685. [Google Scholar]
- von Crettaz Roten, F.; Clémence, A.; Thevenet, A. Understanding Attitudes Toward Nuclear Energy After the Fukushima Accident: Differences Between Asserted and Ambivalent Positions*. Soc. Sci. Q. 2017, 98, 659–671. [Google Scholar] [CrossRef]
- Tabachnick, B.G.; Fidell, L.S. Using Multivariate Statistics; Allyn & Bacon: Boston, MA, USA, 2006. [Google Scholar]
- Field, A. Discovering Statistics Using SPSS; Sage Publications: London, UK, 2009. [Google Scholar]
- Anderson, C.J.; Rutkowski, L. Multinomial Logistic Regression. In Best Practices in Quantitative Methods; SAGE Publications, Inc.: Thousand Oaks, CA, USA, 2008; pp. 390–409. ISBN 9781412940658. [Google Scholar]
- Ambo, T.B.; Ma, J.; Fu, C. Investigating influence factors of traffic violation using multinomial logit method. Int. J. Inj. Contr. Saf. Promot. 2020, 1–8. [Google Scholar] [CrossRef]
- Dorsch, M. The Willingness to Pay for Environmental Protection: Are Developing Economies Different? In Proceedings of the German Development Economics Conference; BW—Deutsche Zentralbibliothek fürWirtschaftswissenschaften, Leibniz-Informationszentrum Wirtschaft, Kiel und Hamburg: Hamburg, Alemanha, 2011. [Google Scholar]
- Kollmann, A.; Reichl, J. How Trust in Governments Influences the Acceptance of Environmental Taxes. In Political Economy and Instruments of Environmental Politics; Schneider, F., Kollmann, A., Reichl, J., Eds.; The MIT Press: Cambridge, MA, USA, 2015; pp. 53–70. [Google Scholar]
- Tranter, B. The Great Divide: Political Candidate and Voter Polarisation over Global Warming in Australia. Aust. J. Polit. Hist. 2013, 59, 397–413. [Google Scholar] [CrossRef]
- Robinson, J.P.; Shaver, P.R.; Wrightsman, L.S. Criteria for scale selection and evaluation. Meas. Personal. Soc. Psychol. Attitudes 1991, 1, 1–16. [Google Scholar]
- Zellner, A. An Efficient Method of Estimating Seemingly Unrelated Regressions and Tests for Aggregation Bias. J. Am. Stat. Assoc. 1962, 57, 348–368. [Google Scholar] [CrossRef]
- Dirzyte, A.; Rakauskiene, O.G. Green consumption: The gap between attitudes and behaviours. Transform. Bus. Econ. 2016, 15, 523–538. [Google Scholar]
- Sussman, A.B.; Olivola, C.Y. Axe the Tax: Taxes are Disliked More than Equivalent Costs. J. Mark. Res. 2011, 48, S91–S101. [Google Scholar] [CrossRef]
- Liu, M.; Huang, Y.; Hiscock, R.; Li, Q.; Bi, J.; Kinney, P.; Sabel, C. Do Climate Change Policies Promote or Conflict with Subjective Wellbeing: A Case Study of Suzhou, China. Int. J. Environ. Res. Public Health 2016, 13, 344. [Google Scholar] [CrossRef] [PubMed]
- Kallbekken, S.; Kroll, S.; Cherry, T.L. Do you not like Pigou, or do you not understand him? Tax aversion and revenue recycling in the lab. J. Environ. Econ. Manag. 2011, 62, 53–64. [Google Scholar] [CrossRef]
- Smyth, G.K. Pearson’s goodness of fit statistic as a score test statistic. In Statistics and Science: A Festschrift for Terry Speed; Goldstein, D.R., Ed.; Institute of Mathematical Statistics: Beachwood, NJ, USA, 2003; pp. 115–126. [Google Scholar]
- Peuckert, J. Assessment of the social capabilities for catching-up through sustainability innovations. Int. J. Technol. Glob. 2011, 5, 190–211. [Google Scholar] [CrossRef]
- Cottrell, J. Reclaiming the ‘T’ word: Ways of improving communication and public acceptance of environmental fiscal reform in Europe. In Environmental Pricing; Kreiser, L., Andersen, M.S., Olsen, B.E., Speck, S., Milne, J.E., Ashiabor, H., Eds.; Edward Elgar Publishing: Cheltenham, UK, 2015; pp. 195–212. [Google Scholar]
- Böhringer, C.; Vogt, C. The dismantling of a breakthrough: The Kyoto Protocol as symbolic policy. Eur. J. Polit. Econ. 2004, 20, 597–617. [Google Scholar] [CrossRef]
- Prins, G.; Caine, M.E.; Akimoto, K.; Calmon, P.; Constable, J.; Deiaco, E.; Flack, M.; Galiana, I.; Grundmann, R.; Laird, F.; et al. The Vital Spark:Innovating Clean and Affordable Energy for All; LSE Academic Publishing: London, UK, 2013; ISBN 978-1-909890-01-5. [Google Scholar]
- O’Brien, L.V.; Meis, J.; Anderson, R.C.; Rizio, S.M.; Ambrose, M.; Bruce, G.; Critchley, C.R.; Dudgeon, P.; Newton, P.; Robins, G.; et al. Low Carbon Readiness Index: A short measure to predict private low carbon behaviour. J. Environ. Psychol. 2018, 57, 34–44. [Google Scholar] [CrossRef]
- Gough, I.; Meadowcroft, J. Decarbonizing the Welfare State; Oxford University Press: Oxford, UK, 2011; ISBN 9780191735271. [Google Scholar]
- O’Mahony, T.; Luukkanen, J. Exploring the Missing Dimensions of Transition through ‘Sustainable Wellbeing’. In Proceedings of the Futures of a Complex World; Futures Research Centre, Turku, Finland, 12–13 June 2017. [Google Scholar]
- Lindenberg, S.; Steg, L. Normative, gain and hedonic goal frames guiding environmental behavior. J. Soc. Issues 2007, 63, 117–137. [Google Scholar] [CrossRef]
- Steg, L.; Bolderdijk, J.W.; Keizer, K.; Perlaviciute, G. An Integrated Framework for Encouraging Pro-environmental Behaviour: The role of values, situational factors and goals. J. Environ. Psychol. 2014, 38, 104–115. [Google Scholar] [CrossRef]
- Mercure, J.-F.; Knobloch, F.; Pollitt, H.; Paroussos, L.; Scrieciu, S.S.; Lewney, R. Modelling innovation and the macroeconomics of low-carbon transitions: Theory, perspectives and practical use. Clim. Policy 2019, 19, 1019–1037. [Google Scholar] [CrossRef]
- Milfont, T.L. The effects of social desirability on self-reported environmental attitudes and ecological behaviour. Environmentalist 2009, 29, 263–269. [Google Scholar] [CrossRef]
- Sonnenschein, J.; Smedby, N. Designing air ticket taxes for climate change mitigation: Insights from a Swedish valuation study. Clim. Policy 2019, 19, 651–663. [Google Scholar] [CrossRef]
- Delhey, J.; Newton, K. Predicting cross-national levels of social trust: Global pattern or Nordic exceptionalism? Eur. Sociol. Rev. 2005, 21, 311–327. [Google Scholar] [CrossRef]
- Suárez-Varela, M.; Guardiola, J.; González-Gómez, F. Do Pro-environmental Behaviors and Awareness Contribute to Improve Subjective Well-being? Appl. Res. Qual. Life 2016, 11, 429–444. [Google Scholar] [CrossRef]
- Oh, C. Discursive Contestation on Technological Innovation and the Institutional Design of the UNFCCC in the New Climate Change Regime. New Polit. Econ. 2020, 25, 660–674. [Google Scholar] [CrossRef]
- Sauter, R.; Watson, J. Strategies for the deployment of micro-generation: Implications for social acceptance. Energy Policy 2007, 35, 2770–2779. [Google Scholar] [CrossRef]

| Main Variables | Measured by the Item | Coding | Reference to Studies |
|---|---|---|---|
| Dependent Variables | |||
| Pay much higher prices | How willing would you be to pay much higher prices in order to protect the environment? | 5 pt. scale: 1 (Very willing) to 5 (Very unwilling) | Fairbrother, 2016 [32]; Ivanova and Tranter, 2008 [31]; Marbuah, 2019 [43]; |
| Pay much higher taxes | And how willing would you be to pay much higher taxes in order to protect the environment? | 5 pt. scale: 1 (Very willing) to 5 (Very unwilling) | Davidovic, Harring, and Jagers, 2020 [30]; Fairbrother, 2016 [32]; Ivanova and Tranter, 2008 [31]; Marbuah, 2019 [43]; |
| Accept cuts in standard of living | And how willing would you be to accept cuts in your standard of living in order to protect the environment? | 5 pt. scale: 1 (Very willing) to 5 (Very unwilling) | Ivanova and Tranter, 2008 [31]; Marbuah, 2019 [43]; Pädam and Swain, 2017 [44]; |
| Independent Variables | |||
| Environmental concern | Generally speaking, how concerned are you about environmental issues? | 5 pt. scale: 1 (Not at all concerned) to 5 (Very concerned) | Butkevičienė, 2017 [56]; Cho and Moon, 2019 [45]; Domazet et al., 2014 [40]; Marbuah, 2019 [43]; Vainio and Paloniemi, 2014 [8] |
| Social trust | Generally speaking, would you say that most people can be trusted, or that you can’t be too careful in dealing with people? | 5 pt. scale: 1 (You can’t be too careful) to 5 Most people can be trusted) | Butkevičienė, 2017 [56]; Fairbrother, 2016 [32]; Marbuah, 2019 [43]; |
| Institutional trust | To what extent do you agree or disagree with the following statement: Most of the time we can trust people in government to do what is right | 5 pt. scale: 1 (Agree strongly) to 5 (Disagree strongly) | Butkevičienė, 2017 [56]; Jin and Shriar 2013 [38,57]; Marbuah, 2019 [43]; |
| Environmental efficacy | I do what is right for the environment, even when it costs more money or takes more time | 5 pt. scale: 1 (Agree strongly) to 5 (Disagree strongly) | Engel and Pötschke, 1998 [33]; Motherway et al. 2003 [58]; Reyes, 2016 [59] |
| Importance of environmental protection | There are more important things to do in life than protect the environment | 5 pt. scale: 1 (Agree strongly) to 5 (Disagree strongly) | Butkevičienė, 2017 [56]; Motherway et al. 2003 [58]; Struwig, 2010 [60] |
| International agreements | For environmental problems, there should be international agreements that [COUNTRY] and other countries should be made to follow | 5 pt. scale: 1 (Agree strongly) to 5 (Disagree strongly) | Çarkoğlu and Kentmen-Çin, 2015 [29]; Motherway et al., 2003 [58]; Reyes, 2016 [59]; Tjernström and Tietenberg 2008 [61] |
| Future energy | “Solar, Wind, Water” as the Respondent’s priority toward energy security in relation to the item “To which of the following should [COUNTRY] give priority in order to meet its future energy needs?” | 0 (No), 1 (Yes) | Tranter, 2013 [62] |
| Post-materialism | Number of postmaterialistic goals a country should have from a list of four: Maintain order in the nation (1) Give people more say in government decisions (2) Fight rising prices (3) Protect freedom of speech (4) | 0 (none), 1 (one), or 2 (two) | Franzen and Vogl, 2013 [9,24] |
| Public behaviors | Sum score from four (yes = 1 or no = 0) items: Member of any group whose main aim is to preserve or protect the environment (1) In the last five years,... signed a petition about an environmental issue (2) ... given money to an environmental group (3) ... taken part in a protest or demonstration (4) | 0 to 4 | Pisano and Lubell, 2017 [63]; Tam and Chan, 2018 [64]; Vainio and Paloniemi, 2014 [8] |
| Consumer Behaviors | Additive index from 6 items on how often (Never = 0 to Always = 3) respondents for environmental reasons: sort glass or tins or plastic or newspapers and so on for recycling (1) buy fruit and vegetables grown without pesticides or chemicals (2) cut back on driving a car (3) reduce the energy or fuel you use at home (4) choose to save or re-use water (5) avoid buying certain products (6) | 0 to 18 | Çarkoğlu and Kentmen-Çin, 2015 [29]; Pisano and Lubell, 2017 [63]; Tam and Chan, 2018 [64]; Vainio and Paloniemi, 2014 [8] |
| Pay Much Higher Prices | Pay Much Higher Taxes | Accept Cuts in Standard of Living | ||||||||
|---|---|---|---|---|---|---|---|---|---|---|
| Main Variables | Fairly Unwilling and Very Unwilling | Neither Willing Nor Unwilling | Fairly Willing and Very Willing | Fairly Unwilling and Very Unwilling | Neither Willing Nor Unwilling | Fairly Willing and Very Willing | Fairly Unwilling and Very Unwilling | Neither Willing Nor Unwilling | Fairly Willing and Very Willing | |
| Environmental Concern | 3.09 | 3.47 | 3.87 | 3.20 | 3.57 | 3.89 | 3.01 | 3.46 | 3.87 | |
| (1.05) | (0.92) | (0.91) | (1.04) | (0.89) | (0.92) | (1.04) | (0.89) | (0.91) | ||
| Social trust | 3.36 | 3.47 | 3.79 | 3.40 | 3.53 | 3.83 | 3.37 | 3.52 | 3.71 | |
| (1.23) | (1.21) | (1.20) | (1.24) | (1.21) | (1.19) | (1.25) | (1.19) | (1.22) | ||
| Institutional trust | 3.26 | 2.98 | 2.92 | 3.22 | 2.94 | 2.88 | 3.20 | 3.00 | 2.99 | |
| (1.03) | (0.94) | (1.01) | (1.02) | (0.92) | (1.01) | (1.03) | (0.97) | (1.01) | ||
| Perceived activity arena | 3.39 | 3.48 | 3.80 | 3.43 | 3.56 | 3.80 | 3.30 | 3.53 | 3.82 | |
| (1.07) | (1.03) | (1.03) | (1.07) | (1.00) | (1.07) | (1.09) | (0.97) | (1.03) | ||
| Environmental efficacy | 3.10 | 2.70 | 2.42 | 2.98 | 2.63 | 2.40 | 3.08 | 2.73 | 2.46 | |
| (0.88) | (0.75) | (0.82) | (0.89) | (0.75) | (0.82) | (0.90) | (0.76) | (0.83) | ||
| Importance of environmental protection | 3.09 | 3.40 | 3.66 | 3.17 | 3.51 | 3.67 | 3.01 | 3.42 | 3.67 | |
| (1.02) | (0.94) | (1.02) | (1.03) | (0.91) | (1.04) | (1.02) | (0.92) | (1.01) | ||
| Modern science | 3.37 | 3.35 | 3.52 | 3.35 | 3.43 | 3.54 | 3.23 | 3.36 | 3.63 | |
| (1.06) | (0.98) | (1.08) | (1.04) | (0.99) | (1.11) | (1.04) | (0.98) | (1.06) | ||
| International agreements | 2.02 | 1.85 | 1.60 | 1.98 | 1.81 | 1.54 | 2.03 | 1.85 | 1.63 | |
| (0.84) | (0.74) | (0.69) | (0.83) | (0.71) | (0.67) | (0.84) | (0.73) | (0.72) | ||
| Future energy (Solar, Wind, Water) | No | 27.86% | 20.89% | 17.81% | 26.92% | 18.31% | 16.73% | 28.71% | 20.11% | 18.02% |
| Yes | 72.14% | 79.11% | 82.19% | 73.08% | 81.69% | 83.27% | 71.29% | 79.89% | 81.98% | |
| Postmaterialism | 0.82 | 0.89 | 1.05 | 0.83 | 0.93 | 1.08 | 0.80 | 0.90 | 1.03 | |
| (0.58) | (0.57) | (0.57) | (0.58) | (0.57) | (0.57) | (0.58) | (0.56) | (0.58) | ||
| Public Behaviours | 0.29 | 0.39 | 0.77 | 0.31 | 0.47 | 0.85 | 0.27 | 0.38 | 0.76 | |
| (0.60) | (0.72) | (1.00) | (0.63) | (0.76) | (1.06) | (0.59) | (0.69) | (0.99) | ||
| Perceived dangers | 3.33 | 3.46 | 3.73 | 3.35 | 3.51 | 3.79 | 3.26 | 3.47 | 3.74 | |
| (0.67) | (0.62) | (0.61) | (0.65) | (0.62) | (0.60) | (0.67) | (0.61) | (0.60) | ||
| Consumer behaviours | 6.50 | 7.83 | 9.09 | 6.82 | 8.20 | 9.26 | 6.29 | 7.65 | 9.18 | |
| (3.26) | (3.00) | (3.11) | (3.27) | (2.93) | (3.15) | (3.25) | (2.91) | (3.07) | ||
| Sociodemographic Variables | ||||||||||
| Age | 45.19 | 49.55 | 47.91 | 46.26 | 49.87 | 47.12 | 46.00 | 48.29 | 48.03 | |
| (16.48) | (16.32) | (16.22) | (16.66) | (16.16) | (15.94) | (17.11) | (15.85) | (16.09) | ||
| Top-Bottom self-placement | 5.77 | 5.91 | 6.30 | 5.87 | 6.01 | 6.23 | 5.86 | 6.01 | 6.11 | |
| (1.70) | (1.53) | (1.54) | (1.68) | (1.47) | (1.58) | (1.71) | (1.53) | (1.57) | ||
| Place of living: urban-rural | 2.81 | 2.82 | 2.64 | 2.81 | 2.82 | 2.58 | 2.75 | 2.79 | 2.73 | |
| (1.28) | (1.27) | (1.34) | (1.30) | (1.27) | (1.31) | (1.28) | (1.29) | (1.32) | ||
| Gender | Male | 50.61% | 46.24% | 44.14% | 51.03% | 41.72% | 44.27% | 54.25% | 45.19% | 42.48% |
| Female | 49.39% | 53.76% | 55.86% | 48.97% | 58.28% | 55.73% | 45.75% | 54.81% | 57.52% | |
| Education | Intermediate secondary completed (qualifications above the lowest qualification) | 19.2% | 15.6% | 12.5% | 18.2% | 15.9% | 11.0% | 18.4% | 15.7% | 13.5% |
| Higher secondary completed (usual entry requirements for universities) | 26.6% | 27.1% | 20.0% | 26.7% | 25.0% | 19.5% | 25.2% | 26.3% | 22.3% | |
| University degree incomplete (qualifications above higher secondary level) | 19.0% | 22.4% | 23.6% | 19.1% | 23.0% | 25.0% | 18.5% | 22.3% | 23.5% | |
| University degree completed, BG: lower tertiary level, upper tertiary level | 22.5% | 22.4% | 34.5% | 23.4% | 23.8% | 36.0% | 23.8% | 23.7% | 31.6% | |
| No formal qualification, Lowest formal qualification | 12.6% | 12.5% | 9.4% | 12.5% | 12.4% | 8.5% | 14.1% | 11.9% | 9.1% | |
| Party Affiliation | Far left (communist etc.) | 2.8% | 5.4% | 9.6% | 2.4% | 5.8% | 12.9% | 2.7% | 5.0% | 9.4% |
| Left, center left | 24.1% | 27.5% | 33.0% | 23.0% | 30.5% | 36.5% | 21.6% | 30.1% | 32.5% | |
| Center, liberal | 11.8% | 13.1% | 14.3% | 12.0% | 14.3% | 13.6% | 11.0% | 13.2% | 14.8% | |
| Right, conservative | 31.2% | 29.2% | 22.1% | 33.4% | 26.4% | 16.6% | 34.7% | 27.7% | 21.0% | |
| Far right (fascist etc.) | 3.5% | 3.1% | 2.5% | 3.3% | 2.6% | 3.0% | 3.8% | 2.7% | 2.6% | |
| No party affiliation and other | 26.7% | 21.7% | 18.5% | 25.9% | 20.4% | 17.3% | 26.1% | 21.4% | 19.7% | |
| Pay Much Higher Prices | Pay Much Higher Taxes | Accept Cuts in Standard of Living | |||||||
|---|---|---|---|---|---|---|---|---|---|
| Chi-Square | df | p | Chi-Square | df | p | Chi-Square | df | p | |
| Environmental concern | 73.307 | 2 | 0.000 | 58.972 | 2 | 0.000 | 76.605 | 2 | 0.000 |
| Social trust | 8.069 | 2 | 0.018 | n.s. | 7.800 | 2 | 0.020 | ||
| Institutional trust | 32.657 | 2 | 0.000 | 80.706 | 2 | 0.000 | 15.738 | 2 | 0.000 |
| Perceived activity arena | n.s. | n.s. | 28.573 | 2 | 0.000 | ||||
| Environmental efficacy | 66.135 | 2 | 0.000 | 37.444 | 2 | 0.000 | 38.427 | 2 | 0.000 |
| Importance of environmental protection | 14.599 | 2 | 0.001 | 6.137 | 2 | 0.046 | 31.830 | 2 | 0.000 |
| International agreements | 15.145 | 2 | 0.001 | 21.899 | 2 | 0.000 | − | − | n.s. |
| Modern science | − | − | n.s. | − | − | n.s. | 14.684 | 2 | 0.001 |
| Postmaterialism | 20.288 | 2 | 0.000 | 25.827 | 2 | 0.000 | 23.116 | 2 | 0.000 |
| Public behaviours | 22.926 | 2 | 0.000 | 14.269 | 2 | 0.001 | 22.092 | 2 | 0.000 |
| Perceived dangers | 13.018 | 2 | 0.001 | 17.851 | 2 | 0.000 | 27.960 | 2 | 0.000 |
| Age | 10.176 | 2 | 0.006 | 20.135 | 2 | 0.000 | − | − | n.s. |
| Education | 20.919 | 8 | 0.007 | − | − | n.s. | − | − | n.s. |
| Top-Bottom self-placement | 40.641 | 2 | 0.000 | 9.523 | 2 | 0.009 | − | − | n.s. |
| Political affiliation | 18.361 | 10 | 0.049 | 112.479 | 10 | 0.000 | 28.142 | 10 | 0.002 |
| Consumer behaviours | 34.001 | 2 | 0.000 | 27.202 | 2 | 0.000 | 48.055 | 2 | 0.000 |
| Future energy | − | − | n.s. | − | − | n.s. | 6.228 | 2 | 0.044 |
| Gender | − | − | n.s. | 8.490 | 2 | 0.014 | − | − | n.s. |
| Country | 105.310 | 8 | 0.000 | 62.234 | 8 | 0.000 | 34.779 | 8 | 0.000 |
| Willingness to Pay Higher Prices | Willingness to Pay Higher Taxes | Willingness to Accept Cuts to Standard of Living | ||||||||||||||||
|---|---|---|---|---|---|---|---|---|---|---|---|---|---|---|---|---|---|---|
| Neither willing nor unwilling vs. Fairly unwilling and Very unwilling | Fairly Willing and Very Willing vs. Fairly unwilling and Very unwilling | Neither willing nor unwilling vs. Fairly unwilling and Very unwilling | Fairly Willing and Very Willing vs. Fairly unwilling and Very unwilling | Neither willing nor unwilling vs. Fairly unwilling and Very unwilling | Fairly Willing and Very Willing vs. Fairly unwilling and Very unwilling | |||||||||||||
| B | Std. Error | Exp(B) | B | Std. Error | Exp(B) | B | Std. Error | Exp(B) | B | Std. Error | Exp(B) | B | Std. Error | Exp(B) | B | Std. Error | Exp(B) | |
| Environmental concern | 0.235 *** | (0.061) | 1.265 | 0.559 *** | (0.067) | 1.748 | 0.281 *** | (0.062) | 1.325 | 0.497 *** | (0.068) | 1.643 | 0.295 *** | (0.063) | 1.342 | 0.581 *** | (0.068) | 1.787 |
| Social trust | −0.031 | (0.045) | 0.970 | 0.096 * | (0.048) | 1.101 | 0.024 | (0.046) | 1.025 | 0.123 * | (0.048) | 1.131 | ||||||
| Institutional trust | 0.277 *** | (0.055) | 0.758 | −0.279 *** | (0.057) | 0.757 | −0.348 *** | (0.054) | 0.706 | −0.462 *** | (0.057) | 0.630 | −0.203 *** | (0.056) | 0.816 | −0.195 *** | (0.058) | 0.822 |
| Perceived activity arena | 0.098 | (0.054) | 1.104 | 0.296 *** | (0.057) | 1.345 | ||||||||||||
| Environmental efficacy | −0.357 *** | (0.068) | 0.700 | −0.574 *** | (0.073) | 0.563 | −0.279 *** | (0.068) | 0.757 | −0.418 *** | (0.073) | 0.659 | −0.290 *** | (0.068) | 0.749 | −0.438 *** | (0.072) | 0.645 |
| Importance of environmental protection | 0.156 ** | (0.057) | 1.169 | 0.219 *** | (0.059) | 1.245 | 0.129 * | (0.056) | 1.138 | 0.102 | (0.058) | 1.108 | 0.281 *** | (0.058) | 1.324 | 0.308 *** | (0.060) | 1.361 |
| International agreements | 0.000 | (0.072) | 1.000 | −0.267 *** | (0.080) | 0.766 | −0.065 | (0.072) | 0.937 | −0.370 *** | (0.082) | 0.691 | ||||||
| Modern science | 0.119 * | (0.055) | 1.127 | 0.220 *** | (0.057) | 1.246 | ||||||||||||
| Postmaterialism | 0.141 | (0.096) | 1.151 | 0.439 *** | (0.100) | 1.551 | 0.147 | (0.094) | 1.158 | 0.501 *** | (0.100) | 1.650 | 0.131 | (0.099) | 1.139 | 0.465 *** | (0.103) | 1.592 |
| Public behaviours | 0.110 | (0.078) | 1.117 | 0.326 *** | (0.075) | 1.386 | 0.097 | (0.069) | 1.102 | 0.245 *** | (0.066) | 1.278 | 0.158 | (0.083) | 1.171 | 0.346 *** | (0.080) | 1.413 |
| Perceived dangers | 0.079 | (0.094) | 1.082 | 0.340 *** | (0.099) | 1.406 | −0.026 | (0.093) | 0.975 | 0.372 *** | (0.100) | 1.450 | 0.112 | (0.094) | 1.118 | 0.482 *** | (0.098) | 1.619 |
| Future energy a | −0.273 * | (0.126) | 0.761 | −0.289 * | (0.132) | 0.749 | ||||||||||||
| Gender b | −0.224 * | (0.103) | 0.799 | 0.091 | (0.109) | 1.096 | ||||||||||||
| Consumer behaviours | 0.067 *** | (0.019) | 1.070 | 0.116 *** | (0.020) | 1.123 | 0.043 * | (0.019) | 1.044 | 0.105 *** | (0.020) | 1.110 | 0.038 | (0.020) | 1.038 | 0.134 *** | (0.020) | 1.143 |
| Age | 0.010 ** | (0.004) | 1.010 | 0.001 | (0.004) | 1.001 | 0.011 ** | (0.004) | 1.011 | −0.006 | (0.004) | 0.995 | ||||||
| Education c Intermediate secondary completed | 0.133 | (0.221) | 1.142 | −0.321 | (0.236) | 0.725 | ||||||||||||
| Higher secondary completed | 0.193 | (0.213) | 1.213 | −0.451 * | (0.226) | 0.637 | − | − | − | − | − | − | − | − | − | − | − | |
| University degree incomplete | −0.081 | (0.223) | 0.922 | −0.536 * | (0.232) | 0.585 | − | − | − | − | − | − | − | − | − | − | − | |
| University degree completed | 0.125 | (0.220) | 1.133 | −0.058 | (0.224) | 0.943 | − | − | − | − | − | − | − | − | − | − | − | |
| Top-Bottom self-placement | 0.039 | (0.036) | 1.039 | 0.228 *** | (0.039) | 1.256 | 0.011 | (0.034) | 1.011 | 0.106 ** | (0.036) | 1.112 | − | − | − | − | − | |
| Political affiliation d Far left (communist etc.) | 0.259 | (0.327) | 1.295 | 0.037 | (0.326) | 1.038 | 1.259 *** | (0.317) | 3.523 | 1.049 ** | (0.321) | 2.856 | 0.389 | (0.351) | 1.475 | 0.523 | (0.349) | 1.687 |
| Left, center left | 0.023 | (0.187) | 1.023 | −0.209 | (0.198) | 0.811 | 0.523 ** | (0.186) | 1.687 | 0.422 * | (0.199) | 1.525 | 0.186 | (0.193) | 1.204 | −0.083 | (0.200) | 0.921 |
| Center, liberal | 0.264 | (0.203) | 1.302 | 0.013 | (0.219) | 1.013 | 0.608 ** | (0.199) | 1.836 | 0.365 | (0.219) | 1.441 | 0.169 | (0.211) | 1.184 | 0.213 | (0.217) | 1.237 |
| Right, conservative | −0.015 | (0.181) | 0.986 | −0.489 * | (0.198) | 0.613 | −0.145 | (0.186) | 0.865 | −0.752 *** | (0.209) | 0.472 | −0.194 | (0.186) | 0.823 | −0.419 * | (0.196) | 0.658 |
| Far right (fascist etc.) | −0.195 | (0.328) | 0.823 | −0.827 * | (0.356) | 0.438 | −0.111 | (0.331) | 0.895 | −0.437 | (0.339) | 0.646 | −0.445 | (0.336) | 0.641 | −0.377 | (0.349) | 0.686 |
| Country e Finland | −0.957 *** | (0.194) | 0.384 | −1.587 *** | (0.207) | 0.204 | −0.420 * | (0.184) | 0.657 | −1.225 *** | (0.202) | 0.294 | −0.447 * | (0.202) | 0.640 | −0.410 | (0.214) | 0.664 |
| Iceland | −0.332 | (0.241) | 0.717 | −0.954 *** | (0.263) | 0.385 | −0.160 | (0.229) | 0.852 | −0.548 * | (0.251) | 0.578 | −0.752 ** | (0.232) | 0.471 | −0.714 ** | (0.250) | 0.490 |
| Norway | −0.474 ** | (0.177) | 0.623 | −0.438 * | (0.183) | 0.645 | −0.657 *** | (0.163) | 0.519 | −0.734 *** | (0.169) | 0.480 | −0.490 ** | (0.166) | 0.613 | −0.018 | (0.177) | 0.982 |
| Sweden | −1.076 *** | (0.181) | 0.341 | −1.205 *** | (0.186) | 0.300 | −0.577 *** | (0.160) | 0.562 | −0.915 *** | (0.167) | 0.400 | −0.598 *** | (0.177) | 0.550 | 0.009 | (0.183) | 1.009 |
| Intercept | −0.753 | (0.661) | −2.985 *** | (0.706) | −0.941 | (0.618) | −2.204 ** | (0.670) | −1.658 ** | (0.564) | −6.261 *** | (0.613) | ||||||
| Cox & Snell R2 | 0.318 | 0.296 | 0.321 | |||||||||||||||
| Nagelkerke R2 | 0.358 | 0.338 | 0.362 | |||||||||||||||
| N | 2891 | 2899 | 2889 | |||||||||||||||
Publisher’s Note: MDPI stays neutral with regard to jurisdictional claims in published maps and institutional affiliations. |
© 2021 by the author. Licensee MDPI, Basel, Switzerland. This article is an open access article distributed under the terms and conditions of the Creative Commons Attribution (CC BY) license (http://creativecommons.org/licenses/by/4.0/).
Share and Cite
Reyes, J.A.L. How Different Are the Nordics? Unravelling the Willingness to Make Economic Sacrifices for the Environment. Sustainability 2021, 13, 1294. https://doi.org/10.3390/su13031294
Reyes JAL. How Different Are the Nordics? Unravelling the Willingness to Make Economic Sacrifices for the Environment. Sustainability. 2021; 13(3):1294. https://doi.org/10.3390/su13031294
Chicago/Turabian StyleReyes, Joseph Anthony L. 2021. "How Different Are the Nordics? Unravelling the Willingness to Make Economic Sacrifices for the Environment" Sustainability 13, no. 3: 1294. https://doi.org/10.3390/su13031294
APA StyleReyes, J. A. L. (2021). How Different Are the Nordics? Unravelling the Willingness to Make Economic Sacrifices for the Environment. Sustainability, 13(3), 1294. https://doi.org/10.3390/su13031294