Abstract
Enhancing rural resilience plays an important role in sustaining rural development when certain rural communities’ decline becomes an inevitable process in the world. The paper evaluates China’s rural resilience and investigates the spatio-temporal differences of rural resilience across the country in the period 2000–2018. Theoretical analysis indicates that rural resilience determines how and to what extent rural communities interact with external challenges. Empirical analysis shows a slight increasing tendency of China’s rural resilience that remains below the median level. Rural resilience in Eastern China, which has a developed economy, is higher than that in Central and Western China. Compared with social resilience and engineering resilience, economic resilience is found to be the key restriction factor to China’s rural resilience in the research period. This is mainly attributed to rural laborers’ outflow to cities. The same findings are also seen in China’s three regions. Policy implication emphasizes the importance of prioritizing rural economic growth to realize China’s rural revitalization strategy.
1. Introduction
As human society has moved to the third decade of the 21st century, the trend of urban domination has become intensified across the world. The World Bank data show a total growth of 1.34 billion in the urban population in the period 2000–2018, and the proportion of the population in urban agglomerations of more than 1 million people reached 24.01% in 2018 (https://data.worldbank.org/indicator/EN.URB.MCTY.TL.ZS). As cities grow bigger, concerns have emerged about the outmigration-induced risks in rural areas such as local market shrinkage, labor shortage, rural brain drain, left-behind population caring, and rural hollowing-out problem [1,2,3,4,5]. All these risks and challenges finally turned into a global phenomenon named rural decline which has been seen in both developed and developing countries [6]. Driven by the urban–rural differences in terms of living standards, rural outmigration continues, and the downward spiral of life quality occurs in the countryside. Furthermore, policy making, which intentionally favors cities, has distorted urban–rural relationship and aggravated rural decline in the long run. Cases are seen in countries such as the USA, Canada, Australia, China and many developing countries [1,7,8,9].
As a response to the phenomenon of rural decline across the world, the study of rural resilience has become popular in recent decades. Instead of viewing rural communities’ being affected and passively reacting to unmanageable external forces and shocks, the theory of rural resilience considers rural communities as active and dynamic objects which have the ability to maintain or update their functions and sustain a satisfactory standard of people’s livelihood by way of making adaptive changes to the new circumstances [10,11,12,13,14,15]. Having reduced resilience will cause rural malfunction and instability, and rural communities will decline or even vanish without in-time and adaptive responses to external shocks.
Rural evolution occurs as rural communities interact with the external system such as urbanization, economic crisis and competition, climate change, and natural hazards, etc. In this process, certain communities, especially traditional agriculture- and natural resource-based communities, tend to decline or even vanish when they fail to make adaptive response to external shocks. As a result, those villages which are outside the positive economic influence of big city-regions will probably suffer the impacts such as rural labor shortage, local industrial recession, and the brain-drain problem [16]. There are also cases that rural communities survived external challenges because of their functions of being tourism sites, local trade centers, retirement and recreation destinations, and because of people’s bottom-up initiatives to revitalize their home villages. Rural communities of this type can develop a growing pattern which helps to maintain rural vitality and wellbeing [5,17].
Being the world’s largest developing countries, China has experienced a shift from a centrally-planned economy to a market-oriented economy since 1949. China’s rural development has been subordinated to such intense socioeconomic transformation during which the long-lasting urban-biased policy had once put rural areas in a place where materials, capital, and laborers were directed to support cities and heavy industries [9]. As a result, rural areas had severely lagged behind cities in various aspects such as the economy, income, education, and medical services, etc. The beginning of the 21st century has seen a shift from urban-biased circumstances to the complete support of agriculture, villages, and peasants. Such shift was followed by a series of rural-favoring policies named “No. 1 Central Document” issued by China’s central government since 2004. Owing to the large territory and socioeconomic differences across regions, rural areas in China’s eastern, central, and western parts have responded differently to China’s economic growth and its rapid urbanization development. Thus, both prosperous and declining rural communities coexist in China. In 2017, the Chinese central government initiated rural revitalization strategy which covers the period until 2050. With the purpose of revitalizing rural communities and helping them to survive external shocks, this strategy will for sure increase rural resilience in the long run.
How has China’s rural resilience evolved? What are the spatio-temporal differences in rural resilience across China? What are the restrictions to rural resilience? Bearing these questions in mind, the paper aims to evaluate China’s rural resilience and investigate its spatio-temporal evolution in the period 2000–2018 and to detect the key restriction factors to rural resilience. The research findings of the paper are expected to generate implications for policy making to support China’s rural revitalization strategy.
2. Rural Resilience and Sustainability: A Starting Point
Generally, a rural community consists of both “material” elements such as resource endowments, geographical location, and space, and the “immaterial” elements such as rural values, people’s attitudes, norms, and social networks [10]. These two types of elements form the natural capital, production capital, human capital, and social capital of rural communities and lay a solid foundation for rural resilience. The concept of resilience was originally introduced in ecology: “the capacity of a system to absorb disturbance, undergo changes, and retain the same essential function, structure, identity, and feedbacks” [18]. Being a cornerstone of sustainability, the notion of resilience was then widely applied in the socioeconomic contexts and indicated the ability of a system to absorb impacts/disturbance and to reorganise itself into a fully functioning system, as well as adopt post-event adaptive processes [8].
Rural resilience is a comprehensive concept and consists of economic resilience, social resilience, ecological resilience, and engineering resilience. According to Rose and Lim [19], economic resilience indicates communities’ ability to resist external shocks such as economic crises and price fluctuation in order to avoid possible economic loss. Social resilience is communities’ ability to deal with pressures from social and political changes, disasters, and conflicts while maintaining their normal functions [20]. As Holling [18] explained, ecological resilience is the ability for a community to return to the original state of its ecosystem while keeping its internal structure and function unchanged. Engineering resilience indicates communities’ ability to resist the impact of disasters and recover after disasters [21]. Rural communities present different resiliencies when facing different external shocks and challenges. Drastic shocks such as earthquakes and floods exceed the rural resilience threshold and destroy the rural economy and infrastructure in a short time and exert a huge impact on the rural society in the long run. However, there are mild pressures such as aging and climate change which are progressively influencing rural communities which have time to respond and become adapted to the new environment.
Resilience starts to act when there are external shocks and challenges working on rural communities. This process can be depicted with the Pressure-State-Response (PSR) model (Figure 1). “Pressure” indicates communities’ exposure to shocks which consist of both quick and fierce shocks such as earthquakes and floods and moderate shocks such as depopulation, aging, and climate change, etc. [22]. Before the shocks occur, a rural community stays in a certain “state” where we see how its socioeconomic and ecological subsystems are maintained under stable and balanced conditions. The natural capital, production capital, human capital, and social capital of a certain community constitute its “state” and robustness to external shocks [23,24]. Rural communities’ “response” is seen during and after the shocks. During the shock-influential period, rural communities resist and buffer systemic shocks to minimize loss while conserving existing functions and element structure. After that, rural communities do whatever they can to quickly recover from shocks and learn to adapt to the new environment through renewal, reorganization, and self-learning within the current regime. Then, rural communities realize transformation to create a whole new trajectory that is rooted in a radical change in the very nature of the system [25,26].
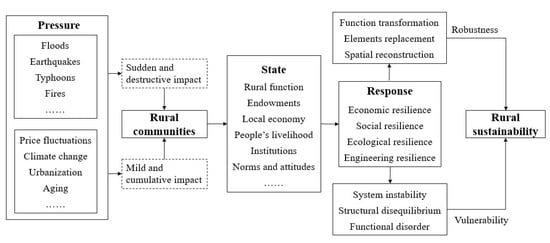
Figure 1.
The logic of rural resilience and sustainability.
As Walker and Salt (2006) indicated, the key to sustainability lies in enhancing the resilience of the system to prevent unwelcome challenges in the face of changing external circumstances and getting adapted to the new environment. As for rural sustainability, it depends on many facets including the economy, population, social networks, spatial factors, and agriculture, etc. [27,28]. However, it is rural resilience that determines how rural communities respond to external shocks and explains why some rural areas decline while others do not [10]. As Figure 1 shows, different rural reactions will lead to either increased robustness or vulnerability to rural sustainability. Thus, it is important to enhance the resilience of rural communities to maintain a satisfactory standard of livelihood and achieve rural sustainability.
3. Research Methodology and Results
3.1. Rural Resilience Evaluation Approach
There are 23 provinces, five autonomous regions and four centrally-directed cities (Beijing, Tianjin, Shanghai, and Chongqing) in mainland China beside Taiwan, Hong Kong, and Macau (Figure 2). These administrative units are grouped into eastern, central, and western regions. There are around 2.4 million villages in China with a great variety of resource endowments, economy, and people’s livelihood. Thus, it is difficult to showcase a general picture of China’s rural resilience by selecting sufficient samples across its large territory.
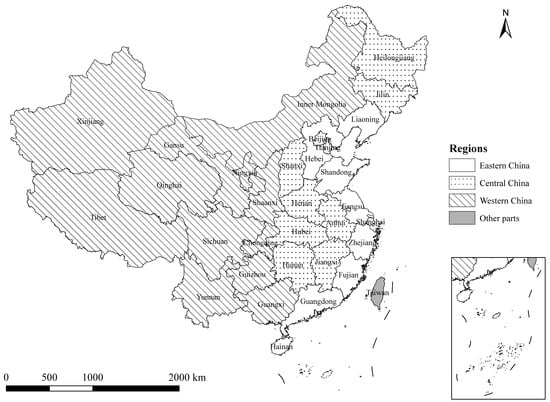
Figure 2.
The administrative units in China.
According to Section 2, the paper introduces the “Pressure-State-Response” model and evaluates rural economic resilience, social resilience, ecological resilience, and engineering resilience to portray China’s rural resilience in the period 2000–2018. As the evaluation of ecological resilience relies on data from positioning observation and monitoring of ecological systems instead of statistics, the paper thus excludes rural ecological resilience and only evaluates the other three types of resilience.
The evaluation is made by using the entropy method. In information theory, entropy is a measure of uncertainty, and the entropy value is calculated according to the characteristics of entropy to judge the degree of dispersion of an indicator. The greater the degree of indicator dispersion, the greater the impact on comprehensive evaluation. The model and calculation process is as follows.
- Indicator matrix data
There are years, provinces, and indicators to be evaluated. The original indicator matrix is established as:
where is the indicator of province in year .
- Min-max normalization
Use “min-max normalization” to convert each index into a dimensionless form index. The Pressure dimension includes negative indicators while other indicators are positive. The calculation formula of the standardized processing result is expressed as follows:
- Weight of indicators
is defined as the normalized difference index, and on the basis of normalization processing, we can obtain the entropy value .
is expressed as the entropy redundancy, and is the indicator weight.
After we obtain the weights of the indicators (Table A1), we can calculate the rural resilience of each province, which is represented by .
3.2. Data Sources and Description
Table 1 presents 20 selected indexes and their explanation. In economic resilience, the division of urban and rural residents’ income is selected to indicate the economic pressure on rural communities. As urban–rural divisions expand, rural communities tend to lose production elements such as laborers and capital which agglomerate to cities. This will shock and affect the rural economy and peasants’ income. Resource endowments and income depict the rural capacity to protect against economic shocks. Thus, rural households’ per capita disposable income, per capita water resources, and per capita arable land are chosen to indicate the state of rural economic resilience. Then, per capita rural fixed asset investment and the proportion of agricultural investment in fiscal expenditure are selected as rural economic responses by investing in fixed assets and the agricultural sector.

Table 1.
Comprehensive evaluation system of rural resilience in China.
In terms of rural social resilience, the proportion of the rural population over 65 is used to depict the aging pressure of the rural society. The state of the rural society includes proportion of rural labor force to the rural population, average education years of rural population, and number of township cultural stations. The township cultural station plays an important role in serving rural people by offering technical training and organizing recreational activities. When dealing with rural aging problems and other social crises, it is necessary to disseminate in time public opinion guidance and corrected information and to offer relief and help from both governmental and nongovernmental organizations. Thus, the paper selects number of telephones per household, proportion of social service investment in fiscal expenditure, and number of NGOs to describe rural responses to social shocks and pressures.
The paper uses the proportion of the disaster-affected area of crops and proportion of affected people in the rural population to indicate pressure on rural engineering resilience. Then, the proportion of irrigated arable land is selected to show the rural capacity to deal with drought or floods while per capita power generation is used to indicate the rural capacity to restore production and public services such as water and gas supply when facing unexpected disasters. Then, indexes such as the number of rural hospital beds per 1000 persons, number of rural doctors and hygienists per 1000 persons, and natural disaster relief expenses per capita are selected to describe rural responses to relieve and recover from disasters.
The data used in this study refer to China Provincial Statistical Yearbooks (2001–2019). The study covers 31 provinces, centrally-directed districts, and autonomous regions of mainland China while Hong Kong, Macau, and Taiwan are not included in the study owing to data unavailability.
3.3. Research Results
3.3.1. The Spatio-Temporal Changes of Rural Resilience
According to Table 2, China’s rural resilience stayed at below the median level (the full mark is 1) during the research period. China’s rapid urbanization development has induced large-scale rural-urban migration which has further caused labor shortage, rural industrial recession, and social degradation, etc. in those traditional agriculture- and natural resource-based villages of China [4,5,29]. These challenges have in turn lowered the resilience capacity of rural communities against external shocks.
Table 2.
Evaluation results of rural resilience and its components in China.
The results also show an increasing tendency of rural resilience in China from 0.2797 in 2000 that slowly increases to 0.4567 in 2018. In the meantime, economic resilience, social resilience, and engineering resilience also present an increasing tendency in the research period.
Figure 3 shows the spatio-temporal changes of rural resilience at the provincial level in China in the period 2000–2018. Clearly, the scope of provinces of high-level rural resilience expands in the research period. This result is in line with what is shown in Table 2 that China’s rural resilience has been increasing since 2000.
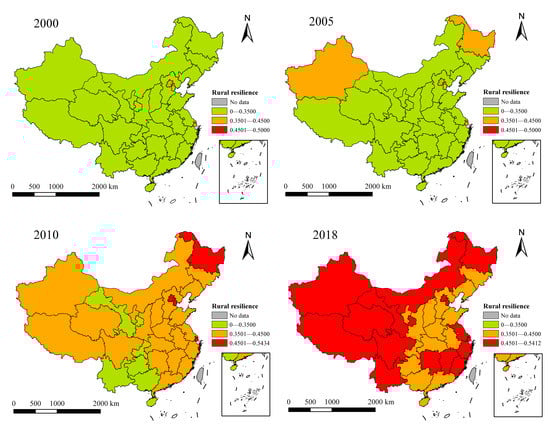
Figure 3.
The spatio-temporal changes in China’s rural resilience, 2000–2018.
Figure 4, Figure 5 and Figure 6 present the spatio-temporal changes of rural economic resilience, social resilience, and engineering resilience in China. The scope of rural economic resilience at a high level expands to the whole part of mainland China from 2000 to 2018. This change is attributed to China’s years of input in rural areas since the beginning of 21st century when there was a strategic shift from urban bias to completely supporting rural areas. Data show an increase of 8100 $ in per capita rural fixed asset investment, an increase of 12,335 $ in rural households’ per capita disposable income and a 5% increase in the proportion of agricultural investment in fiscal expenditure in the period 2000–2018.
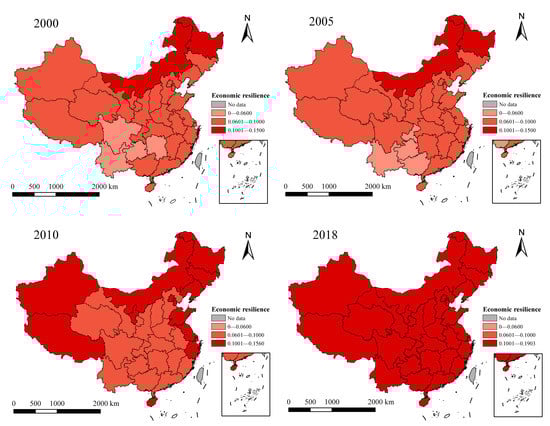
Figure 4.
The spatio-temporal patterns in economic resilience in rural China, 2000–2018.
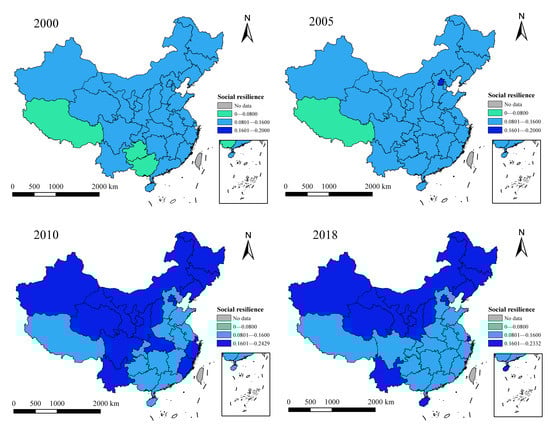
Figure 5.
The spatio-temporal patterns of social resilience in rural China, 2000–2018.
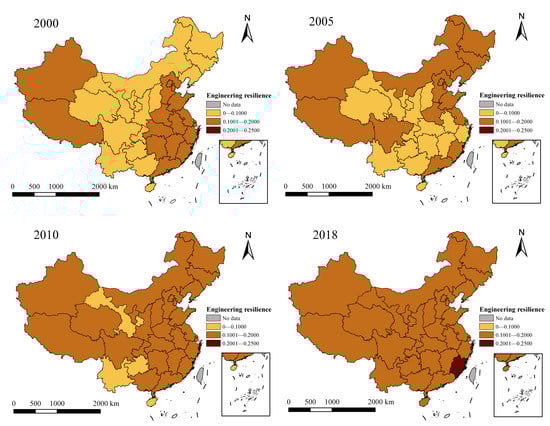
Figure 6.
The spatio-temporal patterns of engineering resilience in rural China, 2000–2018.
According to Figure 5, there has been an increase in rural social resilience across China from 2000 to 2010, and this tendency is particularly evident between 2005 and 2010. Statistics in the period 2005–2010 show an increase of the rural population’s average education from 7.1 to 7.6 years, the increase of per household owned telephones from 0.27 to 2.06, the increase of proportion of social service investment in fiscal expenditure from 2.21% to 3.63, and the increase of NGOs per 10,000 persons from 1.91 to 4.41. These changes contributed to the rural social resilience increase from 2005 to 2010. However, there were no obvious changes in rural social resilience in the period 2010–2018, and this is in line with what is shown in Table 2 that China’s rural social resilience maintained the same level between 2010 and 2018.
As Figure 6 shows, the scope of high engineering resilience of rural China expanded from 2000 to 2018. This can be attributed to the investment in rural water conservancy facilities, power facilities, as well as medical affairs, which have effectively enhanced the ability to defend against natural disasters and minimize the loss of agriculture and people’s deaths. Statistics show that the proportion of irrigated arable land increased from 44.29% to 54.11% and per capita power generation increased from 18.46 kW·h to 421.84 kW·h in the period 2000–2018. The period also witnesses an increase of the number of hospital beds per 1000 persons from 0.85 to 2.13, and the decrease of proportion of disaster-affected areas of crops to sown area of crops from 37.51% to 10.99%.
3.3.2. The Factors Restricting Rural Resilience
The paper draws radar maps to present the rural resilience in China and its eastern, central, and western parts in the period 2000–2018 (Figure 7, Figure 8, Figure 9 and Figure 10). We can see from Figure 7 that social resilience and engineering resilience are the main components of China’s rural resilience while economic resilience is the key restriction factor though there is slight growth of rural economic resilience in the research period (Table 2). As China moves on with its rapid urbanization development, there exists a large amount of peasant workers who will leave their home villages and move to cities. The national statistics show a continuous increase in China’s peasant workers from 140.41 million in 2008 to 172.66 million in 2018. The average age of peasant workers is 35.2 and those who are younger than 40 years account for 69.9% of the total peasant workers (http://www.stats.gov.cn/tjsj/zxfb/201904/t20190429_1662268.html). In this sense, peasant workers who are young and skilled laborers rely on cities for better livelihood. As a result, depopulation expands in rural China and even induces labor shortage in traditional agriculture- and natural resource-based places. Being an important production element, depopulation has directly affected rural economic stability in China.
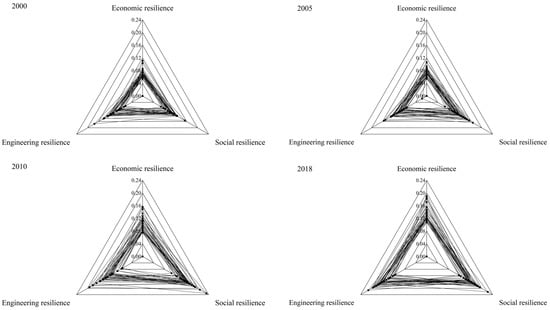
Figure 7.
The radar chart of rural resilience components in China, 2000–2018.
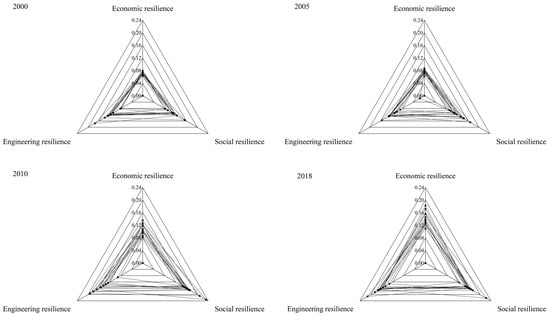
Figure 8.
The radar chart of rural resilience components in Eastern China, 2000–2018.
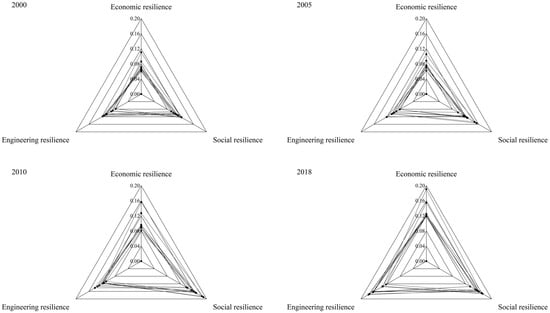
Figure 9.
The radar chart of rural resilience components in Central China, 2000–2018.
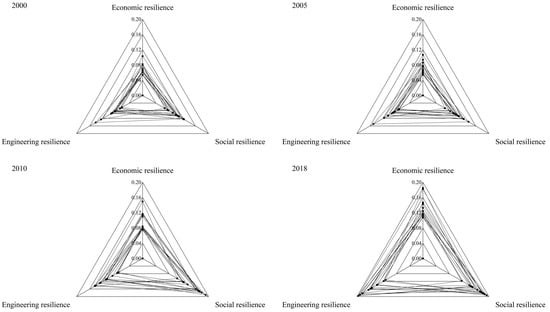
Figure 10.
The radar chart of rural resilience components in Western China, 2000–2018.
According to Table 3, Table 4 and Table 5, the evaluation results of rural resilience in Eastern China are higher than those in Central China and Western China during the research period. This is attributed to Eastern China’s highly developed economy which has promoted rural development in various aspects. However, Central China and Western China are behind Eastern China in terms of economy and have rural development lagging behind that in Eastern China. For instance, statistics in 2018 show that rural households’ per capita disposable income in eastern, central, and western regions was 20,185 $, 13,832 $, and 11,615 $, respectively, while the per capita rural fixed asset investment of the three regions was 13,513 $, 4948 $, and 5454 $. Developed economy and high income have contributed to rural social development and infrastructure construction in Eastern China and have led to enhanced rural resilience. This result is in line with what is shown in Figure 3.
Table 3.
Evaluation results of rural resilience and its components in Eastern China.
Table 4.
Evaluation results of rural resilience and its components in Central China.
Table 5.
Evaluation results of rural resilience and its components in Western China.
As Figure 8 shows, the social resilience and engineering resilience are the main components of rural resilience in Eastern China while economic resilience is the key restriction factor in the research period. The rural economic resilience has been increasing rapidly since 2005 and the gap between economic resilience and two other resiliencies has gradually narrowed.
The same research findings are drawn for Central China and Western China that social resilience and engineering resilience are the main components of rural resilience in these two regions while economic resilience is the restriction factor to rural resilience in the research period (Figure 9 and Figure 10). Further findings also indicate that the gap between economic resilience and two other resiliencies has decreased since 2005.
4. Discussion
Rural decline or vanishing is an inevitable process when certain rural communities fail to make adaptive responses to the external shocks and challenges as human society transformed from the agrarian economy to the urban-industrial economy, and further to the knowledge economy. In this process, rural resilience determines how rural communities react to the external challenges and whether a satisfactory standard of people’s livelihood can be maintained. From the rural resilience evolution in the study, we find how rural China responds to the external challenges such as policy changes and urbanization development. Compared with social and infrastructure development, rural economic performance must be prioritized to support rural resilience when many rural communities are losing production elements and their economic competitiveness. As for the implications for China to implement its rural revitalization strategy, it becomes important to enhance rural economic resilience and transform the rural development pattern to cater to market needs. In this sense, favorable policies and measures are needed to encourage and attract people and enterprises back to rural areas to start new careers and to invest more in the countryside.
With respect to rural resilience in the world, we would say that there are many countries, particularly developing countries, in which urbanization development still takes place at the expense of the countryside [30]. The urban–rural dual structure will accelerate people’s mobility from rural to urban areas for better livelihood, and this tendency will become irreversible. As a result, this causes a rural labor shortage which further affects rural sustainability and degrades rural resilience. Thus, the policy implications for China also suit these countries. It is necessary to start from changing urban-biased policy and cultivating rural industries to enhance rural economic resilience which further supports the rural social and engineering resilience.
The study of rural resilience contributes to the understanding of rural evolution. It is when the external shocks exceed the threshold of rural resilience that a rural community starts to transform from one stable state to another stable state. Thus, the detection of the factors that restrict rural resilience plays an important role in making up the weak points to stabilize rural communities. However, we emphasize the importance of the commitments, decision-making, and actions of local people to revitalize their communities and have their prosperity and life quality maintained. Compared with the broad public policy and planning initiatives which are often implemented from the top-down perspective, the bottom-up initiative and collective actions from those who live there are particularly important. It is the local inhabitants’ resolutions, commitments, and attitudes that determine the destiny of their communities [10].
Needless to say, the investigation of China’s rural resilience at a provincial level suffers from several limitations and problems: (1) Rural resilience covers many aspects such as economic, social, and ecological resilience and a general evaluation fails to show the specific aspect of rural resilience. (2) Rural communities are not homogeneous groups of entities, but differ in many aspects such as resource endowments, economy, geographical conditions, and social issues, etc. Evaluation of rural resilience at a provincial level does not mean similar results at a community level. Thus, it is necessary for further studies to focus on a specific rural community and reveal its economic, social, and ecological resilience when facing different external challenges.
We emphasize that, in spite of these limitations, the general pattern and constitution of rural resilience in this article could serve as a reference point for further studies of rural resilience in China. Among possible topics for future research, we suggest studies of rural resilience of different geographical conditions such as plain areas, mountainous areas, intermediate, and remote locations. What are the restriction factors to rural resilience of different communities? What are the thresholds of rural resilience of different rural communities?
5. Conclusions
Rural resilience in China has been subordinate to its rural policies over time. The research of the paper finds a slight increase, but less than the median level rural resilience in China in the period 2000–2018. For one thing, the long period of the urban-biased environment since 1949 has put rural China in a disfavored position and sacrificed rural for urban development by intentionally directing a large amount of rural production elements such as capital, laborers, and raw materials to cities [9]. As a result, urban–rural inequalities expand and rural resilience drops. For another thing, the policy of completely supporting agriculture, villages, and peasants replaced urban bias since the beginning of the 21st century. Then, China’s central government produced a cluster of concrete policies and measures which were grouped into 17 “No. 1 Central Document” since 2004. Thus, such a rural-favoring policy environment contributed to rural resilience increase in China.
The study also reveals evident spatio-temporal differences of rural resilience across China’s eastern, central, and western regions in the research period. Eastern China with a developed economy is ahead of Central China and Western China in terms of rural resilience. Eastern China leads the economic growth of the state, and a developed economy intensifies urban–rural linkages and increases the positive economic influence of big city-regions on rural communities. Western China lags behind Eastern and Central China in terms of economic growth. Thus, less developed rural communities have a lower level of rural resilience.
Further study finds that economic resilience is the key restriction factor to rural resilience because of rural depopulation. However, social resilience and engineering resilience are the main components of China’s rural resilience. The same research findings are also seen in China’s three regions. In conclusion, China needs to put rural economic growth in the first place so as to achieve its rural revitalization strategy.
Author Contributions
Conceptualization, Y.L.; methodology, Y.L.; formal analysis, C.S.; data curation, H.H.; writing-original draft preparation, Y.L. and C.S.; writing-review and editing, Y.L., C.S. and H.H.; visualization, C.S.; funding acquisition, Y.L. All authors have read and agreed to the published version of the manuscript.
Funding
This research was funded by National Natural Science Foundation of China, grant number 41771191.
Institutional Review Board Statement
Not applicable.
Informed Consent Statement
Not applicable.
Data Availability Statement
The data presented in this study are available on request from the corresponding author. The data are not publicly available due to privacy.
Conflicts of Interest
The authors declare no conflict of interest.
Appendix A
Table A1.
The weights of indexes.
Table A1.
The weights of indexes.
| Rural Resilience | Indexes | Weights |
|---|---|---|
| Economic resilience | The division of urban and rural residents’ income | 0.0553 |
| Rural households’ per capita disposable income | 0.0555 | |
| Per capita water resources | 0.0562 | |
| Per capita arable land | 0.0555 | |
| Per capita rural fixed asset investment | 0.0555 | |
| The proportion of agricultural investment in fiscal expenditure | 0.0553 | |
| Social resilience | Proportion of rural population over 65 | 0.0476 |
| Proportion of rural labor force to the rural population | 0.0476 | |
| Average education years of rural population | 0.0476 | |
| Number of township cultural stations per 10000 persons | 0.0476 | |
| Number of telephones per household | 0.0477 | |
| Proportion of social service investment in fiscal expenditure | 0.0476 | |
| Number of NGOs per 10000 persons | 0.0477 | |
| Engineering resilience | Proportion of disaster-affected area of crops | 0.0475 |
| Proportion of disaster-affected people to the rural population | 0.0475 | |
| Proportion of irrigated arable land | 0.0475 | |
| Per capita power generation | 0.0479 | |
| Number of rural hospital beds per 1000 persons | 0.0475 | |
| Number of rural doctors and hygienists per 1000 persons | 0.0475 | |
| Natural disaster relief expenses per capita | 0.0479 |
References
- Wood, R. Survival of Rural America: Small Victories and Bitter Harvests; University Press of Kansas: Lawrence, KS, USA, 2008. [Google Scholar]
- Carr, P.; Kefalas, M. Hollowing Out the Middle: The Rural Brain Drain and What It Means for America; Beacon Press: Boston, MA, USA, 2009. [Google Scholar]
- Ye, J.; Pan, L.; Wu, H.; He, C.; Zhang, H. Moving to the fore group, study focus on China’s left-behind population. Women China 2009, 3, 24–33. [Google Scholar]
- Liu, Y.; Liu, Y.; Chen, Y.F.; Long, H.L. The process and driving forces of rural hollowing in China under rapid urbanization. J. Geogr. Sci. 2010, 20, 876–888. [Google Scholar] [CrossRef]
- Li, Y.; Westlund, H.; Zheng, X.; Liu, Y. Bottom-up initiatives and revival in the face of rural decline: Case studies from China and Sweden. J. Rural Stud. 2016, 47, 506–513. [Google Scholar] [CrossRef]
- Liu, Y.; Li, Y. Revitalize the world’s countryside. Nature 2017, 548, 275–277. [Google Scholar] [CrossRef]
- Markey, S.; Halseth, G.; Manson, D. Challenging the inevitability of rural decline: Advancing the policy of place in northern British Columbia. J. Rural Stud. 2008, 24, 409–421. [Google Scholar] [CrossRef]
- Wilson, G. Multifunctional ‘Quality’ and rural community resilience. Trans. Inst. Br. Geogr. 2010, 35, 364–381. [Google Scholar] [CrossRef]
- Li, Y. Urban-rural interaction in China: Historic scenario and assessment. China Agric. Econ. Rev. 2011, 3, 335–349. [Google Scholar] [CrossRef]
- Li, Y.; Westlund, H.; Liu, Y. Why some rural areas decline while some others not: An overview of rural evolution in the world. J. Rural Stud. 2019, 68, 135–143. [Google Scholar] [CrossRef]
- Walker, B.; Salt, D. Resilience Thinking: Sustaining Ecosystems and People in a Changing World; Island Press: Washington, DC, USA, 2006. [Google Scholar]
- Deveson, A. Resilience; Allen & Unwin: Sydney, Australia, 2003. [Google Scholar]
- Sakuno, H. The Problems and expectations of regional development in hilly-mountainous region and correspondence of rural settlements. Jpn. Assoc. Econ. Geogr. 2006, 52, 46–64. [Google Scholar]
- Crandall, M.; Etuk, L. What Is Community Vitality? Oregon State University: Corvallis, OR, USA, 2008. [Google Scholar]
- Kasamatsu, H. For regenerations of small scale and aging hamlets. Bull. Shimane Prefect. Mt. Reg. Res. Cent. 2009, 5, 73–76. [Google Scholar]
- Westlund, H. Urban-Rural Relations in the Post-Urban World. In The Post-Urban World: Innovative Transformations in Global City Regions; Haas, T., Westlund, H., Eds.; Routledge: London, UK, 2018; pp. 70–81. [Google Scholar]
- Westlund, H.; Kobayashi, K. Social Capital and Rural Development in the Knowledge Society; Edward Elgar: Cheltenham, UK, 2013. [Google Scholar]
- Holling, C. Resilience and stability of ecological systems. Annu. Rev. Ecol. Evol. Syst. 1973, 4, 1–23. [Google Scholar] [CrossRef]
- Rose, A.; Lim, D. Business interruption losses from natural hazards: Conceptual and methodology issues in the case of the Northridge Earthquake. Environ. Hazards Hum. Soc. Dimens. 2002, 4, 1–14. [Google Scholar]
- Adger, W. Vulnerability. Glob. Environ. Chang. 2006, 16, 268–281. [Google Scholar] [CrossRef]
- Wildavsky, A. Searching for Safety; Transaction Books: New Brunswich, NJ, USA, 1988; p. 253. [Google Scholar]
- Norris, F.; Stevens, S.; Pfefferbaum, B.; Wyche, K.; Pfeffetbaum, R. Community resilience as a metaphor, theory, set of capacities and strategy for disaster readiness. Community Psychol. 2008, 41, 127–150. [Google Scholar] [CrossRef]
- Maguire, B.; Hagan, P. Disasters and communities: Understanding social resilience. Aust. J. Emerg. Manag. 2007, 2, 16–20. [Google Scholar]
- Cutter, S.; Barnes, L.; Berry, M.; Burton, C.; Evans, E.; Tate, E.; Webb, J. A place-based model for understanding community resilience to natural disasters. Glob. Environ. Chang. 2008, 18, 598–606. [Google Scholar] [CrossRef]
- Walker, B.; Holling, C.; Carpenter, S.; Kinzig, A. Resilience, adaptability and transformability in social-ecological systems. Ecol. Soc. 2004, 9, 5. [Google Scholar] [CrossRef]
- Folke, C.; Carpenter, S.; Walker, B.; Scheffer, M.; Chapin, T.; Rockstrom, J. Resilience Thinking: Integrating Resilience, Adaptability and Transformability. Ecol. Soc. 2010, 15, 299–305. [Google Scholar] [CrossRef]
- Epps, R. The sustainability of Australian agricultural production systems: A realistic objective or simply a desirable aim? Aust. Geogr. 1995, 26, 173–179. [Google Scholar] [CrossRef]
- Troughton, M. Rural Canada and Canadian rural geography. Can. Geogr. 1995, 39, 290–305. [Google Scholar] [CrossRef]
- Long, H.; Zou, J.; Pykett, J.; Li, Y. Analysis of rural transformation development in China since the turn of the new millennium. Appl. Geogr. 2011, 31, 1094–1105. [Google Scholar] [CrossRef]
- Westlund, H. Urban futures in planning, policy and regional science: Are we entering a post-urban world? Built Environ. 2014, 40, 447–457. [Google Scholar] [CrossRef]


Publisher’s Note: MDPI stays neutral with regard to jurisdictional claims in published maps and institutional affiliations. |
© 2021 by the authors. Licensee MDPI, Basel, Switzerland. This article is an open access article distributed under the terms and conditions of the Creative Commons Attribution (CC BY) license (http://creativecommons.org/licenses/by/4.0/).