Article

Coupling Remote Sensing and Hydrological Model for Evaluating the Impacts of Climate Change on Streamflow in Data-Scarce Environment

by
Fazlullah Akhtar
1,*,
Usman Khalid Awan
2,
Christian Borgemeister
1 and
Bernhard Tischbein
1
1
Center for Development Research (ZEF), University of Bonn, Genscherallee 3, 53113 Bonn, Germany
2
International Water Management Institute (IWMI), Lahore 53700, Pakistan
*
Author to whom correspondence should be addressed.
Sustainability 2021, 13(24), 14025; https://doi.org/10.3390/su132414025
Submission received: 24 November 2021 / Revised: 15 December 2021 / Accepted: 16 December 2021 / Published: 19 December 2021

Abstract

:
The Kabul River Basin (KRB) in Afghanistan is densely inhabited and heterogenic. The basin’s water resources are limited, and climate change is anticipated to worsen this problem. Unfortunately, there is a scarcity of data to measure the impacts of climate change on the KRB’s current water resources. The objective of the current study is to introduce a methodology that couples remote sensing and the Soil and Water Assessment Tool (SWAT) for simulating the impact of climate change on the existing water resources of the KRB. Most of the biophysical parameters required for the SWAT model were derived from remote sensing-based algorithms. The SUFI-2 technique was used for calibrating and validating the SWAT model with streamflow data. The stream-gauge stations for monitoring the streamflow are not only sparse, but the streamflow data are also scarce and limited. Therefore, we selected only the stations that are properly being monitored. During the calibration period, the coefficient of determination (R2) and Nash–Sutcliffe Efficiency (NSE) were 0.75–0.86 and 0.62–0.81, respectively. During the validation period (2011–2013), the NSE and R2 values were 0.52–0.73 and 0.65–0.86, respectively. The validated SWAT model was then used to evaluate the potential impacts of climate change on streamflow. Regional Climate Model (RegCM4-4) was used to extract the data for the climate change scenarios (RCP 4.5 and 8.5) from the CORDEX domain. The results show that streamflow in most tributaries of the KRB would decrease by a maximum of 5% and 8.5% under the RCP 4.5 and 8.5 scenarios, respectively. However, streamflow for the Nawabad tributary would increase by 2.4% and 3.3% under the RCP 4.5 and 8.5 scenarios, respectively. To mitigate the impact of climate change on reduced/increased surface water availability, the SWAT model, when combined with remote sensing data, can be an effective tool to support the sustainable management and strategic planning of water resources. Furthermore, the methodological approach used in this study can be applied in any of the data-scarce regions around the world.

1. Introduction

Climate change is a global concern given its impacts on human and animal lives, water resources, and their inter-relationship [1]. Current research shows that climate change will reduce terrestrial water storage in several regions, specifically in the Global South [2]. The reduction in terrestrial water storage may cause droughts and desertification, which will have dire consequences for both fauna and flora of the ecosystems [2]. A recent study in the Czech Republic suggests that due to the significant uncertainties in the water resources development for the future, it is better to develop adaptation measures to limit the negative impacts of climate change [3]. Another study [4] in the Nile Delta shows an increase and decrease in the mean annual temperature and precipitation, respectively. It shows that by the end of the century, the Upper Nile might experience around a 27% increase in the potential evapotranspiration, and surface runoff is expected to increase by 14%. However, this increase in surface runoff is not visible in the total water yield of the basin; instead, the total water yield decreases by 6.5% and 10.7% under the RCP 4.5 and 8.5, respectively. Similar changes in the hydrologic regime will have dire implications for water availability and management, especially for countries with arid or semi-arid conditions.
Afghanistan is an arid to semi-arid country in terms of climate and receives precipitation characterized by a high intra- and inter-annual variability and spatial non-uniformity. Eighty percent of the country’s total water resources are attributed to winter precipitation. During the summer season, water resources are not enough to meet the water demand of crops [5]. The temporal gap between precipitation and peak demand is currently more or less closed by the fact that a high share of precipitation is snow that melts in late spring or summer; however, this rather advantageous pattern is expected to dwindle due to climate change, with the basin expected to receive less snow but more rainfall, leading to tendency for a quicker reaction of the basin in terms of runoff rainfall. This would lead to more mismatch in water availability against a peak demand that enlarges the gap.
Afghanistan’s total arable area is around 12%, of which around 46% is irrigated and the rest is rainfed [6]. Most arable regions for permanent crops are situated in the northern and southern regions of Afghanistan. The rainfed and irrigated agricultural areas vary based on winter snowfall and rainfall in the cropping period. Irrigation currently uses about 98% of Afghanistan’s overall water consumption, which accounts for 85% of the total agricultural production, but even then, the irrigation performance at the basin level is poor [7,8].
The Kabul River Basin (KRB) is spread over 12% of Afghanistan’s territory and contributes about 26% of the country’s total annual streamflow [9]. This basin performs poorly in irrigation under the presently available management and infrastructure conditions [7]. The inefficiencies of the irrigation system are further compounded by the diversion of large amounts of water under inadequate infrastructure (earthen or broken canals, uneven fields, and missing hydraulic structures) and inadequate technologies, which are the key hurdles to increasing agricultural productivity in Afghanistan [10]. The up-to-date data on Afghanistan’s land and water resources are either limited or otherwise too old [11]; this requires additional care to be used for broader planning initiatives and management interventions. The data quality and quantity on water and land resources are poor, highlighting the need for basic research at the basin level, quantifying water resources, and performing technical engineering analyses to manage these tremendously critical natural assets. Consequently, the information gap highlighted here is in contrast with the urgent need for action.
To develop sustainable plans for water resources management under a changing climate, there is a dire need to extract information on water and land resources’ use in the KRB. Under such circumstances, we need tools and models that can efficiently simulate streamflow in the data-scarce environment and function in changing climate scenarios successfully. For streamflow estimation over space and time, various models are used [12,13,14,15]. The choice of these models is usually based on the size of the watershed, details of the inputs available/to be used, the type of outputs needed, and the quality and frequency of the outputs. Most of these models are distributed and data-intensive. However, models such as the SWAT can simulate water flows with limited data sets and still generate reliable results.
The SWAT model is physically based and spatially semi-distributed and can be used to predict the discharge of an ungauged basin [16]. It is a potential tool for the simulation of runoff in mountainous watersheds [17]. It has the potential to simulate biophysical processes in data-scarce basins around the world [18], making it potentially useful in the context of the KRB. The research findings of [19] suggest the suitability and applicability of the SWAT model to identify controlling factors needed to simulate hydrologically acceptable scenarios in ungauged basins. The results, therefore, supplement the SWAT model’s applicability for data-scarce and complex river basins.
Thus, the objective of this study is to analyze the climate change impacts on future streamflow in the KRB. For this purpose, the SWAT model was calibrated and validated, and RCPs 4.5 and 8.5 were then used to see the streamflow response in 2014–2030 against the changing temperature and precipitation. This study will provide a basis for future investment plans for expanding the agricultural area, increasing the productivity of land and water resources. It will also help in the inter-sectoral distribution of water across the KRB, thereby supporting decision makers to achieve the UN Sustainable Development Goals (SDGs). The impacts of climate change on streamflow under RCPs 4.5 and 8.5 simulated in this study provide additional information to relevant agencies and policymakers to critically construct coping strategies and sustainably reduce the future negative impacts of climate change on water resources in a basin known for its data scarcity, given its inefficient hydraulic infrastructure and the deficient scientific studies on water resources and climate change. Evaluating the impacts of climate change on streamflow is also vital for a country such as Afghanistan, where around 44.7% of the population is (in)directly employed by the agriculture sector only [20].

2. Materials and Methods
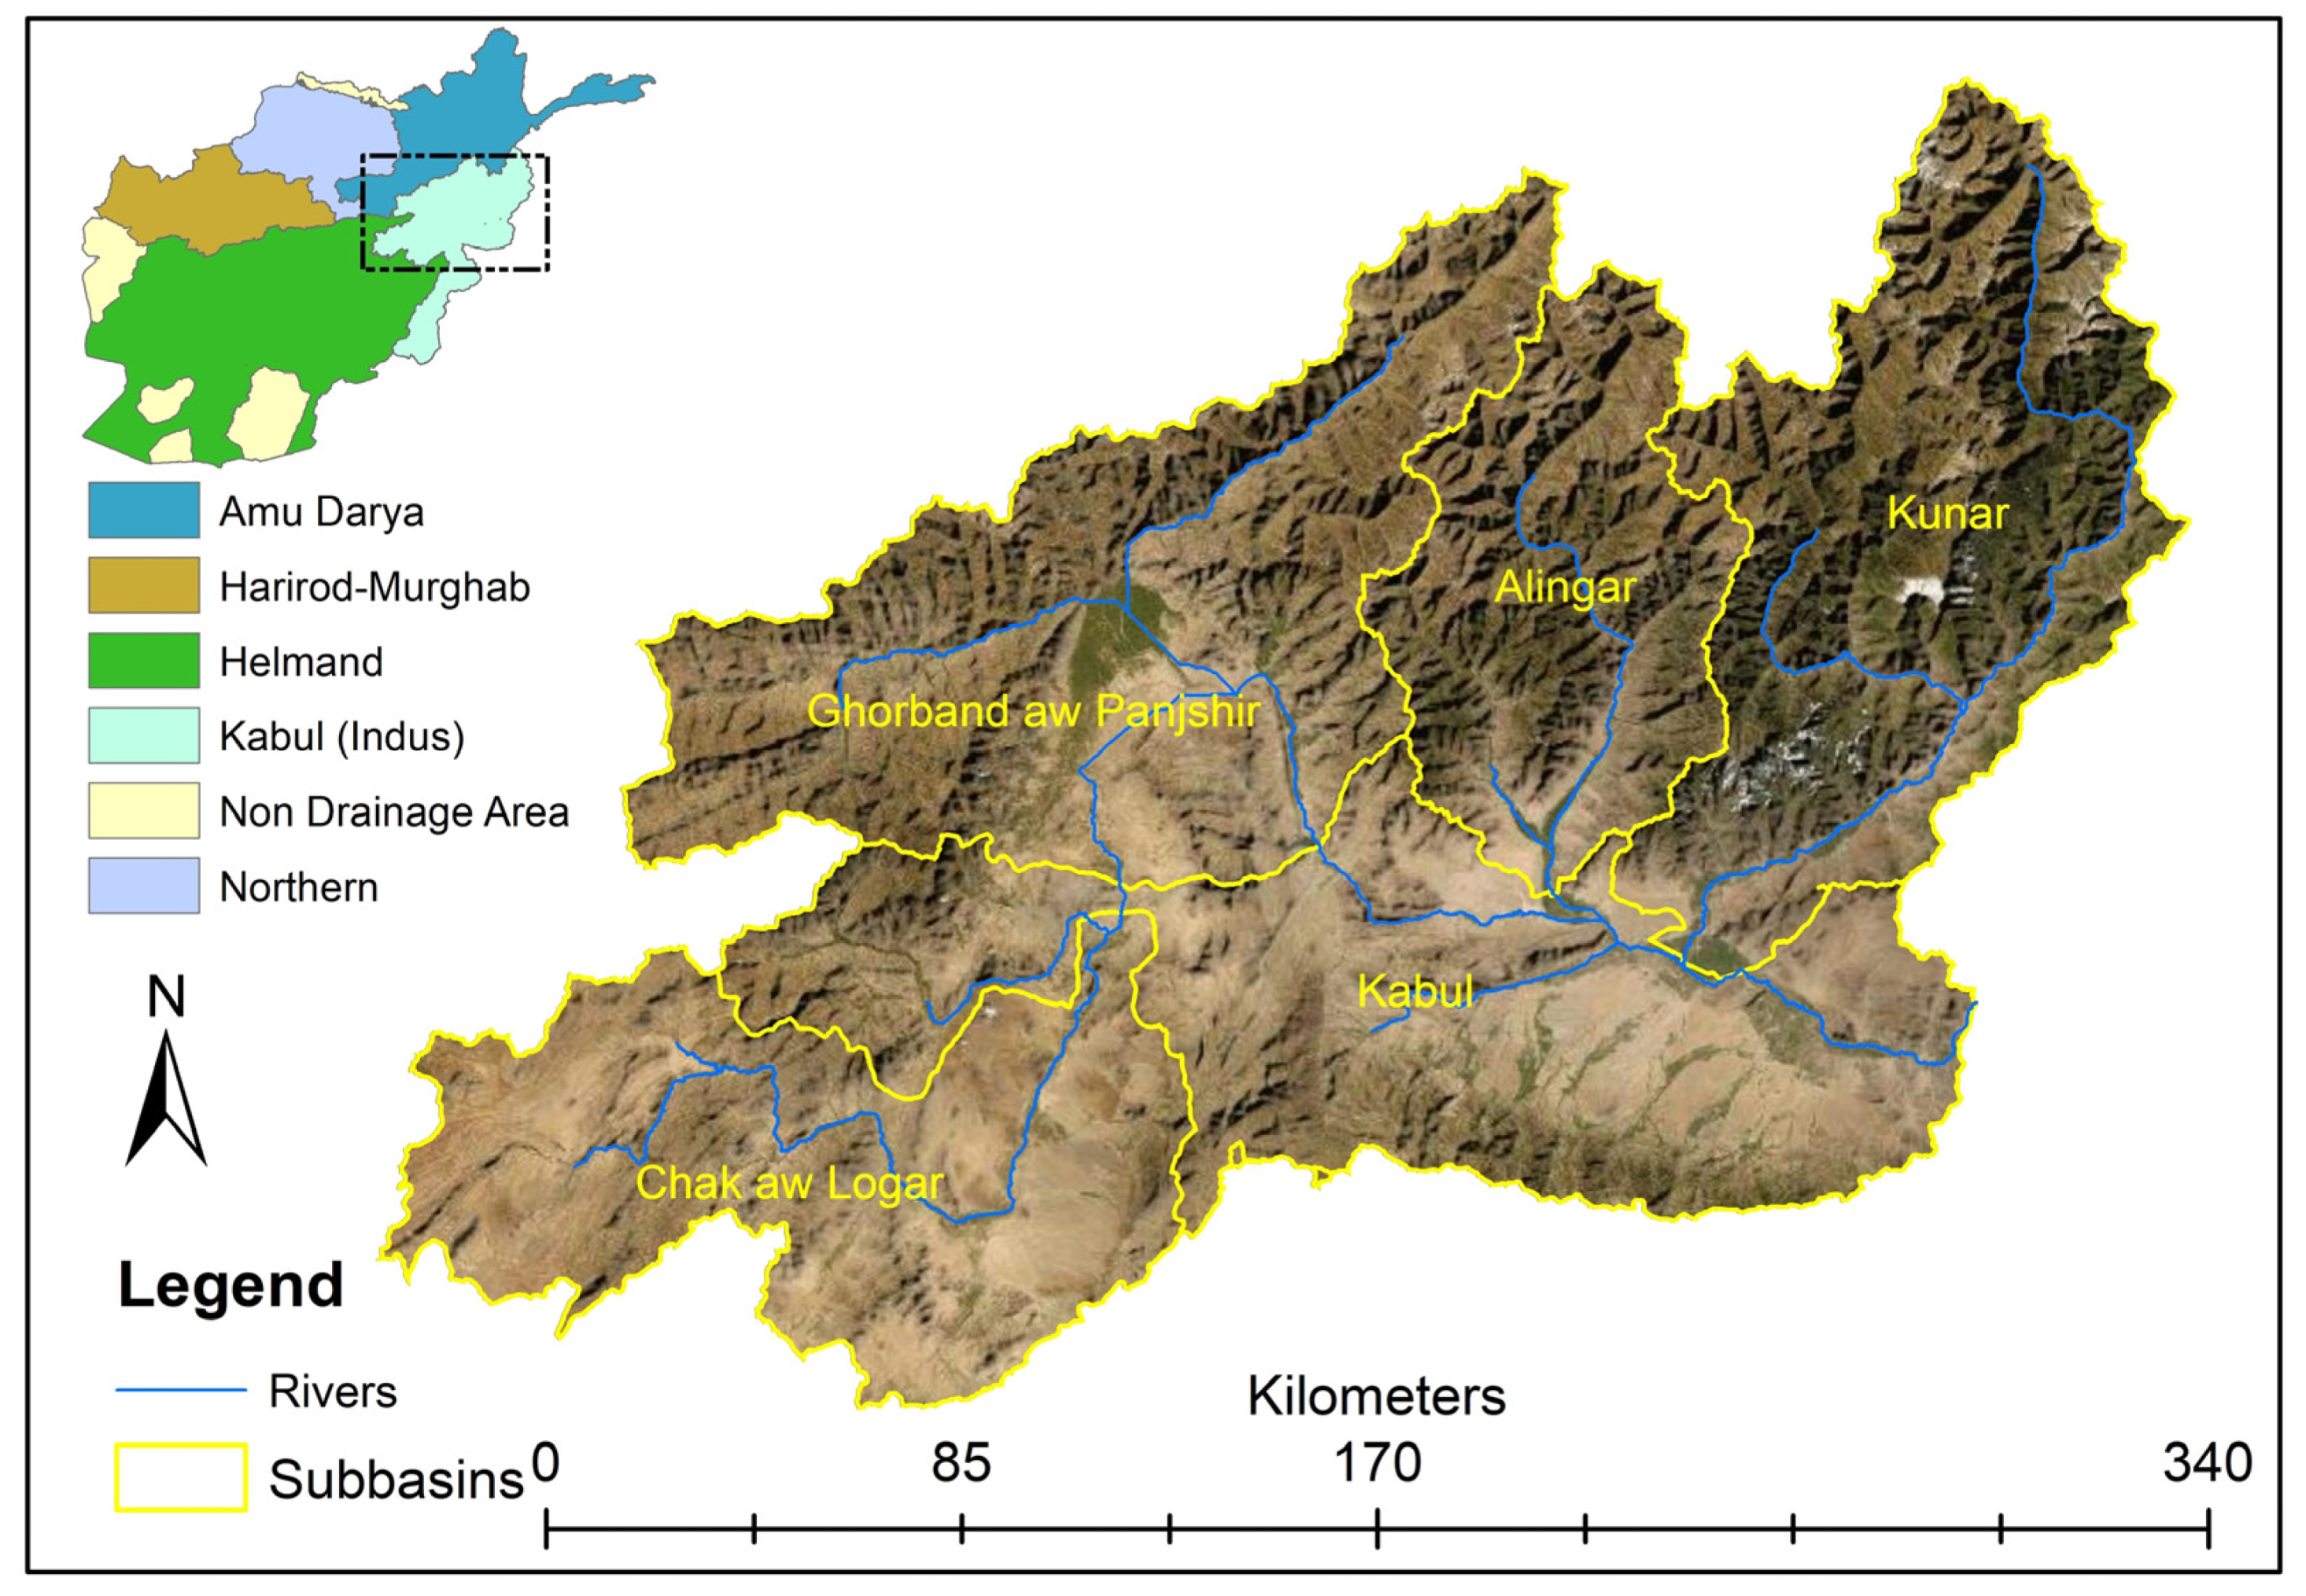
2.1. Study Region

The transboundary KRB is located in the eastern part of Afghanistan and is part of the wider Indus Basin (Figure 1). This basin is host up to one-third of the country’s population, which exerts tremendous pressure on water resources. KRB is also known for its heterogeneity in terms of elevation, temperature, precipitation, and cropping patterns. The mean annual actual evapotranspiration across the KRB is in the range of 471–574 mm [21]. The climatic conditions broadly vary among the different spatial units of the KRB; the upstream heights usually receive precipitation as snow, up to 418 mm, while the downstream regions, especially in the lowlands, receive rainfall up to 327 mm [7]. The water use by source also varies between different upstream and downstream regions; extreme upstream users utilize water from springs and surface water supplies, while mid-stream users withdraw massive amounts of groundwater for their municipal and industrial consumption. The KRB’s mean annual temperature is predicted to rise by 1.8 °C, 3.5 °C, and 4.8 °C by the end of 2020, 2050, and 2080, respectively [22]. These projected increases in temperature highlight that the precipitation being received in the basin will certainly undergo rigorous change (in terms of amount and temporal pattern), which will have eventual impacts on streamflow in the future. Therefore, it is essential to explore and analyze the changes in streamflow under the changing climate conditions.

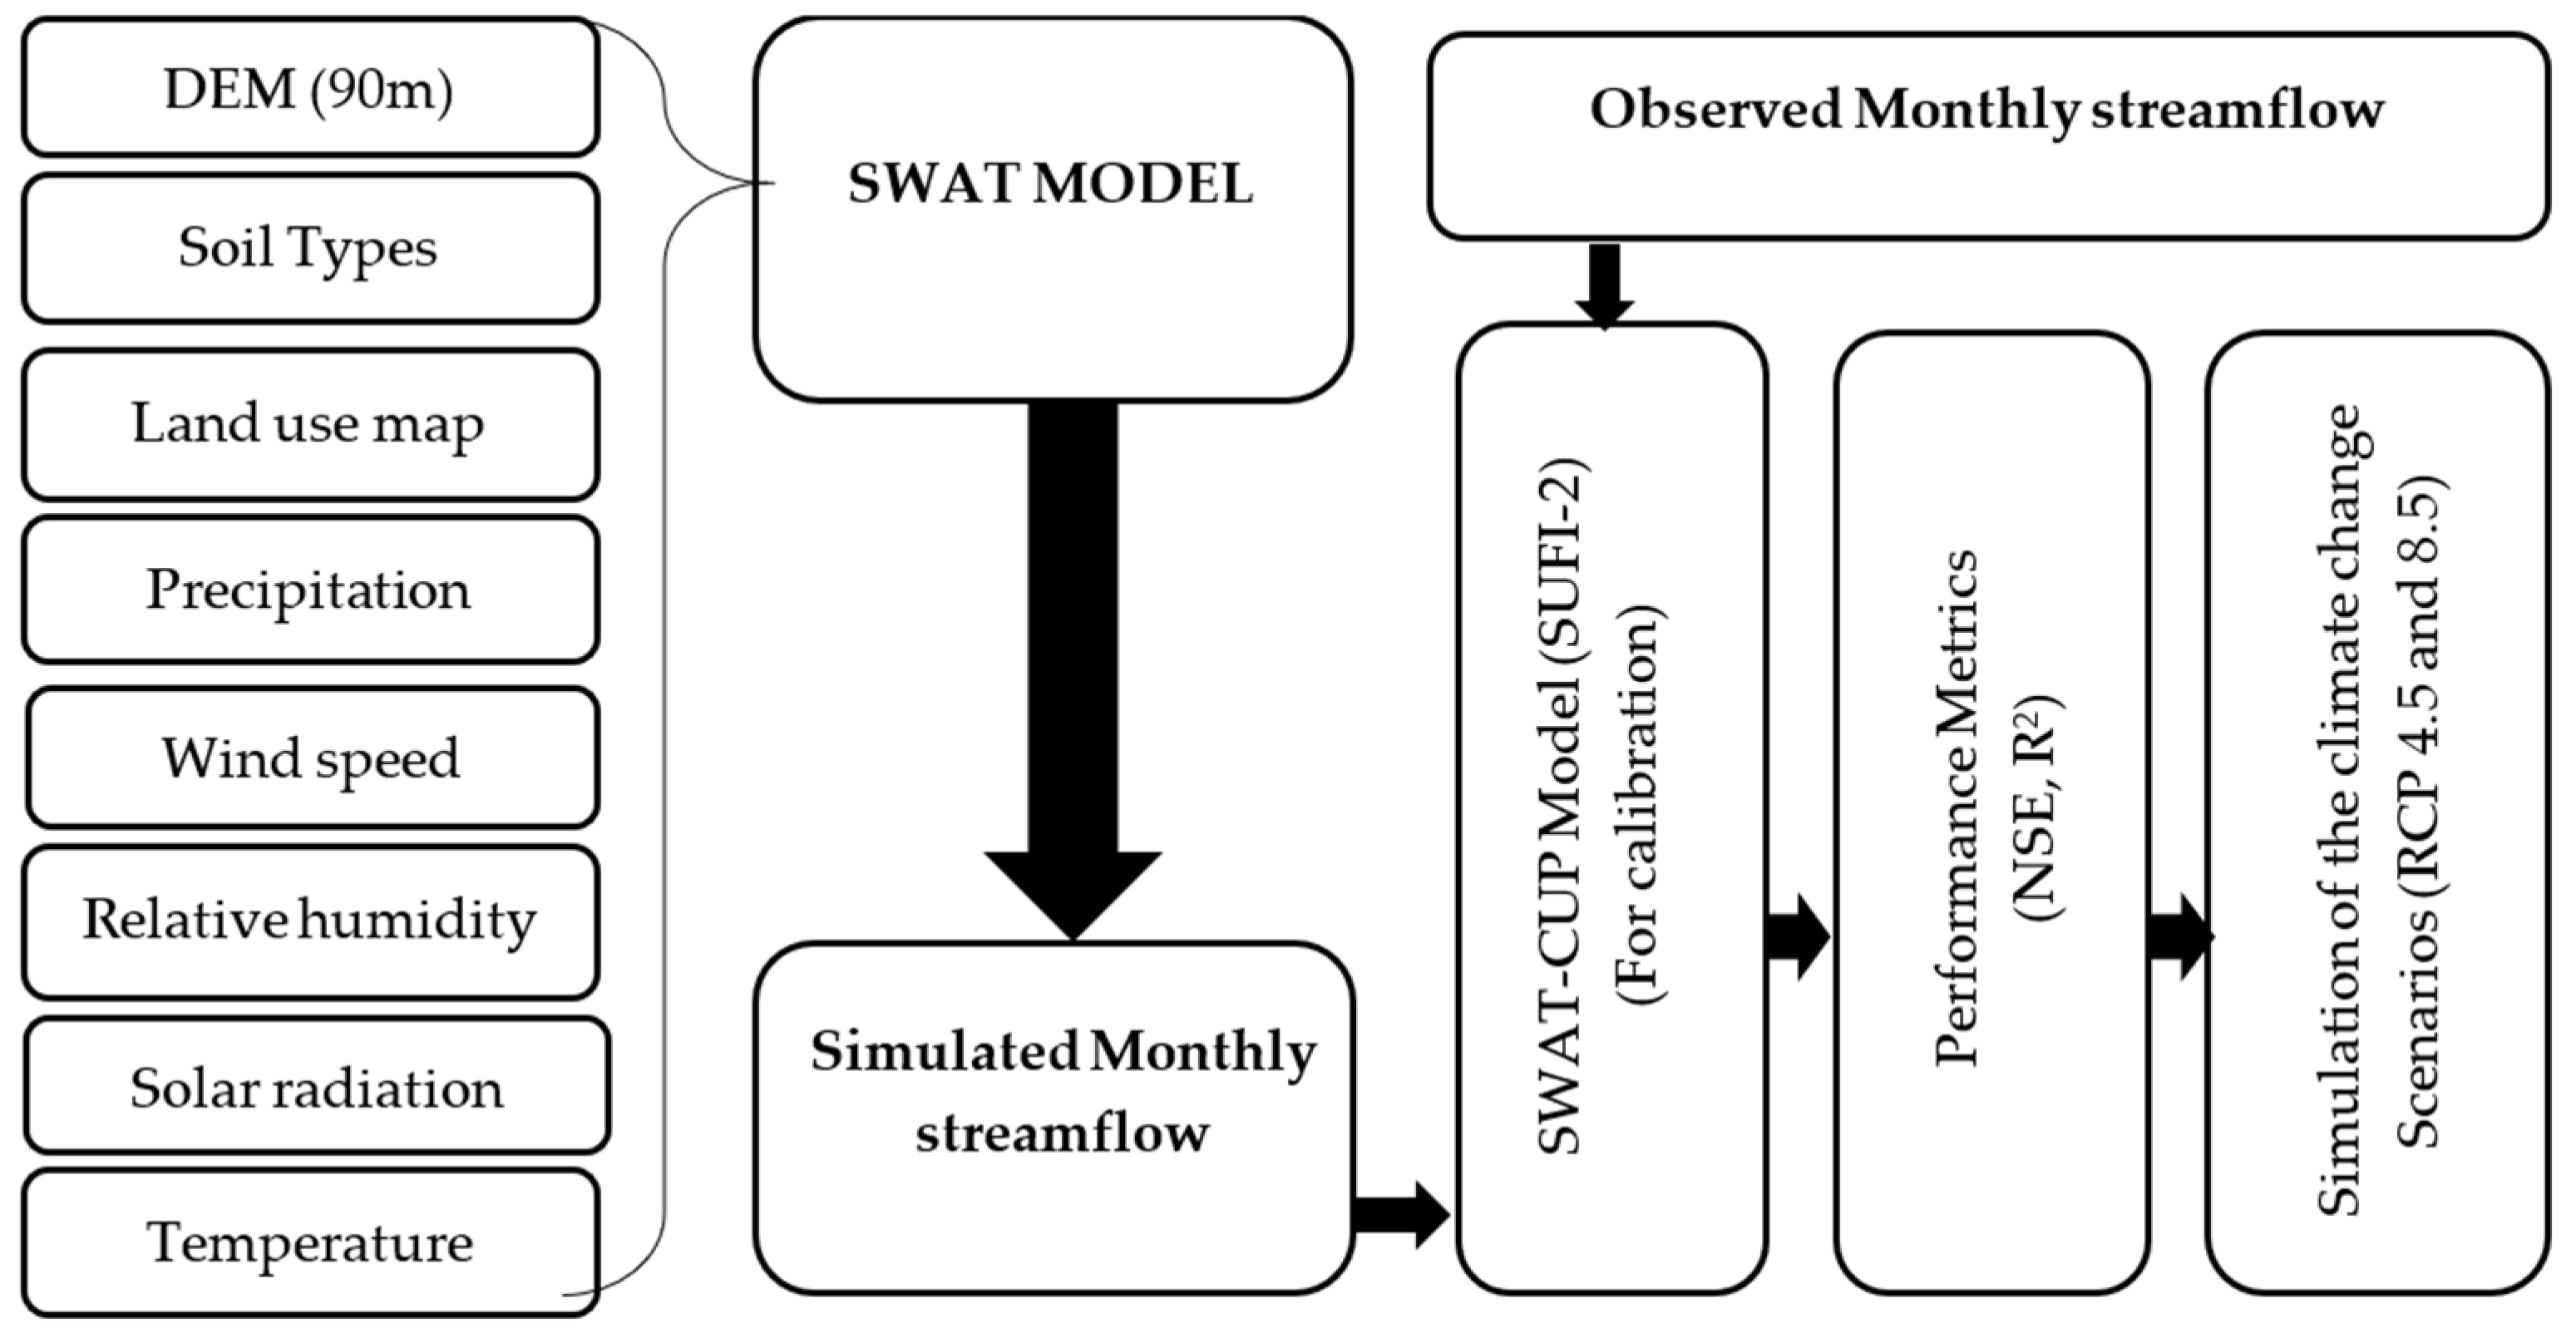
2.2. Methodological Framework

A methodological framework was established for simulating the streamflow at different stream-gauge stations across the basin, for which the SWAT model was used as the main processing engine [16] (Figure 2). The complete formulation of the SWAT model, including its parameterization, preparation of input data, discretization of the sub-basins, hydrological response units (HRUs), sensitivity analyses, and calibration and validation of the simulated data, is given in [16]. Upon validating the SWAT model, the climate change scenarios covering a period of 2014–2030 were used to assess its impacts over the streamflow at the designated streamflow gauging stations.

2.2.1. Establishing the SWAT model for the KRB
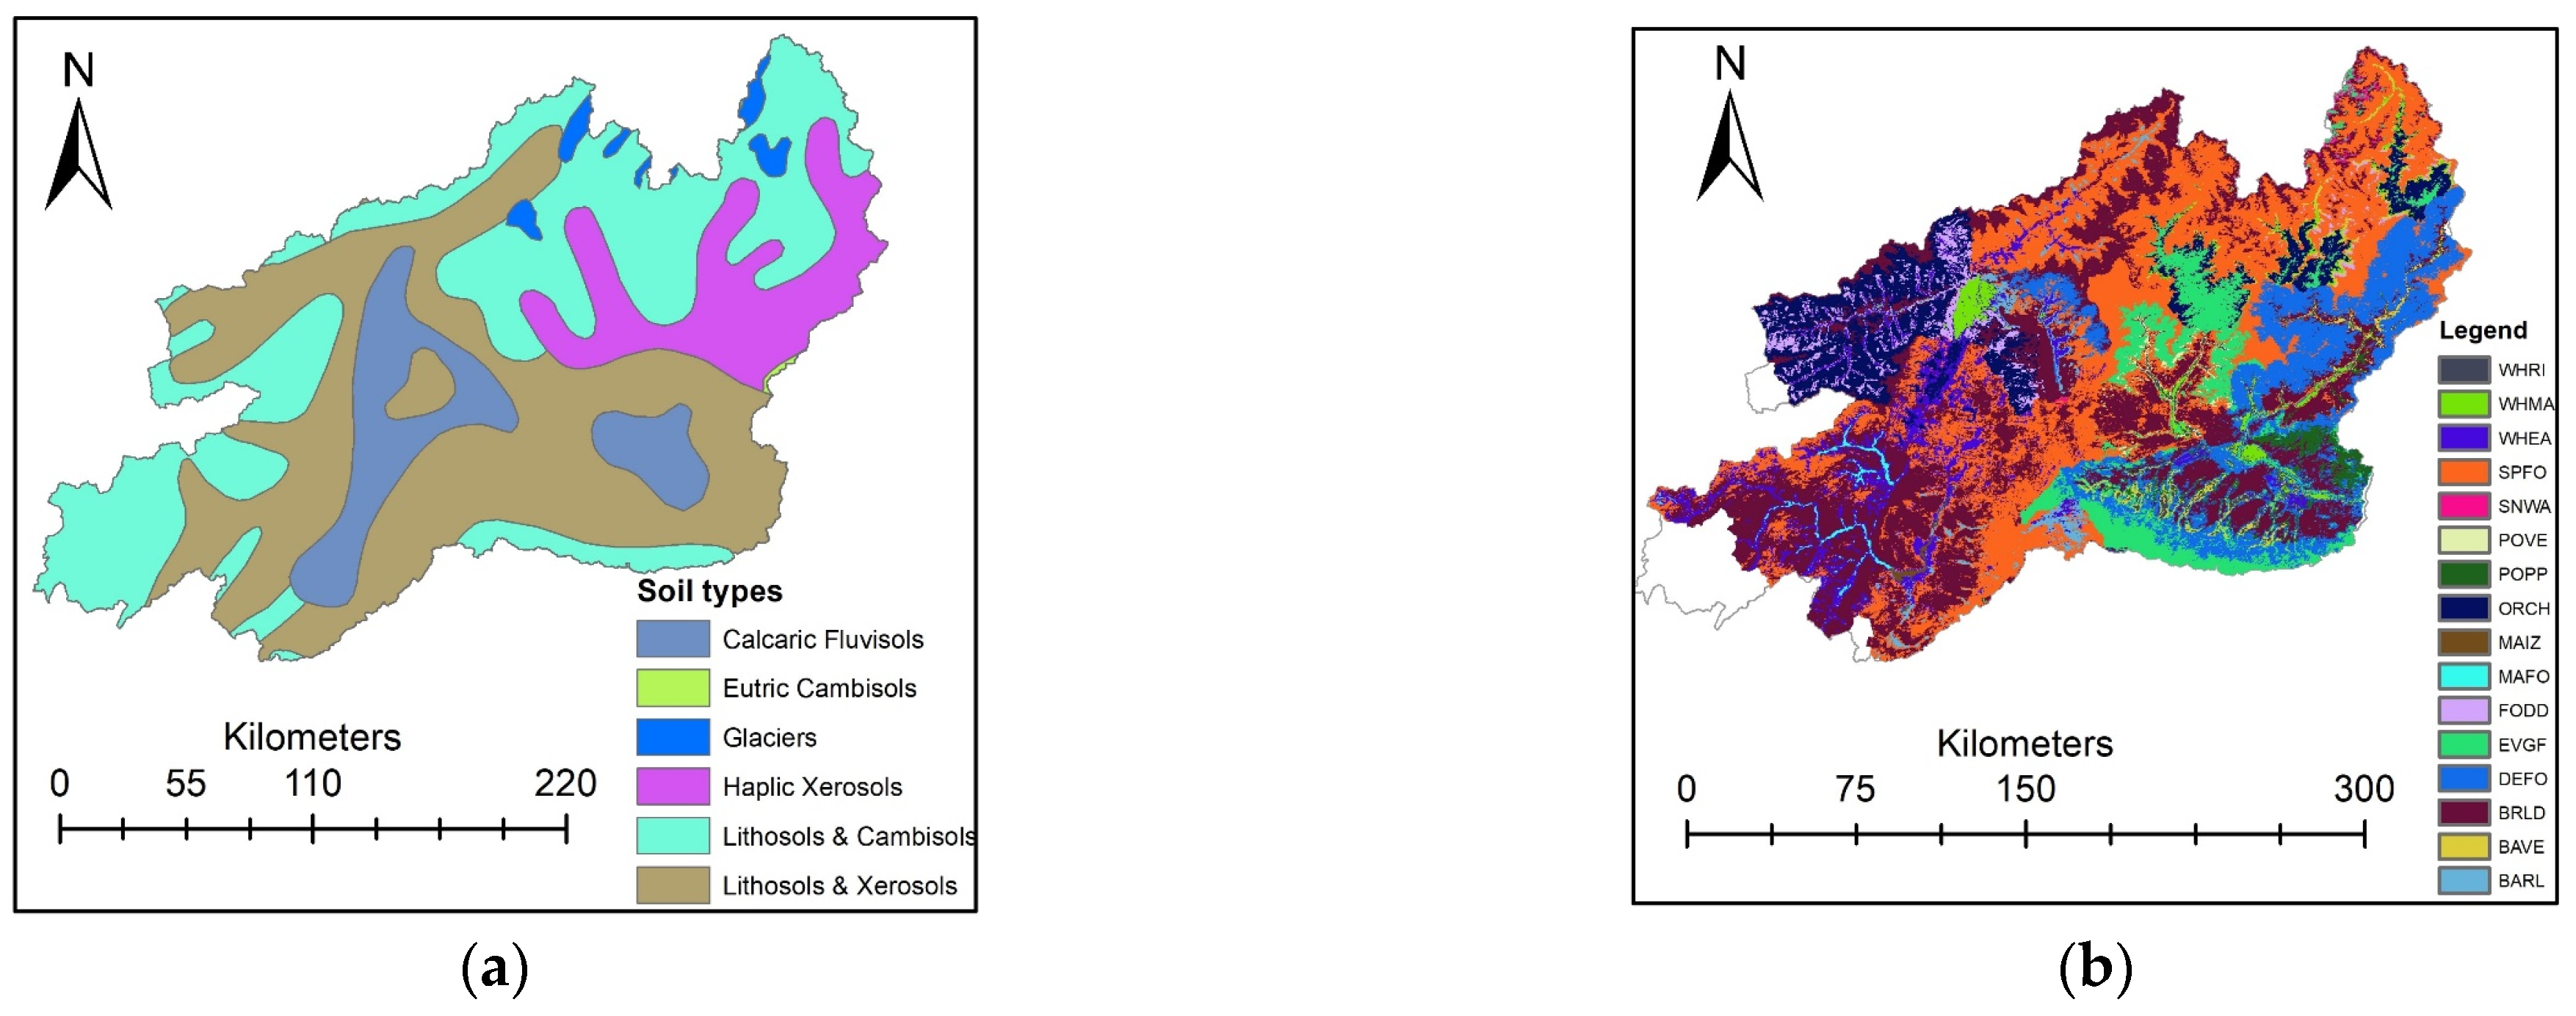
To evaluate the impacts of changes in climate on streamflow in the KRB, basic data such as the digital elevation model, LULC data, soil map, and climate data were prepared. In addition, the outflow points were identified, which could be used for flow monitoring and later on for calibration and validation. We describe the detailed processes of the SWAT model set up in the following subsections.

2.2.2. Model Inputs

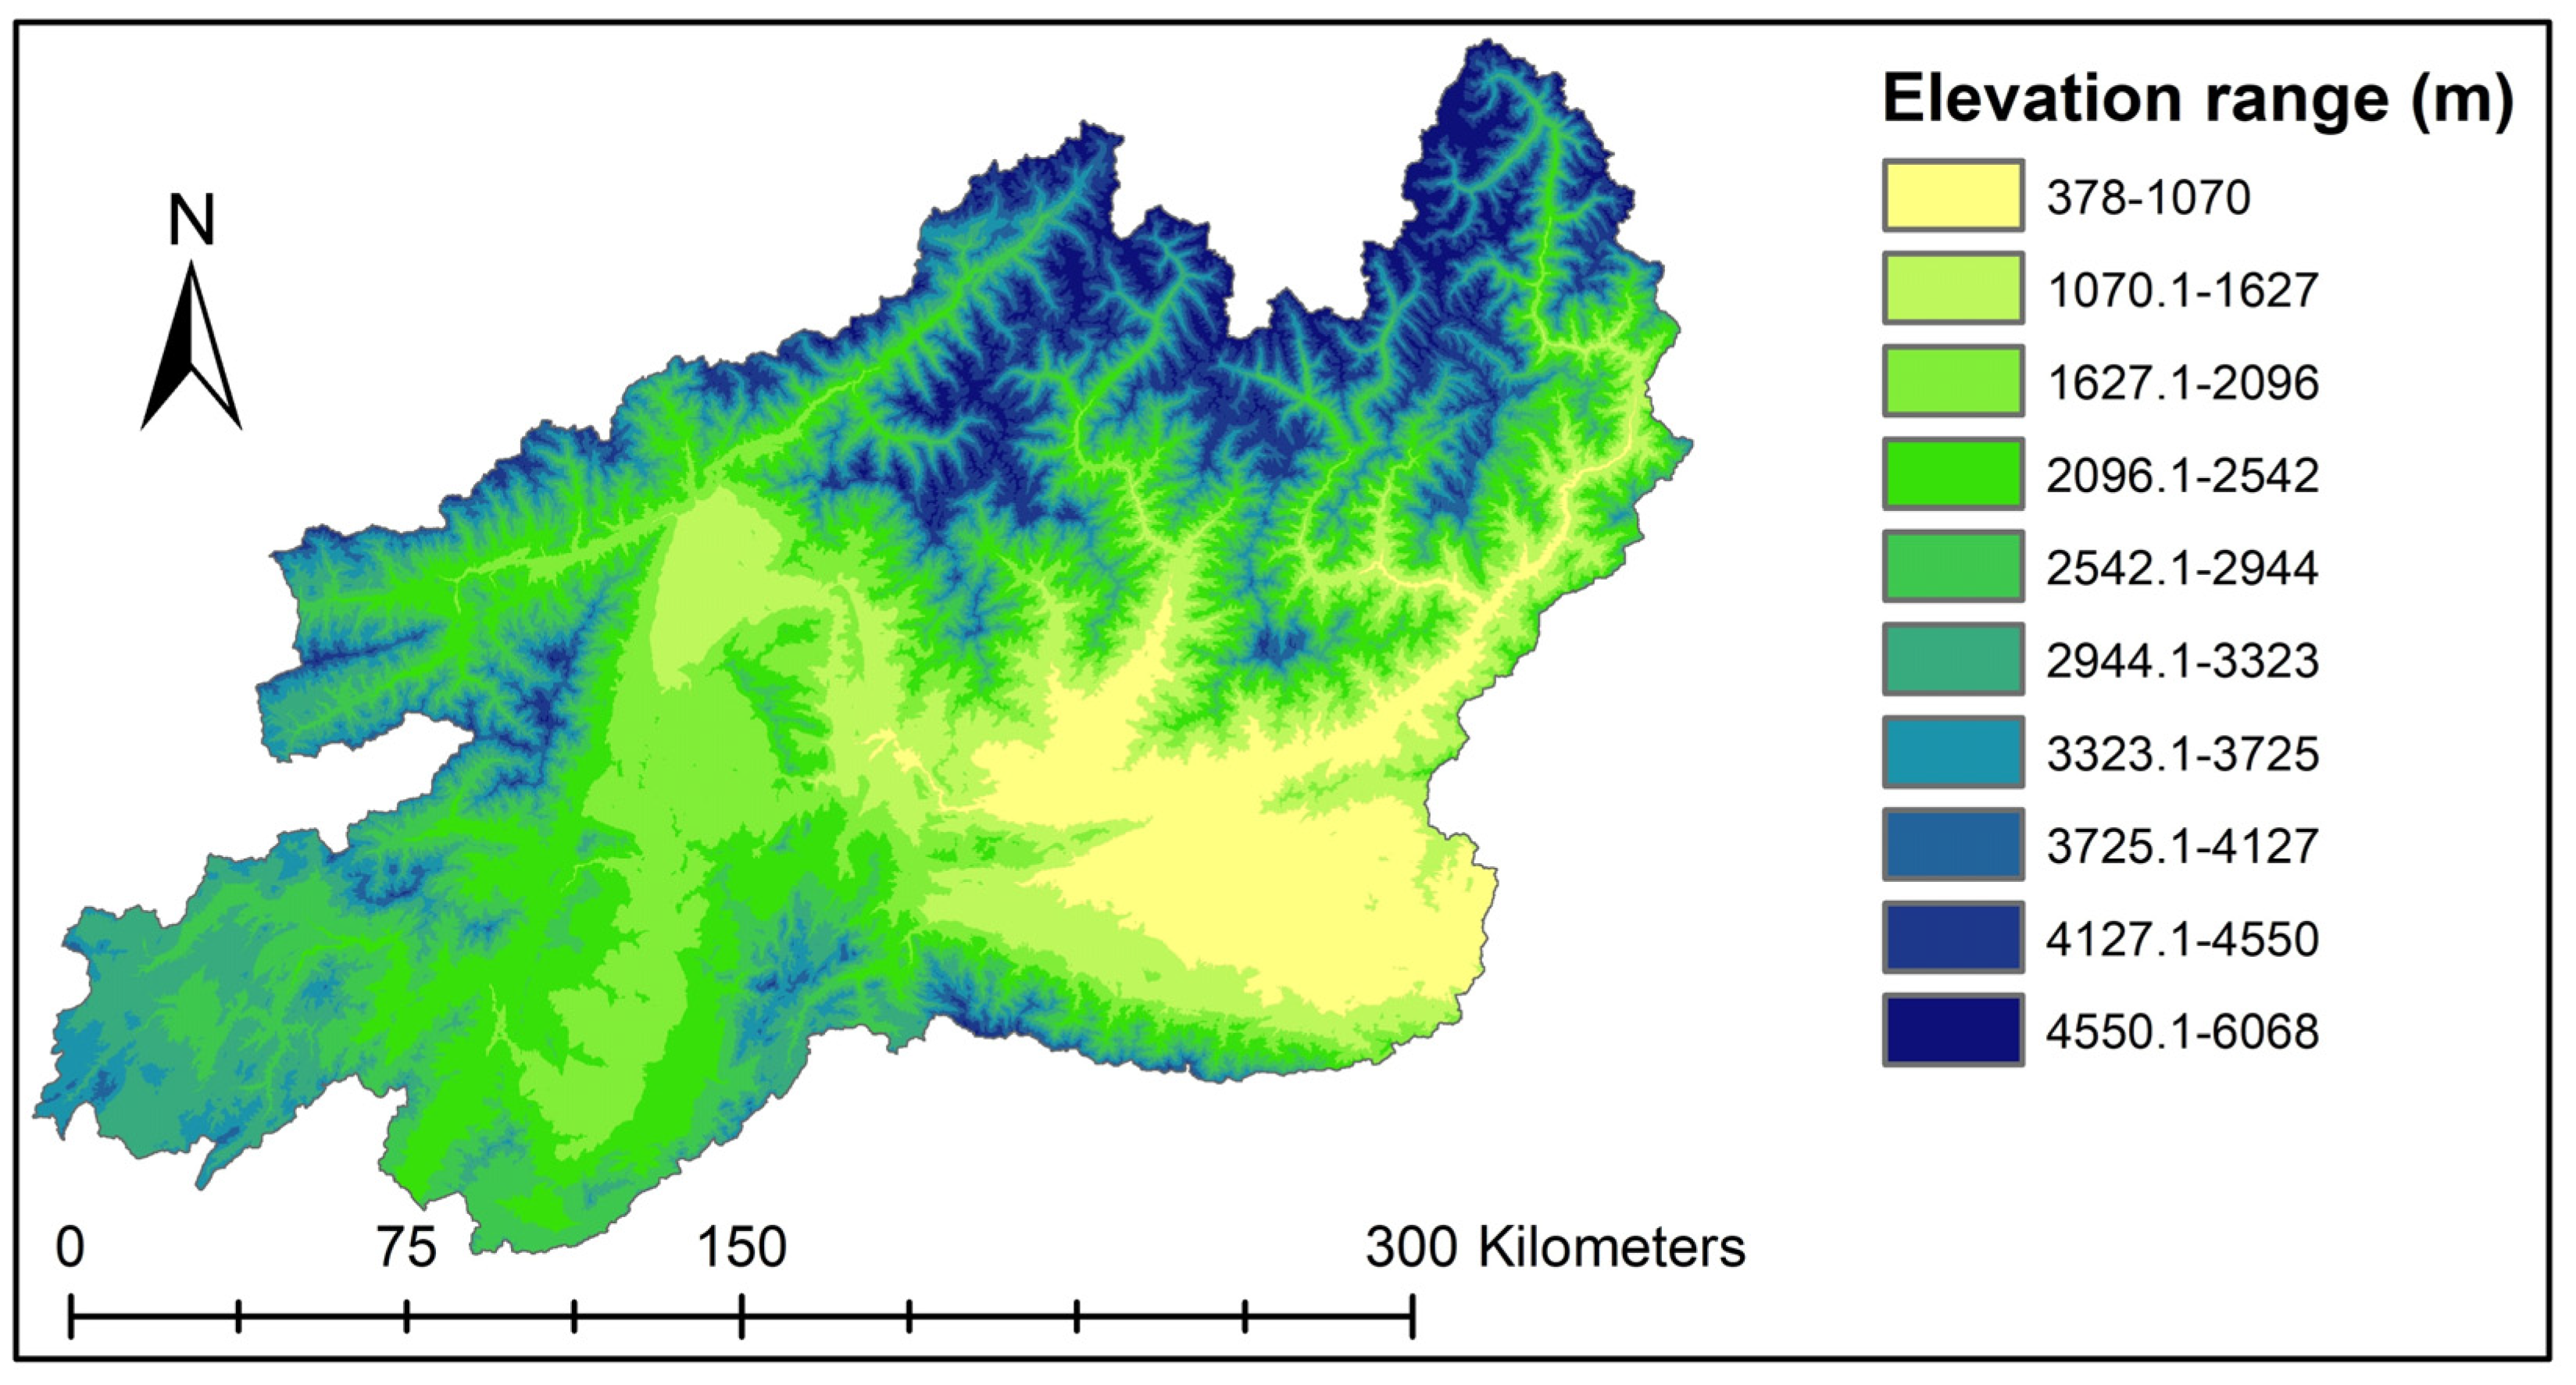
Digital Elevation Model

The delineation of a catchment is one of the fundamental processes for setting up the SWAT model; for this purpose, SRTM’s digital elevation model (DEM, 90 m) (Figure 3), pre-processed for clouds and voids by the USGS and was retrieved from the following domain: http://afghanistan.cr.usgs.gov (accessed on 11 February 2017). The entire watershed was delineated automatically; as a result, 32 sub-basins and 1065 hydrological response units (HRUs) were created. The watershed slope was extracted from the DEM through the Spatial Analysis tool embedded within the ArcGIS software. The SWAT model translated elevation (derived from the DEM) into a slope projection (by employing DEM as an input raster).

Soil, Land Use, and Land Cover Information

The various types of soil of the study region were masked from the soil database of the FAO [23]. Most of the study region’s soils are rocky and alkaline, with seven major soil types covering the entire area. Figure 4 below depicts the spatial distribution of these soil types.
Besides the LULC map, the soil map is another critical input of the SWAT model, which was utilized for determining the relevant hydrological parameters required for the crop database. The KRB’s LULC map [24] was used in this study, with a spatial resolution of 250 m prepared from the Normalized Difference Vegetation Index (NDVI) time series (i.e., MOD13Q1 and MYD13Q1) [25].

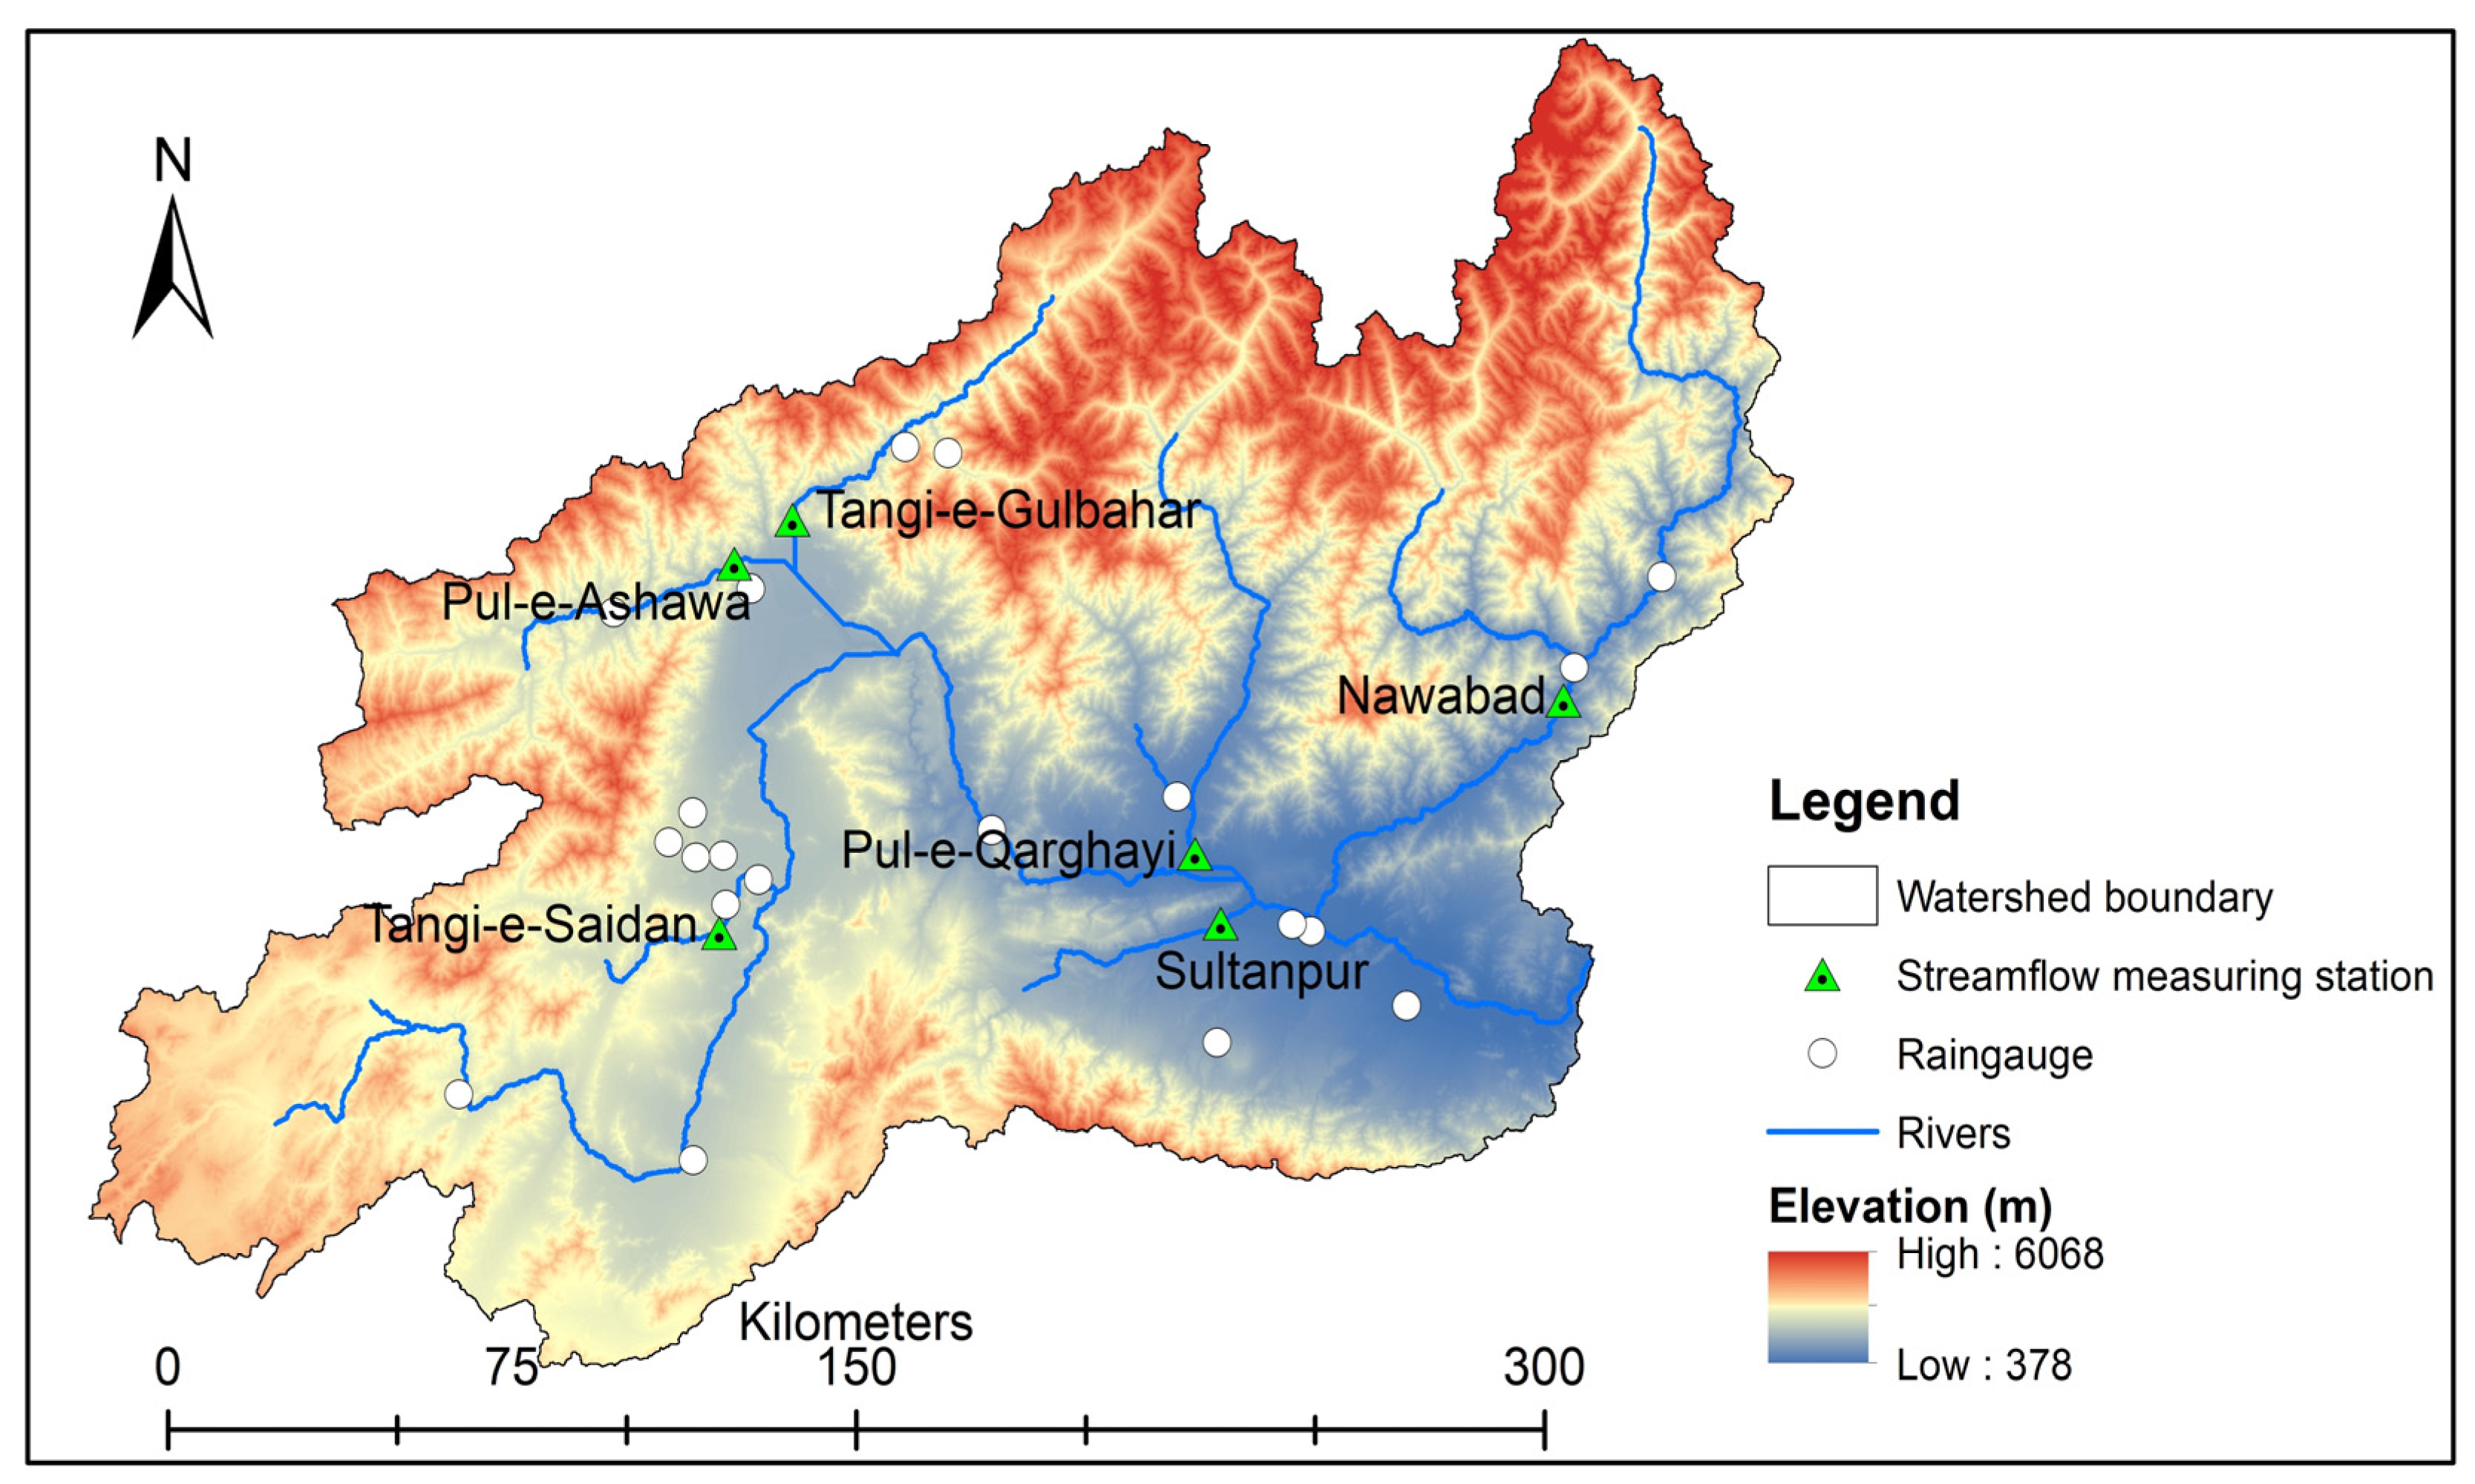
Climate and Streamflow Data

Among the climate dataset used in the SWAT model, daily rainfall data for 2008–2013 were collected from the 25 meteorological stations located at different sections of the KRB (Figure 5). The remaining parameters such as temperature, solar radiation, relative humidity, and wind speed were retrieved from the Climate Forecast System Reanalysis (CFSR) [26,27]. The monthly streamflow data were obtained from the six streamflow gauging stations in the KRB. The criteria used for the selection of these stations were to make sure: (1) no storage areas or reservoirs upstream of the station were made, and that (2) no major upstream diversions could influence the amount of streamflow at the streamflow gauging station.
The calibration and validation periods of the designated stations from where the observed streamflow data were collected are mentioned in the following table (Table 1).

2.3. Metrics Used for the Evaluation of the SWAT Model’s Performance

To verify the robustness and strength of the SWAT model, it is vital to evaluate its simulated results against actual observations by employing some known metrics. We, therefore, used the NSE [28] and R2; the NSE is often recommended for assessing the performance of the SWAT model for simulating streamflow against the observed streamflow. The NSE and R2 are already integrated with the SWAT Calibration and Uncertainty Programs (SWAT-CUP). The quality of fitness (observed and simulated streamflow) is computed by the NSE using the Equation (1):
NSE = 1 i = 0 n ( Q o b s , i Q s i m , i ) i 2 i = 0 n ( Q o b s , i Q ¯ o b s   ) i 2
where Qobs, Qsim, and Q ¯ o b s are the observed, simulated, and observed mean streamflow, respectively.
R2 was used to assess the correlation of the observed and simulated streamflow for calibration and validation.
R 2 = [ i = 1 n ( Q o b s , i Q ¯ o b s ) ( Q s i m , i Q ¯ s i m )   ] 2 i = 1 n ( Q o b s , i Q ¯ o b s )   2   i = 1 n ( Q s i m , i Q ¯ s i m )   2
where Q ¯ s i m is the simulated mean streamflow.

The SWAT Calibration and Uncertainty Programs

The Sequential Uncertainty Fitting (SUFI-2) algorithm integrated into SWAT-CUP was chosen to identify parameters that affect the streamflow [29]. The inconsistency between simulated and measured streamflow indicates uncertainty. The SUFI-2 links the uncertainty analyses and calibration to determine parameters’ uncertainties, resulting in errors in prediction and bracketing maximum observed data points (P factor) of the observed streamflow. The targeted output’s cumulative distribution is achieved by employing the Latin hypercube sampling method [30]. During calibration, the ranges of previously used parameters were rearranged to calculate the sensitivity matrix in each iteration [31]. The new set of sensitive parameters was adjusted; the newly adjusted value range was smaller than the previous ones. The following simulations were positioned around the best simulation achieved. The final simulations were then further assessed using specific criteria for the SWAT model’s performance evaluation [32]. Considering these rules, three statistics (quantitative) are proposed: NSE, PBIAS, and the RSR (ratio of RMSE and the standard deviation of the actual or observed data). Based on the acceptability ranges as suggested, the modeled streamflow results can be considered satisfactory only if NSE > 0.50.

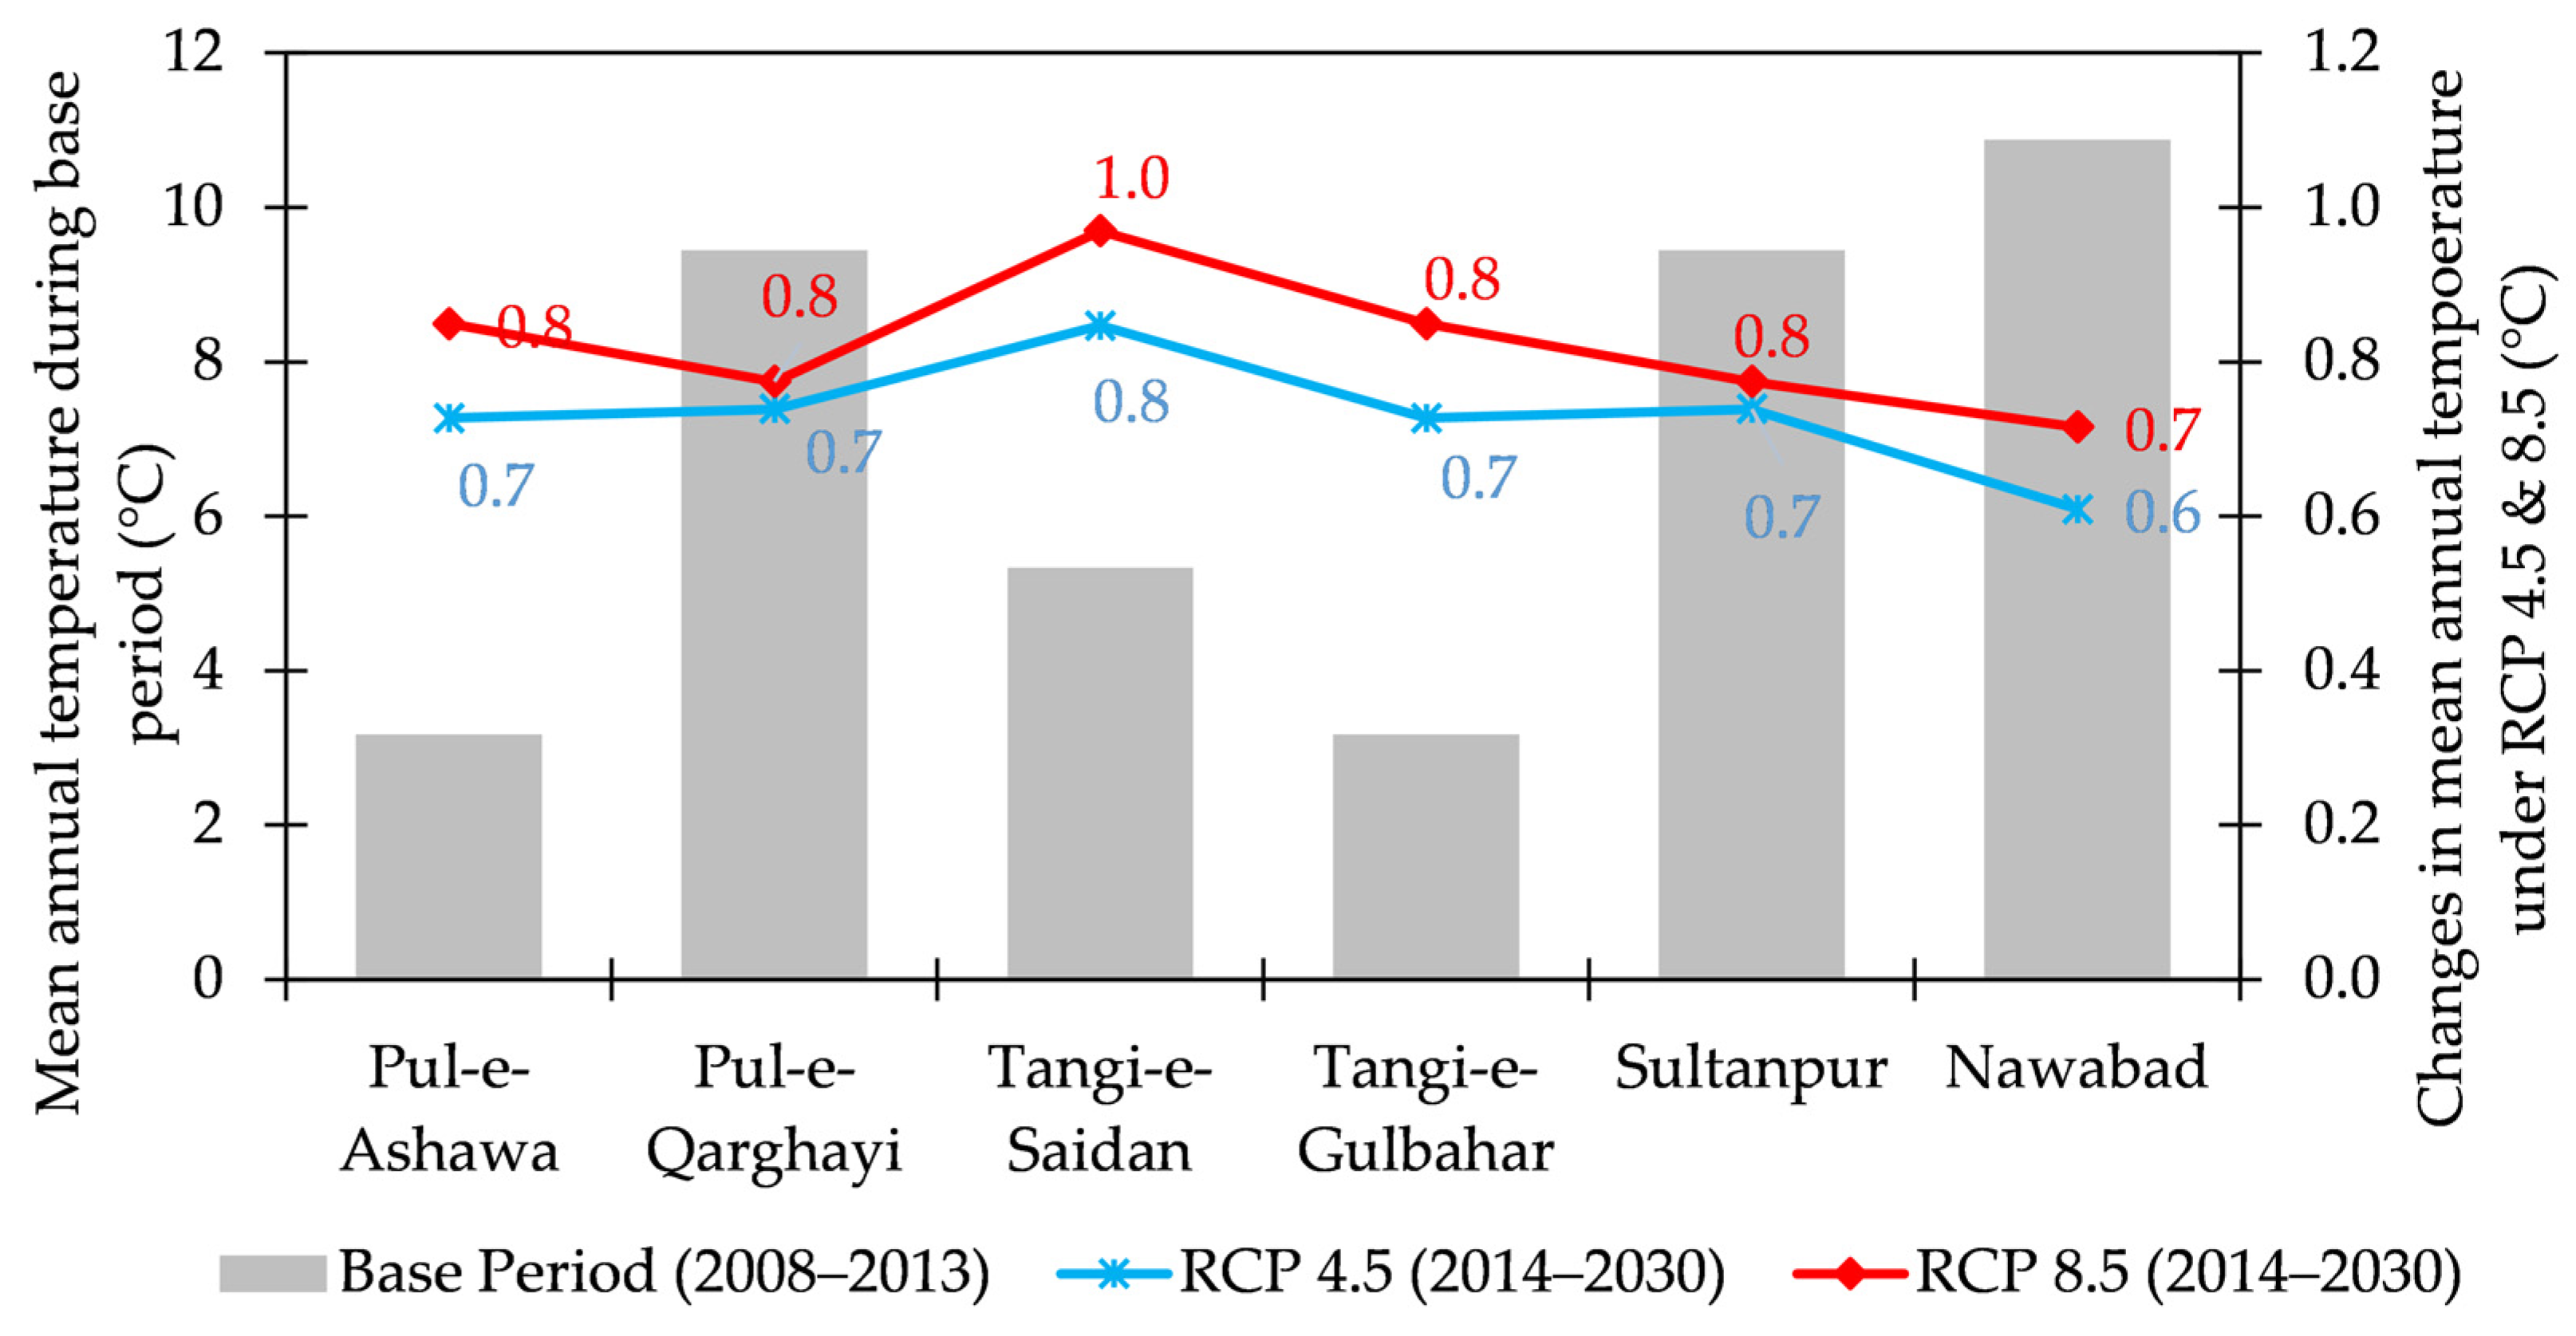
2.4. Future Climate Change Scenarios

The climate change scenarios, covering 2014 to 2030, were extracted from the South Asian domain of the Coordinated Regional Downscaling Experiment (CORDEX) [33]. CORDEX has produced an ensemble of regional projections of climate change for the South Asia region (50 km spatial resolution), thereby downscaling numerous CMIP5 (Coupled Model Inter-comparison Project phase 5) and AOGCMs (Atmosphere-Ocean Coupled Global Climate Models) outputs using multiple RCMs. The South Asian domain of CORDEX is managed and hosted by the Center for Climate Change Research (IITM). For extraction of the data for RCP 4.5 and 8.5, the regional circulation model (RegCM4-4) was used. The variables selected were mean daily temperature and precipitation. These scenarios were used in the validated SWAT model to simulate the future streamflow (e.g., 2014–2030) at the designated flow measurement stations in the KRB compared to the base period (e.g., 2008–2013). The changes in future streamflow were analyzed at annual time steps.

3. Results and Discussion

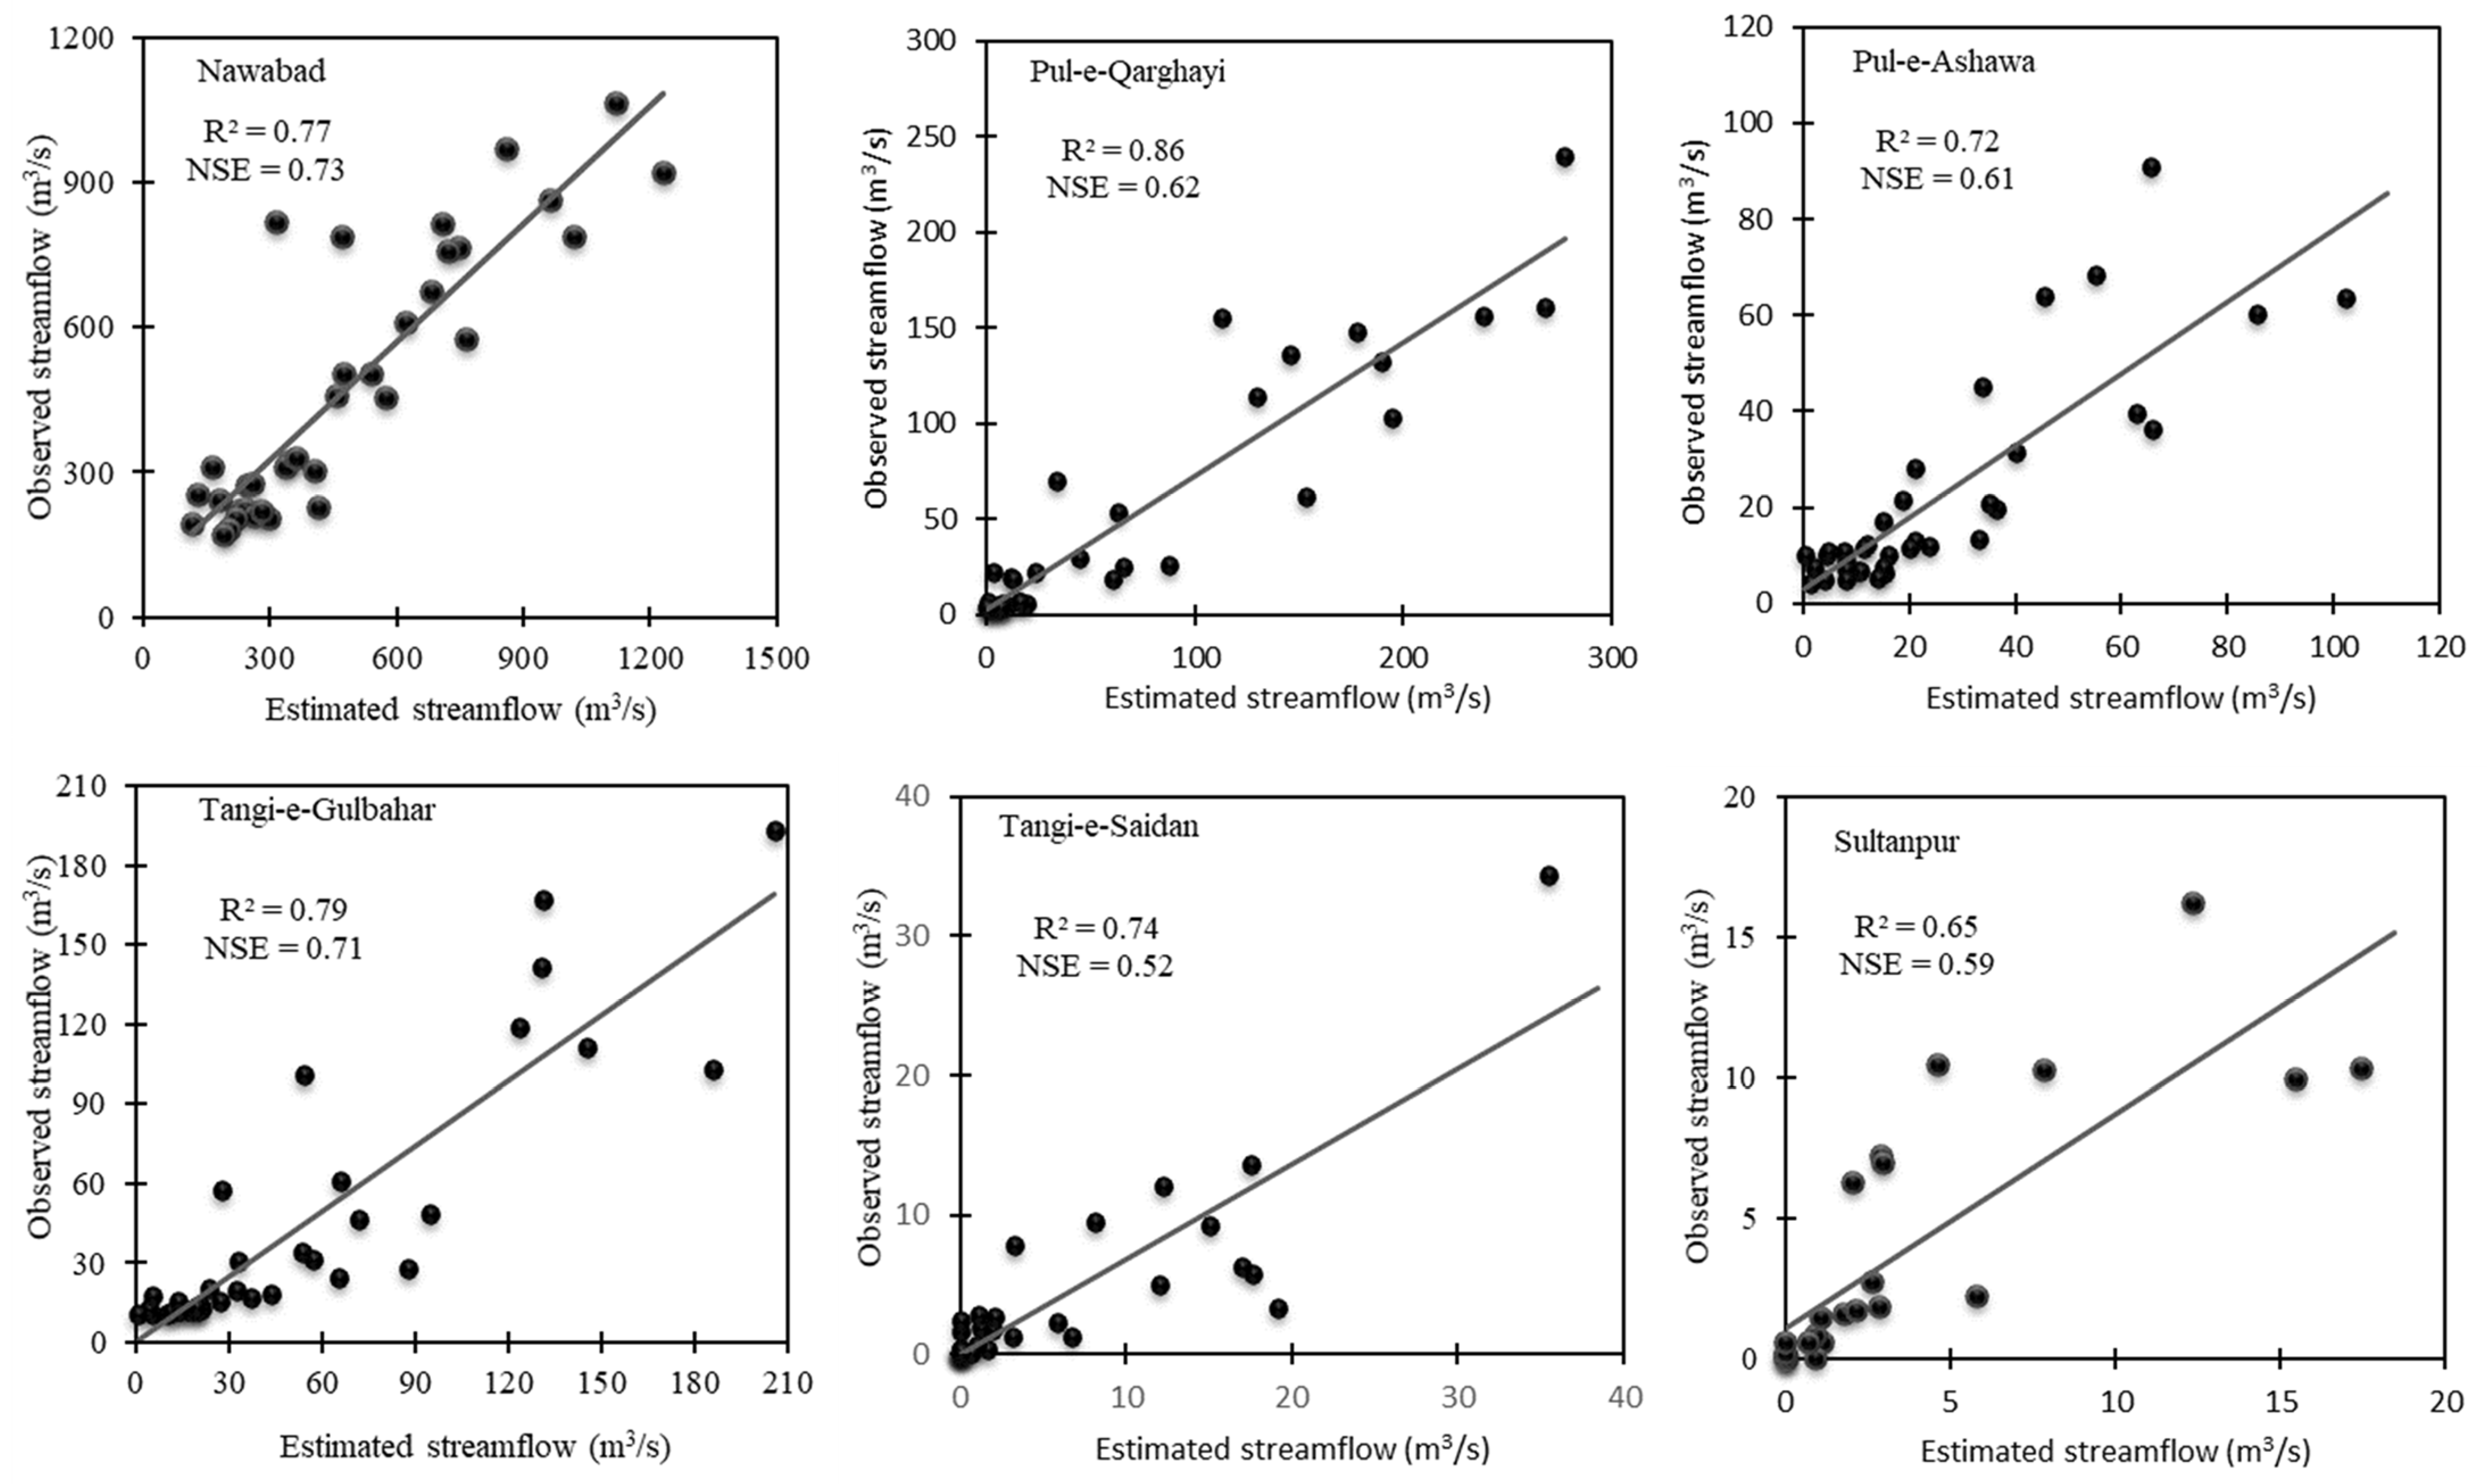
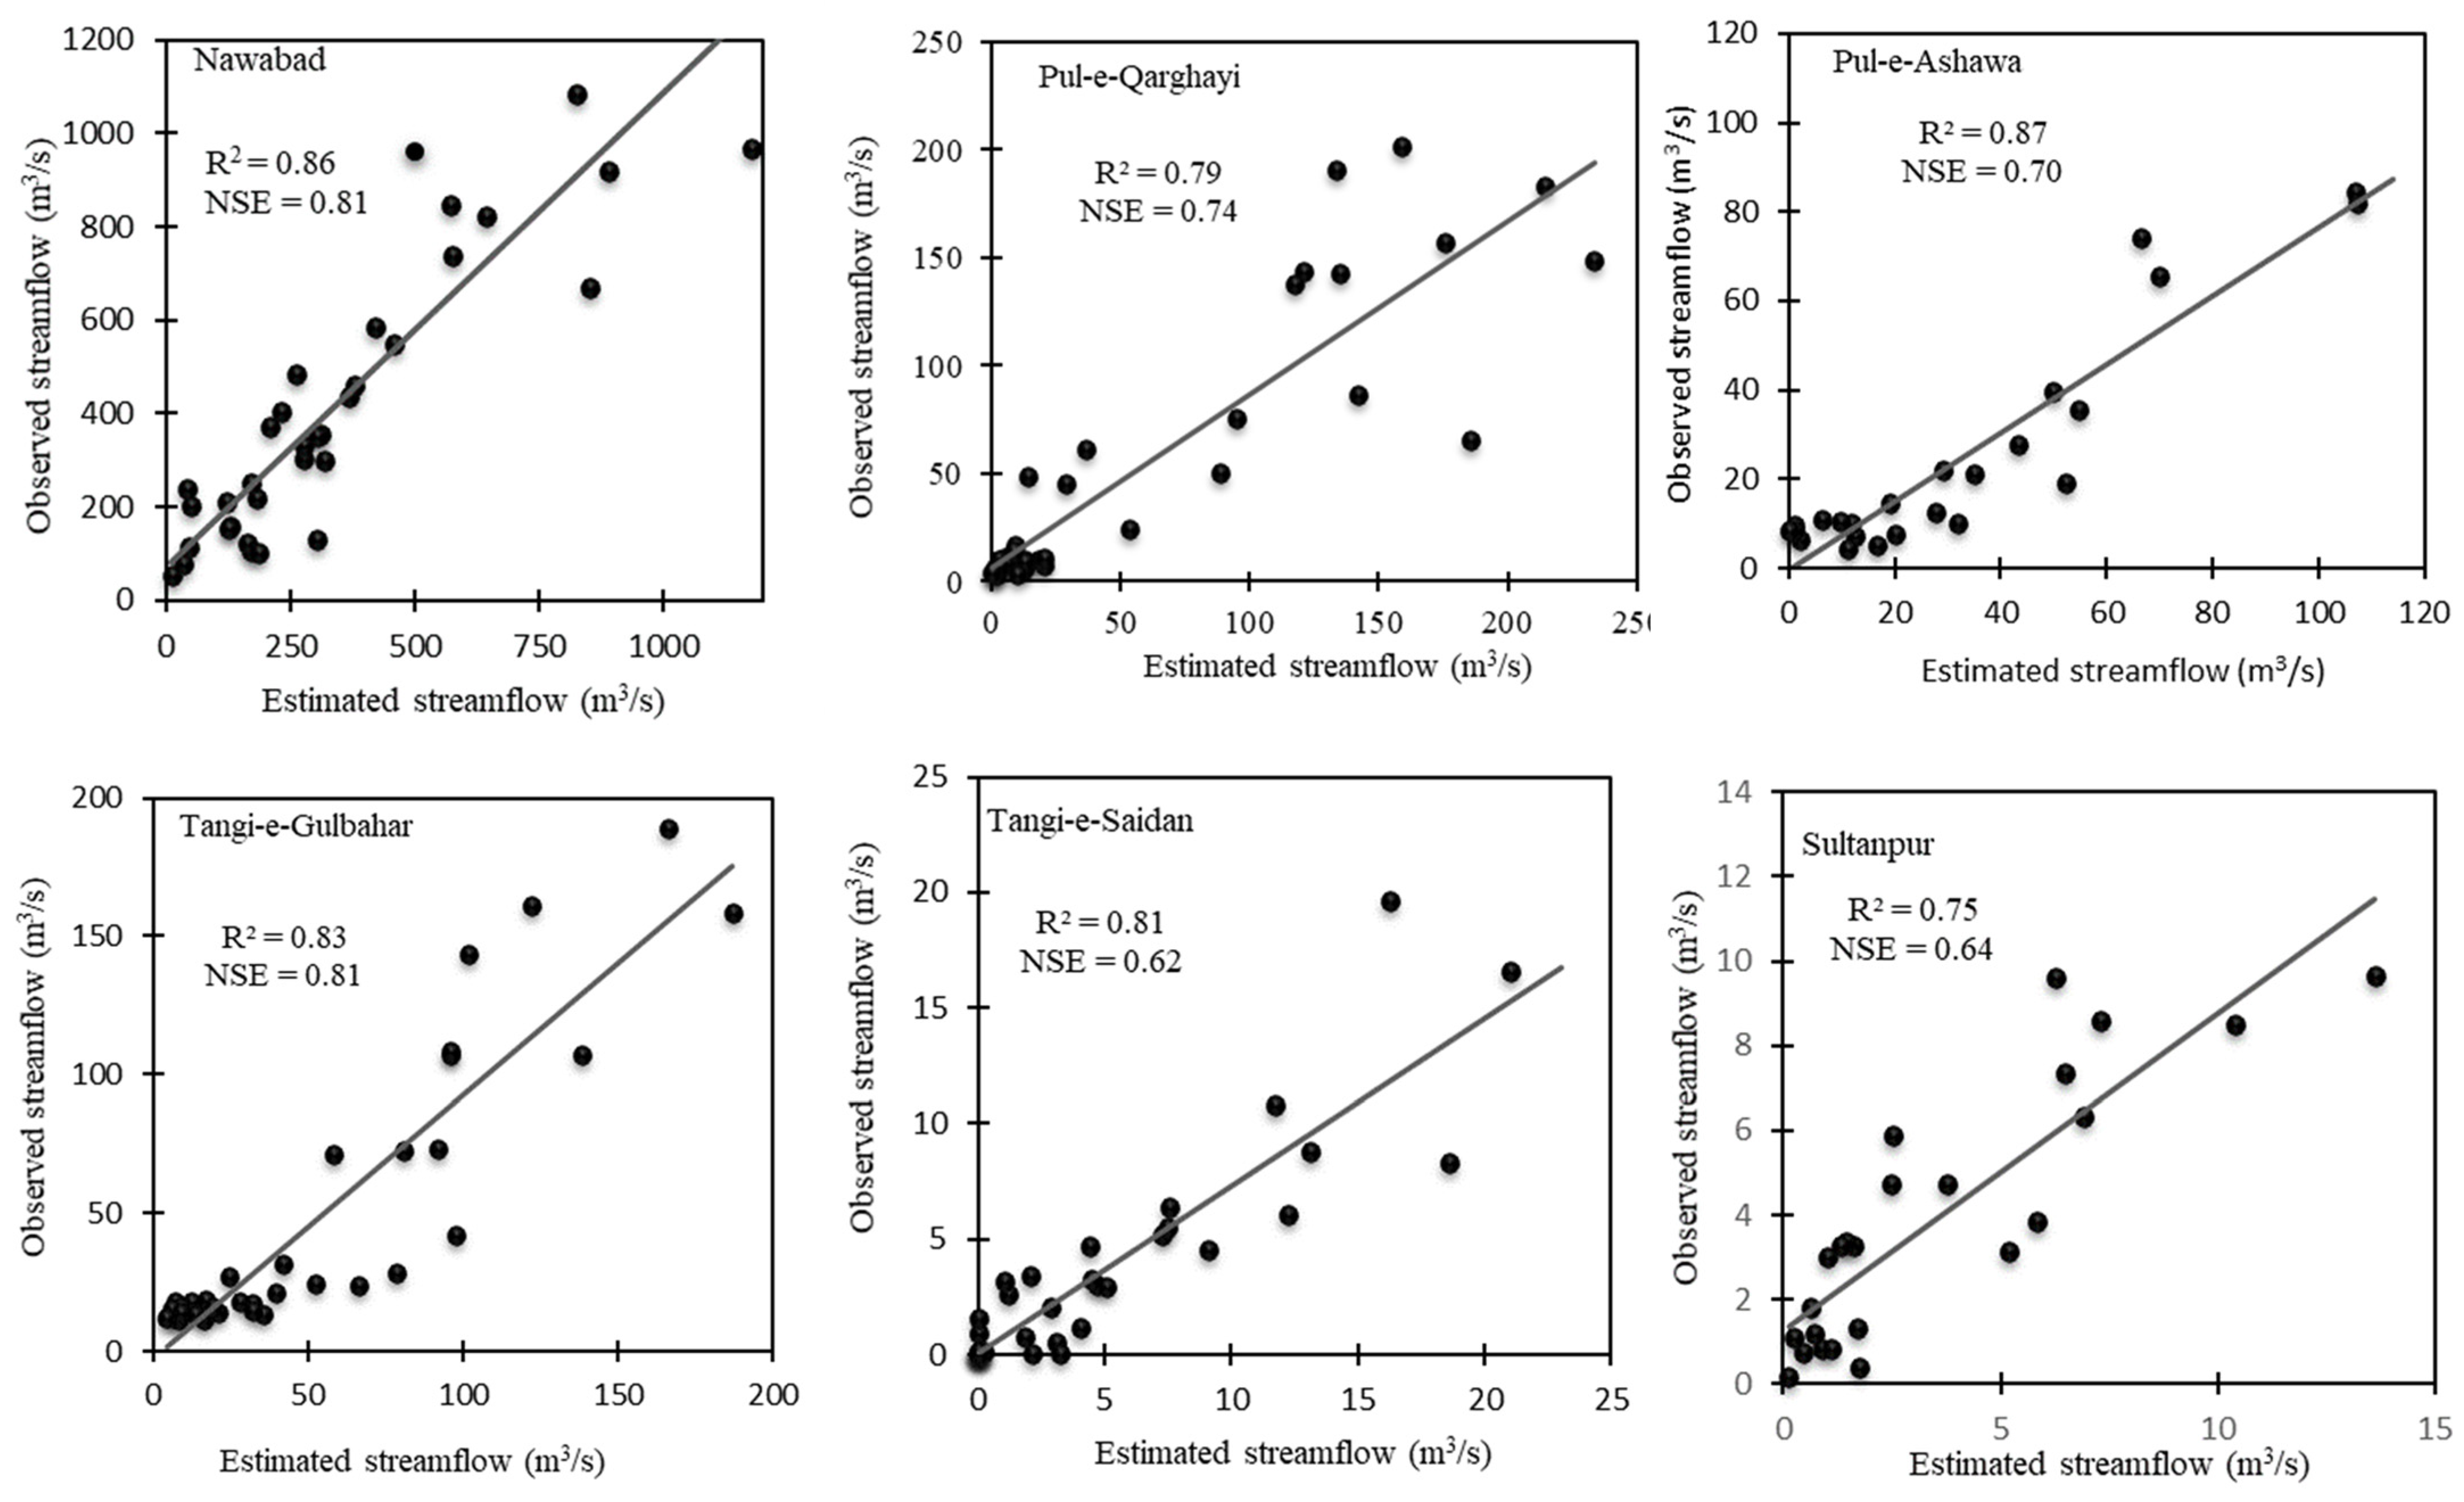
3.1. Calibration of the SWAT Model in Monthly Time Steps

The calibration outcomes of the SWAT simulations indicate that the NSE for Nawabad and Pul-e-Qarghayi streamflow gauging stations during the calibration period (2008–2010) were 0.81 and 0.74, respectively. Similarly, for Tangi-e-Gulbahar, the NSE was 0.81, while for Pul-e-Ashawa, it was 0.70. The R2 values for the aforementioned stations were 0.86, 0.79, 0.83, and 0.87, respectively. For seasonal and smaller discharging rivers at the Sultanpur and Tangi-e-Saidan and streamflow gauging stations, the NSE values were 0.64 and 0.62, respectively, while the R2 values were 0.75 and 0.81, respectively. Moriasi et al. (2007) suggest the NSE range, i.e., 0.50 < NSE < 0.65, for simulating the streamflow at monthly time steps is “satisfactory” and be accepted. The peak hydrograph from June to August at the Nawabad streamflow gauging station is due to an interplay between the early snowmelts and rainfall during the monsoon period (Figure 6). The peak hydrograph was observed during May–July at the Tangi-e-Gulbahar streamflow gauging station; the Pul-e-Ashawa experienced the same conditions (i.e., peak hydrograph during May–July), as this is the time where most of the snow has been melted. Ref. [34] reported a decrease in the mean annual streamflow in the Chitral watershed during 1989–2014; the sub-basin in Figure 1 has the same physiographic conditions (for being the neighboring watershed); therefore, the precipitation quantity and eventual climatic variation received at this sub-basin are the same. This decrease was attributed to the summer cooling, reduced snowmelt, and partial decrease in summer precipitation [34]. The results show that in 2008, the annual rainfall was below the average, and hence, 2008 can be considered a dry year. However, the hydrograph data show that the main part of the KRB received enough rainfall in 2009. The correlation of the estimated and observed streamflow of all the streamflow gauging stations is given in Figure 6.

3.2. Uncertainty Analysis

During the SWAT model’s calibration, 14 parameters were found to be very sensitive concerning the meteorological, topographical, geographical, and specific soil conditions in the KRB. The top four most sensitive parameters include CN2, SOL_BD, Alpha_BF, and GW_Delay; their relevant sensitivity rankings were 1–4, respectively. Table 2 provides the complete list of sensitive parameters used for validating the SWAT model. The rest of the parameters had no substantial effect on the results and were therefore ignored for the remaining iterations.

3.3. Validation of the SWAT Model in Monthly Time Steps

After reaching the objective function (i.e., NSE >0.50), the sensitive parameters were used for validating the streamflow for major streams covering the period of 2011–2013. During the validation process, a decline in the R2 and NSE between the estimated and observed streamflow was witnessed at most of the streamflow gauging stations (Figure 7). Therefore, the resulting NSE values for Tangi-e-Gulbahar, Pul-e-Ashawa, Nawabad, and Pul-e-Qarghayi, were 0.71, 0.61, 0.73, and 0.62, respectively; similarly, the R2 values of those stations were 0.79, 0.72, 0.77, and 0.86, respectively. For the rivers with seasonal and smaller discharge, such as Sultanpur and Tangi-e-Saidan, the NSE was 0.59 and 0.52, respectively, while the R2 values were 0.65 and 0.74, respectively. The overall range of R2 and NSE achieved in this study was in agreement with other similar studies performed at large heterogenic basins [35].
The model showed maximum uncertainty at the peak hydrograph stages, except for the Pul-e-Ashawa and Tangi-e-Saidan streamflow gauging stations. The uncertainty is most apparent at streamflow gauging stations that dry up during the months of June–December. Throughout the KRB, 2013 was marked the wettest with peak hydrograph, while 2011 was the driest year because of relatively low precipitation received. The relatively lower R2 and NSE during the calibration and validation period are because the streamflow gauges are either installed at non-representative sites or otherwise one or fewer gauging stations only at the outlet that measures the streamflow for a large heterogenic watershed and therefore causes uncertainty and errors in the streamflow simulation [36]. One of the SWAT model’s limitations in large catchments with dominant snowmelt and heterogenic topographic characteristics is the early start of the recession and rising hydrograph limb [37]. Moreover, the observed precipitation may not represent a whole (sub-) basin due to the aforementioned highly heterogenic landscape and natural features of the KRB; therefore, discrepancies arise between the simulated and actual streamflow. The SWAT model utilizes precipitation data from the nearest station to the centroid of the individual sub-basin (Thiessen polygon method) for calculating rainfall for each sub-basin. As a result, potentially imprecise representation of the precipitation for each sub-basin introduces bias due to the study region’s poor spatial distribution of rain gauges. According to [38], most of the alluvial fan regions across Afghanistan have watercourses and channels that are partly unlined, resulting in limited precision of streamflow measurement because there is no fixed cross-section. Despite the installation of streamflow gauging stations across the river network [8], there have been no proper maintenance plans that address consistent delays in publishing the hydrologic yearbook by the relevant public entity. The newly installed streamflow gauging stations can simultaneously measure more parameters (i.e., water level, rainfall, water quality, relative humidity, sunshine duration, temperature) [8]. It took two decades to train the relevant staff on handling, troubleshooting, and maintenance in case of instrumental glitches experienced by these devices. The usage and monitoring of these stations require careful handling while preparing the applicable investment plans and strategies for water resources management. The hydraulic infrastructure and hardware extension (i.e., dam, reservoir, canal, etc.) gain partial consideration at the policy and planning stage, but the data concerns often receive poor attention.

3.4. Impacts of Climate Change Scenarios on Streamflow

The impact of climate change scenarios on the streamflow from 2014 to 2030 at different gauging stations shows a 3.6–5% reduction in the mean annual streamflow, except for Nawabad station, where a 2.4% increase is projected under RCP 4.5, which can be attributed to the melting of glaciers and snowpacks. Similarly, a 1.1–8.5% reduction in the mean annual streamflow is projected under RCP 8.5, except for the Nawabad station, for which a 3.3% increase in streamflow is forecast (Table 3).
Under the RCP 4.5, the Nawabad station and its catchments would receive increased precipitation in a range of 827 ± 204 mm; the ranges at each station are shown in Figure 8. The extreme events in precipitation may be due to increased precipitation over the monsoon regions of Hindukush and Himalaya projected in both RCP 4.5 and 8.5 [39]. Since Nawabad and its entire watershed are within the monsoon-affected region, increased rainfall patterns in the future may increase the streamflow at these gauging stations. Similarly, under RCP 4.5 and during the proposed period (2014–2030), Pul-e-Ashawa and Tangi-e-Gulbahar catchment areas may receive mean annual precipitation of 427 ± 120 mm followed by catchment areas of Pul-e-Qarghayi and Sultanpur (610 ± 159 mm) and Tangi-e-Saidan (460 ± 119 mm). Pul-e-Qarghayi and Sultanpur catchment areas are also situated within the monsoon region and perhaps this is the reason for the forecasted increased rainfall pattern over the future decade. Overall, under the RCP 4.5, the in Pul-e Ashawa, Pul-e-Qarghayi, Tangi-e-Saidan, Tangi-e-Gulbahar, and Sultanpur station catchments, the precipitation is expected to reduce by 8.1%, 5.7%, 9.6%, 8.1%, and 5.4%, while Nawabad is expected to experience no considerable change. Similarly, under the RCP 8.5, the same stations are likely to experience reductions of 2.1%, 3.3%, 5%, 2.1%, and 3.3% in mean annual precipitation, while Nawabad is expected to receive around 6.2% of increased precipitation.
The increased streamflow (i.e., 3.3%) under RCP 8.5 at the Nawabad station is also attributed to the increased precipitation pattern over the monsoon regions of South Asia, which includes larger parts of the wider Indus Basin. While looking at the projected precipitation changes of the pre-mentioned streamflow gauging stations and their respective catchments (Figure 9), the Nawabad catchment would receive a wide range of precipitation without extreme events. While looking at the seasonal pattern of precipitation, Pul-e-Ashawa and Tangi-e-Saidan are expected to experience around 27% and 25% increases in winter precipitation under the RCP 4.5 and 8.5, respectively (Table 4); both the stations are likely to experience around 8% and 6% increases in summer precipitation under the RCP 4.5 and 8.5, respectively. Tangi-e-Saidan is expected to receive around 9.1% and 5.7% more summer precipitation. Almost all the stations are expected to experience a reduction in spring precipitation under both scenarios in the range of 0.5–15% except Pul-e-Qarghayi, Tangi-e-Saidan, and Sultanpur stations, which are likely to experience increases in precipitation by 6%, 19.4%, and 6%, respectively, under the RCP 8.5.
Figure 9 shows that under the RCP 4.5, the mean annual temperature at Pul-e Ashawa, Pul-e-Qarghayi, Tangi-e-Saidan, Tangi-e-Gulbahar, Sultanpur, and Nawabad stations is expected to increase by 0.7 °C, 0.7 °C, 0.8 °C, 0.7 °C, 0.7 °C, and 0.6 °C, respectively; similarly, under the RCP 8.5, the respective increase at these stations might be 0.8 °C, 0.8 °C, 1.0 °C, 0.8 °C, 0.8 °C, and 0.7 °C.
The increased temperatures may accelerate snow melting, temporally shift the hydrograph, and lead to higher rainfall intensities. Therefore, flash floods might challenge the existing agriculture and hydraulic infrastructure and cause erosion of the fertile soil layers. The situation might further escalate in case of changes in the LULC of the KRB. The relatively lower decrease in the mean annual streamflow can be attributed to the increment in the evapotranspiration rate due to increased temperature across the KRB. Meanwhile, the growing degree days might change the basin both up- and downstream, resulting in changes in crop growth periods.

4. Summary and Conclusions

Here, we demonstrated a methodology of how remote sensing derived products can feed into hydrological models to simulate the climate change impacts on streamflow in data-scarce environments. The modeling of future streamflow scenarios shows that Pul-e-Qarghayi, Pul-e-Ashawa, Tangi-e-Gulbahar, and Tangi-e-Saidan stations are likely to experience mean annual streamflow reductions of 4.3%, 3.6%, 3.8%, and 4.2%, respectively. In comparison, Nawabad is projected to experience an annual increase of 2.4% in streamflow under the RCP 4.5. Similarly, under the RCP 8.5, Pul-e-Qarghayi, Pul-e-Ashawa, Tangi-e-Gulbahar, and Tangi-e-Saidan are expected to experience decreases of 8.5%, 1.1%, 2.2%, and 3.7%, respectively, in mean annual streamflow. In comparison, Nawabad is expected to observe a 3.3% increase in the mean annual streamflow.
The increase in mean annual streamflow can be attributed to the melting of glaciers and snowpacks as well as a partial increase in the mean annual precipitation. The reduction in mean annual streamflow in the future highlights the vulnerability of the snow cover and the consequences for water availability in the KRB. Furthermore, part of the precipitation that used to occur in winter is being shifted to summer or monsoon rains; this shift is visible especially in the eastern part of the KRB. Table 4 shows that Pul-e-Ashawa, Tangi-e-Saidan, and Tangi-Gulbahar are likely to experience increases of 8%, 9.1%, and 8.% in summer precipitation under the RCP 4.5, respectively, and increases of 6%, 5.7%, and 5.5% under the RCP 8.5, respectively. Tangi-e-Siadan and Tangi-e-Gulbahar are likely to experience the highest decreases in autumn precipitation of 39.2% and 36.7%, respectively.
An essential feature of the water resources mismanagement in Afghanistan is the inadequate attention of the decision makers towards hydrological issues and the lack of reliable and high-quality data banks, which are imperative for sustainable management of water under SDG-6. The existing hydro-meteorological platforms measure fewer variables than required for accurate design and planning of water resources. For the time being, the association of global products and minimum ground data availability could partly tackle the urgent needs. However, the improvement of the hydro-meteorological network with a measurement facility for multiple variables is crucial.
The shift of precipitation from winter to summer will significantly impact the cropping pattern across the KRB. As depicted in this research, the extreme dependency on snowmelt indicates that irrigated agriculture may be the hardest hit in the future. This research, therefore, highlights the need for an engineering response to the anticipated water scarcity by carefully monitoring the water availability and establishing storage, reservoirs, and dams to be exploited during the peak demand period. Using remote sensing approaches, simulating different scenarios with the validated SWAT model can support adaptive water management of anticipated climate changes in data-scarce regions.

Author Contributions

Conceptualization, F.A., U.K.A. and B.T.; methodology, F.A., U.K.A. and B.T.; software, F.A.; validation, F.A., U.K.A. and B.T.; formal analysis, F.A.; investigation, F.A.; resources, F.A. and U.K.A.; data curation, F.A.; writing—original draft preparation, F.A.; writing—review and editing, U.K.A., C.B. and B.T.; visualization, F.A.; supervision, C.B. and B.T.; All authors have read and agreed to the published version of the manuscript.

Funding

This research received no external funding.

Institutional Review Board Statement.

Not applicable.

Informed Consent Statement

Not applicable.

Data Availability Statement

The data used in this study has been collected by the corresponding author and the data-sources have been already mentioned in the manuscript.

Acknowledgments

The corresponding author of this research paper has been supported by the Sustainable Development Goal (SDG) Fellowship of the University of Bonn (Germany).

Conflicts of Interest

The authors declare no conflict of interest.

References

  1. Cassidy, R. Lives with others: Climate change and human-animal relations. Annu. Rev. Anthropol. 2012, 41, 21–36. [Google Scholar] [CrossRef]
  2. Pokhrel, Y.; Felfelani, F.; Satoh, Y.; Boulange, J.; Burek, P.; Gädeke, A.; Gerten, D.; Gosling, S.N.; Grillakis, M.; Gudmundsson, L.; et al. Global terrestrial water storage and drought severity under climate change. Nat. Clim. Chang. 2021, 11, 226–233. [Google Scholar] [CrossRef]
  3. Sýs, V.; Fošumpaur, P.; Kašpar, T. The Impact of Climate Change on the Reliability of Water Resources. Climate 2021, 9, 153. [Google Scholar] [CrossRef]
  4. Mengistu, D.; Bewket, W.; Dosio, A.; Panitz, H.-J. Climate change impacts on water resources in the Upper Blue Nile (Abay) River Basin, Ethiopia. J. Hydrol. 2021, 592, 125614. [Google Scholar] [CrossRef]
  5. Petr, T. Fish and Fisheries at Higher Altitudes: Asia; Food & Agriculture Organization of the United Nations: Rome, Italy.
  6. Tavva, S.; Abdelali-Martini, M.; Aw-Hassan, A.; Rischkowsky, B.; Tibbo, M.; Rizvi, J. Gender roles in agriculture: The case of Afghanistan. Indian J. Gend. Stud. 2013, 20, 111–134. [Google Scholar] [CrossRef]
  7. Akhtar, F.; Awan, U.K.; Tischbein, B.; Liaqat, U.W. Assessment of irrigation performance in large river basins under data scarce environment—A case of Kabul river basin, Afghanistan. Remote. Sens. 2018, 10, 972. [Google Scholar] [CrossRef] [Green Version]
  8. FAO. Afghanistan: Geography, Climate and Population. 2015. Available online: http://www.fao.org/nr/water/aquastat/countries_regions/afg (accessed on 29 April 2015).
  9. Bank, W. Afghanistan Scoping Strategic Options for Development of the Kabul River Basin: A Multisectoral Decision Support System Approach. 2010. Available online: http://hdl.handle.net/10986/18422 (accessed on 11 October 2021).
  10. FAO. Rehabilitating Irrigation in Afghanistan 2021. Available online: https://www.fao.org/land-water/news-archive/news-detail/en/c/267315/ (accessed on 15 September 2021).
  11. Mack, T.J.; Chornack, M.P.; Taher, M.R. Groundwater-level trends and implications for sustainable water use in the Kabul Basin, Afghanistan. Environ. Syst. Decis. 2013, 33, 457–467. [Google Scholar] [CrossRef] [Green Version]
  12. Lin, B.; Chen, X.; Yao, H.; Chen, Y.; Liu, M.; Gao, L.; James, A. Analyses of landuse change impacts on catchment runoff using different time indicators based on SWAT model. Ecol. Indic. 2015, 58, 55–63. [Google Scholar] [CrossRef]
  13. Vaze, J.; Post, D.A.; Chiew, F.H.S.; Perraud, J.-M.; Teng, J.; Viney, N.R. Conceptual rainfall–runoff model performance with different spatial rainfall inputs. J. Hydrometeorol. 2011, 12, 1100–1112. [Google Scholar] [CrossRef]
  14. Perrin, C.; Michel, C.; Andréassian, V. Improvement of a parsimonious model for streamflow simulation. J. Hydrol. 2003, 279, 275–289. [Google Scholar] [CrossRef]
  15. Chiew, F.; Peel, M.; Western, A. Application and testing of the simple rainfall-runoff model SIMHYD. In Mathematical Models of Small Watershed Hydrology and Applications; Water Resources Publications: Littleton, CO, USA, 2002; pp. 335–367. [Google Scholar]
  16. Arnold, J.G.; Srinivasan, R.; Muttiah, R.S.; Williams, J.R. Large area hydrologic modeling and assessment part I: Model development 1. JAWRA J. Am. Water Resour. Assoc. 1998, 34, 73–89. [Google Scholar] [CrossRef]
  17. Shawul, A.A.; Alamirew, T.; Dinka, M. Calibration and validation of SWAT model and estimation of water balance components of Shaya mountainous watershed, Southeastern Ethiopia. Hydrol. Earth Syst. Sci. Discuss. 2013, 10, 13955–13978. [Google Scholar]
  18. Koycegiz, C.; Buyukyildiz, M.; Kumcu, S.Y. Spatio-temporal analysis of sediment yield with a physically based model for a data-scarce headwater in Konya Closed Basin, Turkey. Water Supply 2021, 21, 1752–1763. [Google Scholar] [CrossRef]
  19. Mosavi, A.; Golshan, M.; Choubin, B.; Ziegler, A.D.; Sigaroodi, S.K.; Zhang, F.; Dineva, A.A. Fuzzy clustering and distributed model for streamflow estimation in ungauged watersheds. Sci. Rep. 2021, 11, 1–14. [Google Scholar] [CrossRef]
  20. ILOSTAT. Country Profile: Afghanistan. 2021. Available online: https://ilostat.ilo.org/data/country-profiles/ (accessed on 24 November 2021).
  21. Akhtar, F. Water Availability and Demand Analysis in the Kabul River Basin; University of Bonn: Bonn, Germany, 2017. [Google Scholar]
  22. Sidiqi, M.; Shrestha, S.; Ninsawat, S. Projection of climate change scenarios in the Kabul River Basin, Afghanistan. Curr. Sci. India 2018, 114, 1304–1310. [Google Scholar] [CrossRef]
  23. FAO. Digital Soil Map of the World and Derived Soil Properties; Food and Agriculture Organization: Rome, Italy, 1995. [Google Scholar]
  24. Akhtar, F.; Awan, U.K.; Tischbein, B.; Liaqat, U.W. A phenology based geo-informatics approach to map land use and land cover (2003–2013) by spatial segregation of large heterogenic river basins. Appl. Geogr. 2017, 88, 48–61. [Google Scholar] [CrossRef]
  25. Vuolo, F.; Mattiuzzi, M.; Klisch, A.; Atzberger, C. Data Service Platform for MODIS Vegetation Indices Time Series Processing at BOKU Vienna: Current Status and Future Perspectives. Available online: https://www.spiedigitallibrary.org/conference-proceedings-of-spie/8538/85380A/Data-service-platform-for-MODIS-Vegetation-Indices-time-series-processing/10.1117/12.974857.short?SSO=1 (accessed on 11 October 2021).
  26. Dile, Y.T.; Srinivasan, R. Evaluation of CFSR climate data for hydrologic prediction in data-scarce watersheds: An application in the Blue Nile River Basin. JAWRA J. Am. Water Resour. Assoc. 2014, 50, 1226–1241. [Google Scholar] [CrossRef]
  27. Fuka, D.R.; Walter, M.T.; MacAlister, C.; Degaetano, A.T.; Steenhuis, T.S.; Easton, Z.M. Using the climate forecast system reanalysis as weather input data for watershed models: Using CFSR as weather input data for watershed models. Hydrol. Process. 2013, 28, 10073. [Google Scholar] [CrossRef]
  28. Nash, J.E.; Sutcliffe, J.V. River flow forecasting through conceptual models part I—A discussion of principles. J. Hydrol. 1970, 10, 282–290. [Google Scholar] [CrossRef]
  29. Abbaspour, K.C. User Manual for SWAT-CUP, SWAT Calibration and Uncertainty Analysis Programs; Swiss Federal Institute of Aquatic Science and Technology: Duebendorf, Switzerland, 2007; p. 93. [Google Scholar]
  30. Iman, R.L.; Davenport, J.M.; Zeigler, D.K. Latin Hypercube Sampling (Program User’s Guide); Sandia Labs: Albuquerque, NM, USA, 1980. [Google Scholar]
  31. Magnus, J.; Neudecker, H. Matrix Differential CalculusWith Applications in Statistics and Econometrics; JohnWiley: Chichester, UK, 1988. [Google Scholar]
  32. Moriasi, D.N.; Arnold, J.G.; Van Liew, M.W.; Bingner, R.L.; Harmel, R.D.; Veith, T.L. Model evaluation guidelines for systematic quantification of accuracy in watershed simulations. Trans. ASABE 2007, 50, 885–900. [Google Scholar] [CrossRef]
  33. Sanjay, J.; Ramarao, M.V.S.; Mujumdar, M.; Krishnan, R. Regional climate change scenarios. In Observed Climate Variability and Change over the Indian Region; Springer: Berlin/Heidelberg, Germany, 2017; pp. 285–304. [Google Scholar]
  34. Ahmad, S.; Israr, M.; Liu, S.; Hayat, H.; Gul, J.; Wajid, S.; Ashraf, M.; Baig, S.U.; Tahir, A.A.; Gul, J. Spatio-temporal trends in snow extent and their linkage to hydro-climatological and topographical factors in the Chitral River Basin (Hindukush, Pakistan). Geocarto Int. 2020, 35, 711–734. [Google Scholar] [CrossRef]
  35. Cao, W.; Bowden, W.B.; Davie, T.; Fenemor, A. Multi-variable and multi-site calibration and validation of SWAT in a large mountainous catchment with high spatial variability. Hydrol. Process. Int. J. 2006, 20, 1057–1073. [Google Scholar] [CrossRef]
  36. Srinivasan, R.; Ramanarayanan, T.S.; Arnold, J.G.; Bednarz, S.T. Large area hydrologic modeling and assessment part II: Model application 1. JAWRA J. Am. Water Resour. Assoc. 1998, 34, 91–101. [Google Scholar] [CrossRef]
  37. Fontaine, T.; Cruickshank, T.; Arnold, J.; Hotchkiss, R. Development of a snowfall–snowmelt routine for mountainous terrain for the soil water assessment tool (SWAT). J. Hydrol. 2002, 262, 209–223. [Google Scholar] [CrossRef]
  38. Shroder, J.F.; Ahmadzai, S.J. Transboundary Water Resources in Afghanistan: Climate Change and Land-Use Implications; Elsevier: Amsterdam, The Netherlands, 2016. [Google Scholar]
  39. Palazzi, E.; Von Hardenberg, J.; Provenzale, A. Precipitation in the Hindu-Kush Karakoram Himalaya: Observations and future scenarios. J. Geophys. Res. Atmos. 2013, 118, 85–100. [Google Scholar] [CrossRef]
Figure 1. Map of the Kabul River Basin with river network and delineated watersheds.
Sustainability 13 14025 g001
Figure 2. Methodological framework for the streamflow estimation in the Kabul River Basin.
Sustainability 13 14025 g002
Figure 3. Elevation map of the Kabul River Basin.
Sustainability 13 14025 g003
Figure 4. Spatial distribution of different soil types (a) and land use and land cover classes (b) across the Kabul River Basin.
Sustainability 13 14025 g004
Figure 5. Location of the streamflow and meteorological stations across the Kabul River Basin.
Sustainability 13 14025 g005
Figure 6. Calibration of simulated streamflow referring to gauging stations in the Kabul River Basin.
Sustainability 13 14025 g006
Figure 7. Validation of simulated streamflow referring to gauging stations in the Kabul River Basin.
Sustainability 13 14025 g007
Figure 8. Projected changes (%) in precipitation under the RCP 4.5 and 8.5 (2014–2030) compared to the base period (2008–2013).
Sustainability 13 14025 g008
Figure 9. Projected changes (°C) in the mean annual temperature under the RCP 4.5 and 8.5 (2014–2030) compared to the base period (2008–2013)
Sustainability 13 14025 g009
Table 1. Calibration and validation period of the monitoring points.
S. No.StationRiverCalibration PeriodValidation Period
1NawabadKunar2008–20102011–2013
2Pul-e-QarghayiLaghman2008–20102011–2013
3Pul-e-AshawaGhorband2008–20102011–2013
4Tangi-e-GulbaharPanjshir2008–20102011–2013
5Tangi-e-SaidanKabul2008–20102011–2013
6SultanpurSurkhrod2009–20112012–2013
Table 2. Sensitive parameters used for calibration of the streamflow at the Kabul River Basin (KRB).
S. No.ParameterSensitivity RankingFitted ValueParametric Range
Min ValueMax Value
1* r__CN2.mgt1−0.49−0.49−0.48
2r__SOL_BD().sol2−0.02−0.02−0.01
3** v__ALPHA_BF.gw30.190.180.22
4v__GW_DELAY.gw4160.64160.34166.11
5v__REVAPMN.gw519.8919.5119.93
6v__GWQMN.gw643.4943.4344.24
7v__EPCO.bsn70.280.270.28
8v__ESCO.bsn80.490.440.50
9v__CH_N2.rte90.190.180.19
10v__SMTMP.bsn10−3.61−3.70−3.55
11v__SMFMX.bsn1113.4112.5513.60
12v__SMFMN.bsn128.908.559.25
13v__TIMP.bsn130.150.150.16
14v__SURLAG.bsn141.761.521.97
* r_: an existing parameter value is multiplied by (1 + a given value). ** v: the existing value is replaced by the new value.
Table 3. Impact of RCP 4.5 and RCP 8.5 scenarios on streamflow by 2030.
RCP 4.5RCP 8.5
StationMean Annual Observed Streamflow During the Base Period (2008–2013) (Mm3)Streamflow by 2030 (Mm3)Change (%) in StreamflowStreamflow by 2030 (Mm3)Change (%) in Streamflow
Nawabad13,58413,9102.4%14,0333.3%
Pul-e-Qarghayi16111542−4.3%1474−8.5%
Pul-e-Ashawa729707−3.6%721−1.1%
Tangi-e-Gulbahar13871332−3.8%1357−2.2%
Tangi-e-Saidan127122−4.2%135−3.7%
Sultanpur121115−5.0%113−6.3%
Table 4. Seasonal variation in precipitation under the RCP 4.5 and 8.5 (2014–2030) compared to the base period (2008–2013).
Name of the StationWinter (December–February)Spring (March–May)Summer (June–August)Autumn (September–November)
RCP 4.5RCP 8.5RCP 4.5RCP 8.5RCP 4.5RCP 8.5RCP 4.5RCP 8.5
Pul-e-Ashawa27%25%−3%−1%8%6%−37%−17%
Pul-e-Qarghayi−0.2%−16.8%−4.5%6.0%−4.8%−4.0%−8.7%−5.0%
Tangi-e-Saidan−0.5%−2.9%−6.4%19.4%9.1%5.7%−39.2%−33.8%
Tangi-e-Gulbahar26.8%25.2%−2.9%−0.5%8.3%5.5%−36.7%−17.4%
Sultanpur−0.2%−16.8%−4.5%6.0%−4.8%−4.0%−8.7%−5.0%
Nawabad−5.0%−18.6%−14.6%−2.1%−9.0%−8.2%−8.9%6.9%
Publisher’s Note: MDPI stays neutral with regard to jurisdictional claims in published maps and institutional affiliations.

