Article

Biomethane from Manure, Agricultural Residues and Biowaste—GHG Mitigation Potential from Residue-Based Biomethane in the European Transport Sector

1
Deutsches Biomasseforschungszentrum gGmbH (DBFZ), 04347 Leipzig, Germany
2
Helmholtz Centre for Environmental Research, 04347 Leipzig, Germany
*
Author to whom correspondence should be addressed.
Sustainability 2021, 13(24), 14007; https://doi.org/10.3390/su132414007
Submission received: 27 October 2021 / Revised: 10 December 2021 / Accepted: 10 December 2021 / Published: 18 December 2021

Abstract

:
Biomethane from manure, agricultural residues, and biowaste has been prioritized by many energy strategies as a sustainable way to decrease greenhouse gas (GHG) emissions in the transport sector. The technology is regarded as mature; however, its implementation is still at an early stage. At EU level, there are currently two major instruments relevant for promoting the production of biomethane from waste and residues and which are likely to contribute to unlocking unused GHG mitigation potentials: the Renewable Energy Directive 2018/2001 (RED II) and the European Emission Trading System (EU ETS). Our study analyzes the effects of these two instruments on the competitiveness of biomethane as an advanced transport fuel in relation to different policy scenarios within the RED II framework and under EU ETS conditions. Within the RED II market framework for advanced biofuels, biomethane concepts that use manure as a substrate or as a cosubstrate show significantly lower GHG mitigation costs compared to advanced biofuels. With respect to the current EU ETS conditions for bioenergy, it is helpful to consider the GHG reduction potential from the non-ETS agricultural sector as a way to unlock unused potential for reducing GHG emissions.

1. Introduction

Driven by ambitious GHG reduction targets, the European Union has created different political instruments to promote renewable energy [1,2,3]. Biomethane from animal manure, agricultural residues, such as straw, and biowaste is regarded by different policy strategies as a sustainable way to decrease greenhouse gas (GHG) emissions in the energy and transport sectors [4,5]. In particular, the use of animal excrement in anaerobic digestion plants is thought to contribute significantly to reducing GHG emissions because of improved manure management [6]. When manure is conventionally stored in open storage systems on farms, it inevitably produces GHG emissions [7]. By introducing manure as a substrate in a biogas plant early on, these GHG emissions can largely be avoided [8].

1.1. Background

In addition to replacing fossil fuels, the production of biomethane from animal manure achieves additional savings that are increasing in importance [9]. Nevertheless, there remains a vast amount of unlocked GHG mitigation potential by using animal manure [10,11,12].
There are currently two major instruments at EU level that are (or can be) relevant for the promotion of biomethane from waste and residues.
Firstly, the share of renewables in the EU transport sector is (and will be) mainly driven by the targets defined in the Renewable Energy Directive 2009/28/EC (EU RED) and the follow-up Directive 2018/2001 (RED II). RED II defines the market size for renewables in the EU transport sector, in particular for advanced fuels such as biomethane from waste and residues. Because of discussions on the sustainability of bioenergy and the resulting introduction of several sustainability criteria as part of the directive, the GHG mitigation potential of biofuels and bioenergy carriers has increased in significance and has become an important criterion for a biofuel’s success on the market. With the introduction of a cap on biofuels from food and feed crops and the introduction of a subtarget for advanced biofuels, the 2015 version of the RED and the follow-up directive RED II have triggered a shift towards the increased use of biofuels from residues and waste materials.
The maximum proportion of biofuels produced from food and feed crops will be frozen at 2020 consumption levels, plus an additional 1% (with a maximum cap of 7%) for road and rail transport fuel. At the same time, advanced fuels must supply a minimum of 0.2% of transport energy in 2022, 1% in 2025, and at least 3.5% (double-counted) by 2030. The revised Renewable Energy Directive (revised RED II), which results from the changes to the proposal of the European Commission and the Council [13], increases the overall target for the share of renewable energies in gross final energy consumption in the European Union from 32% to 40% in 2030. Furthermore, it proposes to increase the share of sustainable advanced biofuels from at least 0.2% in 2022 to 0.5% in 2025 and 2.2% in 2030 (compared to 1.75% without double-counting in the current RED II).
Assuming that the RED II (and Red II revision) subtarget will create a “protected market” for advanced fuels, several technological pathways suitable for converting the feedstocks listed in Annex IX, Part A of RED II will compete within this market as described above. Thus, the first step in evaluating the competitiveness of biomethane as an advanced biofuel is to assess potential competitors within the advanced fuel subtarget market. With respect to the characteristics of the qualified feedstock, technology options such as biomethane or the production of synthetic fuels seem to be appropriate. Consequently, we consider in our analysis two alternative, market-ready advanced fuels as potential competitors to biomethane.

1.2. Scope of the Study

The aim of the second instrument, the EU Emission Trading System (EU ETS), is to increase the cost of using carbon-intense energy carriers. In theory, raising the cost of using carbon-intense energy carriers would bring these costs more in line with the production costs for renewable energy carriers (which are typically associated with higher costs and lower GHG emissions). The low price for CO2 certificates means that certificate trading is currently not an effective way to increase the cost of CO2-intensive energy carriers and thus to create a balance between the provision of energy from biomass and fossil energy supply. Additionally, the EU ETS is not applied to all sectors and, in particular, the provision of biomethane using manure as a feedstock relies on a trans-sectoral production chain.
The GHG reduction potential of using manure-based biomethane affects the energy sector by replacing fossil fuels and influences the agricultural sector by improving manure management. It could be an appropriate way to allocate the GHG emission reduction potential to the two related sectors—energy and agriculture—and to identify policy fields in which additional instruments should be implemented so that unused GHG mitigation potentials can be unlocked [9,11]. In Germany, for example, only around 50% of the mobilizable technical biomass potential of animal manure with a value of 37 PJ [12,14] is used for energy purposes. At the same time, including non-ETS emissions (or reductions) is an interesting way to take into account cross-sectoral GHG mitigation in the framework of EU ETS.
Consequently, for the future utilization of this potential, one of the most important questions is: How competitive is biomethane as an advanced biofuel in the European road transport sector?
While GHG emissions and mitigation costs for biogas and biomethane have been addressed in many studies, for instance by coupling economic and GHG accounting models [15], by assessing the economics of biogas GHG mitigation potential [16], and by calculating the environmental impact of biomethane production, considering different types of technologies and substrates [17]. The effects of the different support schemes on biomethane have been rarely compared and are mostly within the framework of the EU RED [18,19] and RED II [20]. At the same time, the market for biomethane and its competitiveness with other advanced fuels have not been taken into account [21].
To answer the scoping question, we assessed the market for biomethane and the competitiveness of biomethane within this study. For that purpose, we considered different perspectives. On the one hand, we assessed the competitiveness of biomethane by comparing GHG emissions and the production costs of biomethane with values of other advanced biofuels as competitors in the advanced fuels market within the RED II framework. Therefore, we consider different biomethane concepts based on animal manure, straw, and biowaste, and two other advanced biofuels: ethanol based on straw and FT diesel based on waste wood. In doing so, we use the definition of advanced biofuels according to Annex IX of RED II. On the other hand, we examined under which conditions the EU ETS is an effective instrument to decrease the GHG mitigation costs of biomethane pathways.

2. Materials and Methods
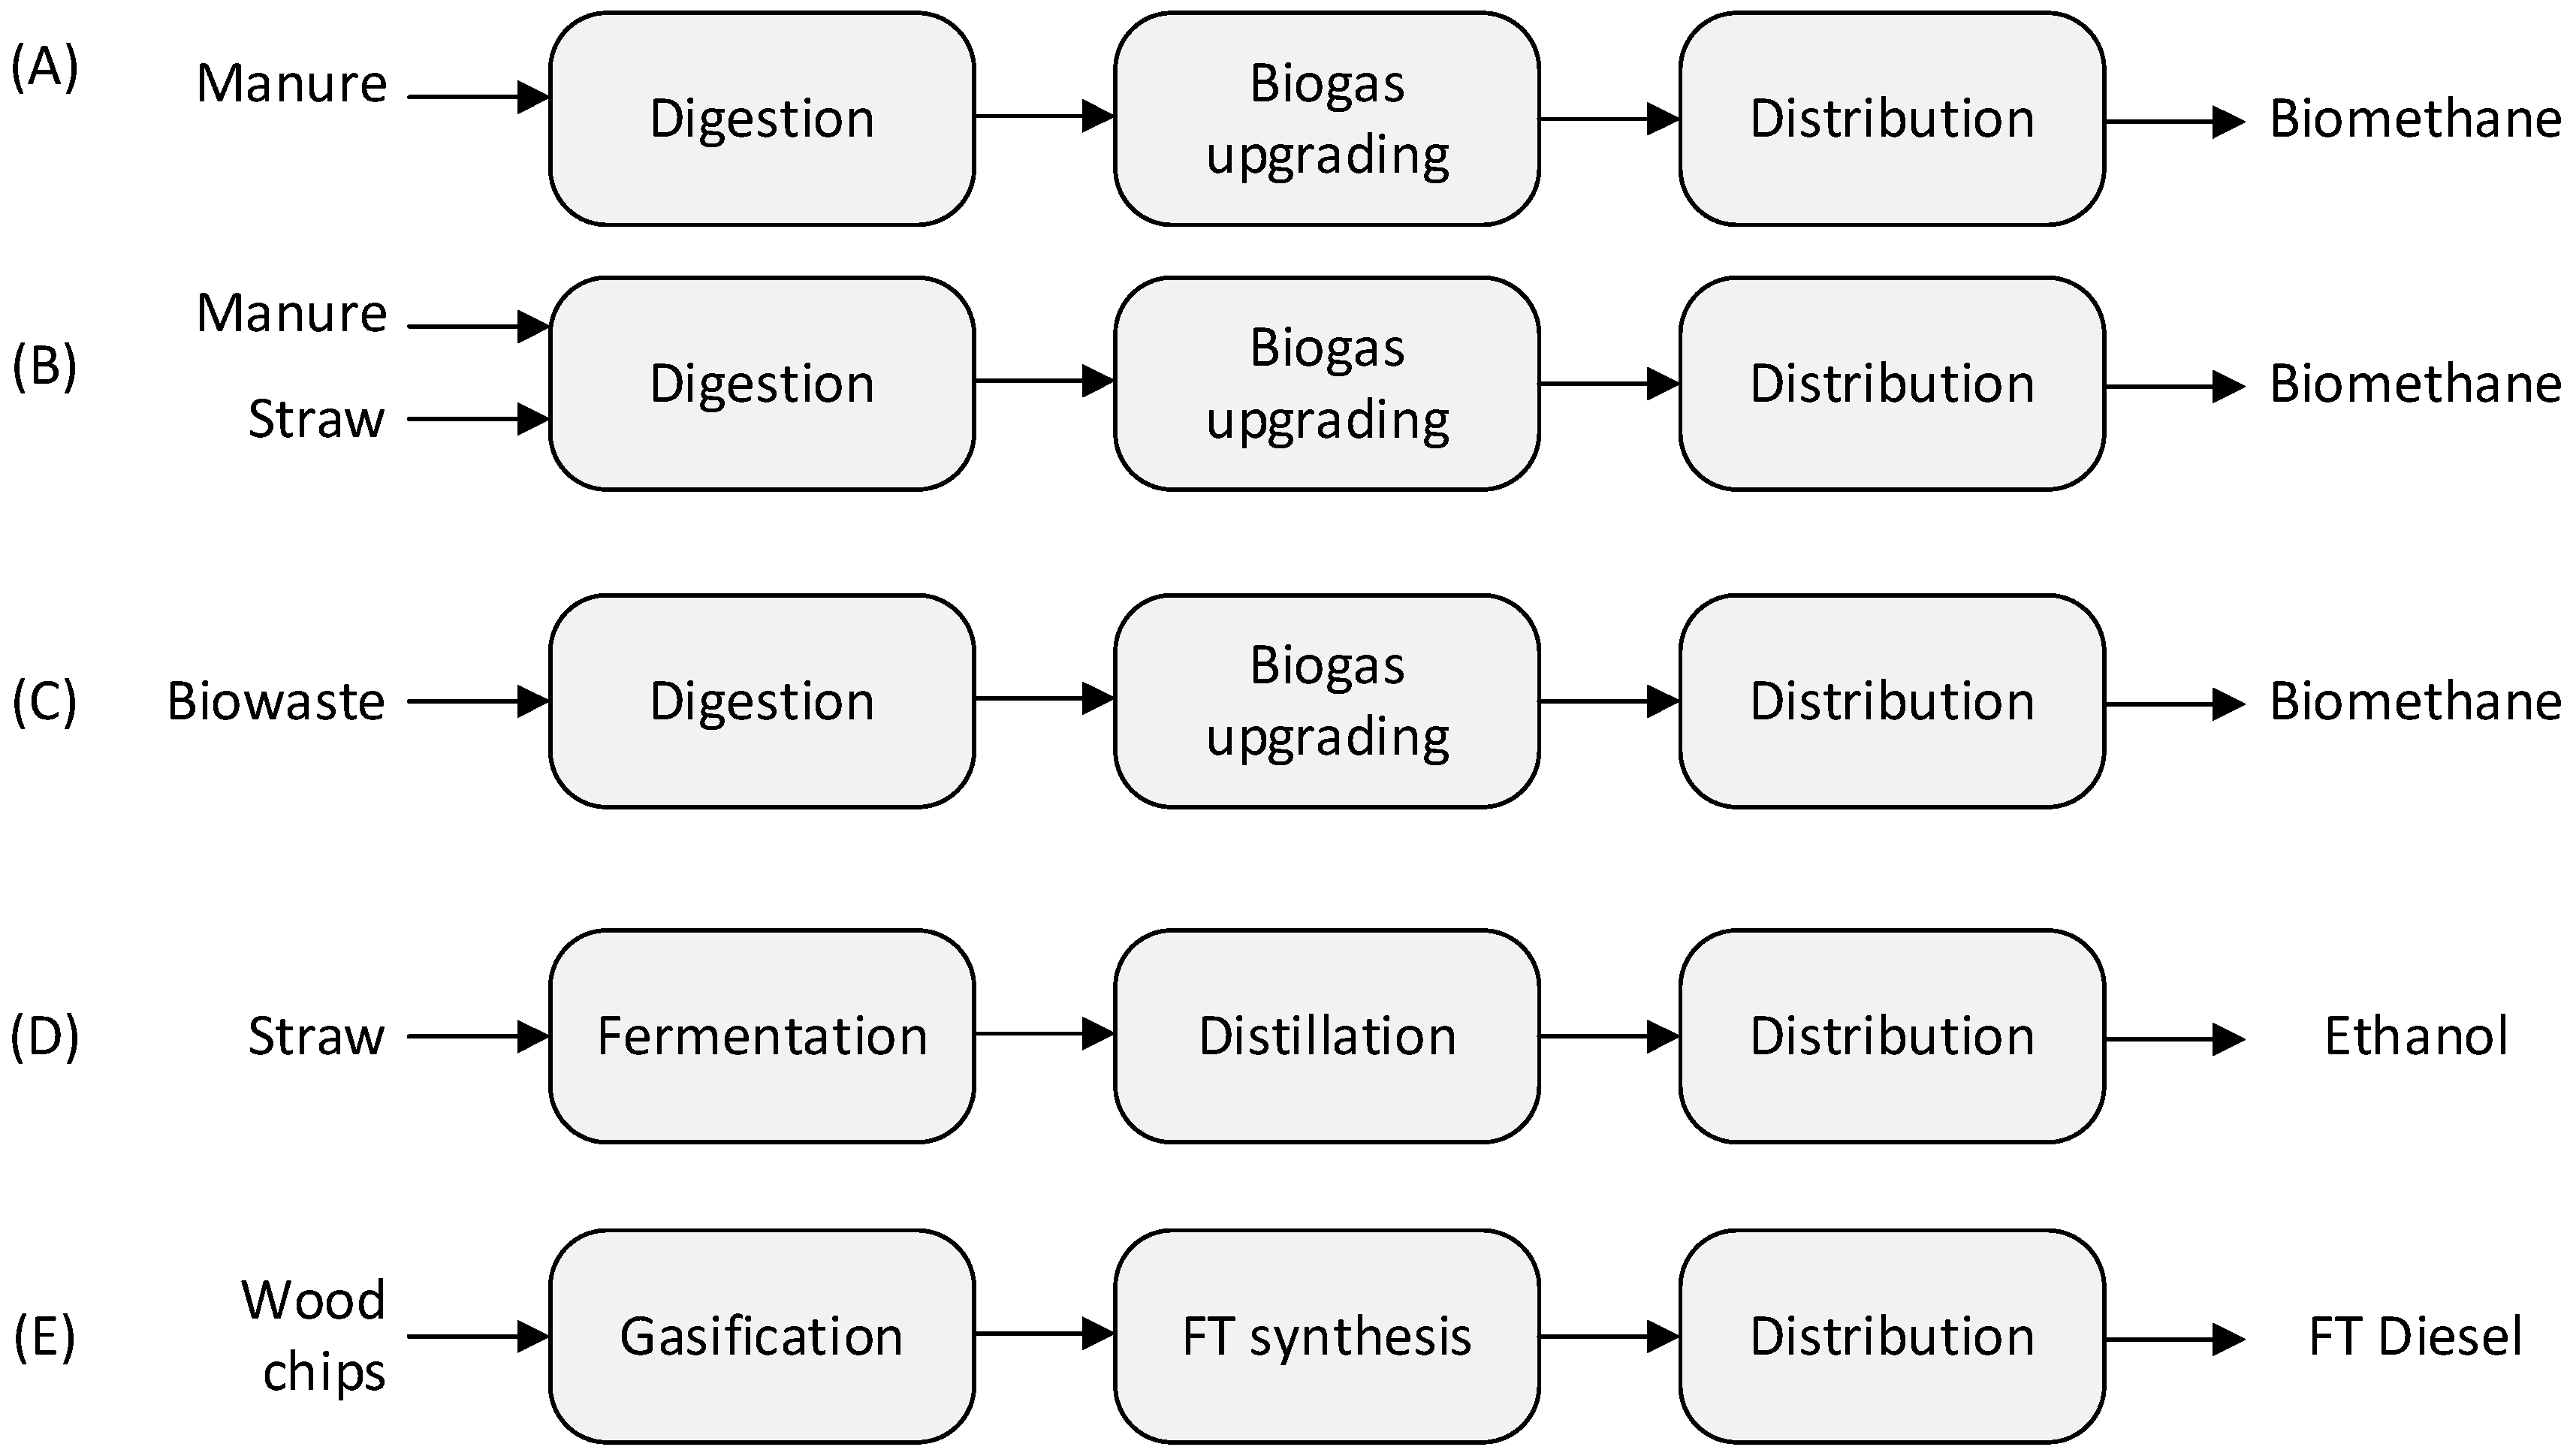
In order to assess the GHG mitigation potential of biomethane in the European transport sector, we (1) defined different model concepts for biomethane and two other competing advanced fuels, (2) built three scenarios for the assessment framework, and (3) calculated the GHG emission mitigation costs for the different fuels.

2.1. Model Concepts

2.1.1. Biomethane Concepts

Three model pathways for biomethane production were assessed with regard to their specific GHG emissions and GHG mitigation costs. The three biomethane value chains investigated were biomethane from animal manure (Figure 1A), biomethane from a mixture of animal manure and straw (Figure 1B), and biomethane from biowaste (Figure 1C). For our assessment, the biomethane concepts had an assumed annual biomethane production of approximately 1,700,000 m3 with a feedstock requirement of 40,000 t of animal manure per year (plant A), 26,000 t of animal manure and 6500 t of straw per year (plant B), and 26,000 t of biowaste per year (plant C) based on KTBL data [22]. After biogas was produced via digestion, a pressurized water-washing technology was used in the upgrading step with a capacity of 350 Nm3 biogas per hour. In addition to carbon dioxide separation, the upgrading process also includes biogas pretreatment processes such as desulfurization and drying. The plant is running for 8300 h per year. Heat for the biomethane facility was supplied internally. In this case, part of the biogas produced was converted in a biogas boiler. The electricity for the biogas plant and the upgrading plant was taken from the public electricity grid. Methane emissions from biogas production and upgrading were included, assuming a methane loss of 1% during biogas production [17] and 0.2% during the upgrading process [23]. Depending on the retention time of the substrates in the fermenter, post-fermentation processes of the fermentation residues (digestate) in the digestate storage tanks can result in high residual methane emissions. With an uncovered storage facility, climate-relevant emissions between 19 [24] and 69 g CO2-eq.*MJ−1 [25] can be assumed. Considering that in modern biogas plants the digestate storage is gas-tight covered, and that a gas-tight cover will be mandatory in the future, we assume that the digestate is stored in closed tanks. For this reason, no GHG emissions from biogas digestate were taken into account. Due to the declaration of the used biogas substrates (manure, straw, and biowaste) as waste and residues [3], the assessed lifecycle of the investigated biomethane concepts starts with the collection and transport processes of the substrates (e.g., straw baling, straw transport from field to biogas plant). Greenhouse gas emissions from upstream processes associated with, e.g., livestock breeding such as, for example, emissions caused by crop cultivation for animal feed, or in the case of straw use, the emissions from cereals cultivation were not included in the assessment. Also not considered in this GHG calculation are two aspects, related to the handling of the digestate. The first aspect concerns GHG emissions from the transport and the field application of the digestate. In particular, nitrous oxide emissions from spreading the digestate can have an influence on the GHG balance. The second aspect is related to the fertilizing effect of the digestate and the associated substitution of, in particular, synthetic nitrogen fertilizer. Climate-relevant emissions resulting from the energy-intensive production of synthetic nitrogen fertilizers can be avoided in this manner. In this sense, digestate based on residual and waste materials is not related to cultivation areas directly. As upstream processes are not considered, the nutrients remaining in the digestate (which could replace synthetic fertilizers) cannot be credited to the system. The same also applies to the GHG emissions from digestate field applications.

2.1.2. Bioethanol from Straw

In our assessment, we included a straw-to-ethanol plant concept (Figure 1D) with an annual production capacity of approximately 50,000 t of bioethanol and a feedstock requirement of 275,000 t of wheat straw per year [26]. First, the straw is crushed and then broken down into its basic constituents (cellulose, hemicellulose, and lignin) using steam and pressure. In a subsequent liquefaction step, hemicellulose is dissolved into C5 sugars and cellulose is dissolved into C6 sugars, with the aid of enzymes. The sugars are subsequently fermented into bioethanol. The produced bioethanol is then concentrated through multiple distillation and rectification steps and through subsequent dehydration. Biomass byproducts supply the auxiliary energy for process heat and electricity.

2.1.3. Biomass-to-Liquid (BtL) from Woodchips

For the biomass-to-liquid pathway (shown in Figure 1E) considered in this study, we assumed an annual Fischer–Tropsch fuel (FT diesel) production of approximately 188,000 t with an annual feedstock requirement of 1,641,921 t of woodchips from short-rotation coppice [26]. The fuel production is based on the multistage gasification of dried woodchips. The gasification process is followed by gas scrubbing and by conditioning to syngas. This subsequently undergoes FT synthesis in a fixed-bed reactor and is converted to FT crude products using catalysts. After product separation, the wax fractions are converted to FT diesel through hydrocracking using an H2 feed. The necessary process heat is supplied via natural gas. The saturated steam, which is not used in the process, is superheated and used in a steam turbine to generate surplus electricity.

2.2. Scenarios for GHG Mitigation Costs

The biomethane concepts were assessed in relation to various support instruments: on the one hand, in comparison to other advanced biofuels as competitors within the subtarget set out in RED II, and on the other hand in comparison to natural gas in the framework of the EU Emission Trading System (EU ETS). The assessment was carried out using a three-scenario approach based on the different support instruments:
  • In scenario 1, the GHG mitigation costs for the biomethane concepts are assessed and compared with the values for the competing advanced biofuels as defined by RED II. In this case, the GHG emission values for the biomethane under consideration and other advanced biofuels include the complete lifecycle emissions calculated according to the methodology set out in the directive.
  • In scenario 2, we assessed the GHG mitigation costs for biomethane concepts in the context of the EU ETS and calculated the CO2 certificate price at which the advanced provision costs are competitive with the natural gas price. A crucial factor in this scenario is that the EU ETS defines GHG emissions from bioenergy as zero. Therefore, the differences between the GHG mitigation costs for the various biomethane value chains are the result of the different production costs.
  • Scenario 3 aims to investigate the potential impact on the GHG mitigation costs for biomethane when the GHG mitigation effects from improved animal manure management (non-ETS agricultural sector) and the overall GHG emissions are taken into account. Here, we assumed that emission savings in the agricultural sector from biomethane production could be monetized within the EU ETS. Consequently, the corresponding GHG emission savings associated with the production of biomethane from manure is incorporated in the GHG emission values relevant for calculating the GHG mitigation costs.

2.3. Calculating the GHG Mitigation Costs

GHG mitigation costs express the price for the mitigation of a specific amount of greenhouse gas emissions by the use of an energy carrier with relatively higher costs and lower emissions compared to the reference fuel. The following Equation (1) was used to calculate GHG mitigation for the reduction of 1 ton of CO2-eq. by substituting fossil fuels with biofuels:
C GHG   mitigation = C Biofuel C Fossil   fuel GHG Fossil   fuel GHG Biofuel = C GHG
where the additional cost of biofuels (∆C) results from the difference between the specific production cost of biofuels (CBiofuel) and the specific production cost of fossil fuel (CFossil fuel), whereas the net GHG emissions avoided by replacing fossil fuels with biofuels (∆GHG) is the difference between the GHG emissions of the fossil fuel (GHGFossil fuel) and the GHG emissions of the biofuel (GHGBiofuel). According to this methodology, the mitigation costs are sensitive to two factors: on the one hand, the cost difference between biomethane and the reference, and on the other hand, the difference between the specific GHG emissions of the fuels. As costs for biofuels and fossil fuels are both volatile, we present our results in the following sections as the function of GHG mitigation costs in relation to the cost/price difference between biofuels and fossil comparators.

2.4. Database

The specific greenhouse gas emissions of the advanced biofuel concepts considered here were calculated based on the guidelines set out in RED II [3]. The RED II methodology clearly defines the basic framework for the calculation of the specific GHG emissions. The methodology used in the evaluation of GHG emissions is described in the following section. The system boundaries, which define the framework in which the calculation takes place and determine which energy material flows are taken into account in the assessment, are set as well-to-wheel. The greenhouse gases relevant for GHG calculation are carbon dioxide (CO2), methane (CH4), and nitrous oxide (N2O). The global warming potential of greenhouse gases is expressed in kg of carbon dioxide equivalents (CO2-eq.). To convert a specific methane mass to kg CO2-eq., the methane weight is multiplied by 25 and the nitrous oxide mass is multiplied by 298 (based on a period of 100 years, according to IPCC 2007). The CO2 emissions from biofuels use are not included in GHG calculation; according to the IPCC, biogenic CO2 emissions are considered to be offset by the CO2 sequestration during plant growth. The functional unit which defines the quantification of the product, and which shall provide a reference to which the inputs and outputs are related, has been set for biofuels as 1 MJ biofuel. According to the GHG calculation approach of the RED II, the option for the consideration of coproducts is allocation according to the lower heating value. Allocation means that emissions shall be divided between the main and the coproducts in proportion to their energy content (lower heating value according to RED II methodology). Furthermore, The RED II framework allows to include credits for the use of manure/slurry as biogas substrate. The conventional storage of manure can lead to significant emissions of methane. These emissions can be reduced in case manure is used as a substrate for biogas production. The RED II recognizes this benefit by a credit of 45 g CO2-eq. per MJ manure used (i.e., 54 kg CO2-eq. per t fresh matter). According to the RED II methodology, GHG emissions associated with the construction and the demolition of the biofuel production plants were not considered. The specific overall greenhouse gas emissions calculated according to the described methodology for the investigated advanced biofuels are shown in Table 1. While the values for biomethane from biowaste, bioethanol from straw, and BtL from woodchips are of a similar order of magnitude, the provision of biomethane based on animal manure and biomethane based on a mixture of manure and straw cause significantly fewer emissions. This is primarily due to the credits for the improved manure management. The difference in overall GHG emissions between the two concepts (100% manure) shows how highly sensitive the credit is to the GHG emissions.
As we did not calculate specific costs for the production of the advanced biofuel options, literature values and references for advanced biofuel production were used. Due to the high volatility of costs and nonharmonized assumptions and framework conditions, we used bandwidths for the comparison of advanced biofuels with each other in scenario 1 shown in Table 1. The GHG mitigation potential in scenario 1 was calculated according to the fossil reference defined in RED II, with a value of 94 g CO2-eq.*MJ−1 [3].

3. Results of GHG Mitigation Costs

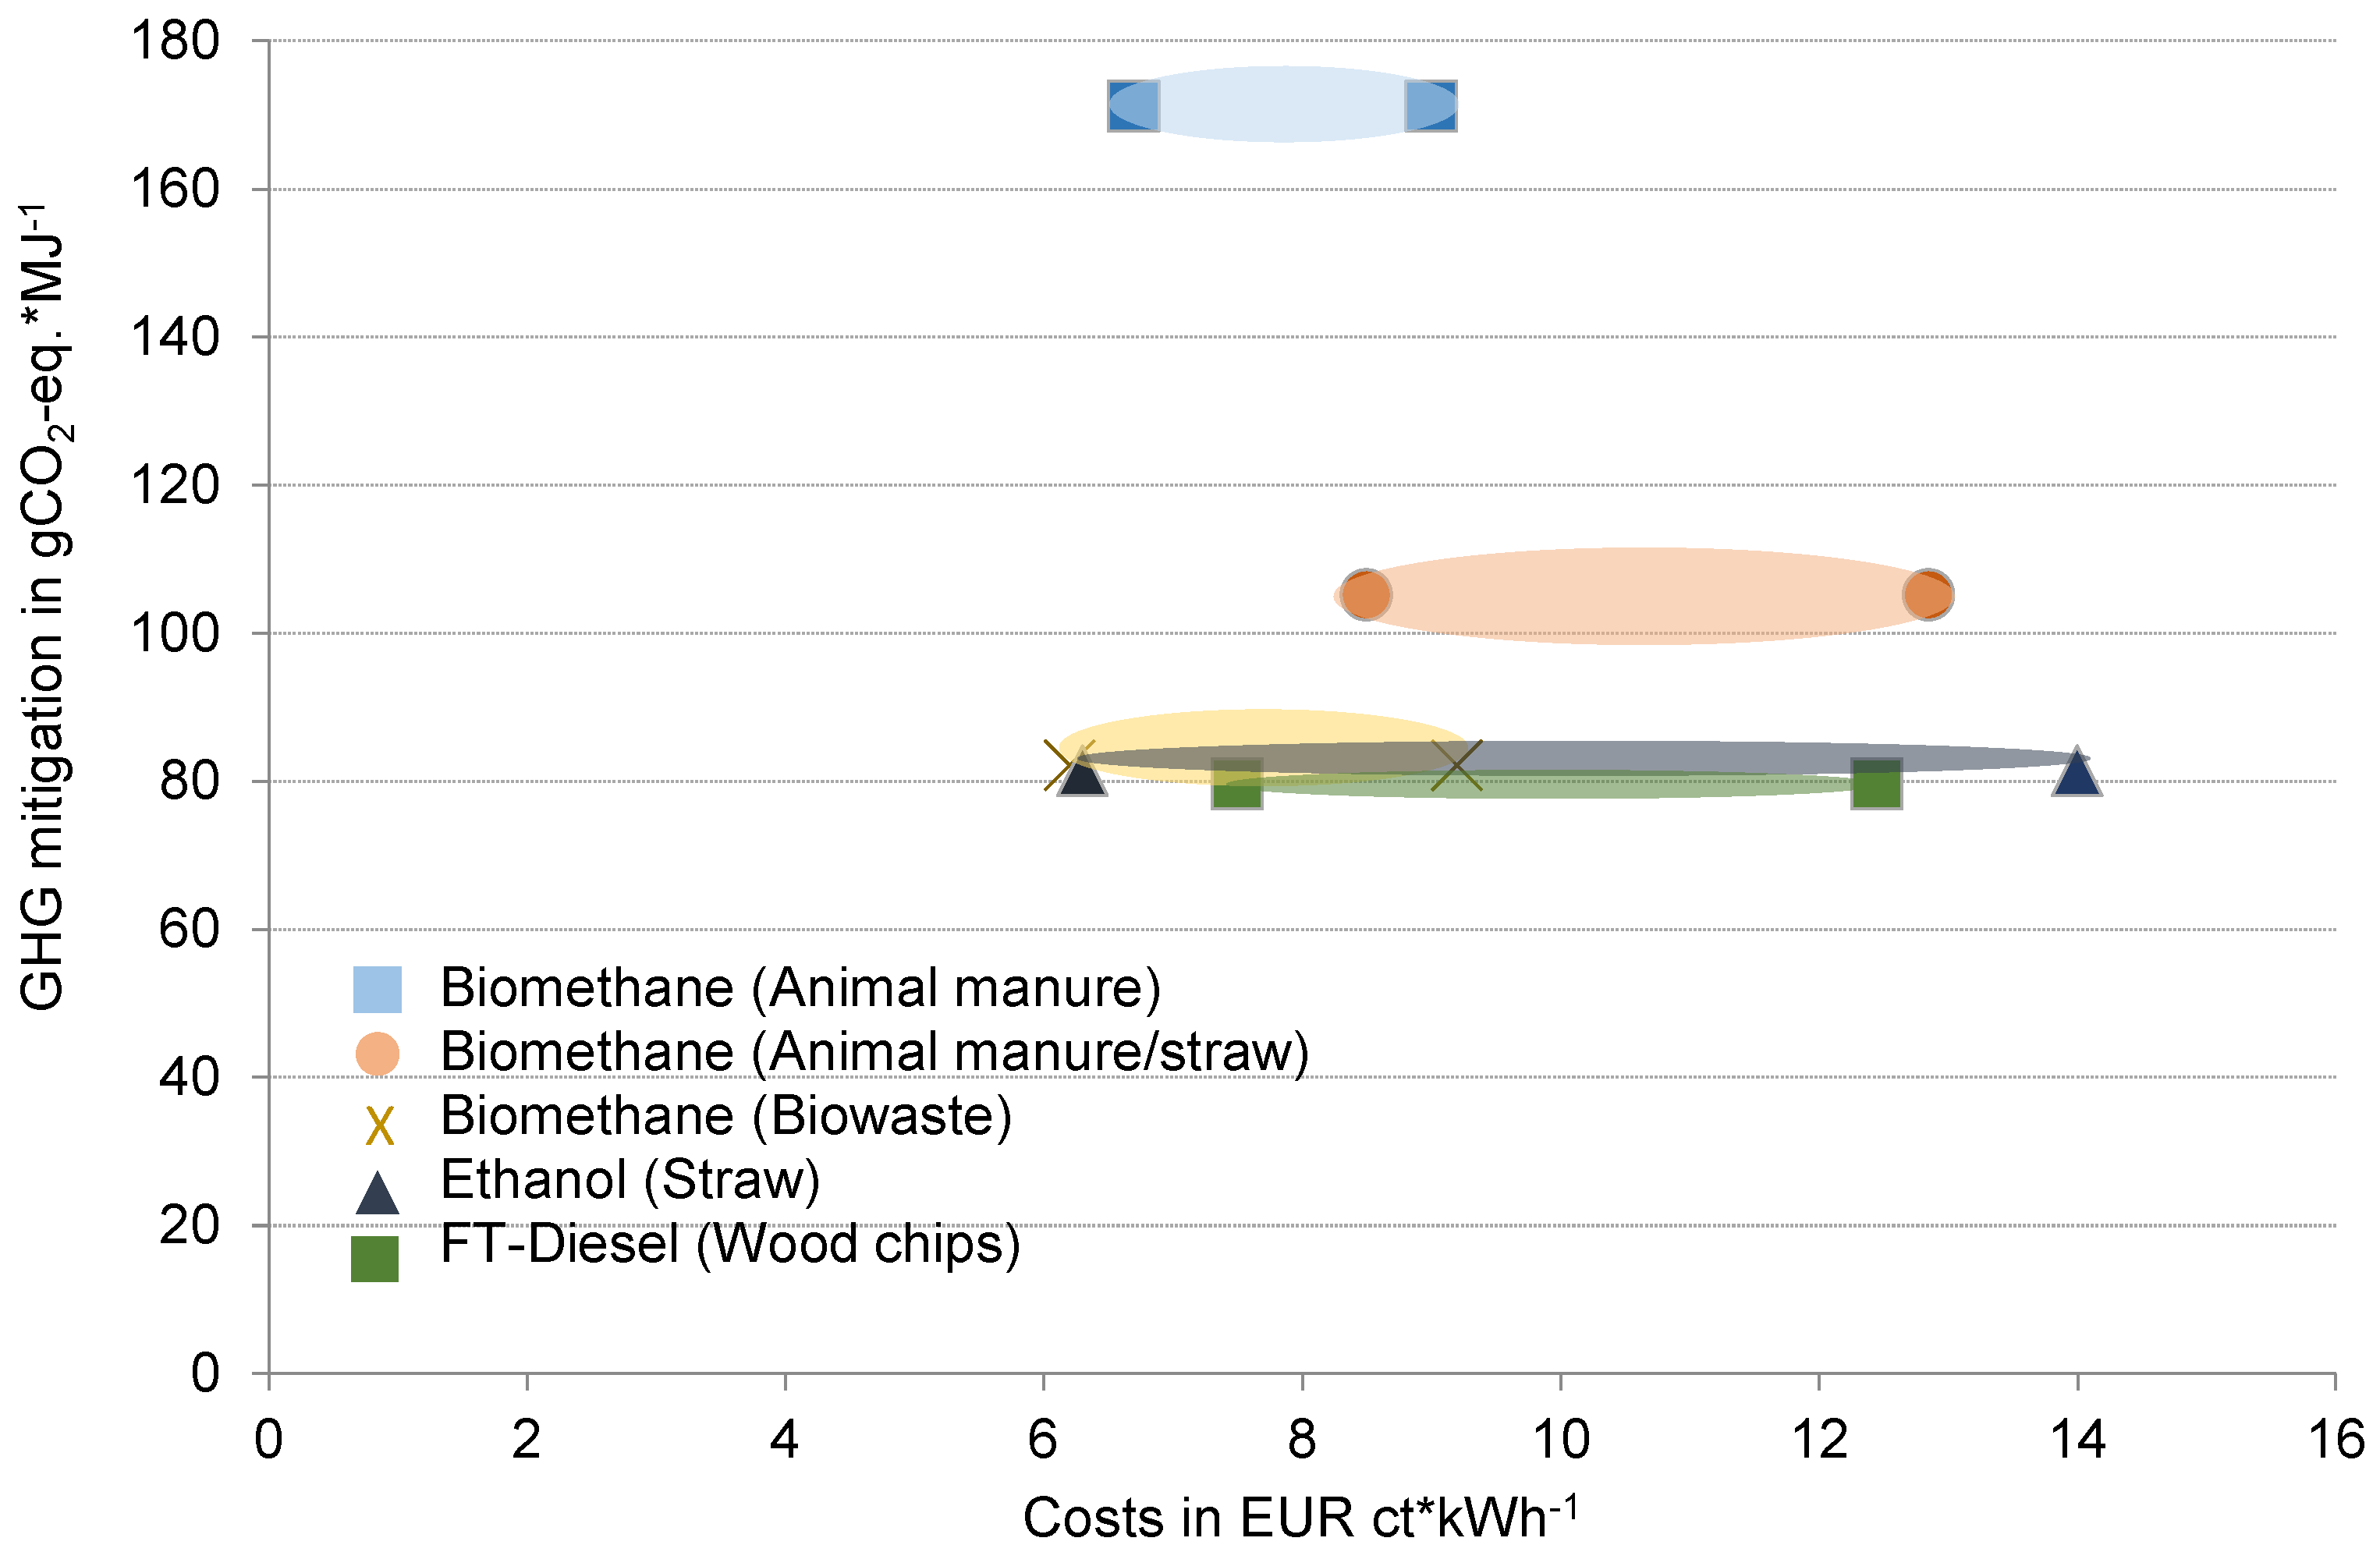
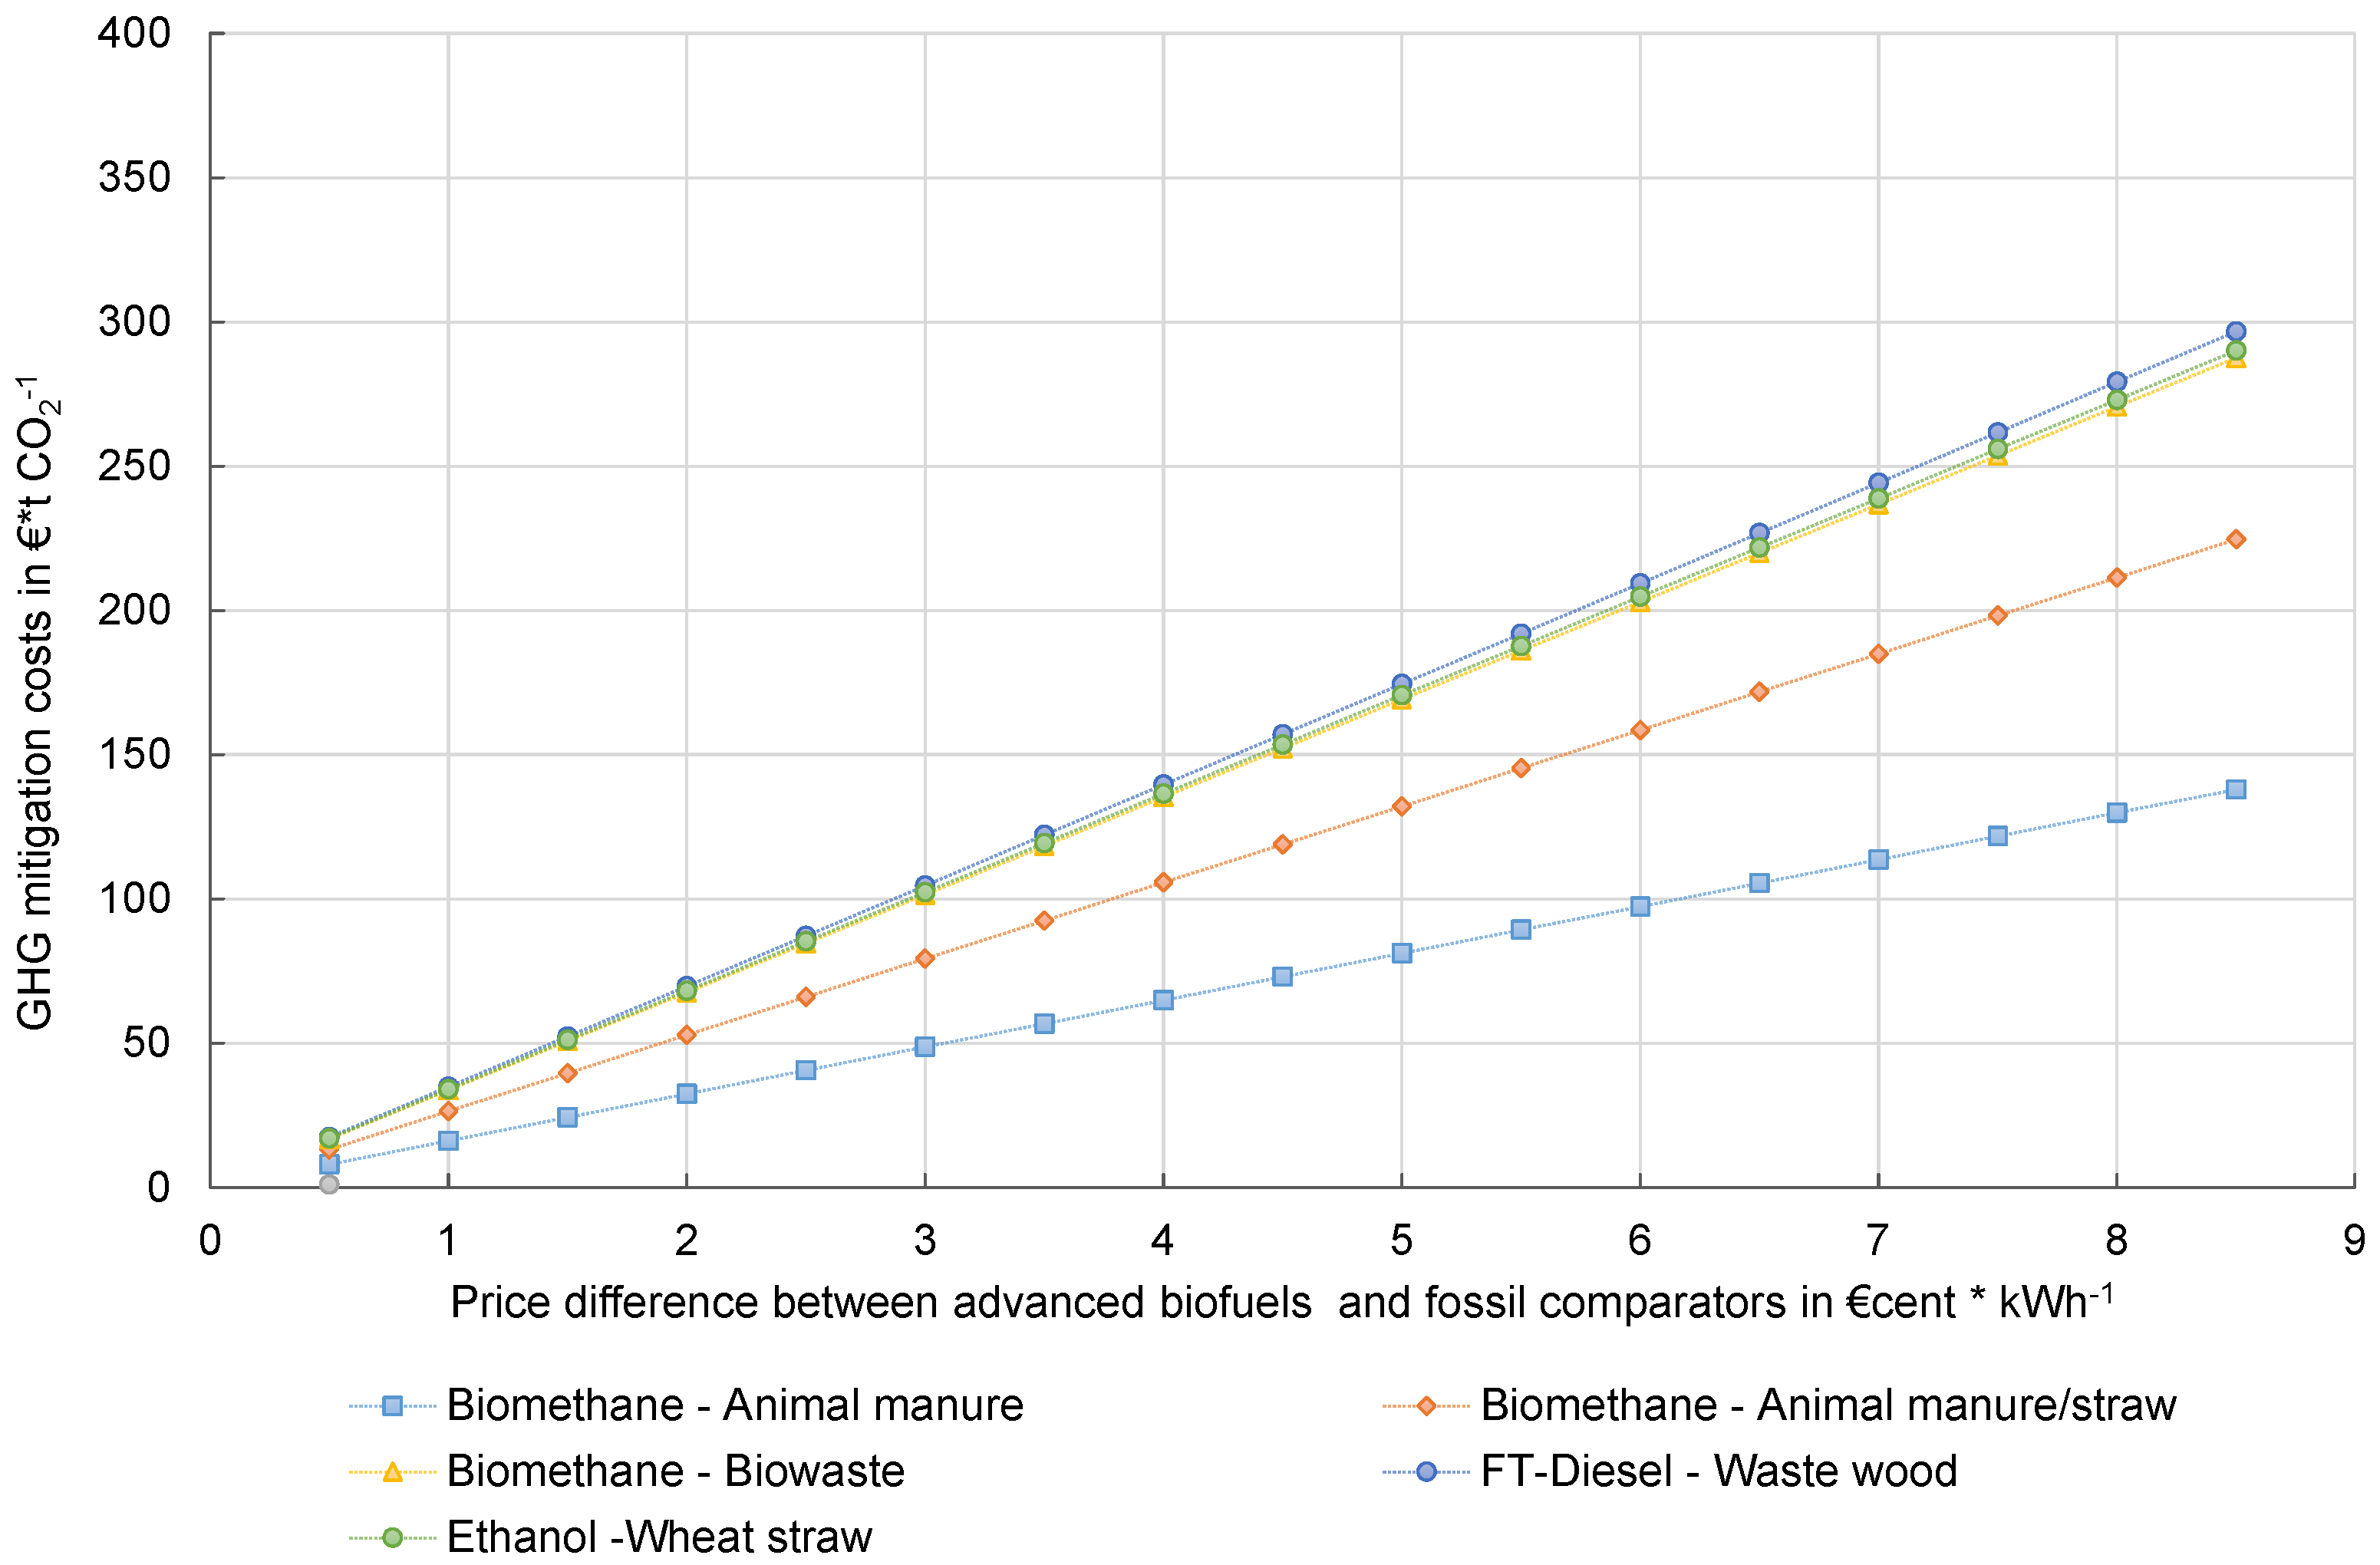
3.1. Scenario 1: Comparison of the GHG Mitigation Costs for Biomethane and Other Advanced Biofuels as Competitors in the Advanced Fuels Market within the RED II Framework

The introduction of the subtarget for advanced biofuels in RED II has resulted in the development of a defined market for advanced biofuels and has meant that the GHG mitigation costs for bioenergy carriers have become a factor in distinguishing between the various bioenergy options. The calculations in this scenario include the total lifecycle greenhouse gas emissions of the advanced biofuel pathways for biomethane and other advanced biofuel competitors.
Based on the figures in Figure 2 for overall GHG emissions and the bandwidths of the costs, the specific GHG mitigation potential for the advanced biofuel concepts considered here is calculated and compared to the GHG emissions of the fossil references defined in RED II. The respective cost bandwidths are shown in Figure 2. Based on the assumptions made, biomethane value chains that use animal manure show the highest GHG mitigation potential compared to the fossil fuel reference, due to the given credit for improved manure management, and the production costs are lower than for the other advanced biofuels under consideration: bioethanol from straw and BtL from woodchips. The production of biomethane from biowaste causes similar costs but higher GHG emissions, due to the higher demand on process energy (electricity from the grid) [28]. A higher share of renewable energies in the electricity production mix can lower the GHG emissions associated with the production of biowaste-based biomethane. It can be stated that all the biofuels considered have a high GHG reduction potential compared to the fossil reference (defined in RED II with a value of 94 g CO2-eq.*MJ−1).
As mentioned before, costs for biofuels and fossil fuels are both volatile. Therefore, we calculated the GHG mitigation cost (according to Equation (1)) based on GHG mitigation potential shown in Figure 2 as functions using cost/price differences between advanced biofuels and fossil reference fuels. This means that we calculated GHG mitigation costs based on the relative price difference and not based on absolute cost figures. Figure 3 shows the functions of GHG mitigation cost for each biofuel option in relation to the cost/price difference between the biofuel option and fossil fuel. Under the assumptions made, the results in Figure 3 show significantly lower GHG mitigation costs (and consequently more flat-curve characteristics) for biomethane concepts using animal manure as a biogas and biomethane substrate and as a cosubstrate in a mixture with straw compared to the other advanced biofuels under consideration. The values for the GHG mitigation cost shown in Figure 3 are highly sensitive to the GHG reduction potential, similar to the values shown in Figure 2.

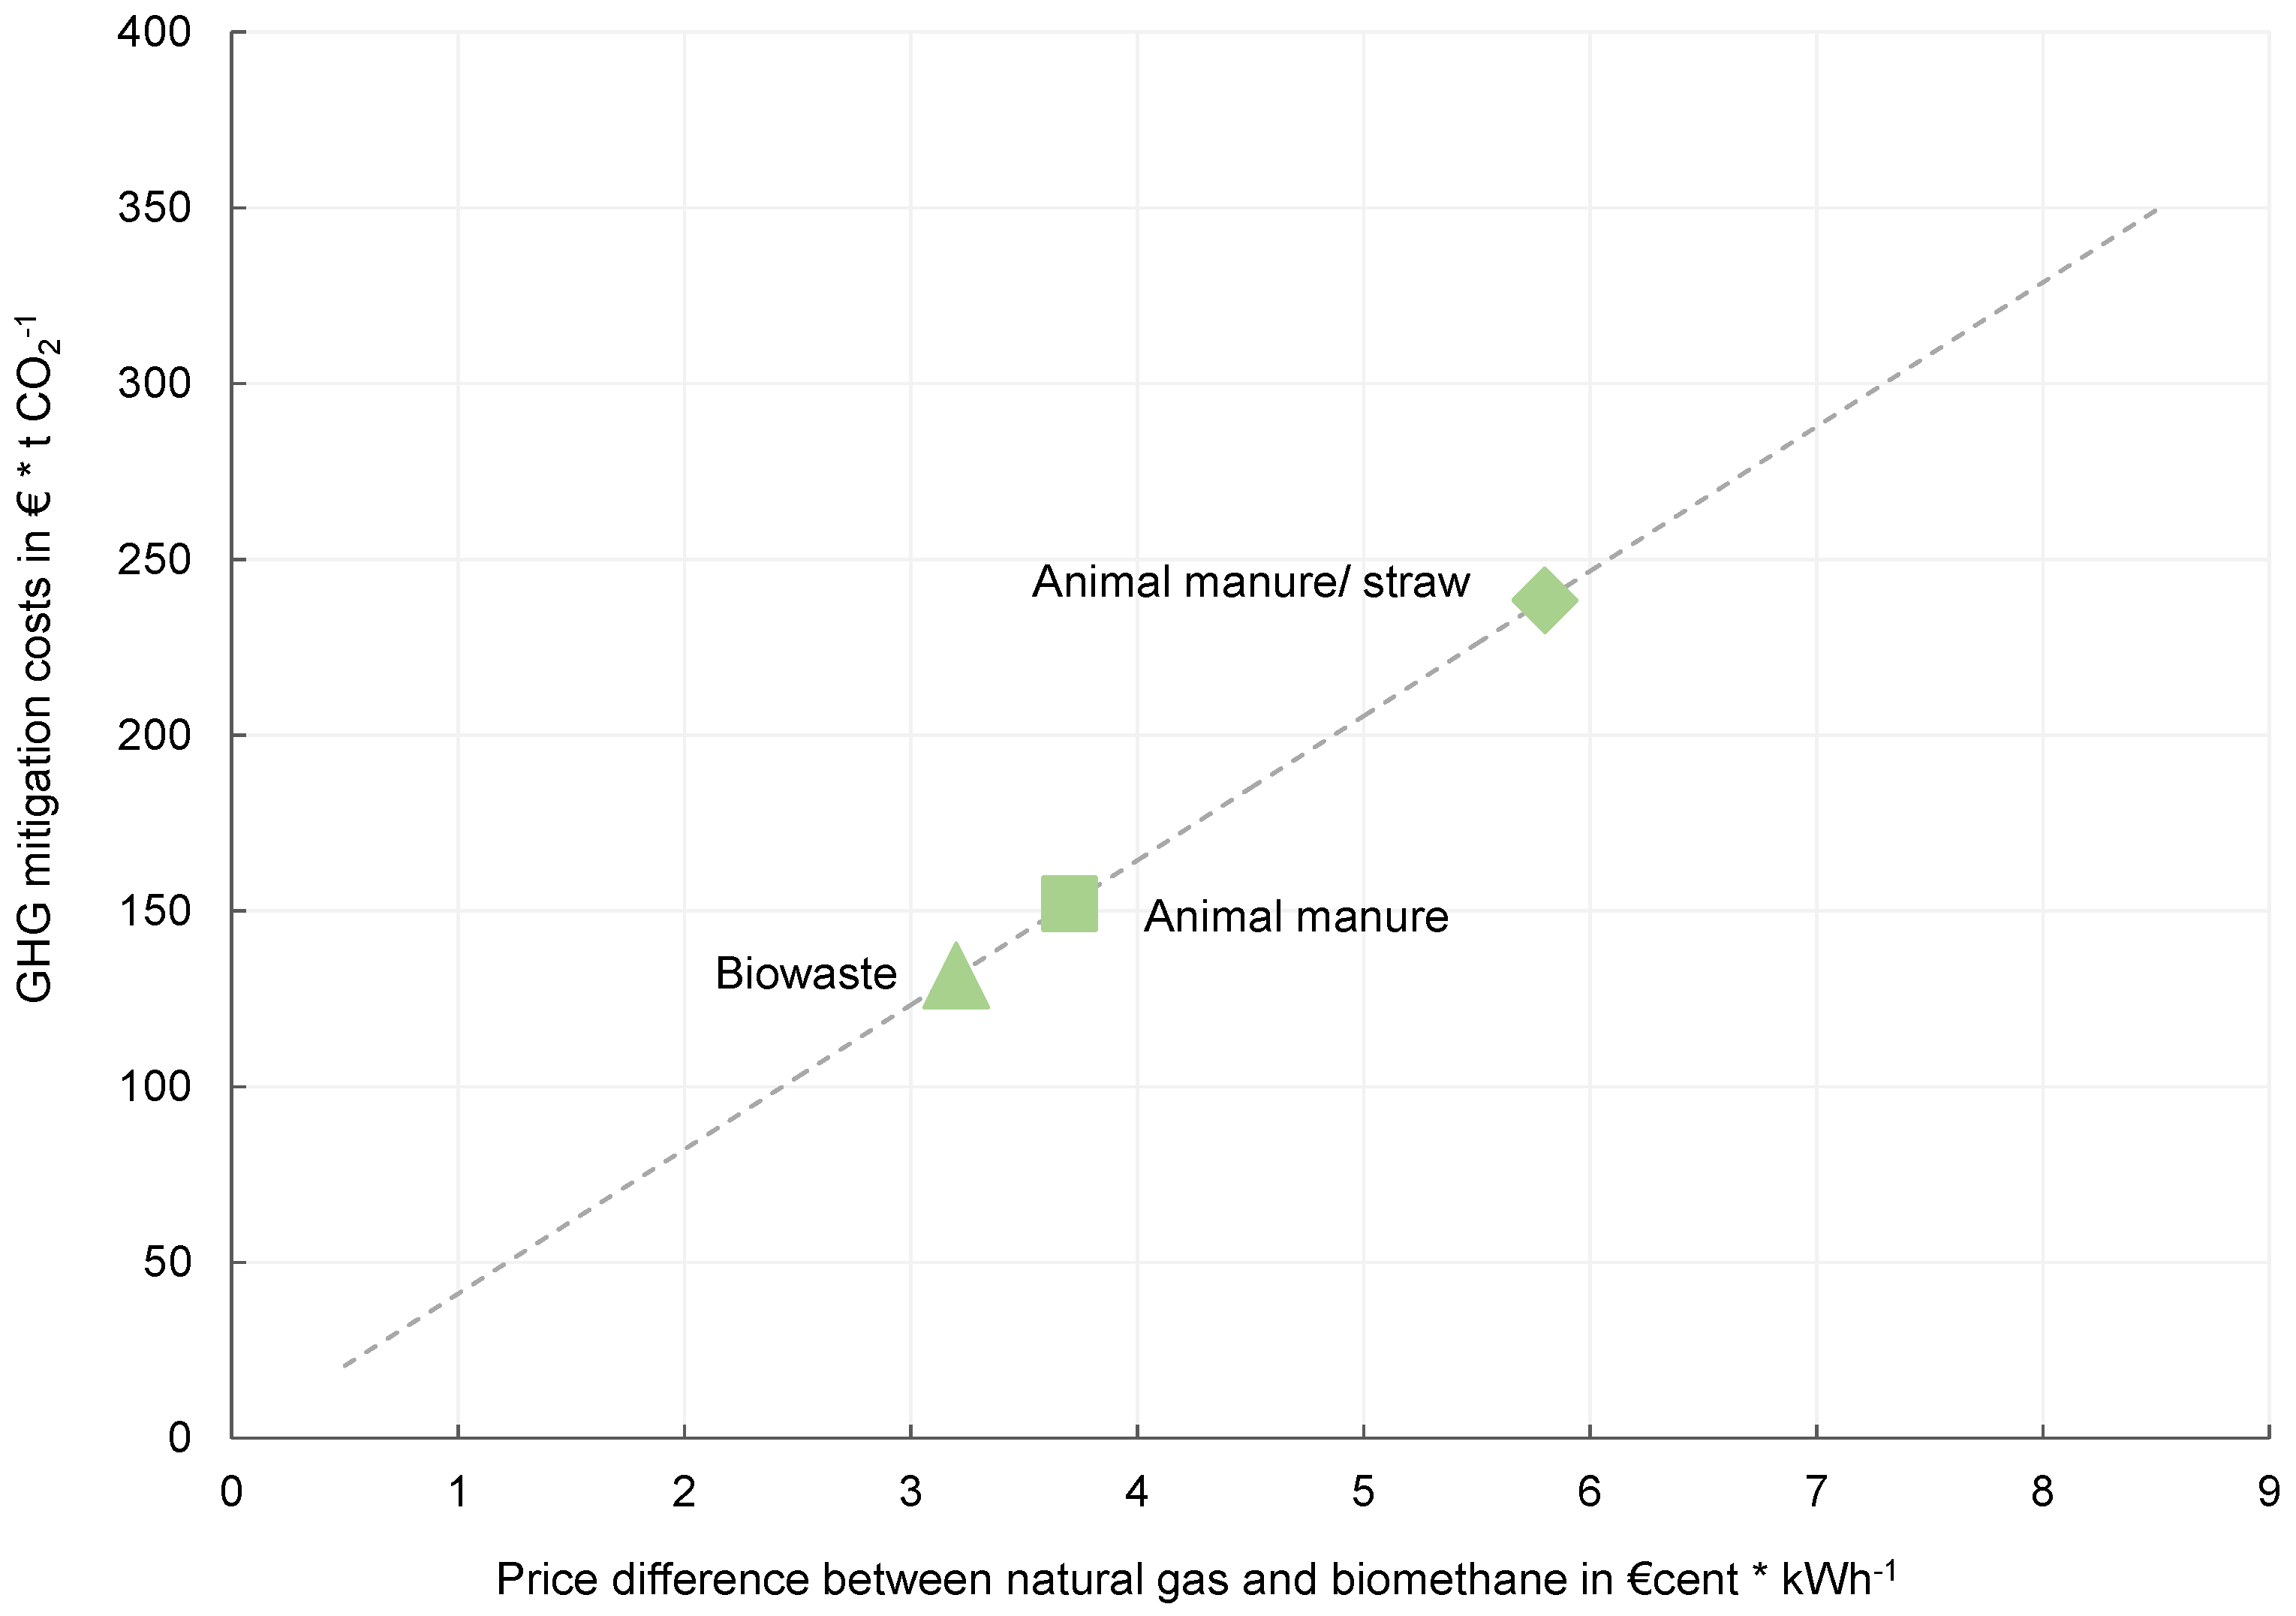
3.2. Scenario 2: GHG Mitigation Costs for Biomethane in the EU ETS

In contrast to scenario 1, the GHG mitigation costs for the biomethane concepts were calculated in this scenario based on the assumption that emissions from biofuel production are not accounted for within the EU Emission Trading System framework. In addition, in contrast to scenario 1, we calculated the GHG mitigation costs with actual cost values, in order to better illustrate the special consideration of bioenergy in the context of the EU ETS. For biomethane production we used values from [27]. For the fossil fuel we assumed a price of 3 EURct*kWh−1 [34] and emission values of 67.6 g CO2-eq.*MJ−1 [35] for natural gas. As emissions from biofuels are considered to be zero, differences in the GHG mitigation costs only result from differences in production costs. Figure 4 shows the mitigation costs for the biomethane concepts (based on assumptions in Table 1) in relation to a cost difference between biomethane and natural gas.
The results show clear differences between the biomethane value chains under investigation. Because of the relatively lower production costs for biomethane from biowaste and animal manure, the mitigation costs for these value chains are comparably lower than for biomethane concepts using a mixture of animal manure and straw.
The GHG mitigation cost value chains range from 123 EUR*t CO2-eq.−1 to 247 EUR*t CO2-eq.−1. These values represent the CO2 certificate price at which the costs for natural gas and the respective biomethane value chain reach a breakeven point (in fact, an increasing price for CO2 certificates would increase the costs for the utilization of carbon intense energy carriers in the EU ETS). Figure 4 also shows the relation between GHG mitigation costs and the cost/price difference between the biomethane value chains and natural gas. Assuming a consistent difference of greenhouse gas emissions between natural gas and biomethane, the mitigation costs increase as the cost/price differences between both energy carriers rise.

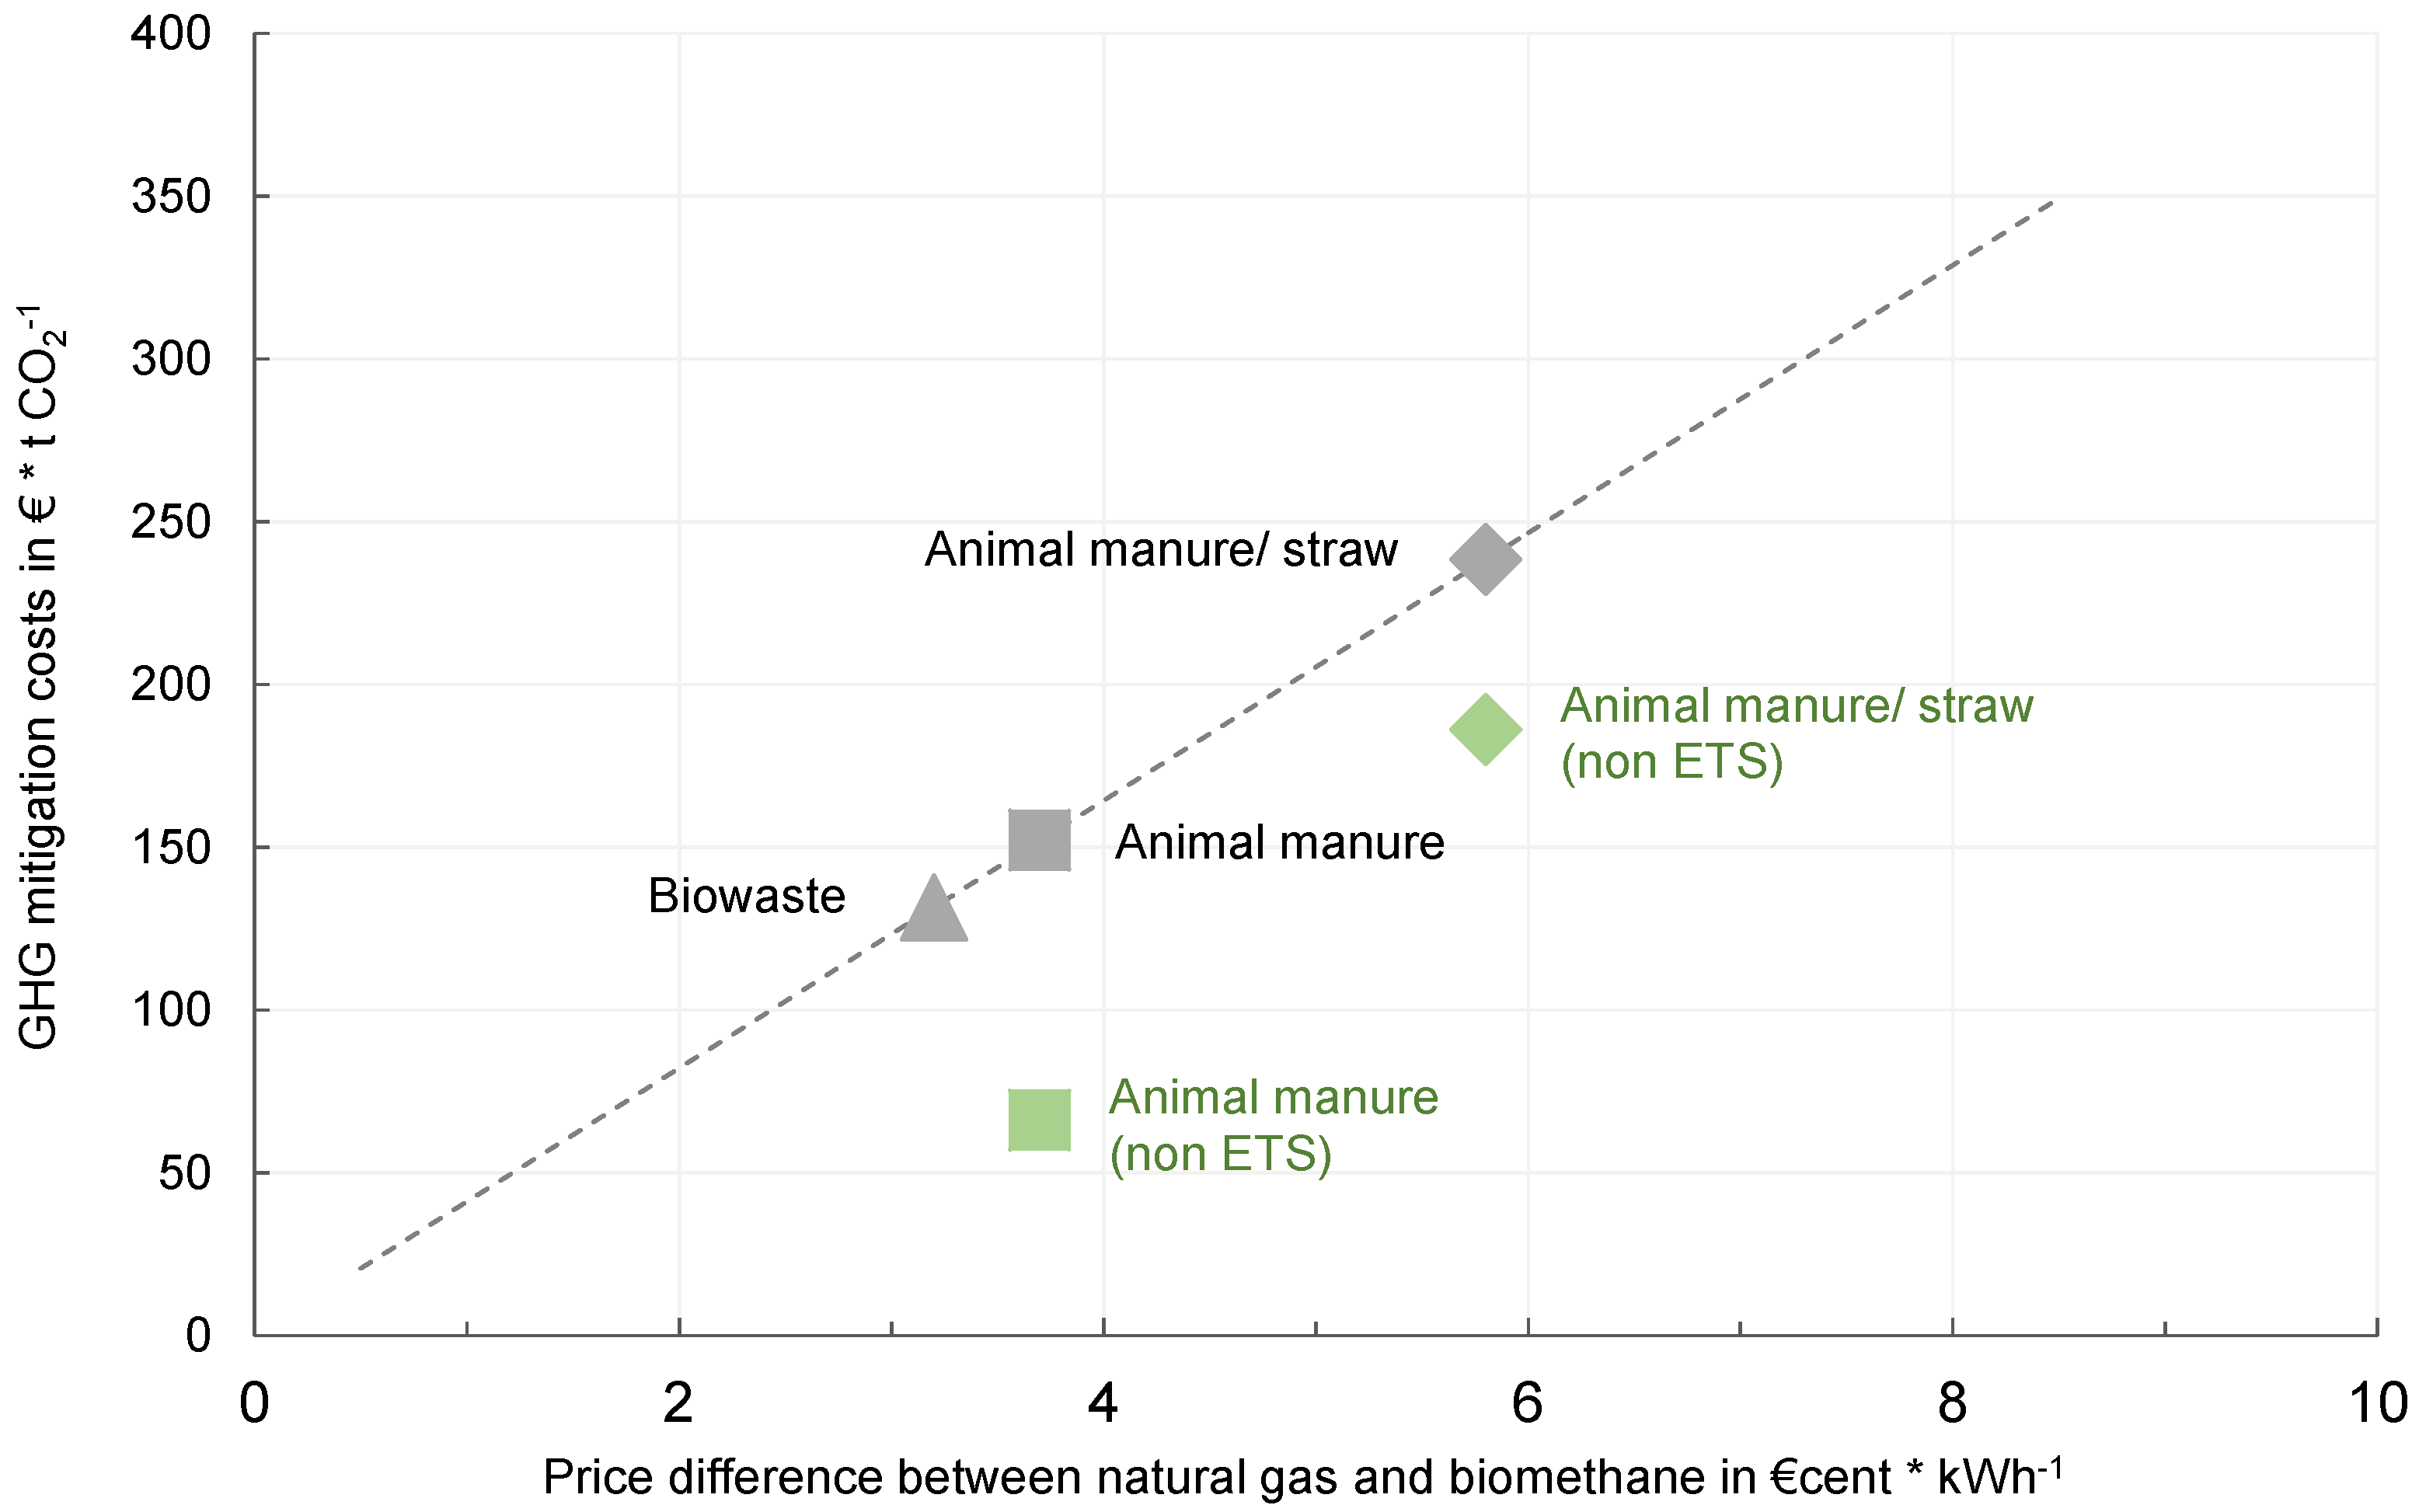
3.3. Scenario 3: GHG Mitigation Costs for Biomethane in the EU ETS Including Non-ETS Sectors

Scenario 3 moves beyond the current EU ETS to include greenhouse gas emissions from the non-ETS agricultural sector, in this case in the form of GHG emissions from improved animal manure management. The values of the GHG emissions from improved manure management for the biomethane concepts (biomethane based on 100% animal manure and biomethane based on a mixture of animal manure and straw) are shown in Table 1. As a consequence of the inclusion, the GHG mitigation costs for the two biomethane value chains using animal manure as a substrate decrease significantly. Figure 5 shows the CO2 certificate price at which the costs for natural gas and the respective biomethane value chain reach a breakeven point (as mentioned, an increasing price for CO2 certificates would increase the costs for the utilization of carbon intense energy carriers in the EU ETS). The mitigation costs for biomethane based on animal manure decrease from 152 EUR*t CO2-eq.−1 to 66 EUR*t CO2-eq.−1. The mitigation costs for biomethane from animal manure and straw, compared to natural gas, decrease from 247 EUR*t CO2-eq.−1 to 185 EUR*t CO2-eq.−1.

4. Discussion

4.1. RED II Perspective

Biomethane produced from animal manure, straw, or biowaste can achieve very high savings in greenhouse gas emissions of up to 200% by using animal manure as substrate over fossil fuels and can be considered very competitive compared to other advanced biofuels. As the specific production costs are in similar bandwidths for all advanced biofuels under consideration, the GHG mitigations costs are highly sensitive to the specific GHG mitigation potential. Due to the credit given for improved manure management according to RED II methodology (and highly dependent on it), the use for manure-based biomethane is associated with the highest potential for GHG mitigation. In addition, the use of straw and biowaste shows high GHG mitigation potential. The GHG mitigation potential of biomethane from biowaste will increase, due to the use of process energy associated with lower GHG emission.
Although the subtarget for advanced biofuels set out in RED II offers particular advantages for biomethane from waste and residues, there are some market restrictions. The subtarget of 1.75% in 2030 will develop a market of approximately 31 PJ [36]–39 PJ [37] for advanced fuels in the German transport sector and between 227 PJ [38] and 416 PJ [39] in the European transport sector. In the case of Germany, for instance, biomethane production capacities of 36 PJ [40] and a mobilizable technical biomass potential for animal manure in the amount of 37 PJ and for straw with 26 PJ are available for this [12].
Nevertheless, the current low rate of 5–6 PJ [41,42] gaseous fuels in the German transport sector and 84 PJ [43] in the European transport sector reveals the existing limitations for the use of biomethane, which is primarily due to the low share of gas-fueled vehicles in the passenger car and truck fleet. However, the advantages of biomethane listed here with regard to the GHG reduction potential and costs could, with the right incentives, lead to an increase in gas-fueled vehicles. Optimistic scenarios expect, for instance, that the number of gas-fueled trucks will increase from 9000 to 480,000 by 2030 in Europe [44].

4.2. EU ETS Perspective

In contrast to the RED II perspective, the EU ETS does not calculate greenhouse gas emissions from bioenergy based on a lifecycle assessment approach that includes comprehensive mass and energy balances of all process steps. Greenhouse gas emissions from bioenergy use are considered zero in the context of the EU ETS; in other words, biomethane users do not need emission certificates for the biomethane they use. When, in this context, greenhouse gas emissions from bioenergy are considered zero, there are no differences in the specific GHG performance of biomethane value chains. Consequently, differences in the GHG mitigation costs for the biomethane value chains calculated based on EU ETS conditions solely result from differences in their production cost. Particularly high GHG reduction effects are not taken into account and, therefore, have no competitive advantage. The GHG mitigation costs range from 123 EUR*t CO2-eq.−1 to 247 EUR*t CO2-eq.−1.
The use of animal manure in biomethane plants can result in substantial GHG reductions in different sectors. This is due to the substitutions in the transport and energy sector and improved manure management in the agricultural sector, which avoids climate-related GHG emissions from animal manure storage. With respect to emissions from the agricultural sector, the production of biomethane based on animal manure can result in a CO2 certificate price of 75 EUR*t CO2, which is much lower than other GHG mitigation options in the transport sector.

4.3. Limitations of the Study

In our study, we used typical model concepts to calculate GHG mitigation costs. GHG balances are individual balances that are highly dependent on process-specific characteristics, methodological assumptions, and data availability. The values shown in this study for the advanced fuels are therefore only valid under the specified framework conditions. Furthermore, the proposed consideration of the GHG mitigation potential in the non-EU ETS agricultural sector is an amalgamation between the entire value chain assessment according to RED II and current EU ETS conditions that set bioenergy at zero emissions. This approach is more a political measure to unlock unused GHG reduction potentials. However, if greenhouse gas emissions from manure storage are taken into account, the question arises as to whether downstream emissions also have to be considered, even though they can be associated with other EU ETS sectors.
Another aspect to consider is that GHG mitigation in intersectoral value chains is linked to allocation problems. There are two main challenges here. Firstly, determining bioenergy emissions within the framework of the EU ETS as zero and including non-EU ETS emissions and/or the entire upstream chain. Secondly, finding a way to promote GHG reductions in the agricultural and energy sector in order to unlock unused GHG reduction potential.

5. Conclusions

Biomethane from waste and residues can mitigate significant GHG emissions compared to fossil fuels, but the production costs of biomethane often exceed the costs of fossil fuels.
GHG mitigation costs are typically calculated from a specific point of view (for example, from that of political decision-makers). Our investigation focused on the conditions under which biomethane from animal manure, biowaste, and agricultural residues can be competitive as an advanced fuel in the European transport sector.
The first perspective addresses the policy instruments that promote renewable energy carriers under the RED II framework. Biomethane based on animal manure, on a mixture of animal manure and straw, and on biowaste can achieve a GHG mitigation potential of up to 200% compared to the fossil reference, and enjoys the advantages offered by the subtarget for advanced fuels set out in RED II. The perspective of the calculations then shifted towards the EU ETS mechanism. Depending on the actual GHG performance and cost of the specific biomethane pathway, CO2 emission certificate prices of between ~120 EUR*t CO2-eq.−1 and ~250 EUR*t CO2-eq.−1 were calculated.
Based on the calculations, the following points can be concluded:
The RED II perspective
  • In general, there are significant differences in the GHG mitigation costs for the various advanced biofuels pathways investigated. Because of lower GHG emissions per MJ, biomethane based on animal manure tends to have lower GHG mitigation costs compared to other advanced biofuels. This is a competitive advantage within the protected market for advanced fuels set out by RED II. Sufficient production capacities and biomass potentials are available to serve this defined market with biomethane from waste and residues. However, the current low rate of gaseous fuels in the German and European transport sectors reveals the existing limitations for the use of biomethane. An expansion of the gas-fueled fleet and the filling station infrastructure could be one measure to unlock the unused potential of GHG mitigation by using biomethane from waste and residues, in particular animal manure, in the transport sector.
The EU ETS perspective
  • Under the current conditions, the EU ETS is not an effective instrument for increasing the costs of carbon-intensive energy carriers to reach a breakeven between the costs for natural gas and biomethane. Considering the current price for CO2 certificates, we propose taking into account the GHG reduction potential of the non-ETS agricultural sector in order to unlock unused GHG mitigation potential for the reduction of GHG emissions. The mitigation costs for biomethane from animal manure would thus decrease from 164 EUR*t CO2-eq.−1 to 75 EUR*t CO2-eq.−1.
  • Due to the flexibility in terms of the types of substrates used for biomethane production, this technology can, in theory, tap great potentials for GHG mitigation in sectors outside the EU ETS (e.g., agriculture, waste treatment, and disposal). Internalizing, and thus capitalizing on, these effects will significantly decrease the GHG mitigation costs for the respective biomethane pathways in the EU ETS.
Biomethane from waste and residues is an interesting and potentially powerful way to mitigate GHG emissions in the EU transport sector. However, the magnitude of the GHG mitigation effects from biomethane strongly depends on the type of substrate used in biomethane production processes, the greenhouse gas emissions from the fossil energy carrier substituted by biomethane, and the calculation method used by the different GHG mitigation instruments.

Author Contributions

Conceptualization, all authors; methodology, K.O. and S.M.; software, K.O.; validation, S.M. and D.T.; formal analysis, K.O.; investigation, K.O. and S.M.; resources, K.O. and S.M.; data curation, K.O. and S.M.; writing—original draft preparation, K.O. and D.T.; writing—review and editing, D.T. and S.M.; visualization, K.O.; supervision, D.T.; project administration, K.O.; funding acquisition, S.M. All authors have read and agreed to the published version of the manuscript.

Funding

The project is supported (was supported) by funds of the Federal Ministry of Food and Agriculture (BMEL) based on a decision of the Parliament of the Federal Republic of Germany and by funds of European Union’s Horizon 2020 research and innovation programme under grant agreement No. 646533.

Institutional Review Board Statement

Not applicable.

Informed Consent Statement

Not applicable.

Data Availability Statement

Not applicable.

Conflicts of Interest

The authors declare no conflict of interest.

References

  1. European Commission. Directive 2001/77/EC of the European Parliament and of the Council of 27 September 2001 on the Promotion of Electricity Produced from Renewable Energy Sources in the Internal Electricity Market; European Commission: Brussels, Belgium, 2001.
  2. European Commission. Directive 2009/30/EC of the European Parliament and of the Council of 23 April 2009 Amending Directive 98/70/EC as Regards the Specification of Petrol, Diesel and Gas-Oil and Introducing a Mechanism to Monitor and Reduce Greenhouse Gas Emissions and Amending Council Directive 1999/32/EC as Regards the Specification of Fuel Used by Inland Waterway Vessels and Repealing Directive 93/12/EEC; European Commission: Brussels, Belgium, 2009.
  3. European Commission. Directive (EU) 2018/ 2001 of the European Parliament and of the Council—Of 11 December 2018—On the Promotion of the Use of Energy from Renewable Sources; European Commission: Brussels, Belgium, 2018.
  4. European Commission. Directive (EU) 2015/1513 of the European Parliament and of the Council of 9 September 2015 Amending Directive 98/70/EC Relating to the Quality of Petrol and Diesel Fuels and Amending Directive 2009/28/EC on the Promotion of the Use of Energy from Renewable Sources September 2015; European Commission: Brussels, Belgium, 2015.
  5. Federal Government of Germany. Act on Granting Priority to Renewable Energy Sources (Renewable Energy Sources Act-EEG); Federal Government of Germany: Berlin, Germany, 2012.
  6. Giuntoli, J.; Agostini, A.; Edwards, R.; Marelli, L. Solid and Gaseous Bioenergy Pathways: Input Values and GHG Emissions. Calculated According to the Methodology set in COM(2010) 11 and SWD(2014) 259, Version 1a; Joint Research Center (JRC): Luxembourg, 2015. [Google Scholar] [CrossRef]
  7. Haenel, H.-D.; Claus, R.; Ulrich, D.; Eike, P.; Annette, F.; Sebastian, W.; Brigitte, E.-M.; Helmut, D.; Carsten, S.; Beate, B.; et al. Calculations of Gaseous and Particulate Emis-sions from German Agriculture 1990–2012; Thünen Report 17; Thünen Institut: Braunschweig, Germany, 2014. [Google Scholar]
  8. Dämmgen, U.; Webb, J. The development of the EMEP/CORINAIR Guidebook with respect to the emissions of different ni-trogen and carbon species from animal production. Agric. Ecosyst. Environ. Mitig. Greenh. Gas Emiss. Livest. Prod. 2006, 2–3, 241–248. [Google Scholar]
  9. Oehmichen, K.; Thrän, D. Fostering renewable energy provision from manure in Germany: Where to implement GHG emis-sion reduction incentives. Energy Policy 2017, 110, 471–477. [Google Scholar] [CrossRef]
  10. Scheftelowitz, M.; Thrän, D. Unlocking the Energy Potential of Manure—An Assessment of the Biogas Production Potential at the Farm Level in Germany. Agriculture 2016, 6, 20. [Google Scholar] [CrossRef] [Green Version]
  11. van Melle, T.; Peters, D.; Cherkasky, J.; Wessels, R.; Mir, G.; Hofsteenge, W. Gas for Climate: How Gas Can Helpto Achievethe Paris Agreement Target in an Affordable Way; European Biogas Association: Brussels, Belgium, 2018. [Google Scholar]
  12. DBFZ. Resource Data Repository, Webapplicaton, Leipzig. 2021. Available online: https://webapp.dbfz.de/resource-database/?lang=en (accessed on 26 October 2021).
  13. European Parliament and Council. Proposal for a Directive of the European Parliament and of the Council Amending Directive (EU) 2018/2001, Regulation (EU) 2018/1999 and Directive 98/70/EC as Regards the Promotion of Energy from Renewable Sources, and Repealing Council Directive (EU) 2015/652; European Commission: Brussels, Belgium, 2021.
  14. Brosowski, A.; Krause, T.; Mantau, U.; Mahro, B.; Noke, A.; Richter, F.; Raussen, T.; Bischof, R.; Hering, T.; Blanke, C.; et al. How to measure the impact of biogenic residues, wastes and by-products: Development of a national resource monitoring based on the example of Germany. Biomass Bioenergy 2019, 127, 105275. [Google Scholar] [CrossRef]
  15. Bartoli, A.; Hamelin, L.; Rozakis, S.; Borzęcka, M.; Brandão, M. Coupling economic and GHG emission accounting models to evaluate the sustainability of biogas policies. Renew. Sustain. Energy Rev. 2019, 106, 133–148. [Google Scholar] [CrossRef]
  16. Agostini, A.; Battini, F.; Padella, M.; Giuntoli, J.; Baxter, D.; Marelli, L.; Amaducci, S. Economics of GHG emissions mitigation via biogas production from Sorghum, maize and dairy farm manure digestion in the Po valley. Biomass Bioenergy 2016, 89, 58–66. [Google Scholar] [CrossRef]
  17. Vetter, A.; Arnold, K. Klima- und Umwelteffekte von Biomethan, Anlagentechnik und Substratauswahl; Wuppertal Institut: Wuppertal, Germany, 2010. [Google Scholar]
  18. Rana, R.; Ingrao, C.; Lombardi, M.; Tricase, C. Greenhouse gas emissions of an agro-biogas energy system: Estimation under the Renewable Energy Directive. Sci. Total Environ. 2016, 550, 1182–1195. [Google Scholar] [CrossRef] [PubMed] [Green Version]
  19. Manninen, K.; Koskela, S.; Nuppunen, A.; Sorvari, J.; Nevalainen, O.; Siitonen, S. The applicability of the renewable energy directive calculation to assess the sustainability of biogas production. Energy Policy 2013, 56, 549–557. [Google Scholar] [CrossRef]
  20. Long, A.; Bose, A.; O’Shea, R.; Monaghan, R.; Murphy, J.D. Implications of European Union recast Renewable Energy Directive sustainability criteria for renewable heat and transport: Case study of willow biomethane in Ireland. Renew. Sustain. Energy Rev. 2021, 150, 111461. [Google Scholar] [CrossRef]
  21. Kraussler, M.; Pontzen, F.; Müller-Hagedorn, M.; Nenning, L.; Luisser, M.; Hofbauer, H. Techno-economic assessment of biomass-based natural gas substitutes against the background of the EU 2018 renewable energy directive. Biomass Conv. Bioref. 2018, 8, 935–944. [Google Scholar] [CrossRef] [Green Version]
  22. KTBL. Leistungs-Kostenrechnung Pflanzenbau; Web-Application. 2020. Available online: https://daten.ktbl.de/dslkrpflanze/postHV.html (accessed on 26 October 2021).
  23. GasNZV. Verordnung über den Zugang zu Gasversorgungsnetzen; Deutscher Bundestag: Berlin, Germany, 2017.
  24. Johann Heinrich von Thünen-Institut. Biogas-Messprogramm II; Johann Heinrich von Thünen-Institut: Gülzow, Germany, 2010. [Google Scholar]
  25. BioGrace II Calculation Rules. Harmonised Greenhouse Gas Calculations for Electricity, Heating and Cooling from Biomass. Version 4a. Available online: www.biograce.net (accessed on 8 June 2021).
  26. Edwards, R.; Padella, M.; Giuntoli, J.; Koeble, R.; O’Connell, A.; Bulgheroni, C.; Marelli, L.; Lonza, L. Definition of Input Data to Assess GHG Default Emissions from Biofuels in EU Legislation: Version 1d—2019; Publications Office of the European Union: Luxembourg, 2019. [CrossRef]
  27. Majer, S.; Oehmichen, K. Comprehensive Methodology on Calculating Entitlement to CO2 Certificates by Biomethane Producers: BIOSURF Deliverable D5.5; DBFZ: Leipzig, Germany, 2017. [Google Scholar]
  28. Daniel-Gromke, J.; Rensberg, N.; Denysenko, V.; Barchmann, T.; Oehmichen, K.; Beil, M.; Beyrich, W.; Krautkremer, B.; Trommler, M.; Reinholz, T.; et al. Optionen für Bio-Gas-Bestandsanlagen bis 2030 aus Ökonomischer und Energiewirtschaftlicher Sicht: Abshlussbericht; Umweltbundesamt: Dessau-Roßlau, Germany, 2019.
  29. Majer, S.; Kornatz, P.; Daniel-Gromke, J.; Rensberg, N.; Brosowski, A.; Oehmichen, K.; Liebetrau, J. Stand und Perspektiven der Bio-gaserzeugung aus Gülle; DBFZ: Leipzig, Germany, 2019. [Google Scholar]
  30. Meisel, K.; Millinger, M.; Naumann, K.; Majer, S.; Müller-Langer, F.; Thrän, D. Untersuchungen zur Ausgestaltung der Biokraftstoffgesetzgebung, Abschlussbericht; DBFZ Deutsches Biomasseforschungszentrum Gemeinnützige GmbH: Leipzig, Germany, 2019. [Google Scholar]
  31. Zech Konstantin, M.; Meisel, K.; Brosowski, A.; Toft, L.V.; Müller-Langer, F. Environmental and economic assessment of the Inbicon lignocellulosic ethanol technology. Appl. Energy 2016, 171, S347–S356. [Google Scholar] [CrossRef]
  32. Millinger, M.; Ponitka, J.; Arendt, O.; Thrän, D. Competitiveness of advanced and conventional biofuels. Results from least-cost modelling of biofuel competition in Germany. Energy Policy 2017, 107, S394–S402. [Google Scholar] [CrossRef]
  33. Albrecht Friedemann, G.; König Daniel, H.; Baucks, N.; Dietrich, R. A standardized methodology for the techno-economic evaluation of alternative fuels—A case study. Fuel 2017, 194, S511–S526. [Google Scholar] [CrossRef] [Green Version]
  34. EUROSTAT. Natural Gas Price Values for Europe. Available online: https://ec.europa.eu/eurostat/statistics-explained/index.php?title=Natural_gas_price_statistics/de&oldid=363671#Erdgaspreise_f.C3.BCr_Industriekunden (accessed on 8 June 2021).
  35. Giuntoli, J.; Agostini, A.; Edwards, R.; Marelli, L. Solid and Gaseous Bioenergy Pathways: Input Values and GHG Emissions: Calculated According to Methodology Set in COM(2016) 767: Version 2; Joint Research Center (JRC): Luxembourg, 2017. [Google Scholar] [CrossRef]
  36. Purr, K.; Günther, J.; Lehmann, H.; Nuss, P. Wege in Eine Ressourcenschonende Treibhausgasneutralität. RESCUE-Studie. Hg. v. Umweltbundesamt. Dessau-Roßlau (CLIMATE CHANGE, 36/2019). Available online: https://www.umweltbundesamt.de/sites/default/files/medien/376/publikationen/rescue_studie_cc_36-2019_wege_in_eine_ressourcenschonende_treibhausgasneutralitaet.pdf (accessed on 6 October 2021).
  37. Kemmler, A.; Kirchner, A.; Auf der Maur, A.; Ess, F.; Kreidelmeyer, S.; Pjégsa, A.; Spillmann, T.; Wünsch, M.; Ziegenhagen, I. Energiewirtschaftliche Projektionen und Folgeabschätzungen 2030/2050: Dokumentation vonReferenzszenariound Szenario mit Klimaschutzprogramm; Prognos: Berlin, Germany, 2020. [Google Scholar]
  38. Concawe’s Transport and Fuel Outlook towards EU 2030 Climate Targets. Concawe Brussels. April 2021. Available online: https://www.concawe.eu/wp-content/uploads/Rpt_21-2.pdf (accessed on 25 November 2021).
  39. USDA Foreign Agricultural Service. EU-28: Biofuels Annual—EU Biofuels Annual. 2019. Available online: https://apps.fas.usda.gov/newgainapi/api/report/downloadreportbyfilename?filename=Biofuels%20Annual_The%20Hague_EU-28_7-15-2019.pdf (accessed on 26 October 2021).
  40. Deutsche Energie-Agentur GmbH (Dena). Dena Analyse Branchenbarometer Biomethan 2020; Deutsche Energie-Agentur: Berlin, Germany, 2020. [Google Scholar]
  41. Bundesministerium für Wirtschaft und Energie (BMWi). Zeitreihen zur Entwicklung der Erneuerbaren Energien in Deutschland unter Verwendung der Daten der Arbeitsgruppe Erneuerbare Energien-Statistik (AGEE-Stat) Mit Stand Februar 2020; Bundesministerium für Wirtschaft und Energie (BMWi): Berlin, Germany, 2020. [Google Scholar]
  42. Radke, S. Verkehr in Zahlen 2019/2020; Bundesministerium für Verkehr und digitale Infrastruktur: Berlin, Germany, 2019. [Google Scholar]
  43. EUROSTAT. Complete Energy Balances. NRG_BAL_C. Hg. v. Eurostat. 2021. Available online: https://ec.europa.eu/eurostat/databrowser/view/NRG_BAL_C__custom_1071932/default/table?lang=de (accessed on 26 October 2021).
  44. Pääkkönen, A.; Aro, K.; Aalto, P.; Konttinen, J.; Kojo, M. The Potential of biomethane in replacing fossil fuels in heavy transport—A case study on Finland. Sustainability 2019, 11, 4750. [Google Scholar] [CrossRef] [Green Version]
Figure 1. Main process steps of the advanced biofuel pathways under consideration: (A) biomethane from manure, (B) biomethane from manure and straw, (C) biomethane from biowaste, (D) ethanol from straw, and (E) FT diesel from woodchips.
Sustainability 13 14007 g001
Figure 2. GHG mitigation potential and cost bandwidths for the biomethane concepts under consideration and other advanced biofuels.
Sustainability 13 14007 g002
Figure 3. CO2 mitigation costs functions based on cost/price differences for advanced biofuels, assuming that GHG emissions from biofuel production are calculated according to the RED II methodology (see Table 1 for emission values).
Sustainability 13 14007 g003
Figure 4. CO2 mitigation costs in relation to cost/price differences for advanced biofuels based on biomethane pathways in comparison to natural gas, assuming that GHG emissions from biomethane are zero within the EU ETS.
Sustainability 13 14007 g004
Figure 5. CO2 mitigation costs in relation to cost/price differences for different biomethane pathways in comparison to natural gas, assuming that GHG emissions from biomethane are zero within the EU ETS. For biomethane from animal manure and animal manure + straw, the GHG benefit from avoiding methane emissions from manure storage (animal manure credit) is included here.
Sustainability 13 14007 g005
Table 1. Basic assumptions for GHG mitigation cost calculations.
Advanced Biofuels
Biomethane from ManureBiomethane from Manure (80%) and Straw (20%)Biomethane from BiowasteBioethanol from StrawBtL from Woodchips
Overall GHG emissions in g CO2-eq./MJ (for biofuels: calculated according the methodology set out in RED II [3])−76 (own calculations based on [22,27,28])−10 (own calculations based on [22,27,28]) 13 (own calculations based on [22,27,28])13.7 [26]13.7 [26]
GHG emissions from improved manure management in g CO2-eq./MJ−88 (own calculations based on [22,27,28])−19 (own calculations based on [22,27,28]) ---
Costs in EUR ct/kWh6.7 [27]–11 [29] 8.8 [27]–12.85 [29] 6.2 [27]–9.2 [28]6.3 [30]–14 [31]7.5 [32]–12, 45 [33]
Publisher’s Note: MDPI stays neutral with regard to jurisdictional claims in published maps and institutional affiliations.

