Abstract
Big Data Adoption (BDA) has already gained tremendous attention from executives in various fields. However, it is still not well explored in the education sector, where a large amount of academic data is being produced. Therefore, integrating Technology Organization Environment (TOE) and Diffusion of Innovation (DOI), this study aims to develop a theoretical model to identify the factors that influence BDA in the higher education sector. To do so, significant technology-, organization-, and environment-related factors have been extracted from previous BDA studies. Meanwhile, the moderating effects of the university size and the university age are added into the developed model. A sample of 195 data was collected from the managerial side of virtual university (VU) campuses in Pakistan using an online survey questionnaire. Structural equation modeling (SEM) was used to test the research model and developed hypotheses. The results showed that relative advantage, complexity, compatibility, top management support, financial resources, human expertise and skills, competitive pressure, security and privacy, and government policies are significant determinants of BDA. However, the results did not support the influence of IT infrastructure on BDA. Based on the findings, this study provides guidelines for the successful adoption of big data in higher education sector. This study can serve as a piece of help to the ministry of education, administrators, and big data service providers for the smooth adoption of big data.
1. Introduction
Recently, big data has gained tremendous attention among scholars [1]. Big data refers to huge and multifaceted data sets that need potent storage systems and tools [2]. The characteristics of big data make it distinguishable from conventional data. Most of the research characterized big data into seven V’s [3], namely: Volume (amount of data), Velocity (speed of data), Variety (structure of data), Veracity (accuracy of data), Variability (meaning of data), Volatility (validity of data), and Value (use of data).
Big Data Adoption (BDA) is a procedure that permits novelty to change the substructure of an institution [4]. BDA generates various benefits and improves the overall IT infrastructure of organizations [5]. Organizations increase the storage capacity to meet competency and performance requirements [6,7]. It allows dynamic provision for parallel processing and hires ICT-trained academic staff to support and manage varied data types.
BDA has enormous potential to cut off the cost and provide instant digital-based solutions. Most organizations are now producing large amounts of data [8,9]. This data can be helpful for organizations to gain various competitive advantages and make profitable decisions [10].
BDA promotes data-driven decision-based culture, which is helpful in heightening employee competency [11]. After adoption, the organization staff becomes pro-active while taking decisions instead of unreceptive action. BDA is beneficial to make better decisions for organizations [12,13].
Competitive pressure affects organizations’ inducement to produce or invent some innovative item. BDA supports competitive pressure by creating discriminated price strategies and observing consequences instantly [13].
Sustainability is important for the technology adoption today, as it is considered a key element that has the potential to improve organization performance as well as to offer a source of competitive advantage; the same applies for BDA [8,9]. The importance of BDA and sustainable development has recently highlighted by various studies like [11,12]. However, BDA is one of the factors that could be used to enhance the sustainability. Now, large numbers of students are using technology for educational purposes [14]. Consequently, a huge amount of data (size ranges of terabytes and petabytes) is produced from various educational and learning activities [15]. Big data growth has been reached to petabytes [14]. Educational big data can be useful to instantly analyze students’ learning patterns and design the content accordingly. BDA paves the path for a radical educational system, where learning can be made easy for students. Thus, BDA can enhance the operational efficiency of the education sector [16].
So far, multiple BDA studies have been conducted in firms [17], and organizations [18]. However, BDA is still not well explored in the education domain, where a huge quantity of digital and structural data is produced through various activities. Educational data is expanding gradually as numbers of students are growing [15,19].
BDA is necessary for the education sector due to various competitive advantages it provides, such as the upgrade of the overall setup and educational managerial competency, catering for the future need and fulfillment of the demands. BDA can be amplified by proposing a theoretical framework. Nevertheless, the focus of previous studies mainly concentrated on the benefits of big data analytics in different educational aims [20]. Identifying the factors that influence BDA from decision-makers’ perspectives and developing a theoretical model for BDA in the education sector are still uncovered in the literature [21].
The BDA theoretical model in education is needed to predict the situation and phenomena that pave the path for a smooth adoption. Therefore, this study aims to develop a model to identify the factors that influence BDA in the education section. Meanwhile, even moderating variables can significantly affect the relationships between the predictor variables and BDA in the proposed model. However, the examination of moderating effects in BDA studies has been totally overlooked. Age and size are important moderating factors that have been examined in many contexts [22]. Therefore, aim of this study is to identify the factors that influence decision-makers’ adoption of big data in education sector and develop a theoretical model accordingly.
The research objectives of this study are as follow:
- To identify the factors that influence decision-makers’ BDA in education sector.
- To develop a theoretical model for decision-makers’ BDA in education sector.
The rest of the paper is organized as follows: Section 2 presents the background of relevant topics. Section 3 shows the theoretical framework. In Section 4, hypotheses and the model development are presented. Next, Section 5 covers the research methodology. Section 6 presents the results of the study. In Section 7, the discussion of results is presented. Section 8 presents the conclusion and research contributions. Finally, the limitations and future research directions are given in Section 9.
2. Background
2.1. Big Data Adoption-Related Studies
BDA helps to gain competitive advantage and surpass the decisiveness process in institutions. So far, manifold studies have examined BDA and its practice by employing numerous theoretical models. Human–Organization–Technology fit (HOT-fit) and Technology Organization Environment (TOE) frameworks were used as base to propose a theoretical model [17]. This study found the determinants affecting BDA in firms.
The previous studies employed TOE to examine the factors affecting innovation in firms [23,24]. Similarly, [25] used the TOE framework to study the impact of the BDA determinants. In this study, data was collected from organization employees. TOE was used to analyze BDA in manufacturing companies [26]. TOE and Diffusion of Innovation (DOI) models were used to investigate the factors that affect BDA in Kenya supermarkets [27]. TOE was used to study the elements that hinder BDA in Saudi banks [28].
Moreover, [29,30] investigated the factors in the organizational adoption of big data. In these studies, DOI, TOE, and Technology Acceptance Model (TAM) were used as baseline models. Another study conducted by [31] examined the determinants that hamper BDA by utilizing TOE. The authors of [32] analyzed the organizational factors that affect BDA. This study integrated DOI and TOE. TOE was used to evaluate BDA in the organizational realm [33].
Thus, it can be concluded that TOE and DOI were found to be the substantial theoretical models for BDA in firms [17], organizations [33], companies [26], supermarkets [27], and finance [28]. A large number of studies used a questionnaire for data collection and SEM to analyze the structural relationships between variables. The above literature shows that there is still a lack of a BDA theoretical framework in the education domain. Therefore, this research gap can be addressed by developing a big data theoretical framework for the education domain. A theoretical framework for BDA in the educational domain can be helpful to analyze and solve the multifarious problems to fulfill future needs.
2.2. Theoretical Framework
2.2.1. TOE
In 1990, the TOE framework was introduced by [34]. TOE is a multidisciplinary framework. Previous studies highlighted its wide pertinence, versatility, and affinity in different domains such as education [35], e-commerce, and e-business. Besides, the TOE framework allows an in-depth analysis of what elements should be considered that affect BDA [31]. The technological context encompasses all interior and exterior technologies. It highlights how technological attributes influence the adoption process [36]. The organizational context exposes the firm settings, measurements, and attributes that help in adoption decisions.
2.2.2. DOI
The DOI theory was proposed by Rogers in 1962 and developed further later [37]. It explains the concept of the innovation process. The process of innovation is like a novelty, which sets aside some effort for acceptance or rejection by organizations [37]. DOI proposed that innovational adoption-decision is influenced by five elements: Relative advantage, complexity, compatibility, trialability, and observation.
2.2.3. Justification for Integrating TOE and DOI
Due to the swift advancement of information technology, the applicability of a single theoretical model is arguable [33]. Therefore, it is imperative to integrate more than one model to get an extensive comprehension of technology adoption.
The integration of TOE and DOI can better explain the innovation from the organization perspective and observe the internal and external factors more effectively. Combining TOE and DOI provides highly useful theoretical framework bases for BDA [31]. The TOE framework prevails over the dominance of the technical side [33]. On the other hand, DOI provides a wide perception of the diffusion occurrence and presents good explanations about how innovations can be adopted [30].
Integrating DOI with TOE provides an enriched predictive power that can be useful to detect and unravel the technological and innovational adoption problems at an earlier stage [31]. DOI has been extensively used to promote the adoption of technology. However, TOE is considered for the prediction of technological, organization, and environmental factors. Hence, integrating DOI and TOE promises a useful theoretical outcome to drive a new model for BDA. Thus, this research proposes a model by integrating the TOE and DOI framework.
3. Hypotheses and Model Development
This study proposed a theoretical model by incorporating the DOI and TOE frameworks (Figure 1). The constructs were identified by reviewing BDA studies. However, considering TOE and DOI as a base for model development, these constructs can be categorized into technology, organization, and environment contexts (Table 1). Moreover, to evade the redundancy and to obtain more comprehending results some of the constructs were assembled in the same group. In total, ten constructs were extracted through BDA studies: Technology (relative advantage, complexity, compatibility, and IT infrastructure), organization (top management support, financial resources, human expertise and skills) and environment (competitive pressure, security and privacy concerns, and government policies). University size and university age were used as moderators to analyze the relationship between independent and dependent factors.
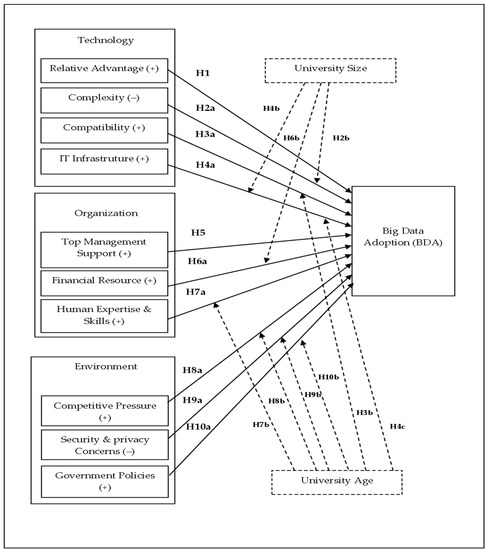
Figure 1.
Proposed Theoretical Model for Big Data Adoption in Education Sector.

Table 1.
Extracted constructs through BDA studies.
3.1. Technology Factors
3.1.1. Relative Advantage
Relative advantage is the degree to which advancement is seen better than the thought it overrides [37]. It has been used to increase the opportunities, competitiveness, and improve user services [32]. It is found to be the important determinant that positively influences the adoption of innovative services in higher education institutions [38]. Therefore, it is hypothesized that:
Hypothesis (H1).
Relative advantage positively impacts on BDA.
3.1.2. Complexity
Complexity refers to a characteristic of big data that is not understandable and simple to utilize [31]. Complexity has been tested in different educational realms [39]. In educational research, complexity has been observed as a negative impact on adopting innovation [40]. However, the perception of complexity may be different between adopters [33]. The complexity and technology adoption can be influenced by moderator size [27]. It has been proved that size is an important factor that affects the innovation diffusion factors [40]. University size refers to the total number of employees [41]. Therefore, it is hypothesized that:
Hypothesis (H2a).
Complexity negatively impacts BDA.
Hypothesis (H2b).
The relationship between the complexity and BDA will be further strengthened by university size.
3.1.3. Compatibility
Compatibility is the degree to which technological advancement is perceived as consistent with the existing principles, experience, and needs of prospective adopters [37]. Compatibility has been consistently identified as one of the most critical BDA predictors [31]. Age is a moderator that can influence the compatibility on BDA [27]. There is much evidence that age can be a significant moderator in various adoption contexts [41]. Therefore, it is hypothesized that:
Hypothesis (H3a).
Compatibility positively influences BDA.
Hypothesis (H3b).
The relationship between compatibility and BDA will be further strengthened by the university age.
3.1.4. IT Infrastructure
IT infrastructure refers to the assembling and utilization of information technology at the organizational level [40]. IT infrastructure is related with software and hardware technologies [32]. IT infrastructure is a necessity of university as it plays a significant role in technological adoptions [42]. It imparts reliable storage, fast processing, and easy integration for big data management. The size and age can strengthen the relationship of IT infrastructure and technological adoption [27]. Therefore, it is hypothesized that:
Hypothesis (H4a).
IT infrastructure positively influences BDA.
Hypothesis (H4b).
The relationship between the IT infrastructure and BDA will be further strengthened by the university size.
Hypothesis (H4c).
The relationship between the IT infrastructure and BDA will be further strengthened by the university age.
3.2. Organizational Factors
3.2.1. Top Management Support
Top management support is the degree to which it perceives the significance and relevance for BDA [43]. The top management support is necessary to incorporate the rules and information and adopt the innovation [31]. Thus, management support can be a significant BDA factor [32]. Therefore, it is hypothesized that:
Hypothesis (H5).
Top management support positively influences BDA.
3.2.2. Financial Resource
Financial resource referred to the budget available to adopt and execute innovative technology and in hiring potential administrative staff [43]. It is an important determinant that distinguishes the adopter and non-adopter [17]. The size shows a positive moderating effect of the adoption and financial resources [41]. Therefore, it is hypothesized that:
Hypothesis (H6a).
Financial resources positively impact on BDA.
Hypothesis (H6b).
The relationship between the financial resource and BDA will be further strengthened by the university size.
3.2.3. Human Expertise and Skills
Human expertise and skills refer to the employees that possess the ability and IT knowledge related to BDA [40]. Skills such as strong programming and logical abilities are needed in the big data adoption and utilization process. [26]. Human expertise plays a noteworthy role in utilizing technological advancement [42]. The relationship between human expertise and skill and BDA is moderated by age [27]. Therefore, it is hypothesized that:
Hypothesis (H7a).
Human expertise and skills positively influence BDA.
Hypothesis (H7b).
The relationship between human expertise and skill, and BDA will be further strengthened by the university age.
3.3. Environmental Factors
3.3.1. Competitive Pressure
Competitive pressure is the degree at which an organization is affected by opponents [29]. Competitive pressure found to be the major adoption determinant that indicates the intensity of competition [28]. Age can moderate the relationship between competitive pressure and innovational adoption [39]. Therefore, it is hypothesized that:
Hypothesis (H8a).
Competitive pressure positively influences BDA.
Hypothesis (H8b).
The relationship between competitive pressure and BDA will be further strengthened by the university age.
3.3.2. Security and Privacy Concerns
Security and privacy concerns are associated with individual safety and moral values [29]. Security and privacy concerns were the obstructing factors of BDA [35]. Previous educational research negatively correlated security and privacy with technology [43]. The age is a moderator that can influences the security and privacy concerns and BDA [27]. Therefore, it is hypothesized that:
Hypothesis (H9a).
Security and privacy concerns’ negatively impact BDA.
Hypothesis (H9b).
The relationship between security and privacy concerns and BDA will be further strengthened by the university age.
3.3.3. Government Policies
Government policies are developed to reduce potential issues, particularly connected with individual protection [33]. The BDA can be affected by government rule and policies [38]. Age can be moderated by government policies and BDA [41]. Therefore, it is hypothesized that:
Hypothesis (H10a).
Government policies positively impact on BDA.
Hypothesis (H10b).
The relationship between Government policies and BDA will be further strengthened by the university age.
4. Research Methodology
This study followed quantitative methods to achieve the research objectives.
4.1. Statistical Methods
In this study, statistical procedures are employed to check the validity of proposed BDA model. This helps to identify the significant factors that influence BDA in the higher education sector.
The analysis consists of two parts. The first data analysis section is for descriptive data. The Excel 2007 software is used to analyze the respondent profile data. The second section is based on the validation of the model. Partial Least Squares Structural Equation Modeling (PLS-SEM) is used. PLS-SEM is a robust method used for evaluation and theory prediction, especially in big data and technology adoption [17].
The aim of this study is to identify the factors that influence BDA in the education sector and develop a theoretical model accordingly. PLS-SEM technique is used in this study to test the developed model and associated hypotheses. SmartPLS 3.0 is employed to perform the empirical analysis. Measurement model was assessed by checking reliability and validity through PLS algorithm and then structural model was assessed the status of the hypotheses (accepted/rejected) through the Bootstrapping process.
4.2. Research Context
In Pakistan, large numbers of universities are using traditional classroom-based teaching. The VU of Pakistan is the pioneer institution that is entirely based on innovative ICT facilities. It has more than 100,000 students in approximately 200 campuses. VU students are using the latest technology for different educational purposes. Consequently, a huge amount of digital and structured data is produced from various educational and learning activities. This data is managed by IT staff at various levels.
The primary role of database administrators, networker’s administrators, and IT management is to provide secure, consistent, and reliable services. BDA is an organizational decision that is mainly ended by upper management [30]. Therefore, this study targeted the networker’s administrators, database administrators, and IT management of VU campuses for data collection.
4.3. Questionnaire Validation through Experts
Primarily, five experts reviewed the questionnaire for the purpose of content validity. Three experts were from academic fields, one was a professional big data consultant, and one previously worked as a consultant in an analytic data company. According to the experts’ comments and suggestions, necessary revisions were made in the questionnaire items.
The content validity for each item is the percentage of expert responses that rated the item as 1 to 4, respectively. Experts were asked to review the draft and evaluate each item based on two criteria, namely, relevance and simplicity. The experts were also asked to suggest revisions in the item if needed. Each reviewer independently rated on a 4-point scale (1 = not relevant, 2 = somewhat relevant, 3 = relevant, 4 = very relevant), and (1 = not simple, 2 = somewhat simple, 3 = simple, 4 = very simple). The content validity index is calculated in the form of a percentage. The percentage of experts who rated 3 or 4, is expressed as a number between 0 (0%) and 1 (100%). The value of 1.00 is acceptable for 3 to 4 experts’ panels [44,45]. Values between 0.78 and 1 are acceptable for 5 experts’ panels [46]. Content validity index gauges the content validity of individual items. Content validity index (I-CVI) is the most used method to calculate the item-level validity. For instance, 4 out of 5 experts agree on an item, then I-CVI is 4/5 = 0.80.
However, S-CVI calculates the content validity of the overall scale. S-CVI can be calculated by using S-CVI/UA, Universal Agreement (UA), or S-CVI/Ave [46]. Most of the studies reported only I-CVI or S-CVI [47]. However, this study employed all methods. S-CVI/UA (Universal Agreement (UA) is calculated by adding all items with I-CVI equal to 1 divided by the total number of items.
However, S-CVI/Ave is calculated by taking the sum of the I-CVIs divided by the total number of items. The S-CVI/UA should be greater than equal to 0.8. However, S-CVI/Ave should be greater than equal 0.9 [48]. The S-CVI/UA values in terms of simplicity and reliability were greater than 0.8. Similarly, S-CVI/Ave values in terms of simplicity and reliability were greater than 0.9. The complete results of 1-CVI, S-CVI/UA, and S-CVI/Ave are shown Appendix A and Table A1 and Table A2.
4.4. Pilot Study
This study utilized a questionnaire to gather data from respondents. In this research, an online survey was designed through Google forms. The survey found to be the most effective method in BDA related studies [31]. In this research, a structured questionnaire was formulated and a 5-point Likert scale extending from “Strongly Disagree (1)” to “Strongly Agree (5)” was utilized. Statistical power increases with sample size [48].
Small samples of 30 to 40 participants are common in the preliminary testing of questionnaires. However, small samples may fail to expose problems and analyze the small-scale data precisely [49]. A default sample size of 80 to 100 participants is mostly recommended for the pilot study [50]. Therefore, to assess the overall feasibility, the questionnaire was also tested through a pilot study with 87 IT-related staff of VU campuses before the research team conducted the main study.
The reliability of the questionnaire was tested through factor loadings, Cronbach’s alpha, and composite reliability (Appendix A, Table A3). However, the validity of the questionnaire was tested through convergent validity and discriminant validity [48]. The convergent validity was ascertained through average variance extracted (AVE). Nevertheless, the discriminant validity was assessed through Fornell–Larcker criterion and cross-loading (Appendix A, Table A4 and Table A5) [48]. It was found that factor one item of complexity was less than 0.7. Therefore, the one item of complexity needed to be removed as its Cronbach’s alpha was 0.66 and factor loaded value was 0.28.
After removing the complexity (complex 1), the test was performed again. Finally, it was found that factor loadings, Cronbach’s alpha, and composite reliability of all items were greater > 0.7. Therefore, it confirms the reliability of the questionnaire.
The AVE of all items were greater than 0.5. It confirms the convergent validity of the questionnaire. In the Fornell–Larcker criterion, the square root of AVE was greater than any of the co-related construct correlations. In cross-loadings the factor loading of all construct items values were greater than other loadings in terms of row and column. Therefore, it confirms the discriminant validity of the questionnaire.
The results showed that reliability and validity of the questionnaire have been confirmed so the main study was conducted. The questionnaire used in the main study is presented in Appendix A and Table A6 [27,51,52,53,54].
4.5. Participants and Data Collection
In this study, purposive sampling technique was employed to collect the data from the respondents. The main goal of using purposive sampling was to focus on the managerial side of VU campuses that were directly handling the networking and data-related issues and facilitating the ICT services.
The online questionnaire link was mailed to IT administrators, campus administrators, network administrators/associate, network administrators, system administrators, and database administrators at VU campuses. All ethical principles regarding confidentiality were strictly followed. A total of 230 responses were received. However, 35 responses were excluded as they were not complete. To ensure the adequacy of the sample size [55] rule of sample size calculation was applied. According to [55], the sample size should be at least 120. The invitation was sent to 450 people. A total of 195 received responses were sufficient to examine and validate the proposed model. According to [56], the average response rate for online surveys is around 30%. However, [57] showed that the average response rates of studies using survey questionnaire range from 27.4% to 51.2%. The response rate of this study is 43.3%. p values or confidence intervals are used to determine whether results are statistically significant. In this study, p values 5% (0.05), 1% (0.01), and 0.1% (0.001) are used.
The result summary of the participant profile is presented in Table 2.
Table 2.
Respondents’ profile.
5. Results
The measurement model (outer model) analysis was used to ascertain the relationship that exists among items and their related constructs. However, the structural model (inner model) analysis was used to uncover the association between the constructs of the model.
5.1. Measurement Model (Outer Model) Assessment
To assess the reliability and validity of constructs, different tests are required to be performed. Construct reliability was analyzed through indicator reliability and internal consistency. The indicator reliability was examined by factor loadings. However, construct reliability was tested by calculating Cronbach’s alpha and composite reliability. According to [58], factor loadings, Cronbach’s alpha, and composite reliability value greater than 0.7 were acceptable. Table 3 shows that the factor loadings, Cronbach’s alpha, and composite reliability of each of the items and the construct are greater than 0.7. These results confirmed construct reliability.
Table 3.
Results of the factor loading, reliability, and convergent validity.
Construct validity was analyzed with convergent validity and discriminant validity. Convergent validity was assessed with the average variance extracted (AVE). The recommended value of AVE is equal to or greater than 0.5 [55]. All the AVE values exceeded the threshold of 0.5. It ranged from 0.67 to 0.87, which ascertained the convergent validity. Table 3 presented the results of this test.
Discriminant validity was assessed with the Fornell–Larcker criterion, cross-loading criterion, and heterotrait–monotrait ratio.
In the Fornell–Larcker criterion, the square root of AVE should be greater than any of the co-related construct correlations [59]. The Fornell–Larcker criterion given in Table 4 confirmed the highest variance with its co-related items. The results reflected an acceptable correlation by comparing constructs values in terms of rows and columns.
Table 4.
Fornell–Larcker Criterion.
Heterotrait–monotrait values less than the threshold of 0.90 are acceptable. The results showed that all construct’s values in terms of rows and columns were less than 0.90 (Table 5).
Table 5.
Heterotrait–Monotrait Ratio (HTMT).
The cross-loadings results reflected that factor loading of all construct items values was greater than other loadings in terms of row and column (Table 6).
Table 6.
Cross-Loadings.
5.2. Structural Model (Inner Model) Assessment
Structural model assessment was carried out after an assessment of the measurement model. Table 7 shows the results of direct relationship hypotheses. In the technology context, relative advantage (p < 0.05), complexity (p < 0.05), and compatibility (p < 0.05) showed significant effects on BDA. Therefore, hypotheses H1, H2a, and H3a were accepted. Conversely, the effect of IT infrastructure (p > 0.05) was not significant. Thus, hypothesis H4a was rejected. In organization context, top management support (p < 0.001), financial resources (p < 0.01), and human resources (p < 0.001) significantly impacted on BDA. Therefore, hypotheses H5, H6a, and H7a were supported. In the environment context, competitive pressure (p < 0.05), security and privacy concerns (p < 0.001), and government policy (p < 0.01) exposed positive effects of BDA. Therefore, hypotheses H8a, H9a, and H10a were also accepted.
Table 7.
Results of Hypotheses (Direct Relationships).
Table 8 presents the results of moderating effects of university age and university size on relationships between technology, organization, and environment factors and BDA. If the p-value is significant (p < 0.05) but the path-coefficient (β value) sign is different with the hypothesis stated, then the hypothesis will be rejected [55]. Hypotheses H2b, H4c, and H6b show negative β values (−0.147), (−0.217), and (−0.171), respectively. Thus, H2b, H4c, and H6b were rejected. The moderating effects of university age on compatibility, human expertise and skills, competitive pressure, and BDA (p > 0.05) were not significant. Therefore, H3b, H7b, and H8b were rejected. The moderating effects of university size on security and privacy concerns, government policies, and BDA (p < 0.05) were significant. Hence, H4b, H9b, and H10b were accepted.
Table 8.
Results of Moderating Relationships.
R² is used to evaluate the integrity of the model. The authors of [60] described the values of R² as (0.67) strong, (0.33) moderate, and (0.19) weak, respectively. The R² value of BDA was 0.689 (Figure 2). It indicates that the proposed model explained 68.9% of the variance and has strong predictive power.
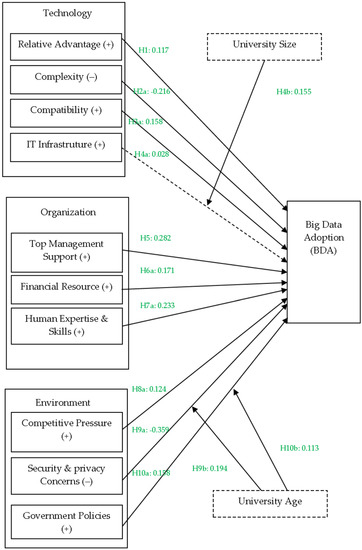
Figure 2.
Theoretical Model for Big Data Adoption in Education Sector.
6. Discussion
The findings of this study indicated that twelve out of nineteen hypotheses were significant. Relative advantage, complexity, compatibility, top management support, financial resources, human expertise and skills, competitive pressure, security and privacy concerns, and government policies were significant determinants of BDA. Likewise, university age and university size were found to have significant moderating effects on BDA. Previous studies have been conducted on BDA in firms [17] and organizations [33]. Therefore, the development of a BDA model for the educational sector by incorporating TOE and DOI frameworks is the major contribution of this research.
In this study, security and privacy concerns was the most significant factor that showed a negative influence on BDA. This result is supported by [32]. This entails that security and privacy concerns are more challenging in the BDA decision stage. Therefore, it is imperative to ensure the privacy and security factor that dissuades the adoption process. Security and privacy measures become stronger and more protective over time. Similarly, in this study, the age of the university reinforces the relationship between security and privacy concerns and BDA.
The result of this study showed a considerable positive influence of top management support on BDA. This result is also correlated with previous study [33] [26]. Therefore, the adoption of innovative technology is an important decision and cannot be taken without top management support [30].
According to the findings, human expertise and skills are important determinants of BDA. It is an important factor that eases the BDA process [32]. Therefore, insufficient human expertise and skills can lead to deferment of adoption decisions. However, this study discovered that the age of the university did not reinforce the relationship between human expertise and skills and BDA. A possible clarification for this result is that human expertise and skills are not based on the institute’s year of existence. Expertise and skills refer to a higher level of knowledge about a specific field that is usually acquired or learned. It entails substantial, explicit, and persistent efforts from the learner’s end.
This study found significant and positive influence of compatibility on BDA. This result correlated with the previous BDA studies e.g., [17,31]. Likewise, the age of the university did not strengthen the relationship between compatibility and BDA. The compatibility component is a very important factor that comes with like-mindedness in all manners to achieve common work objectives. Institutes should hire faculty staff that perfectly fit according to their objective, culture, and norms. Moreover, the institution’s existing infrastructure and system networking should be compatible with new technology. Institution present setup should have the capacity to work together with the latest technology without any discrepancy. This study found a negative relationship between the complexity and BDA. This entails its complication in recognizing the utilization of big data at the adoption stage [27]. This finding is in accordance with previous studies [31]. On the contrary, university size did not fortify the relationship between complexity and BDA. The reason for this finding may be the difficulty of the employees in realizing the level of complexity at the initial stages.
Concerning financial resources, this study showed a positive influence of financial resources on BDA. This result is supported by previous studies [17,33]. However, university size has no effect on the link between financial resources and BDA. Since, the funding of institutions was not dependent upon the number of employees.
Government policies can encourage or discourage the decision of technology adoption [32]. In this study, government policies were found to have an impact on BDA. This result reveals that government support and regulatory bodies are necessary for BDA. Similarly, the age of the university can further strengthen the relationship between government policies and BDA. As the age of the university increases, reliability and reputation also increase. Therefore, government policies are more supportive of reputed institutions.
Surprisingly, the finding of this study shows an insignificant relationship between the IT infrastructure and BDA. This result is supported by previous studies [33]. Moreover, this study did not support the moderating effect of university age on the relationship between IT infrastructure and BDA. However, it discovered a significant moderating effect between university size and IT infrastructure. Indeed, the enormous number of employees is important in enhancing the overall infrastructure.
The results also revealed that the relative advantage has a positive impact on BDA. This result is similar to the earlier research [17,30]. Big data provides significant advantages to institutions such as greater control over work to accomplish tasks more quickly and increase in data storage. Apparently, without the obvious distinctive relative advantages, there would not have been any rationale in adopting big data.
The R2 value of this study was 0.689. The integrity of this study model has been compared with other big data adoption studies. It has been found that this study model had exceeded it all with a significant R2 value. It has been found that previous studies R2 results were lower than in this study. In a previous BDA study [17], R2 values were 0.483 and 0.647. Similarly, another study conducted by [29] in the big data adoption domain. This study’s R2 value was 0.683.
7. Conclusions
BDA has already gained tremendous attention from executives in various fields. The adoption of big data is profoundly beneficial in different sectors. However, it is yet to be explored in the educational sector, where a large amount of academic data is being produced. This study empirically examined BDA in the education sector by integrating DOI and TOE frameworks. Accordingly, a total of ten factors were extracted from the BDA literature and categorized into technology, organization, and environment dimensions. To measure the change effect of the construct systematically, the university age and university size were used as moderators on proposed hypotheses. Data were collected through an online questionnaire survey by targeting the managerial side of VU campuses. SEM was used to assess the developed model and predict the relationships between factors. The findings concluded that nine out of ten direct effects were significant. However, three out of nine moderating effects are considerable. Lastly, based on findings, this study shall propose the guidelines for big data adoption. These guidelines can be helpful for stakeholders.
8. Contributions
The findings of this research have several significant theoretical and practical contributions in the field of BDA and the education sector. So far, previous studies examined the determinants that affect BDA in firms [37], organizations [29], companies [23], finance [28], and supermarket [27]. However, there is a deficiency in the number of studies for the investigation of factors affecting the BDA in the education sector.
Therefore, this study explored the factors that influence BDA in VU campuses. This research can help other researchers and extend the body of knowledge in BDA. This research has practical contributions for different stakeholders. The findings of this research can be helpful for big data service providers and ministry of education in providing appropriate policies for successful BDA. The proposed model and constructs can be helpful to big data service providers in providing services based on the current situation.
Big data service providers can assure the security and privacy measures according to university age by removing the possible security hindrance in the BDA process. Similarly, big data service providers can provide the facilities based on compatibility with the existing setup and human expertise and skill. Big data service providers can provide necessary software platforms and applications to manage complexity and upgrade the existing IT infrastructure for the smooth adoption of big data according to university size.
The proposed model can help in maximizing their services by improving the operational efficiencies in that particular context. Based on the identified factors, the government can develop policies that support universities to cater the present situation. Higher education commissions can develop universities’ financial support policies to ensure technological advancement. Similarly, if universities are facing some restrictions in accessing some records, the education minister can make some relaxation policies to manage that barrier.
Big data provides significant advantages for the university administrators to manage the BDA process smoothly. After BDA, university administrators can manage the competitive pressure and obtain more support from top management for further effectual changes. Based on the findings, this study provides several guidelines for the successful BDA in higher education sector as follows:
8.1. Relative Advantage
It is recommended to educational institutions to fully assess the existing services and analyze the future needs. BDA can be helpful for institutions to cater future needs and solve multifarious issues. Institutions can compare the degree of pre-eminence and benefits to their present services.
8.2. Complexity
Big data setup should be easy to adopt for higher education sector (Figure 3). The adoption process should be certain and safe in terms of its success and performance. Big data service providers should ensure that implementation of all processes is simple, meet the adoption expectations, and achieve desired goals. Then, it should be easier for administrators to actually use BDA.
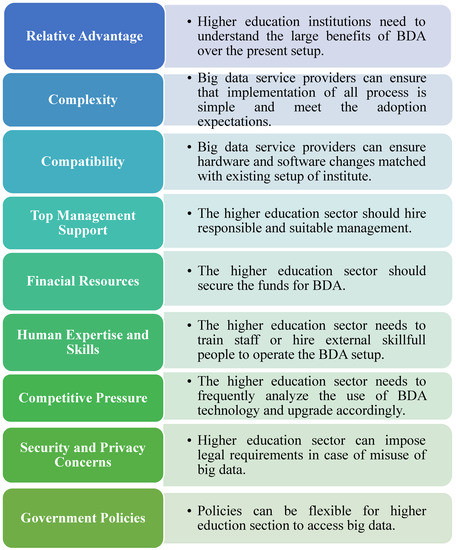
Figure 3.
Guidelines for the Big Data Adoption in Higher Education Sector.
8.3. Compatibility
The BDA process should be compatible with existing setup of higher education sector. The big data service providers should make sure that hardware and software changes need to be compatible with the existing setup of institutions. Big data service providers should also ensure that existing operating systems are compatible with newly integrated software.
8.4. Top Management Support
An important step of BDA is the training or hiring of responsible management. Therefore, the need of suitable managers that are aware of the overall BDA context is necessary. The top management needs to develop overall strategy and planning, monitor the implementation and technical details, follow the timelines, and handle possible issues. Thus, the responsibility of managers should clearly set up for BDA with certainty.
8.5. Financial Resources
Financial resources are important aspects for BDA. Therefore, institutions need to secure the funds that are essential for BDA. There are lots of options available that can be considered for adopting a new technology. However, it is necessary to prioritize the options and select the needed and affordable options based on available funding. Eventually, use of BDA leads to improvement in overall setup and reduces the cost in the long term.
8.6. Human Expertise and Skills
The higher education sector needs trained and skillful people to operate setups for the BDA. The big data service providers need to provide training for institutional staffs to handle the setup after adoption. Additionally, institutions can hire permanent trained staff or contractors according to their setup and need.
8.7. Competitive Pressure
The higher education sector should frequently analyze the use of technology to decide whether they need to obtain or upgrade technology to improve the setup and remain competitive for others. The big data should be properly adopted to maintain the pressure on opponents.
8.8. Security and Privacy Concerns
The institutions can prevent unauthorized access to big data. The data access can be protected through appropriate and standard passwords. Therefore, passwords should be based on several layers. The password can be set up before booting up. The protection should ensure against computer viruses and spies to secure sensitive information. The system should not allow the user to access all data. The log-in and password conditions need to be implemented for limited users. Institutions should impose legal requirements in case of misuse of data. It is easier for intruders to misuse the data than have remote access. The data needs to secure on centralized servers rather than on multiple hard drives. A network risk assessment should be checked.
8.9. Government Policies
Government policies should be flexible and easy for higher education sector to access data. Institutions should clearly describe what information is publicly available and ensure that they follow government advice to protect sensitive and personal information of users.
9. Limitations and Future Work
This research presents some limitations that may guide future studies. First, the aim of this study was to identify the factors that influence decision-makers’ adoption of big data in the education sector and to develop a theoretical model accordingly. Thus, hypotheses were developed and analysis was performed based on the aim of study. It is recommended to the future researchers to consider a six-variable model of Technology, Organization, Environment and University Size, University Age, and Big Data Adoption. Consider the first three as latent variables and selected factors as indicators, respectively. For each latent variable, compare the contribution of its indicators to that variable. This approach will require to apply another set of hypotheses and would make the research more compact. Second, this study proposed a model that measures the direct associations and moderating effects among independent constructs and BDA. However, the mediating role of these constructs for future research could be considered. Third, the BDA decision depends on the managerial side. Therefore, this study collected data from the managerial side. This study amplifies the understanding of BDA and the academic realm from a managerial point of view. However, future research can be conducted at the post-adoption stage, where data can be collected from the end-users. Fourth, in this study, 10% of the respondents had a length of service of more than 10 years. In future studies, the effect of seniority in higher education on the results can be measured. Lastly, since this study was conducted by employing cross-sectional design due to the time constraint factor, longitudinal research is expected to compare the results of different adoption periods.
Author Contributions
Conceptualization, M.I.B.; methodology, M.I.B. and E.Y.; software, E.Y. and L.S.; validation, M.I.B.; formal analysis, M.I.B.; investigation, E.Y.; resources, M.I.B.; data curation, M.I.B.; writing—original draft preparation, M.I.B.; writing—review and editing, E.Y. and M.I.B.; supervision, L.S. and E.Y.; project administration, E.Y., L.S. and M.I.B. All authors have read and agreed to the published version of the manuscript.
Funding
This research received no external funding.
Institutional Review Board Statement
Not applicable.
Informed Consent Statement
Not applicable.
Data Availability Statement
Not applicable.
Conflicts of Interest
The authors declare no conflict of interest.
Appendix A
Table A1.
Experts’ Opinion in Terms of Simplicity of Items.
Table A1.
Experts’ Opinion in Terms of Simplicity of Items.
| Item Numbers | Expert 1 | Expert2 | Expert3 | Expert4 | Expert5 | Number of Agreement | I-CVI |
|---|---|---|---|---|---|---|---|
| 1 | 4 | 3 | 4 | 4 | 3 | 5 | 1 |
| 2 | 4 | 4 | 3 | 4 | 3 | 5 | 1 |
| 3 | 4 | 3 | 4 | 4 | 4 | 5 | 1 |
| 4 | 3 | 3 | 3 | 4 | 3 | 5 | 1 |
| 5 | 4 | 3 | 4 | 4 | 4 | 5 | 1 |
| 6 | 4 | 4 | 4 | 4 | 4 | 5 | 1 |
| 7 | 3 | 4 | 4 | 3 | 3 | 5 | 1 |
| 8 | 4 | 4 | 4 | 4 | 3 | 5 | 1 |
| 9 | 3 | 3 | 3 | 4 | 4 | 5 | 1 |
| 10 | 4 | 4 | 4 | 4 | 4 | 5 | 1 |
| 11 | 4 | 4 | 4 | 4 | 4 | 5 | 1 |
| 12 | 4 | 3 | 4 | 4 | 4 | 5 | 1 |
| 13 | 4 | 4 | 4 | 4 | 4 | 5 | 1 |
| 14 | 4 | 3 | 4 | 4 | 4 | 5 | 1 |
| 15 | 3 | 3 | 3 | 3 | 3 | 5 | 1 |
| 16 | 4 | 4 | 4 | 4 | 4 | 5 | 1 |
| 17 | 4 | 4 | 4 | 4 | 4 | 5 | 1 |
| 18 | 2 | 4 | 4 | 4 | 4 | 4 | 0.8 |
| 19 | 3 | 3 | 2 | 4 | 4 | 4 | 0.8 |
| 20 | 4 | 4 | 4 | 3 | 4 | 5 | 1 |
| 21 | 4 | 4 | 4 | 4 | 4 | 5 | 1 |
| 22 | 4 | 4 | 3 | 4 | 4 | 5 | 1 |
| 23 | 4 | 4 | 4 | 4 | 4 | 5 | 1 |
| 24 | 3 | 1 | 4 | 4 | 4 | 4 | 0.8 |
| 25 | 3 | 3 | 4 | 3 | 3 | 5 | 1 |
| 26 | 4 | 4 | 3 | 3 | 4 | 5 | 1 |
| 27 | 4 | 4 | 4 | 4 | 4 | 5 | 1 |
| 28 | 3 | 3 | 2 | 4 | 4 | 4 | 0.8 |
| 29 | 4 | 4 | 4 | 4 | 4 | 5 | 1 |
| 30 | 4 | 1 | 4 | 4 | 3 | 4 | 0.8 |
| 31 | 4 | 4 | 4 | 4 | 4 | 5 | 1 |
| 32 | 4 | 4 | 4 | 4 | 4 | 5 | 1 |
| 33 | 4 | 4 | 4 | 3 | 3 | 5 | 1 |
| 34 | 4 | 4 | 4 | 4 | 4 | 5 | 1 |
| 35 | 4 | 3 | 4 | 4 | 4 | 5 | 1 |
| 36 | 4 | 4 | 4 | 4 | 4 | 5 | 1 |
| 37 | 4 | 4 | 3 | 4 | 4 | 5 | 1 |
| 38 | 4 | 4 | 4 | 4 | 4 | 5 | 1 |
| 39 | 4 | 4 | 4 | 4 | 3 | 5 | 1 |
| 40 | 4 | 4 | 4 | 3 | 4 | 5 | 1 |
| 41 | 4 | 4 | 4 | 4 | 4 | 5 | 1 |
| 42 | 4 | 4 | 4 | 4 | 3 | 5 | 1 |
| 43 | 4 | 3 | 4 | 4 | 4 | 5 | 1 |
| 44 | 4 | 4 | 4 | 4 | 4 | 5 | 1 |
| 45 | 4 | 4 | 3 | 4 | 3 | 5 | 1 |
| 46 | 4 | 4 | 4 | 4 | 4 | 5 | 1 |
| 47 | 4 | 4 | 4 | 4 | 4 | 5 | 1 |
| 48 | 3 | 3 | 3 | 4 | 4 | 5 | 1 |
| 49 | 3 | 4 | 3 | 4 | 4 | 5 | 1 |
| 50 | 4 | 4 | 4 | 4 | 4 | 5 | 1 |
| 51 | 3 | 3 | 3 | 3 | 3 | 5 | 1 |
| 52 | 4 | 3 | 4 | 4 | 4 | 5 | 1 |
| S-CVI/Ave | 0.980769 | ||||||
| Total Agreement | 47 | ||||||
| S-CVI/UA | 0.9 |
Table A2.
Experts’ Opinion in Terms of Relevancy of Items.
Table A2.
Experts’ Opinion in Terms of Relevancy of Items.
| Item Numbers | Expert1 | Expert2 | Expert3 | Expert4 | Expert5 | Number of Agreement | I-CVI |
|---|---|---|---|---|---|---|---|
| 1 | 4 | 4 | 4 | 4 | 4 | 5 | 1 |
| 2 | 4 | 4 | 4 | 4 | 4 | 5 | 1 |
| 3 | 4 | 4 | 4 | 4 | 4 | 5 | 1 |
| 4 | 3 | 4 | 4 | 4 | 3 | 5 | 1 |
| 5 | 4 | 3 | 4 | 4 | 4 | 5 | 1 |
| 6 | 4 | 4 | 4 | 4 | 4 | 5 | 1 |
| 7 | 3 | 4 | 4 | 3 | 3 | 5 | 1 |
| 8 | 4 | 4 | 4 | 4 | 3 | 5 | 1 |
| 9 | 3 | 3 | 3 | 4 | 4 | 5 | 1 |
| 10 | 4 | 4 | 4 | 4 | 4 | 5 | 1 |
| 11 | 4 | 4 | 4 | 4 | 4 | 5 | 1 |
| 12 | 4 | 4 | 4 | 4 | 4 | 5 | 1 |
| 13 | 4 | 4 | 4 | 4 | 4 | 5 | 1 |
| 14 | 4 | 4 | 4 | 4 | 4 | 5 | 1 |
| 15 | 3 | 3 | 3 | 3 | 2 | 4 | 0.8 |
| 16 | 4 | 4 | 4 | 4 | 4 | 5 | 1 |
| 17 | 4 | 4 | 4 | 4 | 4 | 5 | 1 |
| 18 | 1 | 4 | 4 | 4 | 4 | 4 | 0.8 |
| 19 | 3 | 3 | 4 | 4 | 4 | 5 | 1 |
| 20 | 4 | 4 | 4 | 4 | 4 | 5 | 1 |
| 21 | 4 | 4 | 4 | 4 | 4 | 5 | 1 |
| 22 | 4 | 4 | 4 | 4 | 4 | 5 | 1 |
| 23 | 4 | 4 | 4 | 4 | 4 | 5 | 1 |
| 24 | 3 | 2 | 4 | 4 | 4 | 4 | 0.8 |
| 25 | 3 | 3 | 4 | 3 | 3 | 5 | 1 |
| 26 | 4 | 4 | 4 | 3 | 4 | 5 | 1 |
| 27 | 4 | 4 | 4 | 4 | 4 | 5 | 1 |
| 28 | 3 | 3 | 1 | 4 | 4 | 4 | 0.8 |
| 29 | 4 | 4 | 4 | 4 | 4 | 4 | 0.8 |
| 30 | 4 | 2 | 4 | 4 | 4 | 4 | 0.8 |
| 31 | 4 | 4 | 4 | 4 | 4 | 5 | 1 |
| 32 | 4 | 4 | 4 | 4 | 4 | 5 | 1 |
| 33 | 4 | 4 | 4 | 4 | 4 | 5 | 1 |
| 34 | 4 | 4 | 4 | 4 | 4 | 5 | 1 |
| 35 | 4 | 4 | 4 | 4 | 4 | 5 | 1 |
| 36 | 4 | 4 | 4 | 4 | 4 | 5 | 1 |
| 37 | 4 | 4 | 4 | 4 | 4 | 5 | 1 |
| 38 | 4 | 4 | 4 | 4 | 4 | 5 | 1 |
| 39 | 4 | 4 | 4 | 4 | 4 | 5 | 1 |
| 40 | 4 | 4 | 4 | 3 | 4 | 5 | 1 |
| 41 | 4 | 4 | 4 | 4 | 4 | 5 | 1 |
| 42 | 4 | 4 | 4 | 4 | 4 | 5 | 1 |
| 43 | 4 | 4 | 4 | 4 | 4 | 5 | 1 |
| 44 | 4 | 4 | 4 | 4 | 4 | 5 | 1 |
| 45 | 4 | 4 | 3 | 4 | 3 | 5 | 1 |
| 46 | 4 | 4 | 4 | 4 | 4 | 5 | 1 |
| 47 | 4 | 4 | 4 | 4 | 4 | 5 | 1 |
| 48 | 3 | 3 | 3 | 4 | 4 | 5 | 1 |
| 49 | 3 | 4 | 3 | 4 | 4 | 5 | 1 |
| 50 | 4 | 4 | 4 | 4 | 4 | 5 | 1 |
| 51 | 3 | 3 | 3 | 3 | 3 | 5 | 1 |
| 52 | 4 | 4 | 4 | 4 | 4 | 5 | 1 |
| S-CVI/Ave | 0.976923 | ||||||
| Total Agreement | 46 | ||||||
| S-CVI/UA | 0.88 |
Table A3.
Results of the Pilot Study (Factor Loading, Reliability, Convergent Validity).
Table A3.
Results of the Pilot Study (Factor Loading, Reliability, Convergent Validity).
| Constructs | Item | Factor Loading (>0.7) | Reliability | Convergent Validity AVE (>0.5) | |
|---|---|---|---|---|---|
| Cronbach’s Alpha (>0.7) | Composite Reliability (>0.7) | ||||
| Big data adoption (BDA) | BDA1 | 0.78 | 0.81 | 0.87 | 0.63 |
| BDA2 | 0.80 | ||||
| BDA3 | 0.79 | ||||
| BDA4 | 0.81 | ||||
| Relative Advantage (RA) | RA1 | 0.83 | 0.79 | 0.87 | 0.60 |
| RA2 | 0.81 | ||||
| RA3 | 0.83 | ||||
| RA4 | 0.71 | ||||
| Complexity (Complex) | Complex 2 | 0.80 | 0.74 | 0.85 | 0.66 |
| Complex 3 | 0.82 | ||||
| Complex 4 | 0.81 | ||||
| Compatibility (Compat) | Compat1 | 0.87 | 0.85 | 0.90 | 0.70 |
| Compat2 | 0.85 | ||||
| Compat3 | 0.80 | ||||
| Compat4 | 0.81 | ||||
| IT infrastructure (ITinf) | ITinf1 | 0.71 | 0.75 | 0.84 | 0.57 |
| ITinf2 | 0.78 | ||||
| ITinf3 | 0.71 | ||||
| ITinf4 | 0.83 | ||||
| Top Management Support (TMS) | TMS1 | 0.86 | 0.87 | 0.91 | 0.73 |
| TMS2 | 0.88 | ||||
| TMS3 | 0.80 | ||||
| TMS4 | 0.87 | ||||
| Financial Resource (FR) | FR1 | 0.85 | 0.84 | 0.90 | 0.72 |
| FR2 | 0.83 | ||||
| FR3 | 0.81 | ||||
| FR4 | 0.89 | ||||
| Competitive Pressure (CP) | CP1 | 0.86 | 0.86 | 0.91 | 0.71 |
| CP2 | 0.87 | ||||
| CP3 | 0.76 | ||||
| CP4 | 0.87 | ||||
| Human expertise and skills (HE) | HE1 | 0.86 | 0.85 | 0.91 | 0.69 |
| HE2 | 0.87 | ||||
| HE3 | 0.77 | ||||
| HE4 | 0.81 | ||||
| Security & Privacy (SP) | SP1 | 0.78 | 0.83 | 0.89 | 0.66 |
| SP2 | 0.89 | ||||
| SP3 | 0.73 | ||||
| SP4 | 0.84 | ||||
| Government policies (GP) | GP1 | 0.73 | 0.76 | 0.85 | 0.58 |
| GP2 | 0.82 | ||||
| GP3 | 0.76 | ||||
| GP4 | 0.74 | ||||
| University Age (UA) | UA1 | 0.90 | 0.89 | 0.93 | 0.76 |
| UA2 | 0.87 | ||||
| UA3 | 0.85 | ||||
| UA4 | 0.87 | ||||
| University Size (US) | US1 | 0.84 | 0.81 | 0.88 | 0.64 |
| US2 | 0.77 | ||||
| US3 | 0.76 | ||||
| US4 | 0.82 | ||||
Table A4.
Pilot Study Results of Cross-Loading.
Table A4.
Pilot Study Results of Cross-Loading.
| BDA | CP | Compat | Complex | FR | GP | HR | IT inf | RA | SP | TMS | UA | US | |
|---|---|---|---|---|---|---|---|---|---|---|---|---|---|
| BDA1 | 0.78 | 0.75 | 0.57 | 0.48 | 0.69 | 0.61 | 0.77 | 0.63 | 0.69 | 0.67 | 0.64 | 0.62 | 0.71 |
| BDA2 | 0.80 | 0.62 | 0.61 | 0.50 | 0.58 | 0.64 | 0.60 | 0.65 | 0.58 | 0.65 | 0.70 | 0.55 | 0.59 |
| BDA3 | 0.79 | 0.47 | 0.69 | 0.56 | 0.47 | 0.63 | 0.48 | 0.61 | 0.60 | 0.51 | 0.50 | 0.40 | 0.60 |
| BDA4 | 0.81 | 0.57 | 0.68 | 0.57 | 0.53 | 0.62 | 0.46 | 0.64 | 0.64 | 0.56 | 0.56 | 0.51 | 0.58 |
| CP1 | 0.65 | 0.86 | 0.51 | 0.47 | 0.70 | 0.62 | 0.78 | 0.67 | 0.66 | 0.65 | 0.66 | 0.60 | 0.76 |
| CP2 | 0.61 | 0.87 | 0.57 | 0.52 | 0.71 | 0.61 | 0.77 | 0.56 | 0.67 | 0.62 | 0.58 | 0.65 | 0.73 |
| CP3 | 0.62 | 0.76 | 0.67 | 0.71 | 0.62 | 0.68 | 0.57 | 0.63 | 0.64 | 0.59 | 0.62 | 0.56 | 0.65 |
| CP4 | 0.70 | 0.87 | 0.56 | 0.50 | 0.68 | 0.59 | 0.78 | 0.59 | 0.76 | 0.69 | 0.68 | 0.68 | 0.76 |
| Compat1 | 0.75 | 0.59 | 0.87 | 0.62 | 0.60 | 0.60 | 0.52 | 0.67 | 0.68 | 0.60 | 0.57 | 0.53 | 0.64 |
| Compat2 | 0.66 | 0.57 | 0.85 | 0.74 | 0.54 | 0.65 | 0.51 | 0.64 | 0.65 | 0.51 | 0.54 | 0.50 | 0.65 |
| Compat3 | 0.62 | 0.63 | 0.80 | 0.70 | 0.63 | 0.61 | 0.64 | 0.62 | 0.65 | 0.62 | 0.61 | 0.55 | 0.67 |
| Compat4 | 0.62 | 0.50 | 0.81 | 0.58 | 0.52 | 0.67 | 0.51 | 0.59 | 0.60 | 0.51 | 0.56 | 0.46 | 0.50 |
| Complex2 | 0.56 | 0.63 | 0.59 | 0.80 | 0.65 | 0.64 | 0.55 | 0.56 | 0.68 | 0.61 | 0.59 | 0.55 | 0.63 |
| Complex3 | 0.51 | 0.44 | 0.67 | 0.82 | 0.46 | 0.65 | 0.38 | 0.48 | 0.47 | 0.41 | 0.40 | 0.32 | 0.47 |
| Complex4 | 0.54 | 0.51 | 0.66 | 0.81 | 0.46 | 0.70 | 0.49 | 0.58 | 0.60 | 0.48 | 0.53 | 0.43 | 0.55 |
| FR1 | 0.65 | 0.54 | 0.55 | 0.59 | 0.85 | 0.62 | 0.72 | 0.61 | 0.65 | 0.56 | 0.64 | 0.64 | 0.75 |
| FR2 | 0.57 | 0.58 | 0.59 | 0.53 | 0.83 | 0.61 | 0.75 | 0.58 | 0.62 | 0.50 | 0.62 | 0.65 | 0.63 |
| FR3 | 0.70 | 0.69 | 0.62 | 0.50 | 0.81 | 0.60 | 0.70 | 0.66 | 0.63 | 0.57 | 0.64 | 0.62 | 0.66 |
| FR4 | 0.61 | 0.64 | 0.57 | 0.58 | 0.89 | 0.63 | 0.75 | 0.60 | 0.69 | 0.54 | 0.66 | 0.69 | 0.68 |
| GP1 | 0.65 | 0.70 | 0.57 | 0.55 | 0.73 | 0.73 | 0.82 | 0.65 | 0.62 | 0.53 | 0.67 | 0.63 | 0.75 |
| GP2 | 0.68 | 0.58 | 0.68 | 0.62 | 0.61 | 0.82 | 0.55 | 0.67 | 0.60 | 0.65 | 0.62 | 0.53 | 0.67 |
| GP3 | 0.52 | 0.44 | 0.67 | 0.68 | 0.40 | 0.76 | 0.35 | 0.58 | 0.48 | 0.41 | 0.38 | 0.33 | 0.50 |
| GP4 | 0.51 | 0.42 | 0.72 | 0.67 | 0.42 | 0.74 | 0.43 | 0.54 | 0.53 | 0.38 | 0.38 | 0.36 | 0.43 |
| HR1 | 0.59 | 0.73 | 0.57 | 0.53 | 0.68 | 0.61 | 0.86 | 0.58 | 0.60 | 0.61 | 0.65 | 0.65 | 0.73 |
| HR2 | 0.72 | 0.62 | 0.57 | 0.51 | 0.72 | 0.67 | 0.87 | 0.61 | 0.63 | 0.63 | 0.63 | 0.67 | 0.73 |
| HR3 | 0.51 | 0.70 | 0.52 | 0.49 | 0.70 | 0.58 | 0.77 | 0.47 | 0.66 | 0.60 | 0.65 | 0.69 | 0.66 |
| HR4 | 0.61 | 0.65 | 0.50 | 0.43 | 0.76 | 0.55 | 0.81 | 0.58 | 0.66 | 0.62 | 0.66 | 0.64 | 0.63 |
| ITinf1 | 0.53 | 0.39 | 0.47 | 0.29 | 0.42 | 0.44 | 0.38 | 0.71 | 0.45 | 0.47 | 0.42 | 0.45 | 0.46 |
| ITinf2 | 0.64 | 0.55 | 0.70 | 0.67 | 0.61 | 0.72 | 0.53 | 0.78 | 0.59 | 0.58 | 0.58 | 0.52 | 0.57 |
| IT inf3 | 0.47 | 0.46 | 0.42 | 0.40 | 0.46 | 0.48 | 0.37 | 0.71 | 0.42 | 0.49 | 0.42 | 0.39 | 0.46 |
| ITinf4 | 0.76 | 0.61 | 0.65 | 0.60 | 0.66 | 0.73 | 0.69 | 0.83 | 0.69 | 0.68 | 0.64 | 0.62 | 0.71 |
| RA1 | 0.67 | 0.69 | 0.59 | 0.58 | 0.76 | 0.64 | 0.82 | 0.65 | 0.83 | 0.60 | 0.60 | 0.69 | 0.72 |
| RA2 | 0.66 | 0.63 | 0.54 | 0.53 | 0.69 | 0.57 | 0.70 | 0.51 | 0.81 | 0.72 | 0.69 | 0.74 | 0.70 |
| RA3 | 0.67 | 0.68 | 0.67 | 0.60 | 0.73 | 0.64 | 0.70 | 0.62 | 0.83 | 0.61 | 0.72 | 0.68 | 0.70 |
| RA4 | 0.53 | 0.41 | 0.69 | 0.67 | 0.39 | 0.62 | 0.35 | 0.55 | 0.71 | 0.39 | 0.35 | 0.30 | 0.43 |
| SP1 | 0.58 | 0.57 | 0.55 | 0.47 | 0.71 | 0.58 | 0.72 | 0.54 | 0.69 | 0.78 | 0.72 | 0.70 | 0.69 |
| SP2 | 0.68 | 0.65 | 0.56 | 0.47 | 0.72 | 0.61 | 0.77 | 0.63 | 0.74 | 0.89 | 0.81 | 0.71 | 0.75 |
| SP3 | 0.69 | 0.56 | 0.58 | 0.51 | 0.59 | 0.59 | 0.52 | 0.69 | 0.61 | 0.73 | 0.59 | 0.51 | 0.58 |
| SP4 | 0.61 | 0.70 | 0.49 | 0.56 | 0.75 | 0.59 | 0.74 | 0.56 | 0.68 | 0.84 | 0.75 | 0.70 | 0.70 |
| TMS1 | 0.62 | 0.66 | 0.51 | 0.46 | 0.76 | 0.53 | 0.74 | 0.57 | 0.64 | 0.53 | 0.86 | 0.76 | 0.68 |
| TMS2 | 0.74 | 0.68 | 0.61 | 0.52 | 0.63 | 0.67 | 0.65 | 0.61 | 0.60 | 0.50 | 0.88 | 0.61 | 0.64 |
| TMS3 | 0.62 | 0.52 | 0.57 | 0.49 | 0.74 | 0.58 | 0.80 | 0.62 | 0.61 | 0.61 | 0.80 | 0.69 | 0.71 |
| TMS4 | 0.70 | 0.75 | 0.62 | 0.65 | 0.74 | 0.68 | 0.78 | 0.60 | 0.74 | 0.68 | 0.87 | 0.69 | 0.65 |
| UA1 | 0.63 | 0.72 | 0.52 | 0.45 | 0.76 | 0.58 | 0.79 | 0.60 | 0.68 | 0.64 | 0.78 | 0.90 | 0.66 |
| UA2 | 0.65 | 0.74 | 0.55 | 0.44 | 0.74 | 0.55 | 0.78 | 0.58 | 0.72 | 0.63 | 0.74 | 0.87 | 0.60 |
| UA3 | 0.63 | 0.74 | 0.54 | 0.47 | 0.78 | 0.57 | 0.74 | 0.55 | 0.68 | 0.62 | 0.69 | 0.85 | 0.63 |
| UA4 | 0.64 | 0.81 | 0.53 | 0.51 | 0.80 | 0.61 | 0.79 | 0.60 | 0.75 | 0.57 | 0.78 | 0.87 | 0.72 |
| US1 | 0.70 | 0.68 | 0.55 | 0.48 | 0.68 | 0.63 | 0.75 | 0.63 | 0.67 | 0.65 | 0.76 | 0.68 | 0.84 |
| US2 | 0.65 | 0.70 | 0.67 | 0.59 | 0.59 | 0.68 | 0.59 | 0.68 | 0.66 | 0.64 | 0.60 | 0.53 | 0.77 |
| US3 | 0.58 | 0.70 | 0.60 | 0.57 | 0.64 | 0.58 | 0.62 | 0.52 | 0.60 | 0.62 | 0.59 | 0.61 | 0.76 |
| US4 | 0.58 | 0.69 | 0.56 | 0.54 | 0.67 | 0.63 | 0.69 | 0.56 | 0.68 | 0.67 | 0.67 | 0.68 | 0.82 |
RA = relative advantage, BDA = big data adoption, Complex = complexity, Compat = compatibility, IT inf = IT Infrastructure, TMS = top management support, FR = financial resources, HE = human expertise, CP = competitive advantage, SP = security and privacy concerns, GP = government pressure, US = university size, UA = university age.
Table A5.
Pilot Study Results of Fornell–Larcker Criterion.
Table A5.
Pilot Study Results of Fornell–Larcker Criterion.
| BDA | GP | Complex | Compat | ITinf | TMS | FR | HE | CP | SP | RA | US | UA | |
|---|---|---|---|---|---|---|---|---|---|---|---|---|---|
| BDA | 0.90 | ||||||||||||
| GP | 0.61 | 0.92 | |||||||||||
| Complex | 0.72 | 0.61 | 0.91 | ||||||||||
| Compat | 0.71 | 0.58 | 0.73 | 0.96 | |||||||||
| ITinf | 0.67 | 0.53 | 0.71 | 0.68 | 0.92 | ||||||||
| TMS | 0.68 | 0.57 | 0.68 | 0.58 | 0.68 | 0.94 | |||||||
| FR | 0.73 | 0.66 | 0.78 | 0.70 | 0.78 | 0.76 | 0.93 | ||||||
| HE | 0.57 | 0.68 | 0.78 | 0.68 | 0.75 | 0.74 | 0.85 | 0.89 | |||||
| CP | 0.52 | 0.53 | 0.61 | 0.59 | 0.58 | 0.66 | 0.72 | 0.78 | 0.93 | ||||
| SP | 0.87 | 0.46 | 0.81 | 0.55 | 0.68 | 0.68 | 0.73 | 0.67 | 0.62 | 0.91 | |||
| RA | 0.47 | 0.62 | 0.47 | 0.71 | 0.76 | 0.79 | 0.87 | 0.75 | 0.70 | 0.52 | 0.95 | ||
| US | 0.54 | 0.38 | 0.58 | 0.43 | 0.52 | 0.69 | 0.61 | 0.66 | 0.72 | 0.61 | 0.62 | 0.89 | |
| UA | 0.58 | 0.49 | 0.63 | 0.62 | 0.63 | 0.70 | 0.75 | 0.84 | 0.86 | 0.70 | 0.70 | 0.71 | 0.93 |
Note: Bold diagonal elements represent the Average Variance Extracted (AVEs) for the relevant construct. (RA = relative advantage, BDA = big data adoption, Complex = complexity, Compat = compatibility, IT inf = IT Infrastructure, TMS = top management support, FR = financial resources, HE = human expertise, CP = competitive advantage, SP = security and privacy concerns, GP = government pressure, US = university size, UA= university age).
Table A6.
Questionnaire items and their references.
Table A6.
Questionnaire items and their references.
| Constructs | Items | References |
|---|---|---|
| Relative Advantage (RA) | BDA enables to accomplish tasks more quickly BDA gives greater control over work BDA would enhance the data storage BDA would be advantageous for the overall organization | [51] |
| Complexity (Complex) | Big data technology is difficult to understand and interact with Big data technology takes too long to understand Big data technology is not easy to implement | [52] |
| Compatibility (Compat) | Big data technology can be easily integrated into the existing IT infrastructure Big data technology fits well with university’s working style Big data technology is well-matched with university’s norms and tradition Big data technology is well-suited with university’s present data | [52] |
| IT infrastructure (ITinf) | IT systems are capable of BDA Present networks are robust for BDA Available IT systems are capable to incorporate new changes for BDA Overall, IT infrastructure is fit for BDA | [52] |
| Top Management Support (TMS) | Top management believes that investment in BDA will worthwhile Top management believes that BDA has the potential to enhance academic quality Top management support is essential to provide the resources for BDA Top management positively supports in overall BDA decision | [53] |
| Financial Resource (FR) | University have financial resources for BDA University has no troubles in finding all the needed resources for BDA University has financial resources to enhance the infrastructure for BDA University have financial resources to hire experts for BDA | [52,54] |
| Human expertise and skills (HE) | IT employees have sufficient technical knowledge to implement big data technology IT employees have the ability to rapidly learn and adopt innovation Employees have the proficiency and information to maintain big data technologies University has strong programmers and database managers for BDA | [52] |
| Competitive Pressure (CP) | Institute would lose reputation if it did not adopt big data BDA is a necessity to compete with the other universities Other universities get advantages through BDA Other universities are going to adopt big data in the near future | [54] |
| Security & Privacy (SP) | BDA is not secure enough to store academic data Taking a risk to adopt big data is disadvantageous than the benefits Security and privacy concerns affect BDA decision Personal information may be exposed to other parties after BDA | [52] |
| Government policies (GP) | Government policies give confidence and relaxation in Government policies encourage the provision of access to the internet on all campuses Government policies encourage digitization of services that enable the environment for BDA University follows government policies to implement new technology | [27] |
| University Age (UA) | Older institutes have more experience to handle BDA Older institutions easily accept technical transformation for BDA Older institutions have more IT resources for BDA Older institutions lack the willingness to adopt big data | [27] |
| University Size (US) | Number of employees enhance institutional capability for BDA Number of employees affect on skills and expertise to adopt big data Number of employees enhance overall efficiency to adopt big data Number of the employee is a significant indicator for BDA decision | [27] |
| Big data adoption in VU (BDA) | University intent to adopt big data technology University will adopt big data technologies within 5 years I confidently recommend big data technology to university I would use big data technologies confidently in university | [35] |
References
- Rani, B.; Kant, S. An approach toward integration of big data into decision making process. In New Paradigm in Decision Science and Management; Springer: Singapore, 2020; pp. 207–215. [Google Scholar]
- Olson, D.L.; Lauhoff, G. Descriptive data mining. In Descriptive Data Mining; Springer: Singapore, 2019; pp. 129–130. [Google Scholar]
- Saggi, M.K.; Jain, S. A survey towards an integration of big data analytics to big insights for value-creation. Inf. Process. Manag. 2018, 54, 758–790. [Google Scholar] [CrossRef]
- Al-Rahmi, W.M.; Yahaya, N.; Aldraiweesh, A.A.; Alturki, U.; Alamri, M.; Bin Saud, M.S.; Kamin, Y.; Aljeraiwi, A.A.; Alhamed, O.A. Big Data Adoption and Knowledge Management Sharing: An Empirical Investigation on Their Adoption and Sustainability as a Purpose of Education. IEEE Access 2019, 7, 47245–47258. [Google Scholar]
- Arfat, Y.; Usman, S.; Mehmood, R.; Katib, I. Big data for smart infrastructure design: Opportunities and challenges. In Smart Infrastructure and Applications; Springer: Berlin/Heidelberg, Germany, 2020; pp. 491–518. [Google Scholar]
- Yusof, M.M.; Aziz, K.A. Evaluation of organizational readiness in information systems adoption: A case study. Asia-Pac. J. Inf. Technol. Multimed. APIJTM 2015, 4, 69–86. [Google Scholar]
- Maniam, J.; Singh, D. Towards data privacy and security framework in big data governance. Int. J. Softw. Eng. Comput. Syst. 2020, 6, 41–51. [Google Scholar] [CrossRef]
- Bai, X.; Zhang, F.; Li, J.; Guo, T.; Aziz, A.; Jin, A.; Xia, F. Educational big data: Predictions, applications and challenges. Big Data Res. 2021, 26, 100270. [Google Scholar] [CrossRef]
- Al-Masri, A.; Curran, K. Smart Technologies and Innovation for a Sustainable Future. In Proceedings of the 1st American University in the Emirates International Research Conference, Dubai, United Arab Emirates, 15–16 November 2017; Springer: Berlin/Heidelberg, Germany, 2019. [Google Scholar]
- Khurshid, M.M.; Zakaria, N.H.; Rashid, A.; Kazmi, R.; Shafique, M.N.; Ahmad, M.N. Analyzing diffusion patterns of big open data as policy innovation in public sector. Comput. Electr. Eng. 2019, 78, 148–161. [Google Scholar] [CrossRef]
- Nisar, Q.A.; Nasir, N.; Jamshed, S.; Naz, S.; Ali, M.; Ali, S. Big data management and environmental performance: Role of big data decision-making capabilities and decision-making quality. J. Enterp. Inf. Manag. 2020, 34, 1061–1096. [Google Scholar] [CrossRef]
- Thirathon, U.; Wieder, B.; Matolcsy, Z.; Ossimitz, M.-L. Big data, analytic culture and analytic-based decision making evidence from Australia. Procedia Comput. Sci. 2017, 121, 775–783. [Google Scholar] [CrossRef]
- Park, J.-H.; Kim, Y.B. Factors activating big data adoption by Korean firms. J. Comput. Inf. Syst. 2019, 61, 285–293. [Google Scholar] [CrossRef]
- Feng, S.; Wong, Y.K.; Wong, L.Y.; Hossain, L. The internet and facebook usage on academic distraction of college students. Comput. Educ. 2019, 134, 41–49. [Google Scholar] [CrossRef]
- Nazarenko, M.A.; Khronusova, T.V. Big data in modern higher education. Benefits and criticism. In Proceedings of the 2017 International Conference Quality Management, Transport and Information Security, Information Technologies (IT&QM&IS), St. Petersburg, Russia, 24–30 September 2017; pp. 676–679. [Google Scholar]
- Jiang, Z. The application of big data analysis in college computer education. In Data Processing Techniques and Applications for Cyber-Physical Systems (DPTA 2019); Springer: Singapore, 2020; pp. 1599–1605. [Google Scholar]
- Yadegaridehkordi, E.; Nilashi, M.; Shuib, L.; Nasir, M.H.N.B.M.; Asadi, S.; Samad, S.; Awang, N.F. The impact of big data on firm performance in hotel industry. Electron. Commer. Res. Appl. 2020, 40, 100921. [Google Scholar] [CrossRef]
- Surbakti, F.P.S.; Wang, W.; Indulska, M.; Sadiq, S. Factors influencing effective use of big data: A research framework. Inf. Manag. 2019, 57, 103146. [Google Scholar] [CrossRef]
- Mukred, M.; Yusof, Z.M.; Mokhtar, U.A.; Sadiq, A.S.; Hawash, B.; Ahmed, W.A. Improving the decision-making process in the higher learning institutions via electronic records management system adoption. KSII Trans. Internet Inf. Syst. 2021, 15, 90–113. [Google Scholar]
- McLeod, A.J.; Bliemel, M.; Jones, N. Examining the adoption of big data and analytics curriculum. Bus. Process. Manag. J. 2017, 23, 506–517. [Google Scholar] [CrossRef]
- Baig, M.I.; Shuib, L.; Yadegaridehkordi, E. Big data in education: A state of the art, limitations, and future research directions. Int. J. Educ. Technol. High. Educ. 2020, 17, 44. [Google Scholar] [CrossRef]
- Asheghi-Oskooeea, H.; Mazloomi, N. A strategic entrepreneurship model based on corporate governance in the iranian manufacturing enterprises. Int. J. Econ. Manag. Account. 2018, 26, 25–56. [Google Scholar]
- Nam, D.W.; Kang, D.W.; Kim, S. Process of big data analysis adoption: Defining big data as a new IS innovation and examining factors affecting the process. In Proceedings of the 2015 48th Hawaii International Conference on System Sciences, Kauai, HI, USA, 5–8 January 2015; pp. 4792–4801. [Google Scholar]
- Park, J.H.; Kim, M.K.; Paik, J.H. The factors of technology, organization and environment influencing the adoption and usage of big data in Korean firms. Econstor 2015, 3, 121–129. [Google Scholar]
- Salleh, K.A.; Janczewski, L. Adoption of big data solutions: A study on its security determinants using Sec-TOE Framework. In Proceedings of the International Conference on Information Resources Management (CONF-IRM), Cape Town, South Africa, 18–20 May 2016. [Google Scholar]
- Yadegaridehkordi, E.; Hourmand, M.; Nilashi, M.; Shuib, L.; Ahani, A.; Ibrahim, O. Influence of big data adoption on manufacturing companies’ performance: An integrated DEMATEL-ANFIS approach. Technol. Forecast. Soc. Chang. 2018, 137, 199–210. [Google Scholar] [CrossRef]
- Ochieng, G.F. The Adoption of Big Data Analytics by Supermarkets in Kisumu County. Master’s Thesis, University of Nairobi, Nairobi, Kenya, 2015. [Google Scholar]
- Almoqren, N.; Altayar, M. The motivations for big data mining technologies adoption in Saudi banks. In Proceedings of the 2016 4th Saudi International Conference on Information Technology (Big Data Analysis) (KACSTIT), Riyadh, Saudi Arabia, 6–9 November 2016; pp. 1–8. [Google Scholar]
- Salleh, K.A.; Janczewski, L.; Beltran, F. SEC-TOE framework: Exploring security determinants in big data solutions adoption. In Proceedings of the Pacific Asia Conference on Information Systems PACIS 2015, Singapore, 5–9 July 2015; pp. 190–203. [Google Scholar]
- Nguyen, T.; Petersen, T.E. Technology Adoption in Norway: Organizational Assimilation of Big Data. Master’s Thesis, Norwegian School of Economics, Bergen, Norway, 2017. [Google Scholar]
- Verma, S.; Bhattacharyya, S.S. Perceived strategic value-based adoption of big data analytics in emerging economy. J. Enterp. Inf. Manag. 2017, 30, 354–382. [Google Scholar] [CrossRef]
- Sun, S.; Cegielski, C.G.; Jia, L.; Hall, D.J. Understanding the factors affecting the organizational adoption of big data. J. Comput. Inf. Syst. 2016, 58, 193–203. [Google Scholar] [CrossRef]
- Lai, Y.; Sun, H.; Ren, J. Understanding the determinants of big data analytics (BDA) adoption in logistics and supply chain management: An empirical investigation. Int. J. Logist. Manag. 2018, 29, 676–703. [Google Scholar] [CrossRef]
- Tornatzky, L.G.; Fleischer, M.; Chakrabarti, A.K. Processes of Technological Innovation; Lexington Books: Lanham, MD USA, 1990. [Google Scholar]
- Nugroho, H.E.R.U. IT Adoption model for higher education. J. Theor. Appl. Inf. Technol. 2017, 95, 2619–2625. [Google Scholar]
- Ijab, M.T.; Wahab, S.M.A.; Salleh, M.A.M.; Bakar, A.A. Investigating big data analytics readiness in higher education using the technology-organisation-environment (TOE) framework. In Proceedings of the 2019 6th International Conference on Research and Innovation in Information Systems (ICRIIS), Johor Bahru, Malaysia, 2–9 December 2019; pp. 1–7. [Google Scholar]
- Rogers, E.M. Lessons for guidelines from the diffusion of innovations. Jt. Comm. J. Qual. Improv. 1995, 21, 324–328. [Google Scholar] [CrossRef]
- Tarhini, A.; Al-Gharbi, K.; Al-Badi, A.; Alhinai, Y.S. An analysis of the factors affecting the adoption of cloud computing in higher educational institutions. Int. J. Cloud Appl. Comput. 2018, 8, 49–71. [Google Scholar] [CrossRef]
- Singh, J.; Mansotra, V. Factors affecting cloud computing adoption in the Indian school education system. Educ. Inf. Technol. 2019, 24, 2453–2475. [Google Scholar] [CrossRef]
- Baig, M.I.; Shuib, L.; Yadegaridehkordi, E. Big data adoption: State of the art and research challenges. Inf. Process. Manag. 2019, 56, 102095. [Google Scholar] [CrossRef]
- Alshirah, M.; Lutfi, A.; Saad, M.; Ibrahim, N.; Mohammed, F. Influencesof the environmental factors on the intention to adopt cloud based accounting information system among SMEs in Jordan. Accounting 2021, 7, 645–654. [Google Scholar] [CrossRef]
- Nyeko, S.; Moya, M. Determinants of eLearning adoption among instructors in Ugandan public universities. In Proceedings of the 2017 IST-Africa Week Conference (IST-Africa), Windhoek, Namibia, 30 May–2 June 2017; pp. 1–10. [Google Scholar]
- Aljowaidi, M.A. A Study of e-Commerce Adoption Using TOE Framework in Saudi Retailers: Firm Motivations, Implementation and Benefits. Ph.D. Thesis, RMIT University, Melbourne, VIC, Australia, September 2015. [Google Scholar]
- Lynn, M.R. Determination and quantification of content validity. Nurs. Res. 1996, 35, 382–385. [Google Scholar] [CrossRef]
- Yaghmaei, F. Content validity and its estimation. J. Med. Educ. Appl. 2003, 3, 24–41. [Google Scholar]
- Polit, D.F.; Beck, C.T. The content validity index: Are you sure you know what’s being reported? Critique and recommendations. Res. Nurs. Health 2006, 29, 489–497. [Google Scholar] [CrossRef] [Green Version]
- Rodrigues, I.B.; Adachi, J.D.; Beattie, K.A.; MacDermid, J.C. Development and validation of a new tool to measure the facilitators, barriers and preferences to exercise in people with osteoporosis. BMC Musculoskelet. Disord. 2017, 18, 540. [Google Scholar] [CrossRef] [Green Version]
- Hair, J.F.; Hult, G.T.M.; Ringle, C.M.; Sarstedt, M. A Primer on Partial Least Squares Structural Equation Modeling (PLS-SEM), 3rd ed.; Sage: Thousand Oaks, CA, USA, 2021. [Google Scholar]
- Arain, M.; Campbell, M.J.; Cooper, C.L.; Lancaster, G.A. What is a pilot or feasibility study? A review of current practice and editorial policy. BMC Med. Res. Methodol. 2010, 10, 67. [Google Scholar] [CrossRef] [Green Version]
- Hertzog, M.A. Considerations in determining sample size for pilot studies. Res. Nurs. Heal. 2008, 31, 180–191. [Google Scholar] [CrossRef]
- Alshamaileh, Y.Y. An Empirical Investigation of Factors Affecting Cloud Computing Adoption among SMEs in the North East of England. Ph.D. Thesis, Newcastle University, Newcastle, UK, 2013. [Google Scholar]
- Tehrani, S.R.; Shirazi, F. Factors influencing the adoption of cloud computing by small and medium size enterprises (SMEs). In Proceedings of the International Conference on Human Interface and the Management of Information, Heraklion, Crete, Greece, 22–27 June 2014; Springer: Cham, Switzerland, 2014; pp. 631–642. [Google Scholar]
- Premkumar, G.; Roberts, M. Adoption of new information technologies in rural small businesses. Omega 1999, 27, 467–484. [Google Scholar] [CrossRef]
- Boonsiritomachai, W.; McGrath, M.; Burgess, S. A research framework for the adoption of business intelligence by small and medium-sized enterprises. In Proceedings of the 27th Annual Conference on Small Enterprise Association of Australia & New Zealand, Sydney, Australia, 16–18 July 2014; pp. 1–22. [Google Scholar]
- Hair, J.F., Jr.; Matthews, L.M.; Matthews, R.L.; Sarstedt, M. PLS-SEM or CB-SEM: Updated guidelines on which method to use. Int. J. Multivar. Data Anal. 2017, 1, 107–123. [Google Scholar] [CrossRef]
- Saldivar, M.G. A Primer on Survey Response Rate. Learning Systems Institute; Florida State University: Tallahassee, FL, USA, 2012. [Google Scholar]
- Yang, Z.; Wang, X.; Su, C. A review of research methodologies in international business. Int. Bus. Rev. 2006, 15, 601–617. [Google Scholar] [CrossRef]
- Henseler, J.; Ringle, C.M.; Sarstedt, M. Testing measurement invariance of composites using partial least squares. Int. Mark. Rev. 2016, 33, 405–431. [Google Scholar] [CrossRef]
- Ab Hamid, M.R.; Sami, W.; Sidek, M.H.M. Discriminant validity assessment: Use of Fornell & Larcker criterion versus HTMT criterion. J. Phys. 2017, 890, 120–163. [Google Scholar]
- Chin, W.W. Commentary: Issues and opinion on structural equation modeling. MIS Q. 1998, 22, 7–16. [Google Scholar] [CrossRef]
Publisher’s Note: MDPI stays neutral with regard to jurisdictional claims in published maps and institutional affiliations. |
© 2021 by the authors. Licensee MDPI, Basel, Switzerland. This article is an open access article distributed under the terms and conditions of the Creative Commons Attribution (CC BY) license (https://creativecommons.org/licenses/by/4.0/).