1. Introduction
Increasing GHG emissions is one of the primary causes of climate change. Globally, GHGs have increased drastically since the industrial revolution and are expected to continue rising [
1]. Considerable evidence shows that the highest portion of climate change is mainly caused by the emission of GHGs due to anthropogenic activities, particularly carbon dioxide (CO
2) from fossil fuel combustion, and could accelerate the temperature increase in the future [
1,
2,
3]. South Africa was shown to be one of the world’s largest per capita GHG emitters, due to its energy-intensive industries and the high share of coal use [
4]. This is mainly due to high dependence on coal, which accounted for 91% of its electricity generation in 2016 [
5]. A fossil fuels-intensive energy, transport, and economy have shown to be the biggest culprits in South Africa. However, in recent years, South Africa has taken steps towards clean energy generation. The African Development Bank estimates that renewable energy generation (mainly through wind and solar) will continue to grow in the future [
4]. In order to transform to low-carbon energy and economy, under the Copenhagen Accord, South Africa committed to cut emissions by 34% from business as usual (BAU) by 2020, and by 42% by 2025. South Africa released the “Intended Nationally Determined Contribution” (INDC) that builds on mitigation targets by moving from a relative deviation from BAU to an absolute PPD (“peak, plateau, decline”) trajectory, where GHG emissions should peak by 2020, plateau until 2030, and begin to decline after 2030. The INDC has been updated and the expectation is that emissions should plateau from now until 2030. The National Climate Change Response White Paper (NCCRWP) of 2011 presents the country’s vision for an effective climate change response and the long-term transition to a climate-resilient low-carbon economy and society [
6]. South Africa identifies several policy mechanisms to achieve reductions including sectoral emission reduction targets and company-level carbon budgets. Therefore, steps should be taken to reduce these GHG emissions and help the country to achieve its international commitments but more so to achieve clean air human rights in the country. The Carbon Tax Act [
7] was signed into law to enforce policy measures that will support international commitments such as the 2015 Paris Agreement and ensure a cost-effective transition to a low-carbon economy in all the sectors in the country. South Africa has recently developed a Low Emission Development Strategy (LEDS) which it plans to submit as a commitment towards achieving its Paris commitments and goals [
8]. The Carbon Tax Act together with the Greenhouse Gas Emissions reporting, Climate Change Bill, and Pollution Prevention Plan regulations are seen as substantial policy steps undertaken by the country to curb GHG emissions [
9]. According to South Africa’s Low Emission Development Strategy 2050, the energy sector contributed 79.5% of the total gross emissions for South Africa in 2015 and grew by 25% between 2000 and 2015. South Africa, in partnership with its climate change stakeholders and role players (including NBCMs), continues to strengthen their efforts of achieving and stabilizing GHG concentrations in the atmosphere, hence reducing their carbon footprints. The valuable first step towards emission reduction by stakeholders is quantifying the GHG emissions due to various human and organizational activities [
10].
The NBCM is important nationally and globally for tourism and more importantly Agriculture, Forestry, and Other Land Use (AFOLU) sustainability. The different activities under tourism management (energy use at accommodations and transport in resident versus destination country) have also been shown to contribute 8% to global GHG emissions [
11]. Although South Africa’s commitment is considered inadequate according to the Carbon Brief, unlike in other countries wherein the belief systems of leaders have been shown to be important barriers to progress on the decarbonization of tourism [
12], SANParks leadership supports the global low-carbon transition. The AFOLU sector contributes to 20–24% of global emissions although most of it is from crop and livestock agriculture [
13]. The total net emissions for South Africa between 2000 and 2015 increased by 20.2% when including AFOLU but it increased to 23.1% when excluded [
8,
9]. Under AFOLU, conservation management contributes in two ways: either as a carbon emission source or sink with a lot of focus on its value for C storage rather than a source. According to the AFOLU report of 2016 [
14], it is recommended that in order to understand the GHG emissions and the stocks of a country, the benchmark National GHG Inventory and National Terrestrial Carbon Sink Assessment provided were important as the first baseline emissions for the AFOLU sector in South Africa.
Organizations in the sector must take a prominent role in helping countries to achieve their commitments towards reducing GHGs. It is thus important for NBCMs to initiate baseline GHGs inventories if they are non-existent. It is also necessary to understand the contribution of NBCM at an organizational and individual level to the sector and thus the country. As a state entity, SANParks will be required to develop such a baseline on GHG inventory and conduct a carbon footprint assessment. A leader in NBCM must demonstrate how it would reduce emissions at these multiple levels.
Carbon footprint assessment has been used in different contexts, for example in the agriculture sector [
15], in the pulp and paper industry [
16], in wastewater collection, transport, and treatment [
17], and so forth (energy, tourism, and on a limited basis in the NBCM). Essentially, there are two approaches or models, namely, the process-based and the input-output model. The process-based model uses a bottom-up approach that involves a detailed life-cycle of the product while the input-output approach uses a top-down approach wherein carbon intensities are assigned at a product category level [
11,
18,
19]. The process-based life cycle assessments or carbon footprints are generally more representative of the modeled product system, but they are not necessarily more accurate. The process-based assessments are well known for their truncation error and are subject to errors of up to 50% of total impacts. However, the development of hybrid models that combine input-output and process-based approaches would be better [
17,
20]. The US National Park Service (NPS) has developed its own carbon footprint assessment tool for achieving its Green Parks Plan at a park level and therefore organization level that is inclusive of tourists and their concessionaires.
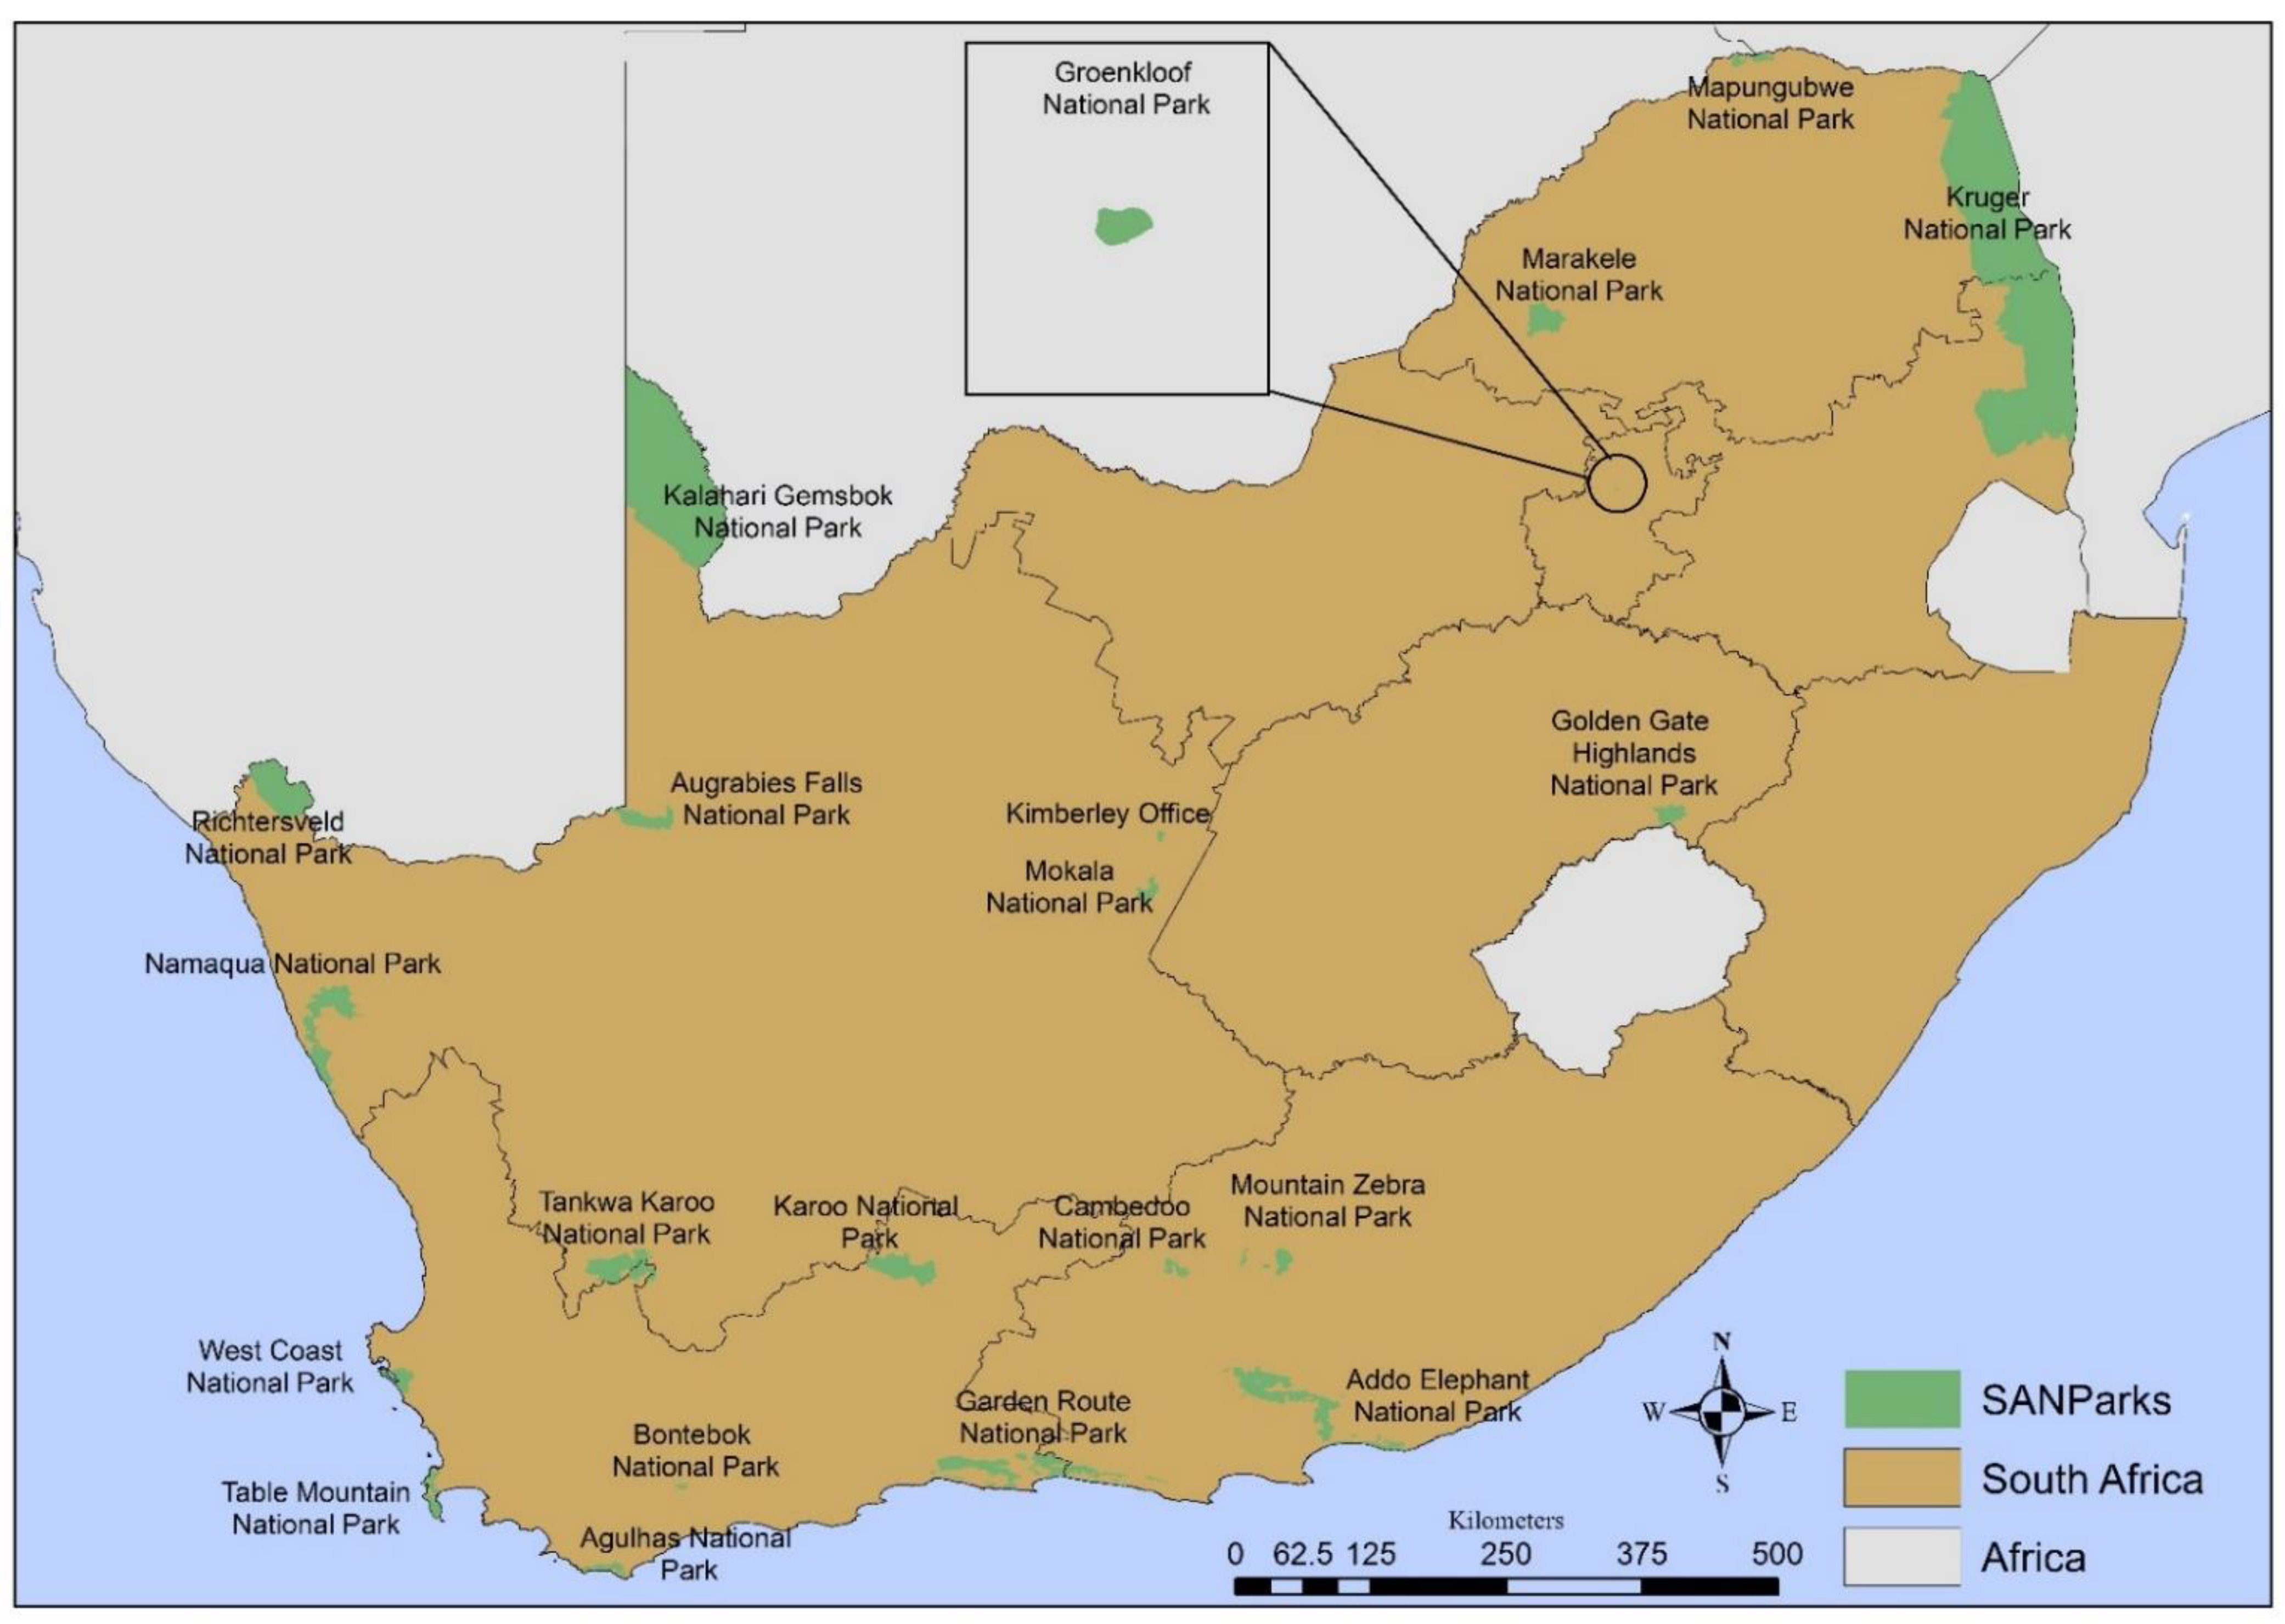
This study is the first assessment to be published to our knowledge that considers a whole network of national parks in a country. This assessment is also important in the African context since the majority of assessments in protected areas are carried out in the Northern hemisphere, e.g., US parks and Canada parks [
21]. This is a big gap in knowledge, considering the role that conservation estates play as tourism hubs for entire countries globally. This study aimed to fill that gap and hopes to galvanize conservation estates globally. A majority of the national parks show that energy and transport are the largest contributors often accounting for 82% of park operations’ GHGs [
20,
22,
23]. Another significant contributor to national parks’ total emissions is waste [
23]. At an organizational level, direct emissions from tourists are not the focus of the current paper, although it is acknowledged that it is inherent that energy, waste, and water emissions are driven by tourism occupancy within the park. It was anticipated that similarly to global and in-country trends from NBCMs, energy, stationary combustion, transport, and waste would be among the top emission sources for SANParks. However, there will be variability in the dominance of the different scopes but also of the contributions of individual parks to the SANParks estate.
This paper focused on reporting the emission sources that SANParks as an NBCM estate was responsible for. This work thereafter provides proposed mitigation responses on how to reduce each emission source at an organizational and individual park level. This paper also charts a way forward on how NBCM entities can tackle GHG emissions. The objective of the paper was to understand the SANParks C emissions profile at the organization and individual park level, and therefore its contribution at the national to international level to the AFOLU sector and to recommend the alternative scenarios that SANParks could follow to reach carbon neutrality. This study investigated the following research questions: (1) What were SANParks’ total carbon footprint and the contribution to the AFOLU sector in South Africa? (2) What was the contribution of Scope 1, 2, and 3 emissions to the total SANParks emissions? (3) What was the contribution of each park to the total SANParks emission? (4) Was there a variation in the scope of GHG emissions at park level? Lastly, (5) what has been the response from SANParks to reduce GHG emissions versus what would be the ideal scenario to reach carbon neutrality by 2050?
3. Results
In this section, SANParks’ emissions profile relative to national and SA’s AFOLU sector is presented. Emission sources, scopes, and individual park contributions are detailed below. Lastly, scenarios towards achieving carbon neutrality and renewable energy profile for the individual park are explained.
3.1. SANParks Emission
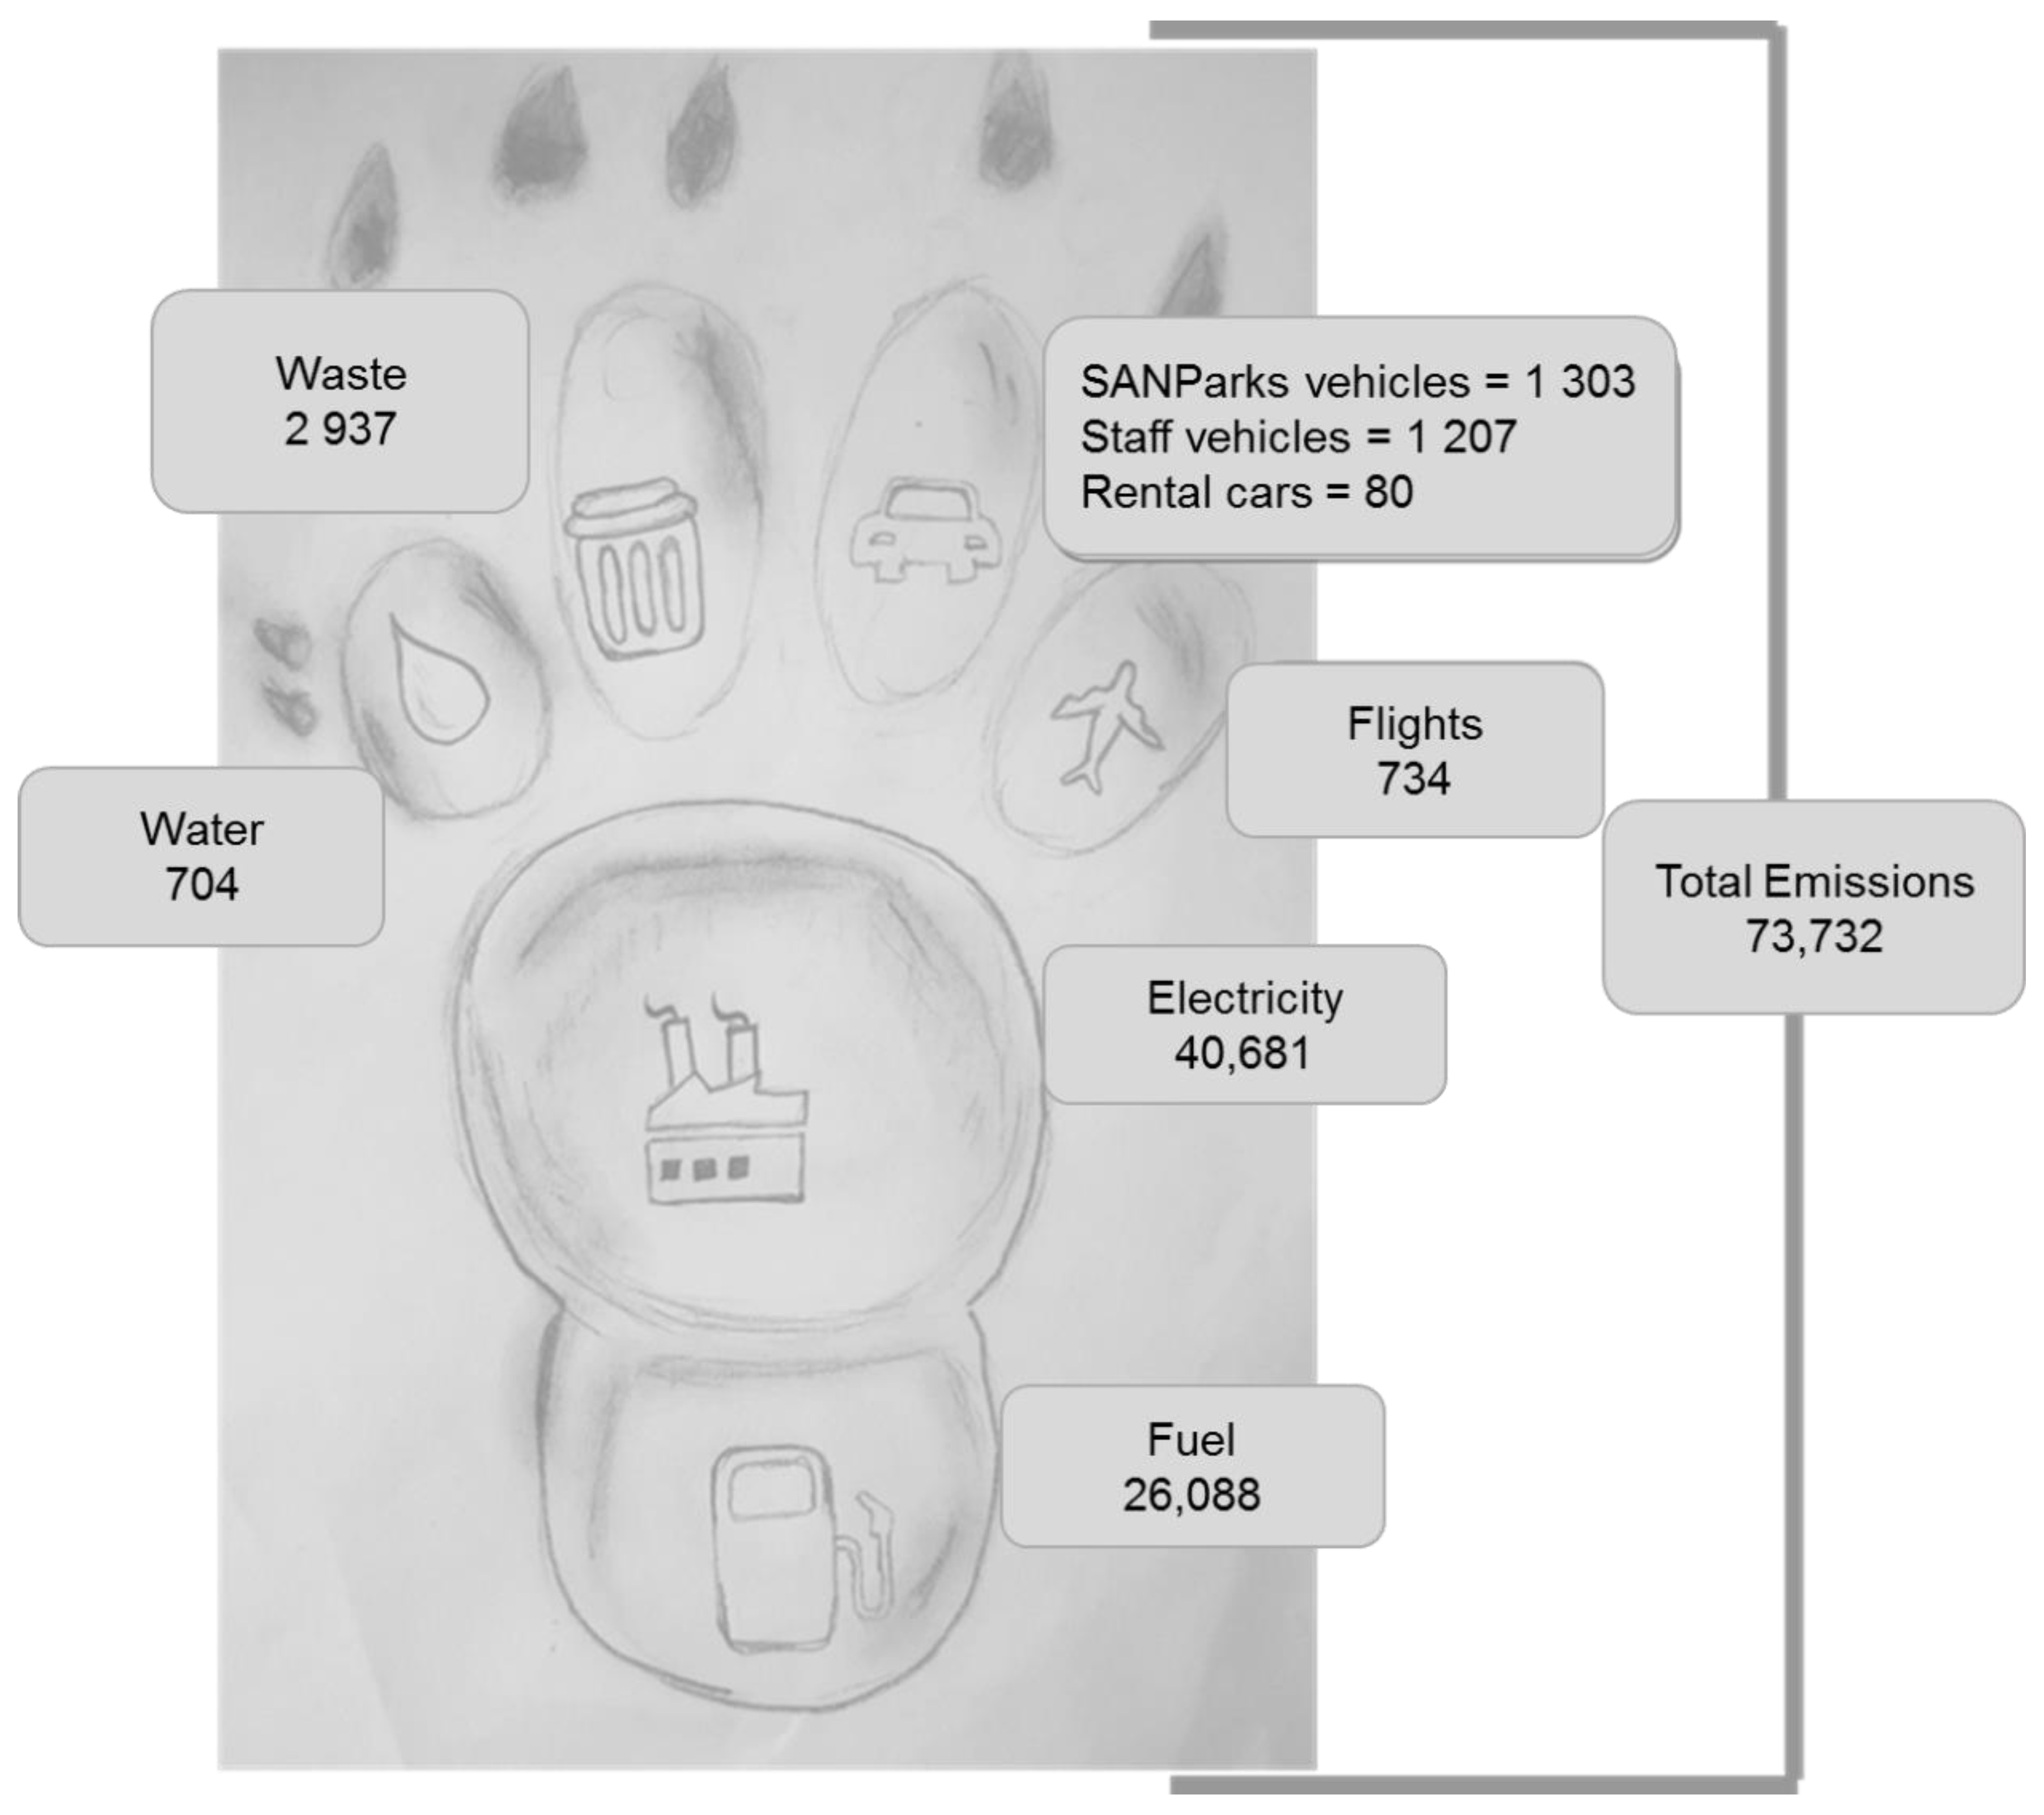
Over the reference period, SANParks emitted an average of 73,732 tCO
2e per year (
Figure 3). This does not include emissions reduction through the installation of solar panels presented in Table 4. It also does not include the carbon offset generated by having a large carbon sink which the paper did not cover as the focus was on GHG emissions rather than C storage. Global emissions increased by 0.6% from 2018–2019 [
31]. Over the 2015–2019 period, SANParks’ emissions increased by 0.02% on average. As expected, the rate of increase for SANParks was less than the global and national rate of increase. In order to understand SANParks’ contribution to the national and the SA’s AFOLU sector, this study used the year 2015 value of 68,812 tCO
2e compared with the national figure which amounted to 531 million tCO
2e and for the AFOLU sector was 49.5 million tCO
2e. SANParks’ contribution equates to 0.01% to total national emissions and 0.14% for the AFOLU sector. The results illustrate that electricity usage contributed a total of 40,681 t of CO
2e, followed by fuel combustion which contributed 26,088 t of CO
2e, and solid waste contributing 2937 tCO
2e to the total SANParks carbon footprint (
Figure 3).
On an annual basis, total emissions ranged between 68,487 tCO
2e in 2014/2015 and 75,903 tCO
2e in 2017/2018, the latter was higher than 2018/2019 (
Table 2). The highest rate of increase in emissions occurred between 2014/2015 and 2015/2016 by 7%, while the smallest increase occurred between 2016/2017 and 2017/2018 by 0.9%. A decline of 0.4% occurred between 2017/2018 and 2018/2019. The average increase rate over the five-year period was 2.5%, however from 2016/2017 after SANParks committed to reducing energy emissions, there was an overall decline of 1.4% annually.
3.2. Contribution of Scope Emissions to Total SANParks and Individual Park Emissions
A large proportion of GHG emissions was from Scope 2 and 1, in that order. Scope 2 was mainly electricity (40,681 tCO
2e), and it accounted for 55% of the total SANParks carbon footprint (
Figure 3;
Table 2). For Scope 1, fuel usage accounted for 35.4% of the total scope emissions (27,391 tCO
2e), while SANParks vehicles accounted for 1.8%, thereby accounting for 37.2% of the total SANParks carbon footprint. Altogether, these two largest contributing scopes accounted for about 92% of the total SANParks emissions. For the organization to achieve the greatest reduction impact, these should be the scopes that the organization targets the most. Scope 3 accounted for the remaining 8% of the total SANParks emissions, of which waste accounted for 4% followed by staff vehicles at 1.6% and the remainder was made up of emissions resulting from water, flights, and rental cars.
Scope 1 emissions within each park contributed on average 15% to the total individual park emissions. However, the highest contribution from Scope 1 to specific park emissions occurred in Tankwa Karoo National Park (TKNP) (80%) followed by KNP (48%) and Kalahari Gemsbok National Park (KGNP) (43%). The smallest contributions came from Groenkloof National Park (GNP) (1.1%), Augrabies Falls National Park (AFNP) (2.6%), West Coast National Park (WCNP) (2.7%), Golden Gate Highland National Park (GGHNP) (3.3%), Mokala National Park (MNP) (3.4%), Namaqua National Park (NNP) (4.3%), and TMNP (5.2%) (
Table 3).
On average across all national parks and offices, Scope 2 contributed 66% to the per park total emissions. However, the highest contribution from Scope 2 to a specific park’s emissions occurred in GGHNP (91.3%) followed by MNP (88.9%), AFNP (88.4%), Karoo National Park (KRNP) (87.3%), Mountain Zebra National Park (MZNP) (87.2%), Marakele National Park (MRNP) (83.1%), WCNP (81.9%), and GRNP (81.2%). The smallest contributions came from TKNP (0%) and NNP (33.8%).
In the 20 national parks and Kimberly office, Scope 3 contributed 18.7% on average to the per park total emissions. However, the highest contribution from Scope 3 to the specific park emissions occurred in NNP (48.9%) followed by GNP (41.8%), Bontebok National Park (BNP) (41.3%), and Camdeboo National Park (CNP) (35.8%). The smallest contributions came from KNP (4.8%), GGHNP (5.4%), KGNP (6.6%), MNP (7.7%), MZNP (8.5%), and KRNP (8.6%)
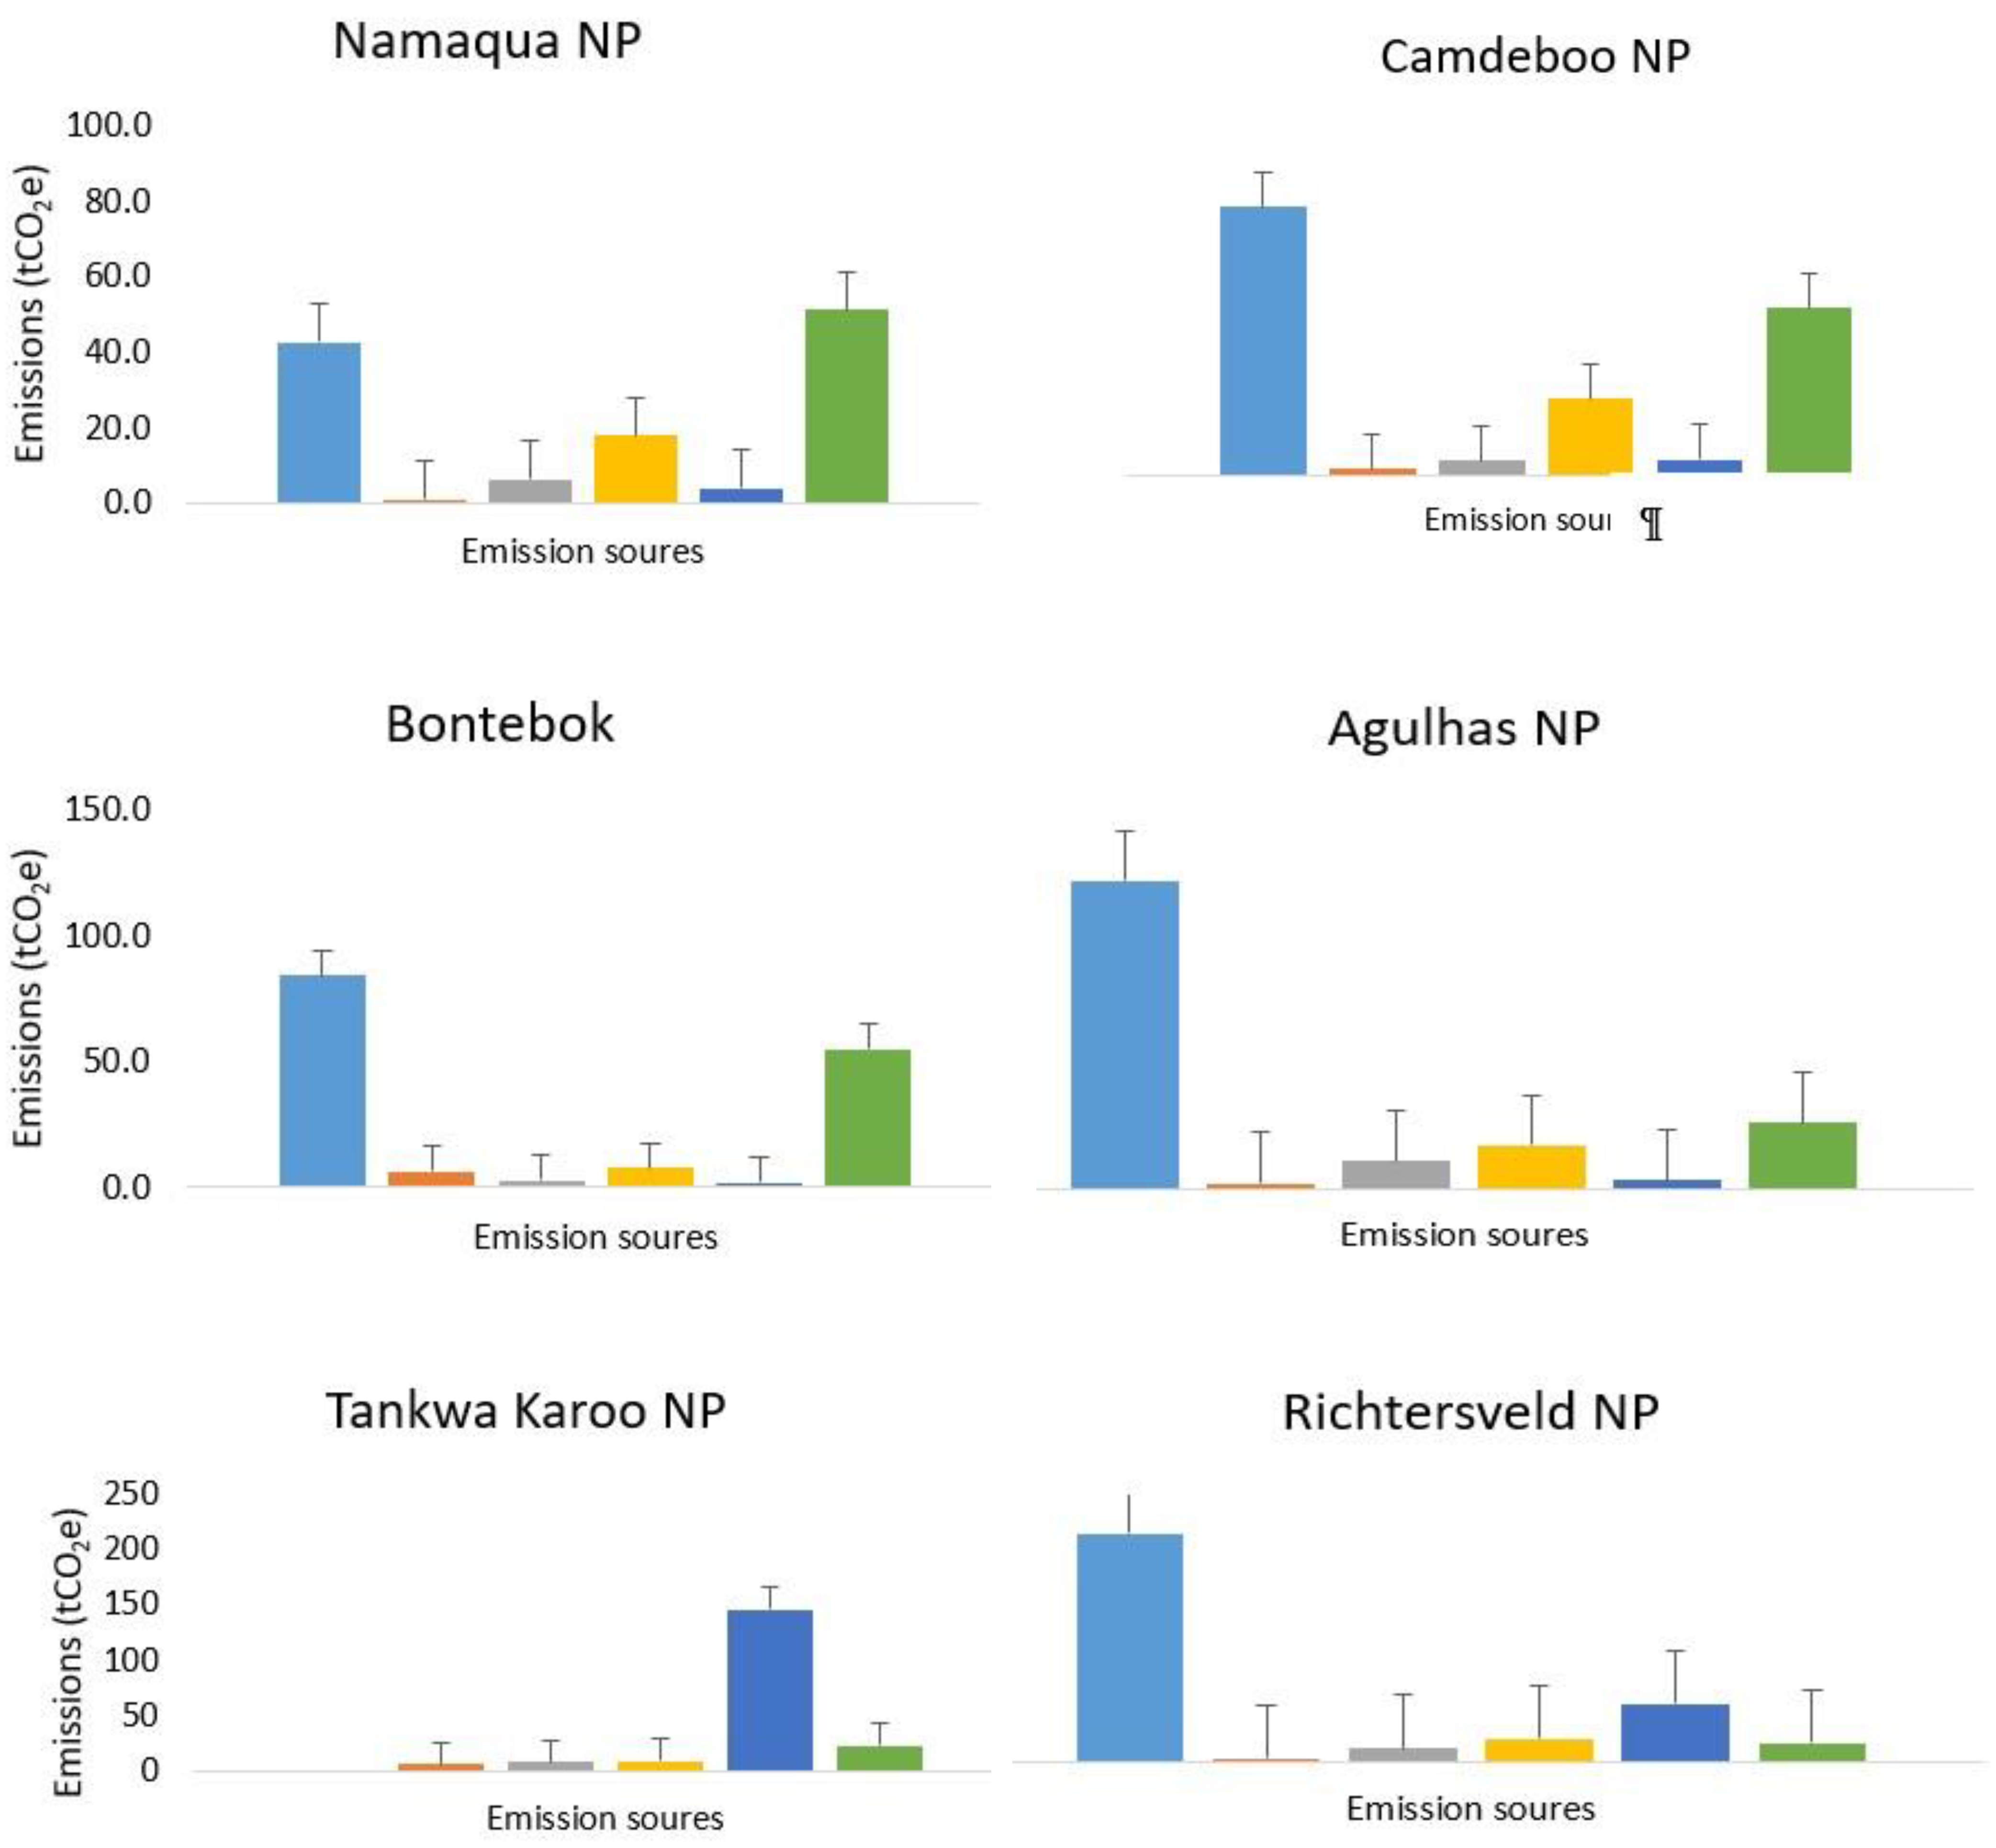
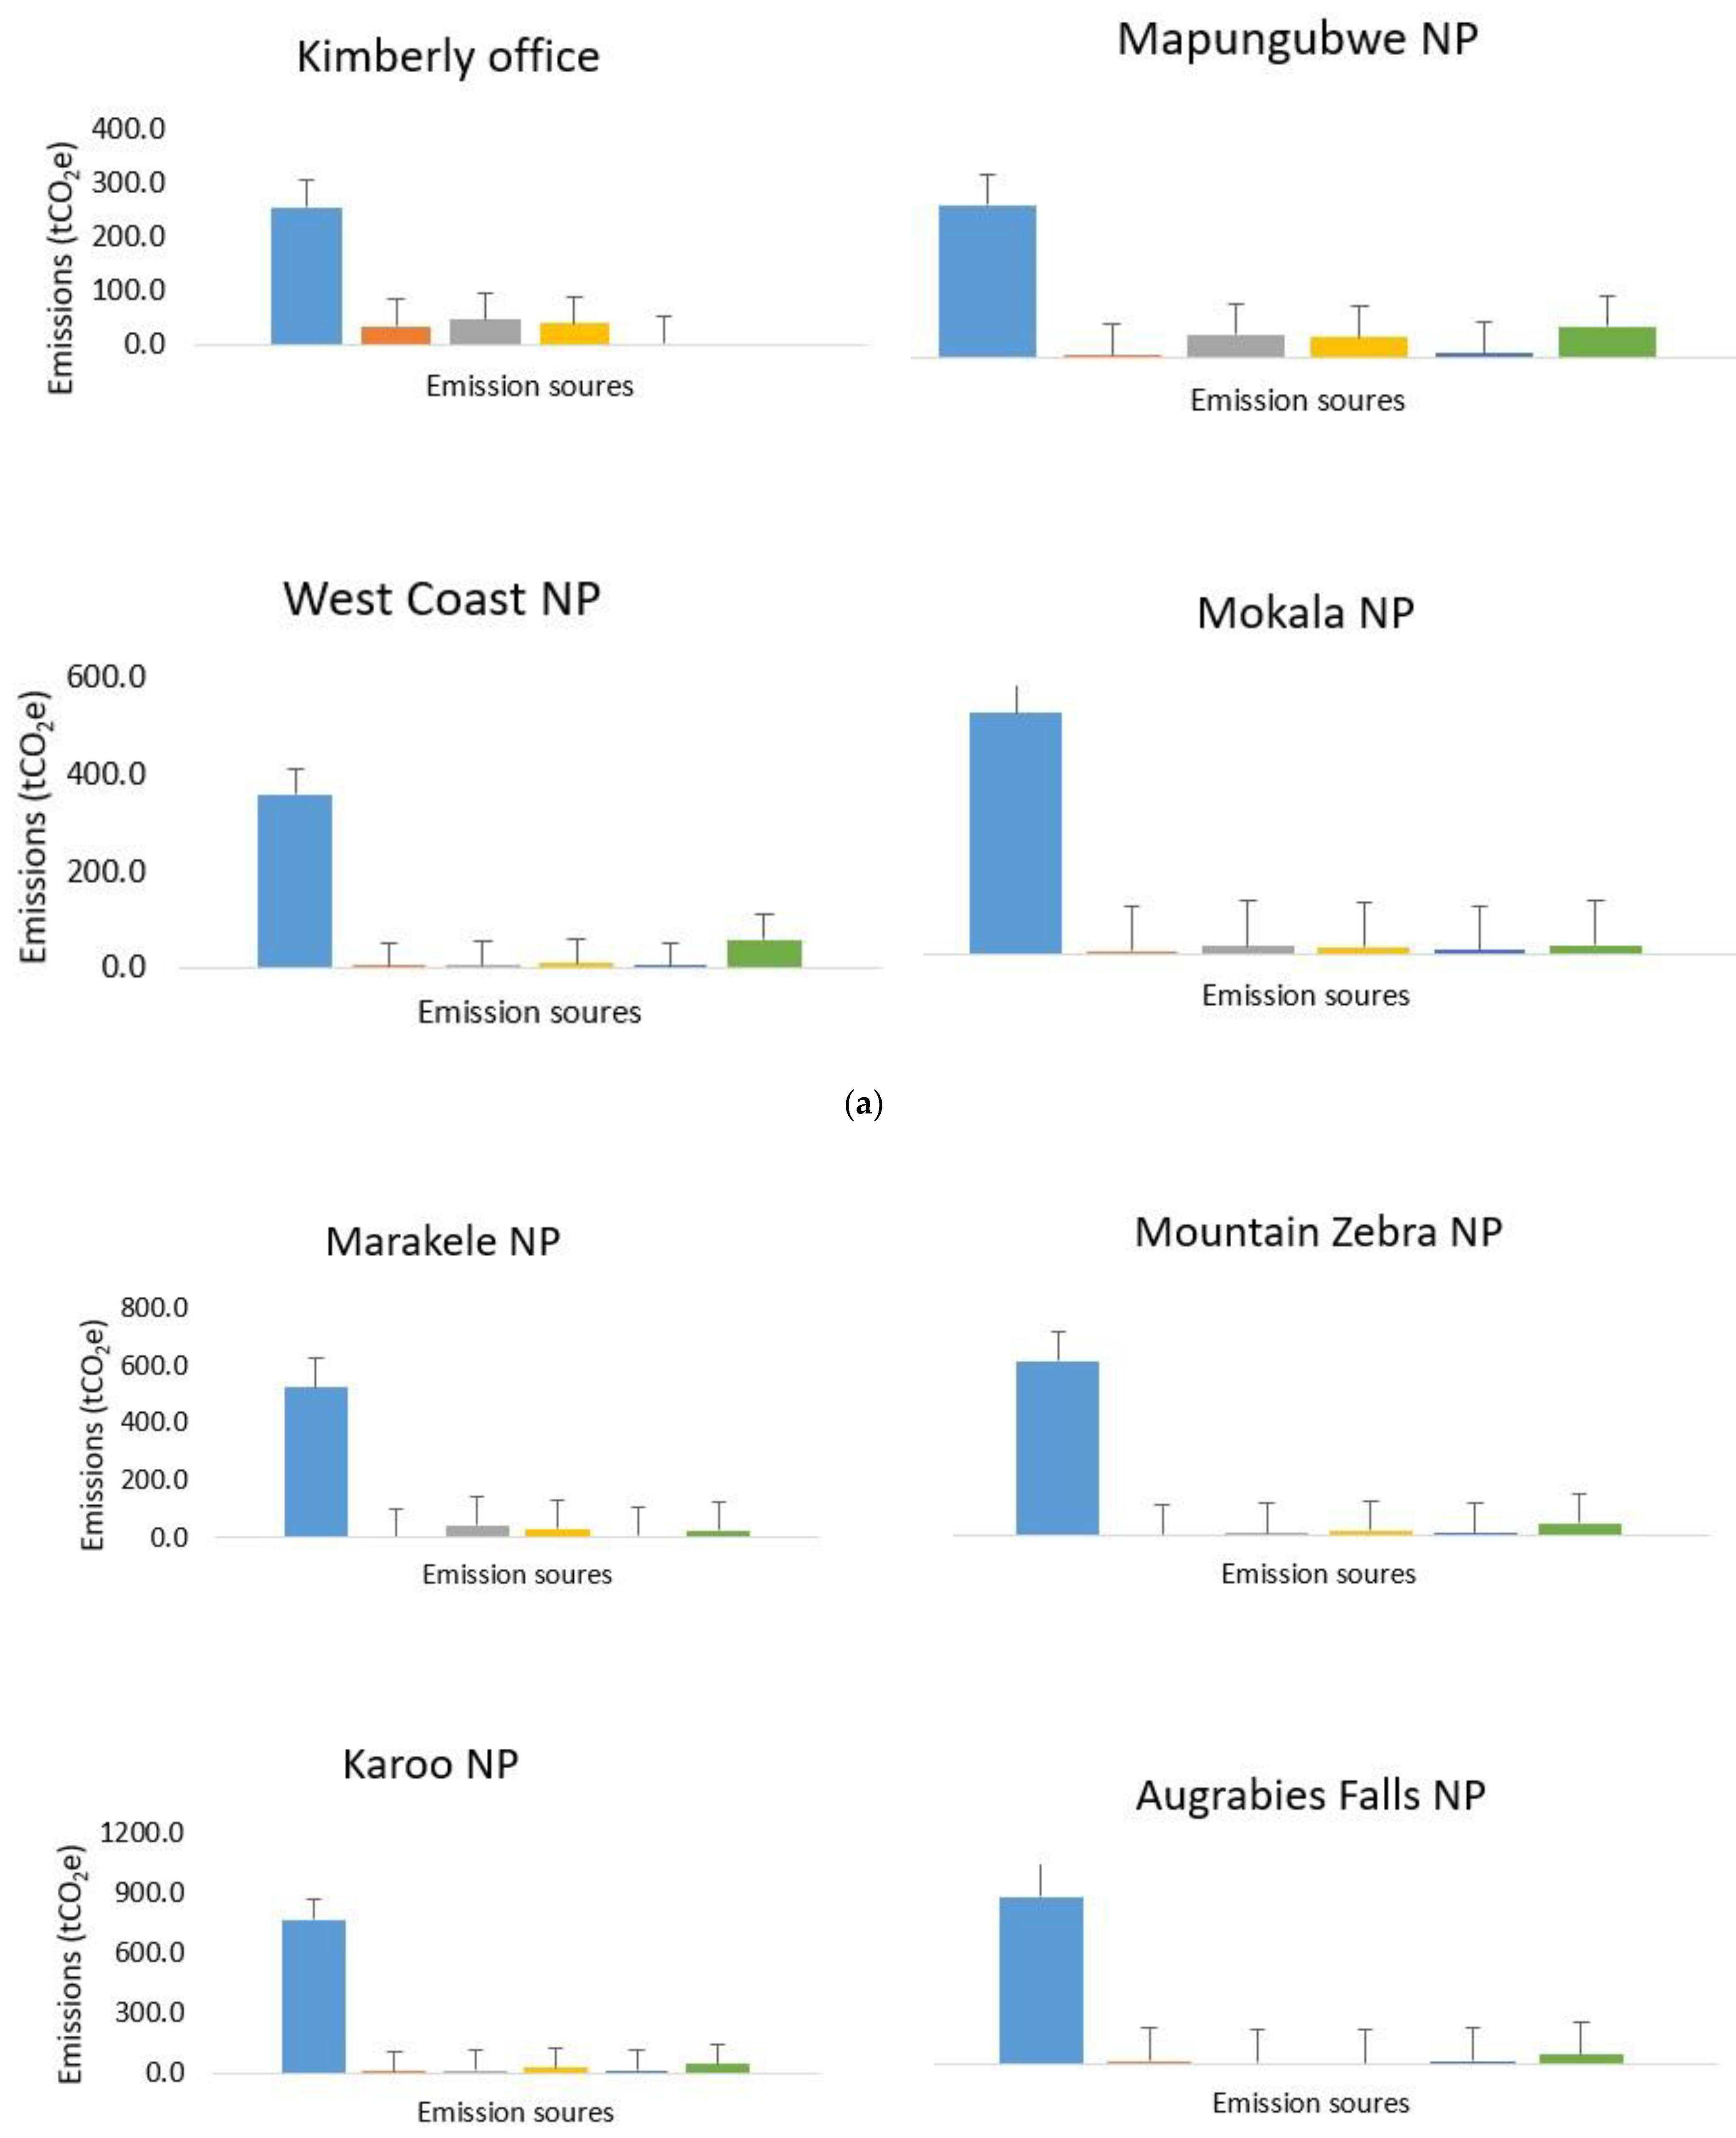
3.3. Emissions Per Park
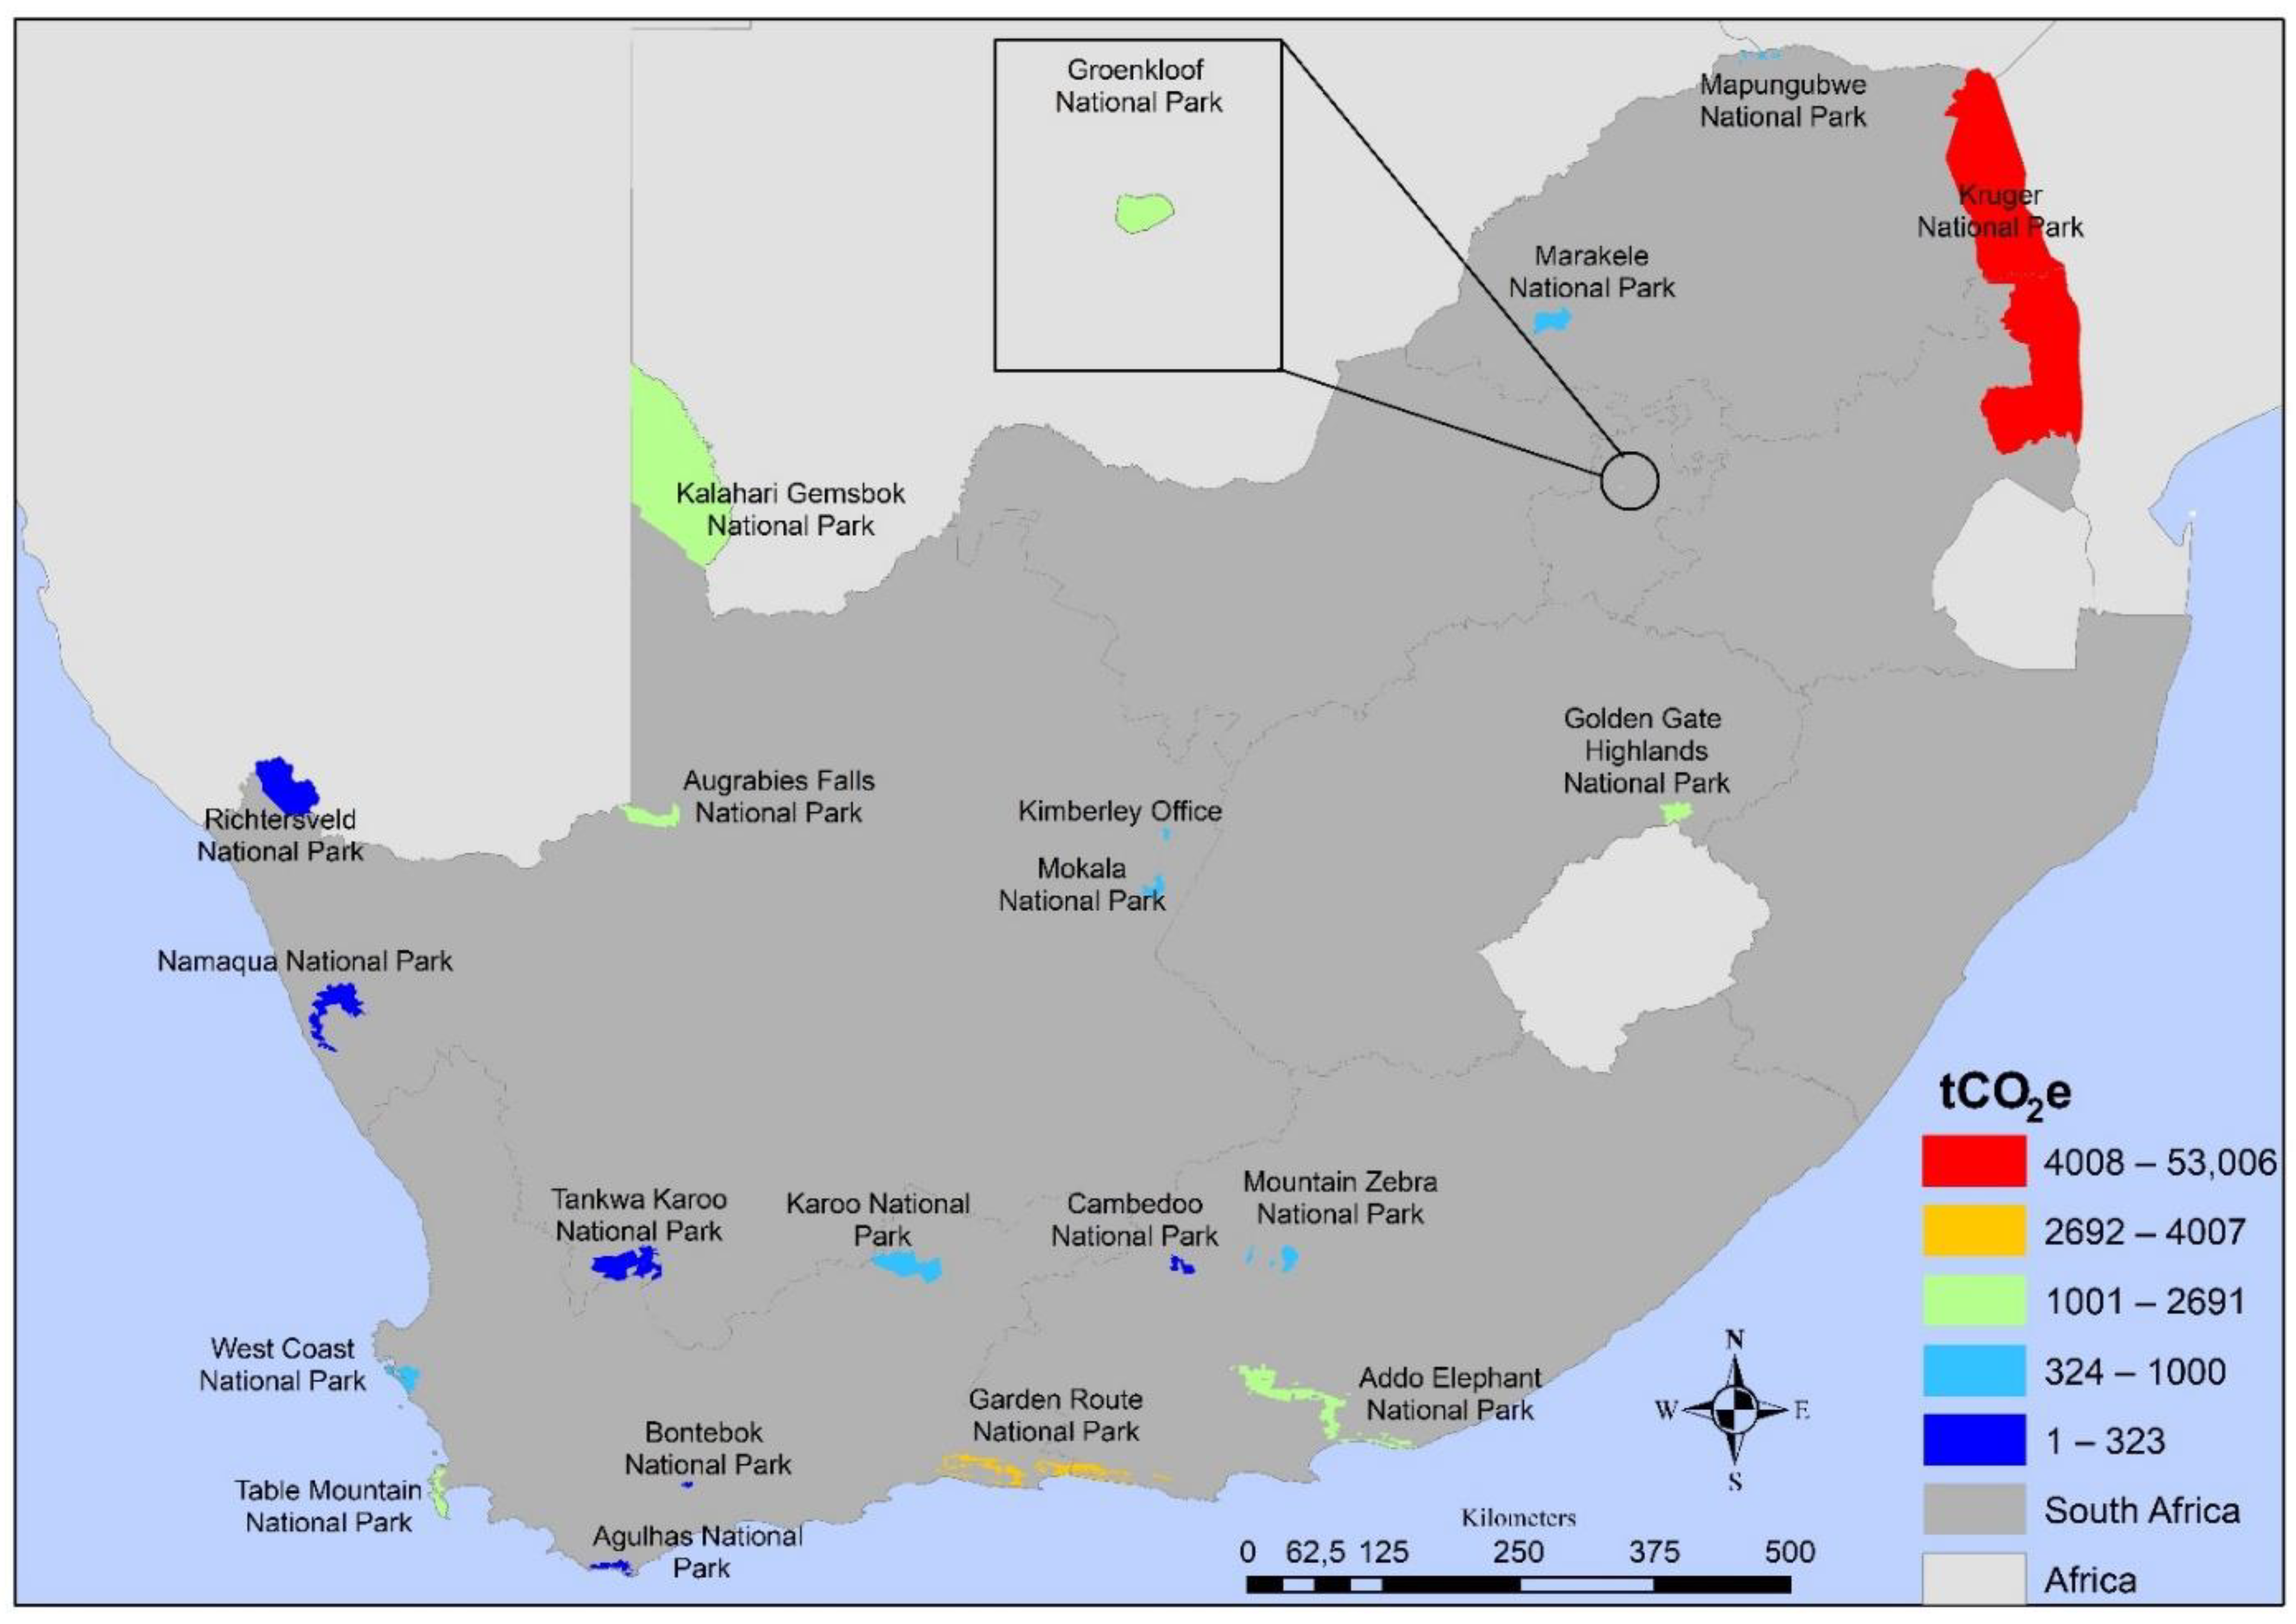
The most contributing park to SANParks’ total emissions was KNP at 53,169 tCO
2e (
Figure 4;
Figure A1b). This equates to a total contribution of 72% to the total SANParks’ emissions. The relative frequency of individual park emissions suggested that 16 national parks, including Kimberly office, contributed less than 2000 tCO
2e while 4 national parks accounted for above 2000 tCO
2e (
Table 3). The latter are responsible for the most emissions recorded for SANParks, responsible for 84% to SANParks emissions.
3.4. Contribution of Park Scope Emissions to Total SANParks Scope Emissions
Under Scope 1, the highest contributing individual park towards the total SANParks Scope 1 emissions was KNP (25,302 tCO2e), which accounted for 92% of the total SANParks scope 1 emissions. The higher emissions from fuel usage for stationary combustion within the Scope 1 came from KNP, GRNP, AENP, KGNP, TKNP, and Richtersveld National Park (RNP); these parks accounted for 99% of total emissions from fuel combustion. For the remaining source under Scope 1, KNP had the highest emissions from SANParks-owned vehicles too, 610 tCO2e, followed by GRNP (152 tCO2e) and TMNP (117 tCO2e). Table Mountain National Park had the most emissions coming from SANParks vehicles compared to fuel usage under this Scope. The moderate contribution was from both RNP and GGHNP. The least contributing parks to total Scope 1 emissions of SANParks were BNP, WCNP, GNP, Agulhas National Park (ANP), MNP, and NNP, accounting for 10, 12, 17, 20, 21, and 22 tCO2e, respectively.
In Scope 2, KNP was the top contributing park accounting for 25,301 tCO
2e followed by GRNP at 3308 tCO
2e, TMNP at 2000 tCO
2e, GGHNP (1766 tCO
2e), and AENP (1697 tCO
2e). This equates to a contribution of 62%, 8%, 5%, 4%, and 4%, respectively. Together, these parks were responsible for 34,072 tCO
2e, which translated to 83% of the total SANParks Scope 2 emissions (40,681 tCO
2e). The moderately contributing parks were AFNP (1005 tCO
2e), KGNP (915 tCO
2e), GNP (861 tCO
2e) and KRNP (767 tCO
2e). The least contributing parks were TKNP, NNP, and Camdeboo National Park (CNP), responsible for 0, 43, and 79 tCO
2e, respectively (
Figure A1a).
In Scope 3, KNP was the top contributing park towards the total Scope 3 emissions for SANParks and accounted for 2566 tCO2e followed by TMNP at 632 tCO2e, GNP at 631 tCO2e, and GRNP (461 tCO2e). This equates to a contribution of 45.3%, 11.2%, 11.1%, and 8.1%, respective to the total SANParks Scope 3 emissions. Together, these parks were responsible for 4290 of 5661 tCO2e, which translated to 75.8% of the total SANParks Scope 3 emissions. The moderately contributing parks were AENP (224 tCO2e), KGNP (122 tCO2e), GGHNP (104 tCO2e), Kimberly office (103 tCO2e), Addo Elephant National Park (AFNP) (103 tCO2e), and Mapungubwe National Park and World Heritage Site (MNPWHS) (94 tCO2e). The least contributing parks were WCNP, TKNP, ANP, MNP, and MZNP, responsible for 0.6, 0.7, 0.7, 0.8, and 1 tCO2e, respectively.
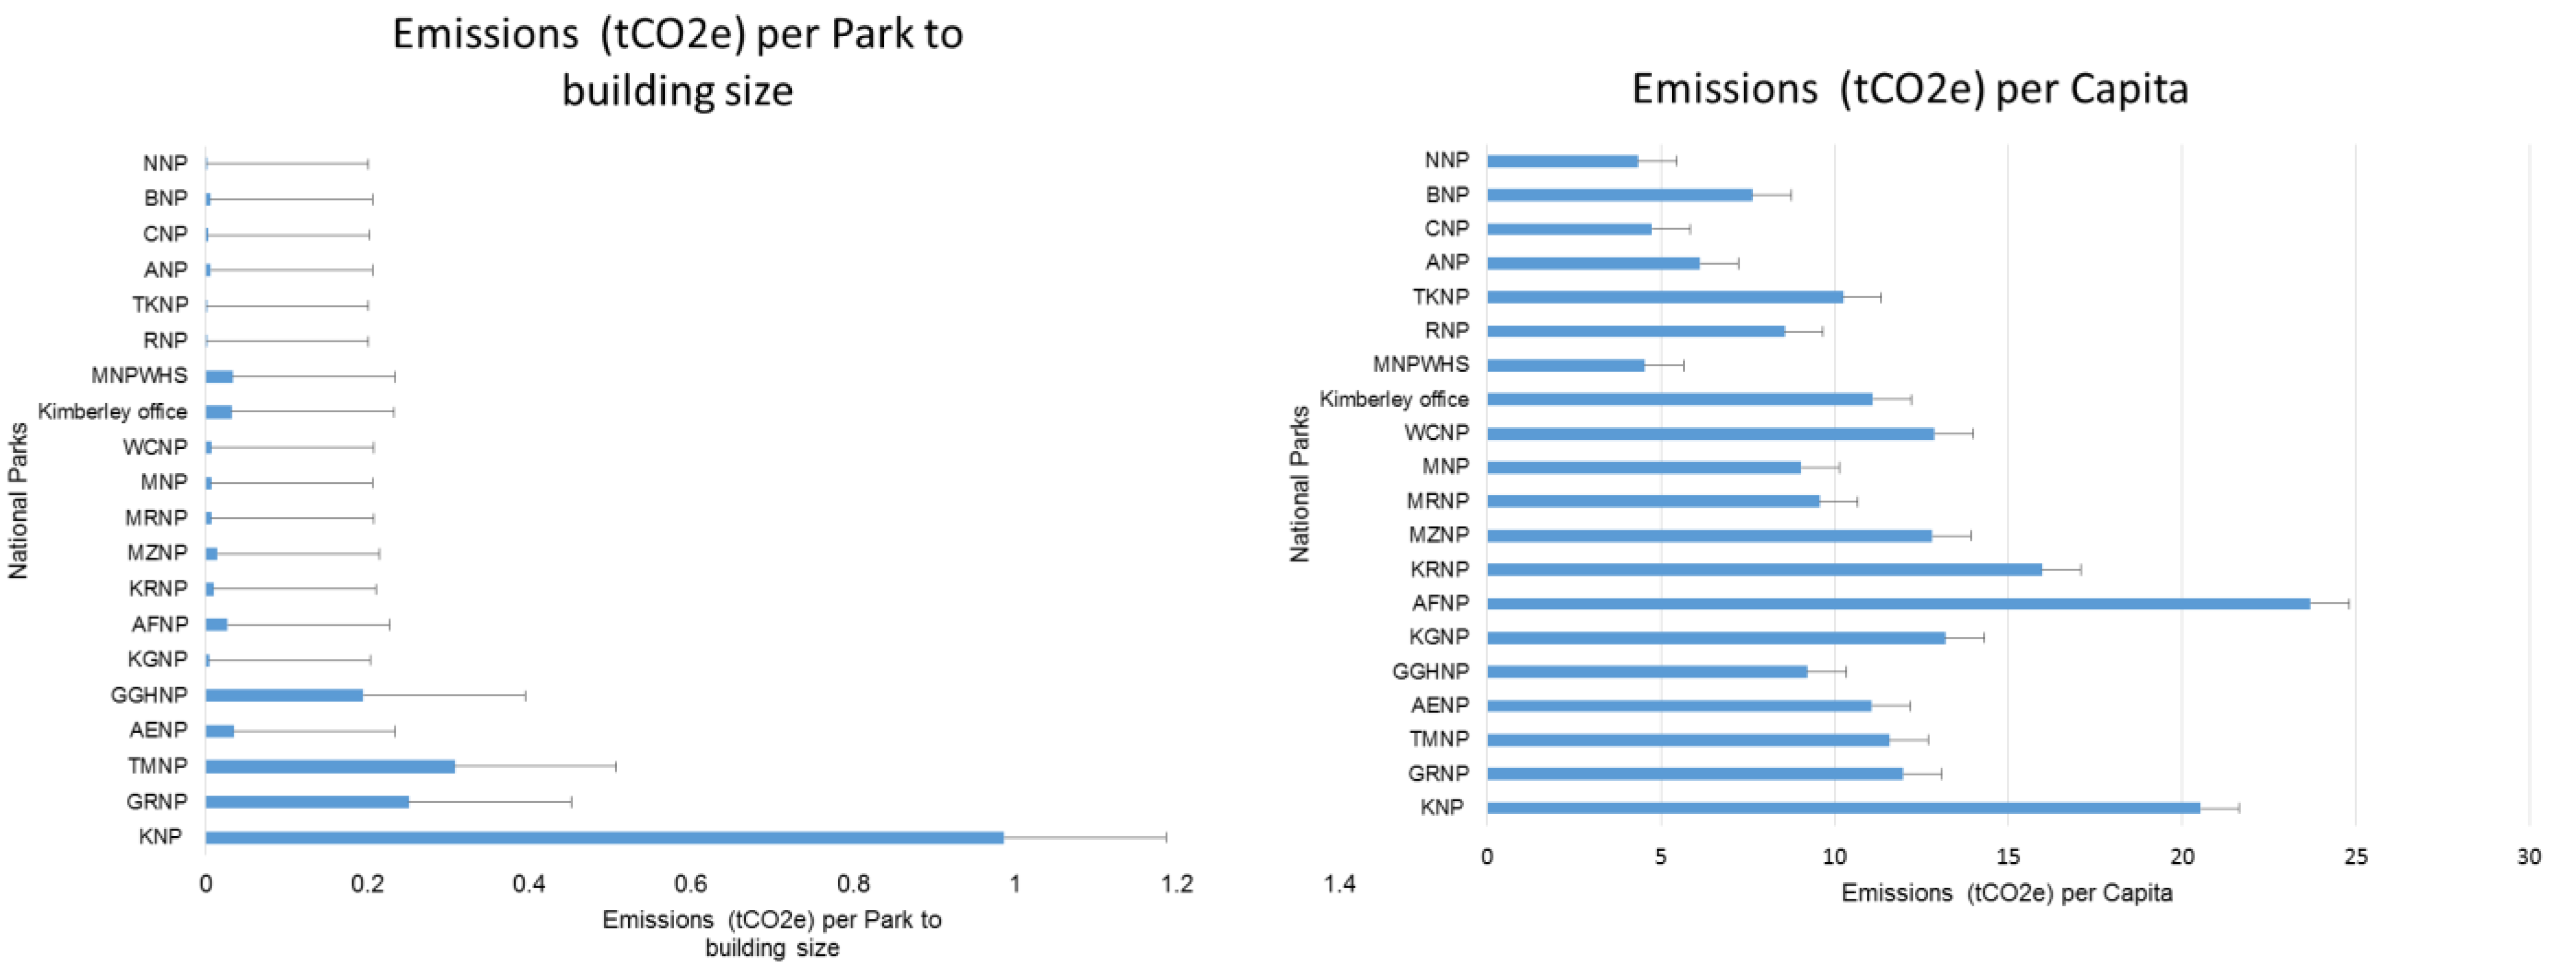
Groenkloof National Parks had high emissions intensity followed by KNP, TMNP, and GRNP, representing 237, 0.99, 0.31, and 0.24 tCO
2e/ha, respectively (
Figure 4). The least contributing parks in terms of emissions intensity were NNP, RNP, and TKNP. Groenkloof National Park had the lowest per capita, followed by NNP, MNPWHS, and CNP, which accounted for 1.4, 4.3, 4.5, and 4.7 tCO
2e/ employee, respectively (
Figure 5). The highest emissions per capita came from AFNP, KNP, and KRNP, accounting for 24, 21, and 16 tCO
2e/employee, respectively.
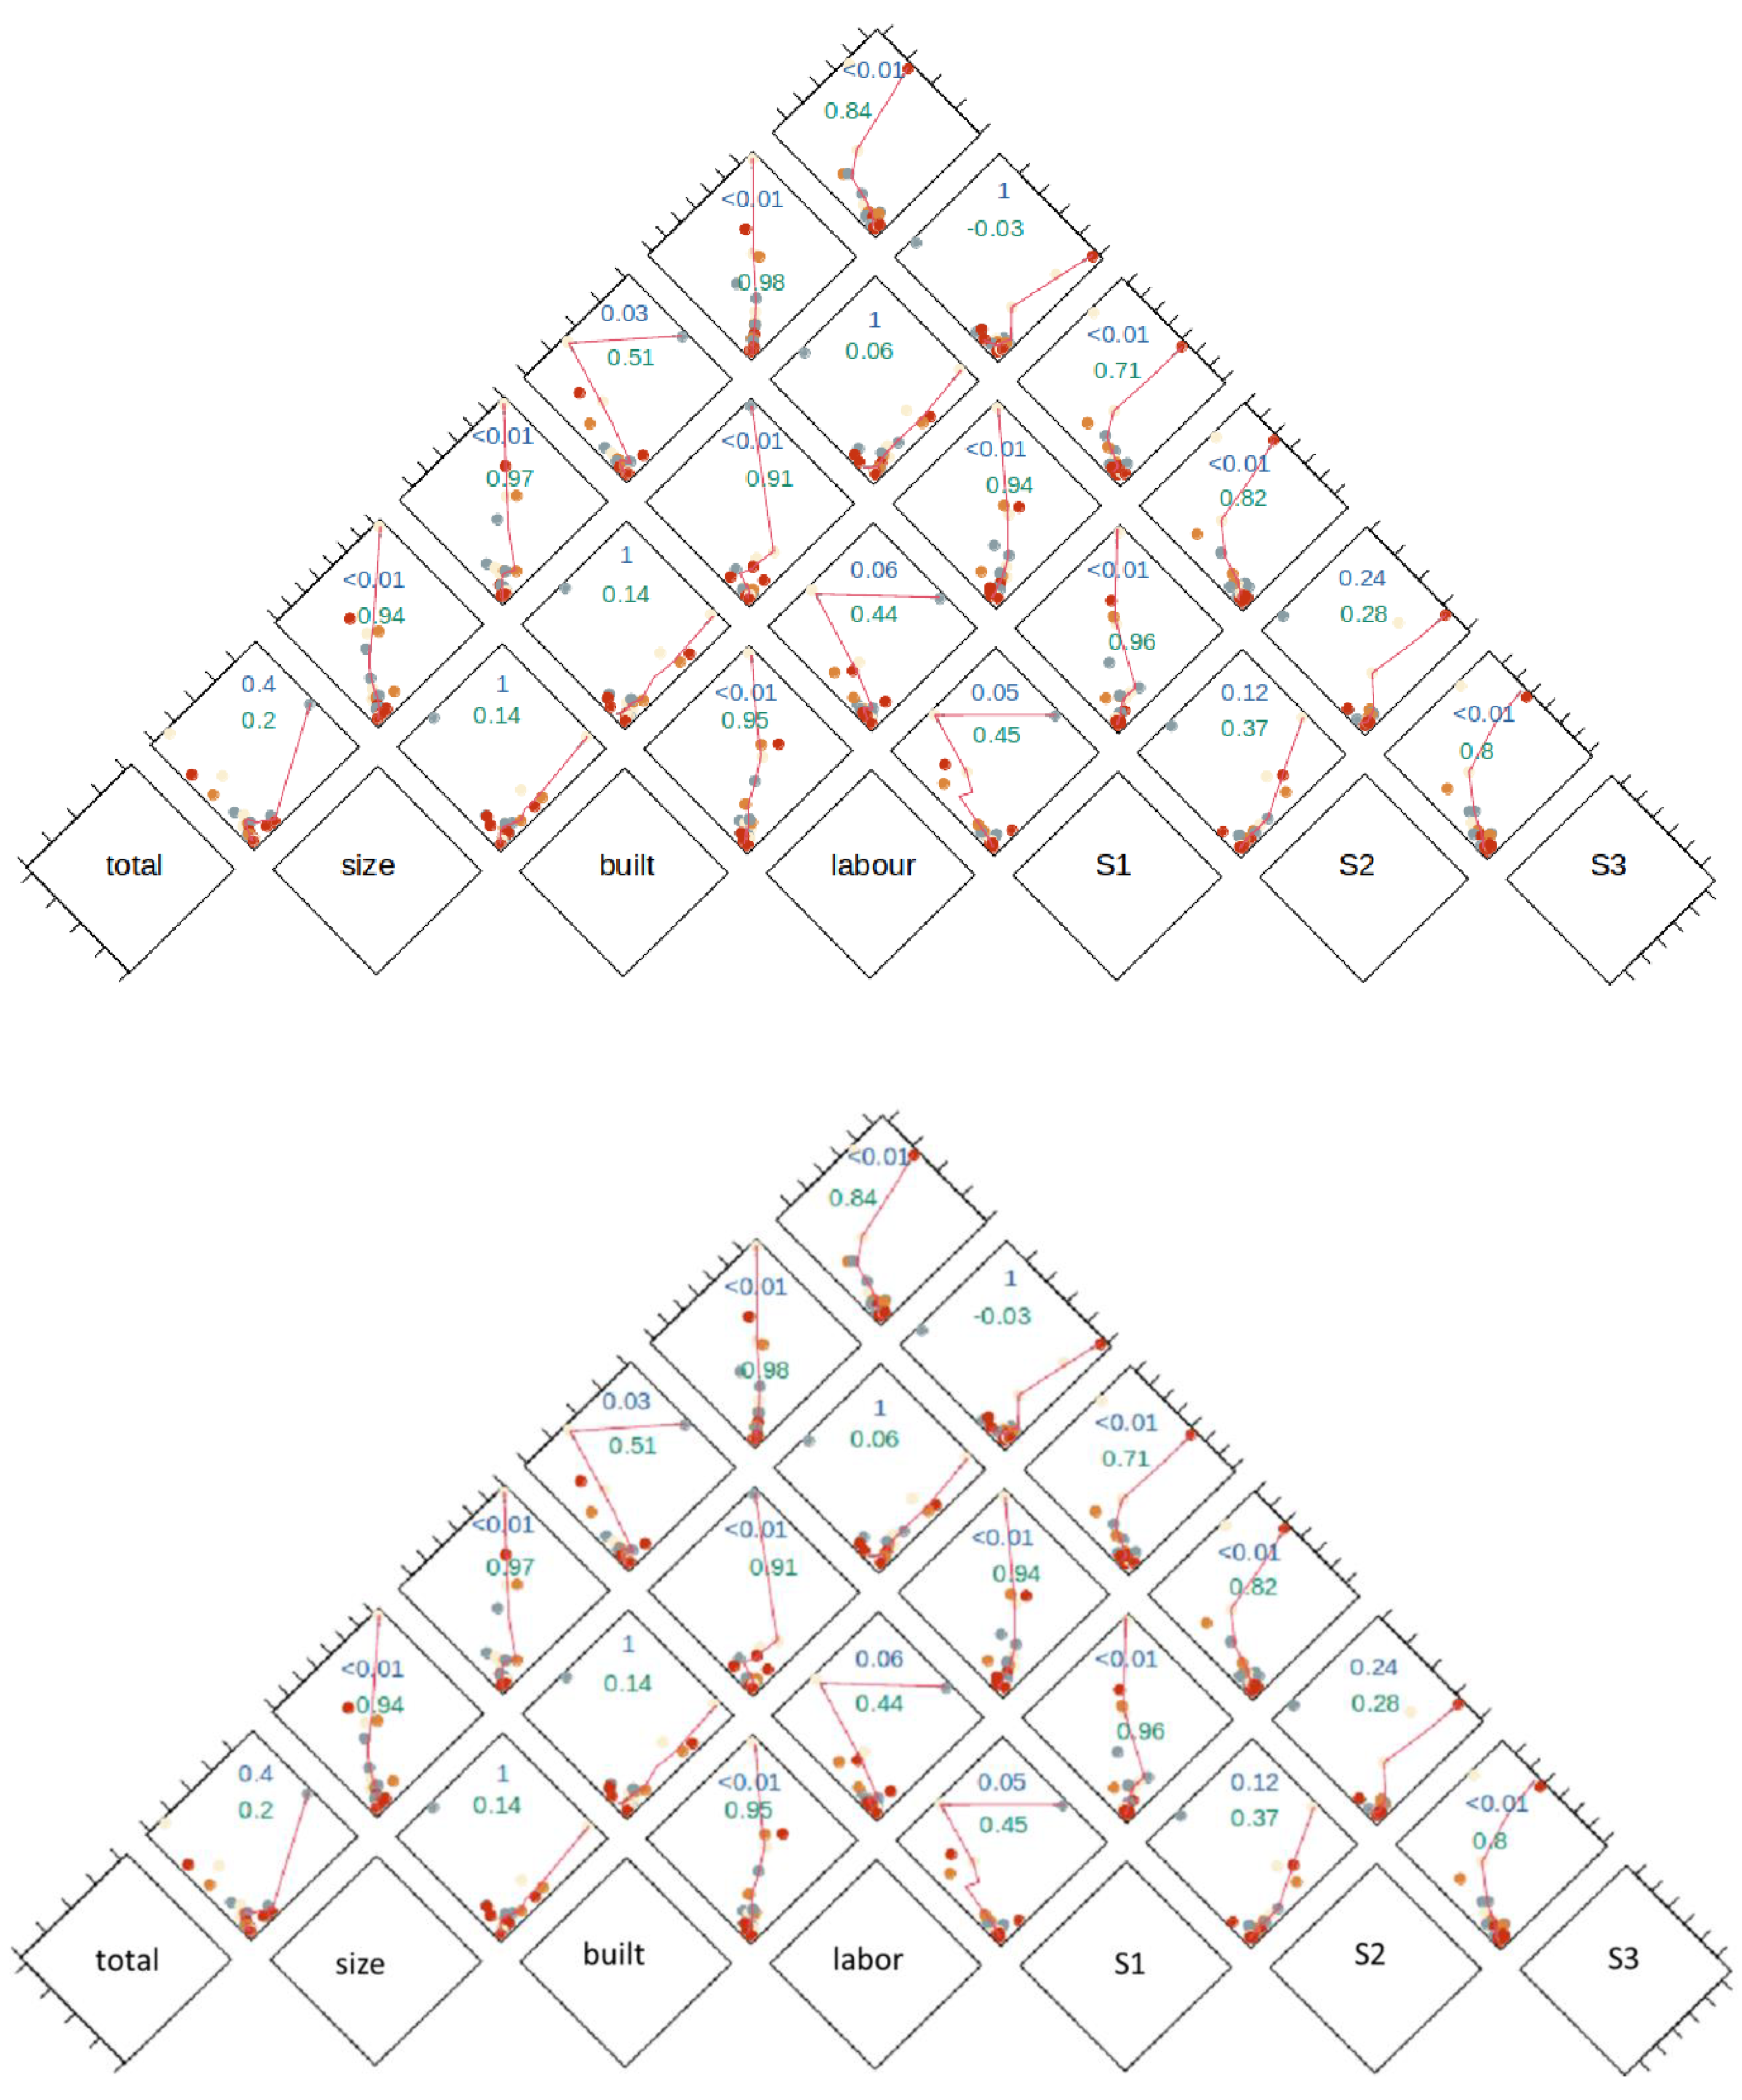
3.5. Relationships between Total SANparks’emissions, Park Size, Built Size, Labor, Scope 1, Scope 2, and Scope 3
The results showed no significant relationship between total SANParks’ emissions and total park sizes; however, there was a significant relationship between total SANParks’ emissions and park size, building size, labor, Scope 1, Scope 2, and Scope 3. Similarly, there was no significant relationship between park size and building size, number of employees, Scope 2, and Scope 3, yet, there was a significant relationship between park size and Scope 1. The analysis showed a relationship between building size and number of employees, Scope 2, and Scope 3, however, there was no significant relationship between building size and Scope 1. There was no significant relationship between number of employees and Scope 1, however, the results showed a significant relationship between number of employees and Scope 2 as well as Scope 3. There was no significant relationship between Scope 1 and the other Scopes. Finally, the results showed a significant relationship between Scope 2 and Scope 3 (
Figure 6).
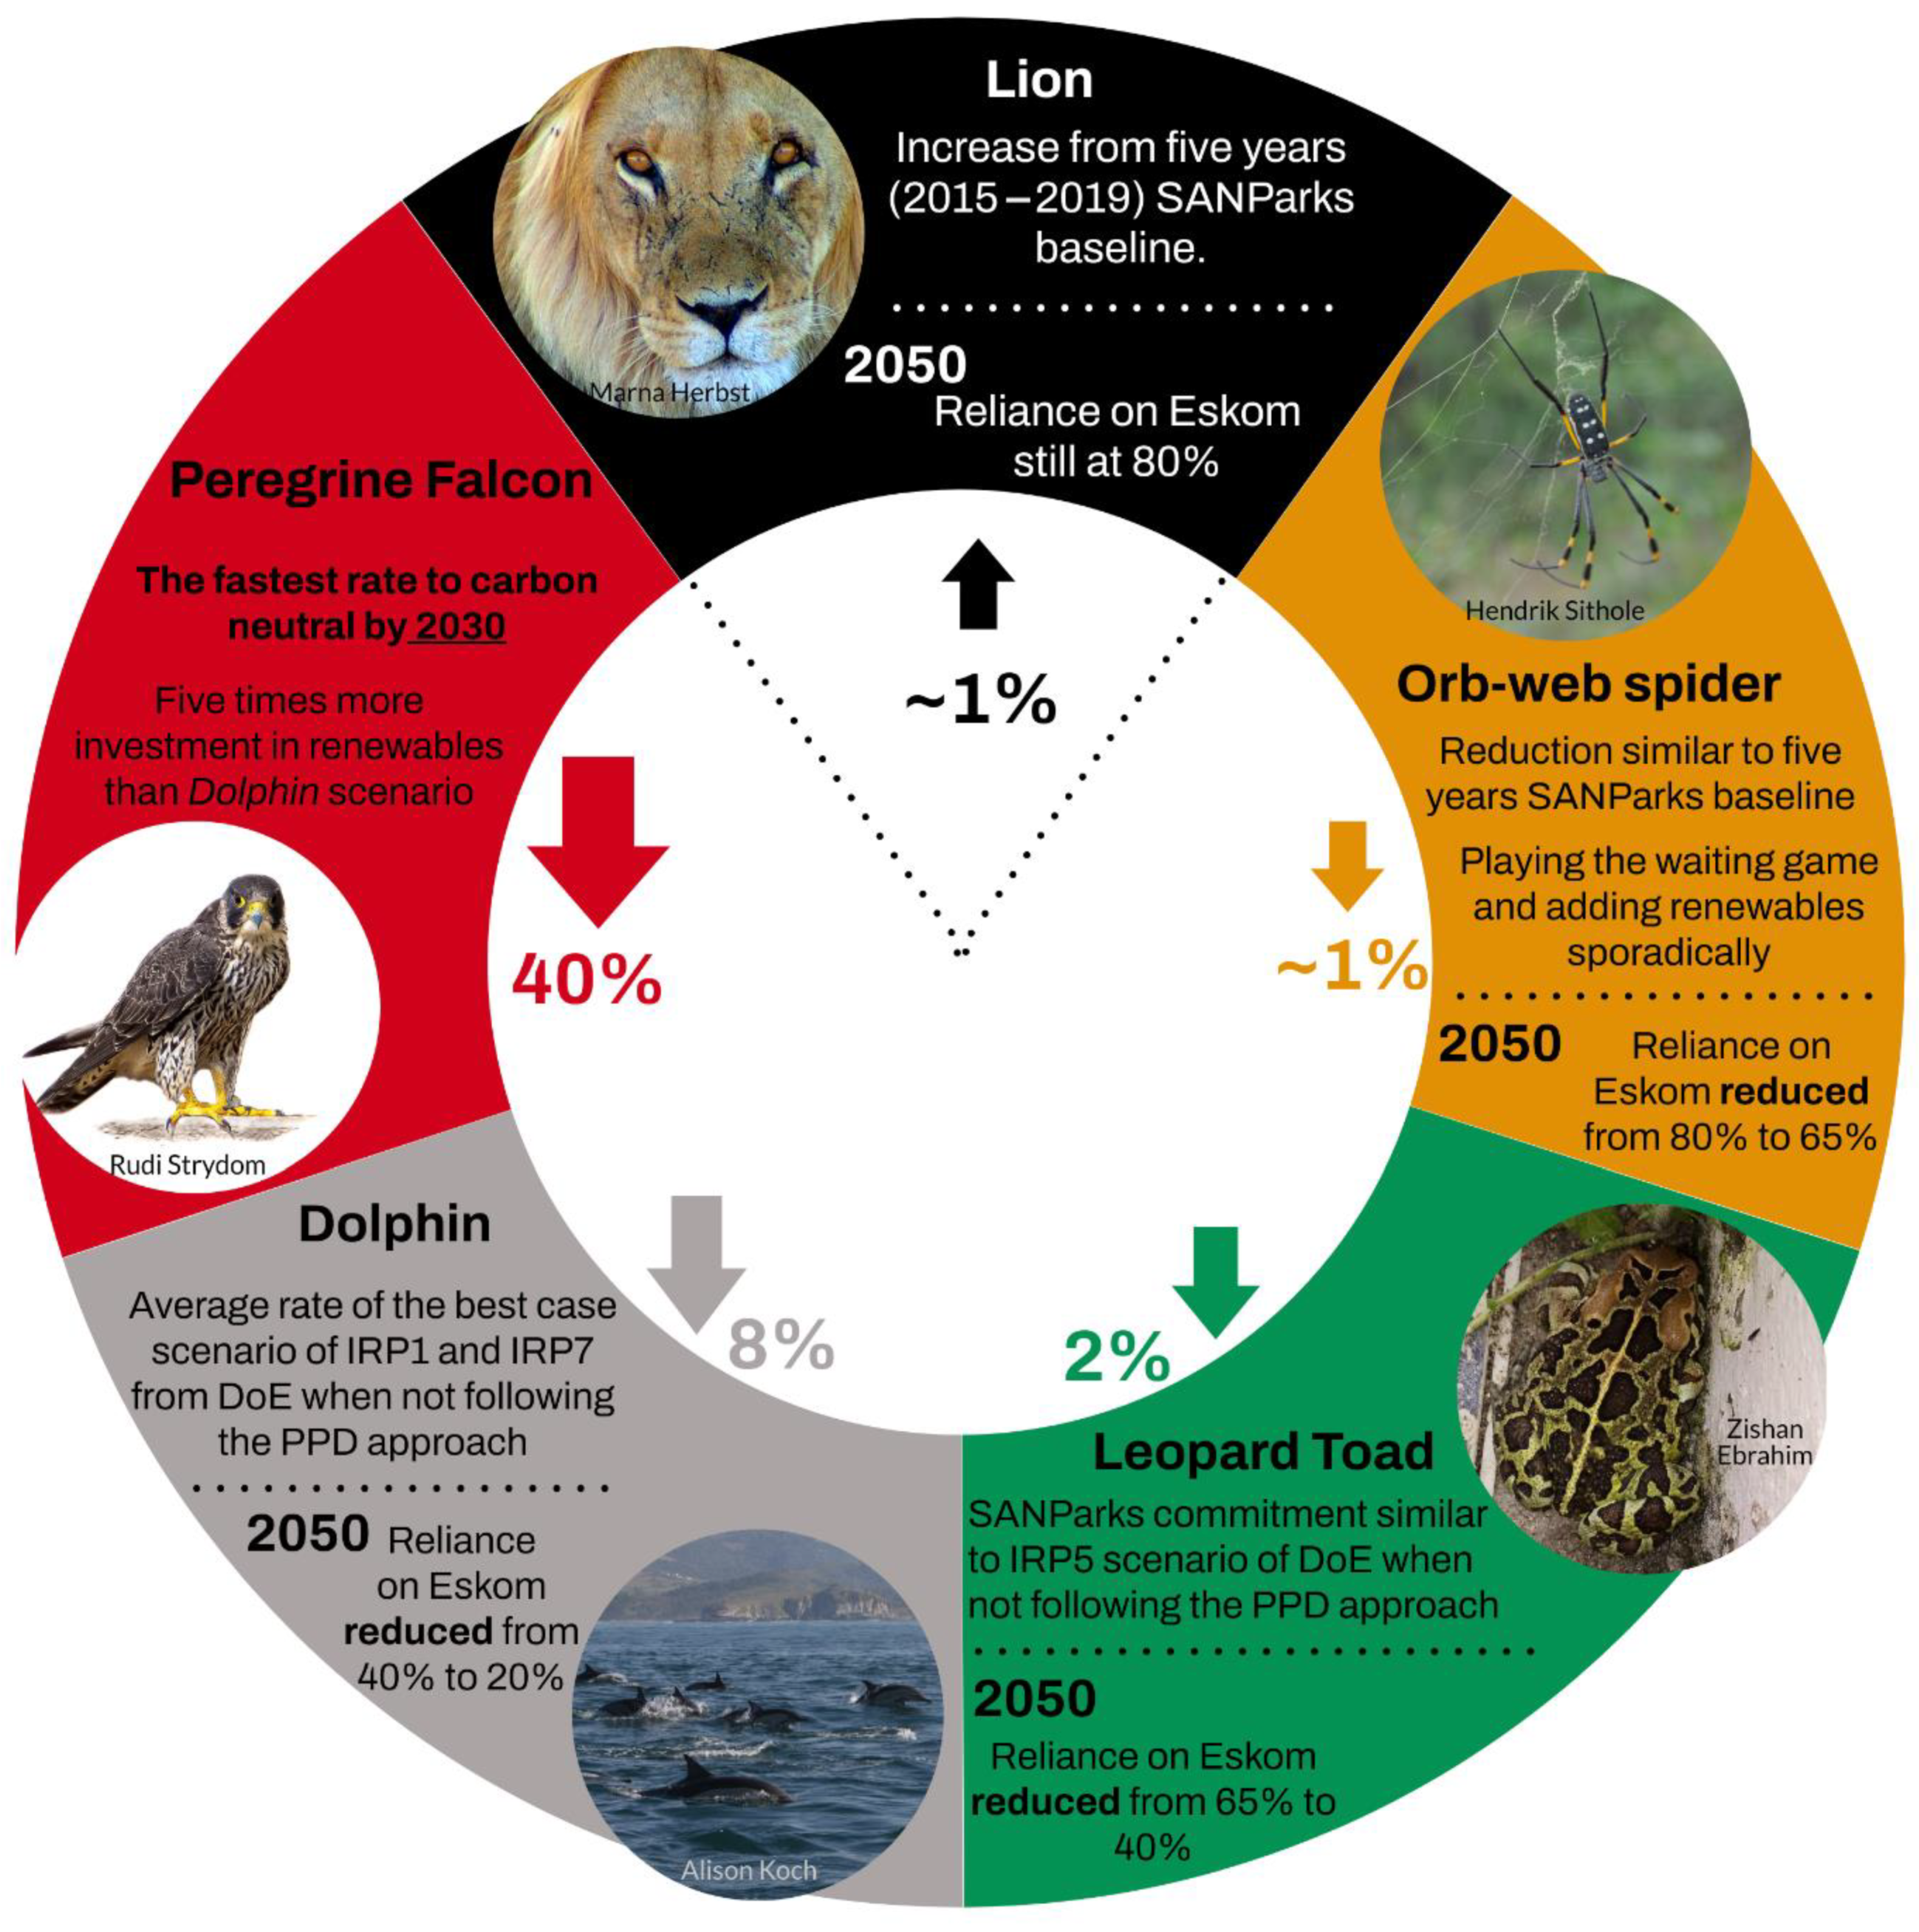
3.6. SANParks Electricity Emissions under Current and Future Scenario
The results for electricity emissions reduction under current and future scenarios show that all scenarios remain almost similar in 2025 except for the Dolphin and especially under the Peregrine Falcon scenario (
Figure 7). For example, the total emissions for SANParks will move from the current value of 40,681 tCO
2e to 43,044 tCO
2e under the Lion scenario, while for the Orb-web Spider scenario it will decline to 38,429 tCO
2e, whereas the Leopard Toad scenario will decline to 35,316 tCO
2e. The greatest decline is from the Peregrine Falcon scenario at 506 tCO
2e followed by the Dolphin scenario at 22,350 tCO
2e. The former shows the most significant decline in emissions by 2025 and neutrality is almost achieved by 2030 with emissions equaling only 39 tCO
2e.
The Lion scenario shows a steady but sharp increase by 2050 under the current trajectory of emissions from 43,044 to 44,816 tCO2e by 2030 and ultimately reaching 52,663 tCO2e in 2050. The Orb-web Spider shows a slightly bigger margin of decline at 36,898 tCO2e compared to the Lion scenario at 44,816 tCO2e in 2030; however, it was slightly higher in emission when compared with the Leopard Toad scenario with its value of 31,923 tCO2e. The Dolphin scenario cut emissions by more than half from 2025 levels to 14,571 tCO2e in 2030 and therefore appears to be way better than former scenarios in 2030.
SANParks’ commitment of 2% year-on-year does not achieve neutrality under the Leopard Toad scenario by 2050 despite reducing emissions from 35,316 in 2025 to 21,312 tCO2e, while the Dolphin remains the most efficient reducing emissions from 14,571 in 2030 to 2632 tCO2e by 2050. The Peregrine Falcon scenario achieves neutrality as early as in the vicinity of 2030. This work evaluated cost-saving under the different scenarios below to check the value for money of each scenario.
3.7. Renewable Energy Profile over the 5 Years of Study
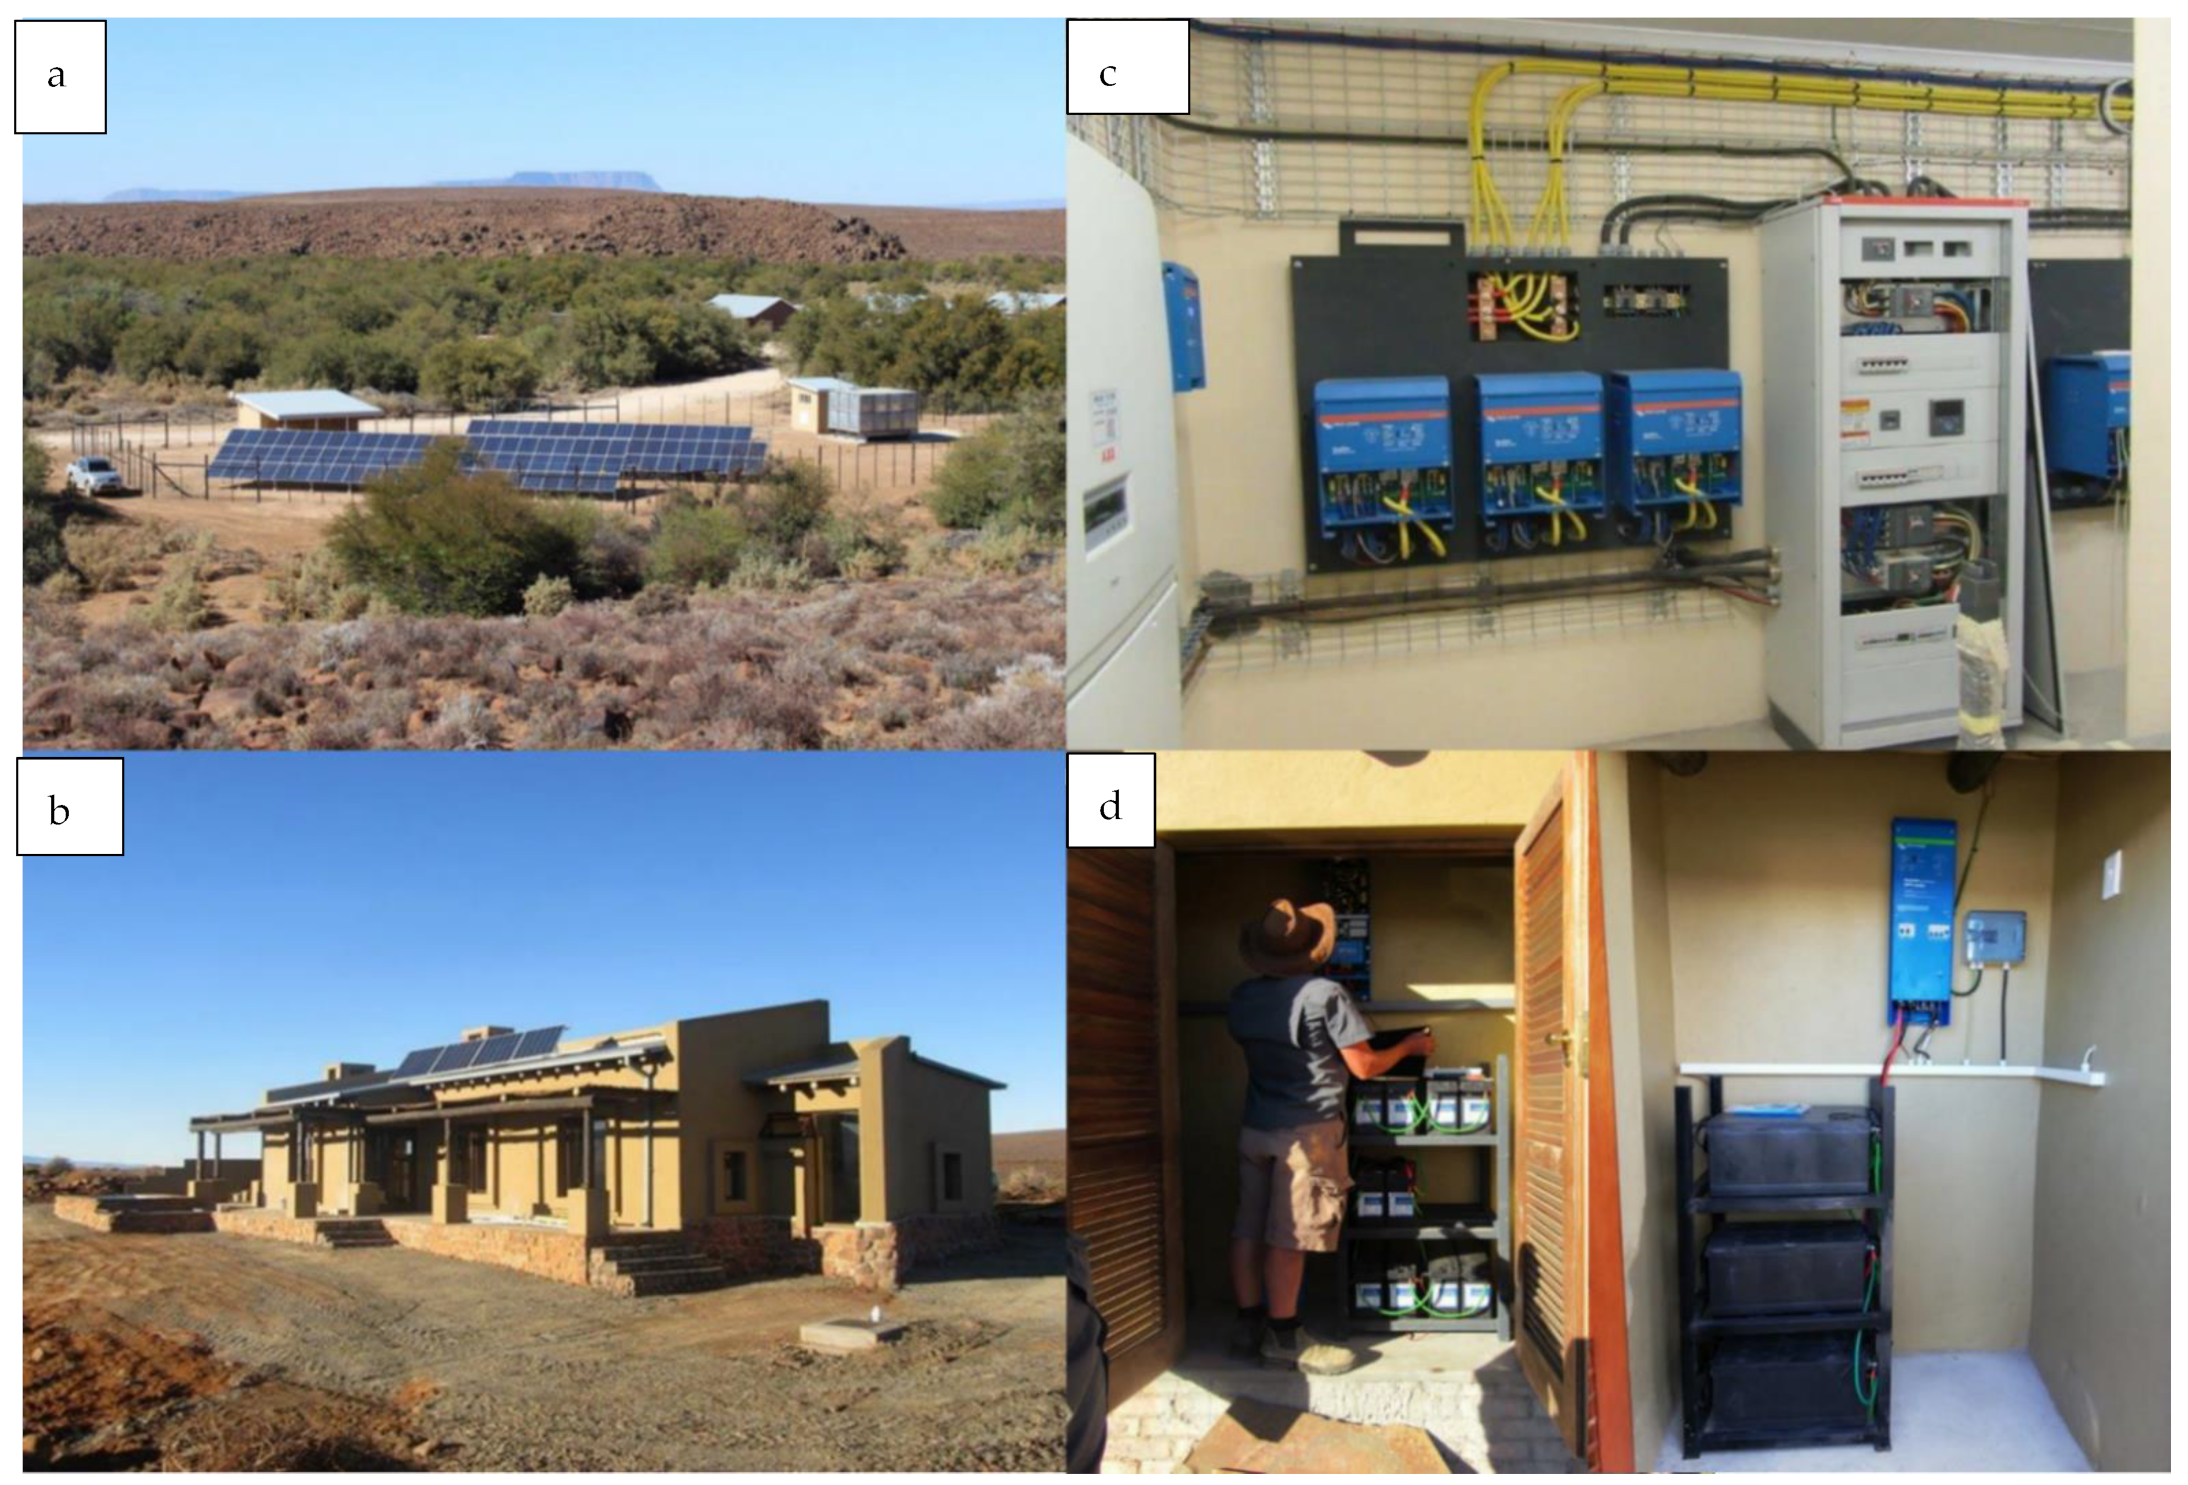
Table 4 shows the renewable energy that SANParks invested in during the period of this assessment (2015–2019). Kruger National Park had the largest share of renewables followed by AENP, CNP, and TKNP. However, other parks had installed solar plants prior to the assessment and others in the 2020 financial year, hence they are not included in
Table 4. Tankwa Karoo National Park (
Figure 8), MNP, and KNP as well as a few other parks had most solar panels installed in the 2020 financial year.
The estimated plant size for all of SANParks from the listed parks in
Table 4 is 2577 KW; through the projection, 15,462 kWh is pumped daily. This equates to an estimated 15 t CO
2e offset per day. This may suggest that overall, SANParks currently avoids 5475 tCO
2e through its renewable-based (
Table A3), of which 4380 tCO
2e belongs to KNP. For KNP, this total savings on emissions consisted of 2102 tCO
2e that was offset from electricity and the remaining 2222 tCO
2e was from fuel. Energy consumption has been fluctuating over the 5 year time period with a massive decline in the last year (
Table A3).
4. Discussion
Nature-based conservation management estates like many other protected areas have to play a role in supporting national GHG emissions reduction [
20] because they have been shown to be significant sources of C emissions [
32]. Although [
32] focused on forest losses in the protected areas in tropical countries compared to measuring operational footprint as done in this paper and others [
20,
29,
33], it was demonstrated that managing NBCM estates may lead to emissions. As recommended by the Intergovernmental Panel on Climate Change (IPCC), accounting for one’s emissions should be the first step towards understanding how one would contribute to organizational, national, and international commitments [
34]. The NBCM estates play a critical role in national carbon sinks that helps offset the GHG emissions [
35]. Hence, understanding the carbon footprint has been recognized as the priority first step. This paper aimed to demonstrate the total SANParks C emissions profile at the organization and individual park level using the GHG protocol for corporate accounting and reporting standard methodology. In addition, it aimed to show how national parks’ GHG emissions contribute to organizational, sectoral, and national GHG profile using SANParks estate as a case study [
33]. This work thereafter compared park level emission profiles and suggested alternative ways in which emissions may be reduced at the organizational and park level with evidence from many parts of the world. The paper was able to demonstrate different energy reduction pathways using energy scenarios and suggested the best-case scenarios for SANParks to achieve carbon neutrality by 2050. Lastly, the paper presented the emissions avoided by the installation of the renewable system within the organization. This study therefore shows that the approach has applicability to be scaled up from the park to national and thereafter global level for NBCM estates to increase transparency internationally.
4.1. SANParks’ Total Carbon Footprint and Contribution to the AFOLU Sector in South Africa
Accounting for NBCM estates’ GHG emissions has been gathering momentum over the last decade across the world. While many countries had reported their emission profile across the different sectors, the contribution of NBCMs in the AFOLU sector and nationally is often not mentioned. The findings showed that SANParks as an NBCM estate contributed on average 73,732 tCO
2e annually over the assessment period. On average, SANParks contribute 0.01% towards the country’s total emissions, which is dominated by the energy and transport sector. The latter two are the main Scope 1 and Scope 2 sources for many countries and often infiltrate other sectors including the AFOLU. However, the largest emissions from SANParks came from energy-related sources that were purchased electricity under Scope 2 and fuel usage for stationary combustion under Scope 1. A similar phenomenon was observed in the Australian National Park [
35]. For Canada, the US, Taiwan, and Australian and European parks, transport was shown to be very high in emissions. This was because most of the published assessments focused on tourism rather than only the operational/organizational [
23,
36,
37,
38,
39,
40]. While it is acknowledged that the tourism focus was important, this work focused on the emissions contributed by managing SANParks estate, hence the study excluded tourist emissions. When the focus was only on park operations, the trend for most parks observed in this paper was similar to many of the US parks [
20].
South Africa contributes over 1% to the global emissions profile [
14]. Being part of the SA’s AFOLU sector, SANParks contributed 0.14% to 7% of the total sector emissions in South Africa. However, these contributions are expected to be lower when accurate carbon sink data become available to offset emissions. It is recommended that an assessment of all the national parks globally be completed to understand the role that NBCM plays in GHG emissions in the AFOLU sector. Other studies using a different methodology (remote sensing) show that land-use changes such as those driven by fire had a major effect on GHG emissions of the NBCM sector [
32]. For example, fires in Australia and Brazil resulted in a massive increase in emissions for those countries [
40]. It would be expected that KNP, GRNP, TMNP, and other fire-prone parks would experience a similar trajectory and should also be accounted for in the near future.
In this assessment, the analysis has demonstrated the emissions profile of SANParks and its 20 national parks including the Kimberly office according to the GHG Protocol. This work herein presents how SANParks reduced the emissions over the assessment period and plan to do so in the future.
4.2. The Contribution of Each Scope to the Total SANParks Emissions
The results illustrate that Scope 1 and 2 emissions for SANParks accounted for 92% of its total emissions. This profile was similar to Kakadu National Park, Mt. Rainier National Park [
36], and other nature-based conservation management wherein energy under Scope 2 and stationary combustion under Scope 1 were the top contributors. Similarly, Acadia National Park’s carbon footprint report of 2019 in the US presented that their highest emissions resulted from Scope 1 and Scope 2 emissions [
20]. For Scope 3, waste was the main emission source at 4% contribution to the total SANParks emission and is similar to the national environmental sector emissions [
14]. In many NBCMs, mobility-related emissions were always second to energy contribution. When grouping all the transport-related emission sources from the different scopes, transport emissions surpassed waste emissions. When looking further at the emissions from SANParks, according to the results, electricity consumption is the largest contributor to SANParks’ GHG emissions. It accounts for 55% of SANParks’ overall GHG emissions. This is consistent with other studies where electricity consumption was shown to be the top contributor to organizational carbon footprint [
20]. Organizations are expected at a minimum to reduce Scope 1 and 2 by 35% and 23% from Scope 3 in the year 2025 [
22,
41,
42]. This 35% reduction by 2025 equates to a reduction of 23,825 tCO
2e from the total Scope 1 and 2 emissions (68,072 tCO
2e) and a reduction of 1302 tCO
2e from Scope 3 (5661 tCO
2e).
South African National Parks is a state-owned parastatal under the South African Department of Fisheries, Forestry, and Environment. The per capita emissions for energy in SANParks estate is similar to the Department of Fisheries, Forestry, and Environment [
4,
14] emissions of 7.33 tCO
2e between 2010 and 2013. Overall, SANParks per capita for Scopes 1 and 3 is comparatively lower than the DFFE emission (8.72 and 3.61 tCO
2e) during the period mentioned here. However, major interventions have been completed by the DFFE and may have arrested much of the emissions in the different scopes, especially priority Scope 1 and 2 according to GHG protocol recommendations. To curb Scope 1 and 2 emissions, SANParks should invest more in transforming from coal-based electricity and fuel combustion for energy generation to renewable energy sources such as installing solar panels in all park facilities especially in rest- and tented-camps. However, KNP have shown a decline in energy-related emissions due to reduction measures implemented by the park, including the introduction of renewable energy and replacing old energy-intensive appliances with greener technologies. These carbon footprint results were used when developing a draft SANParks Green Energy Strategy which combines reducing dependence of fossil fuels and increasing renewable sources, for example, the combination of energy efficiency and renewable energy.
4.3. The Contribution of Each Park to the Total SANParks Emissions
This paper demonstrated that a holistic picture of C emissions across individual parks was important to be able to target or speed up interventions for the most emitting parks or sources for efficient emission reduction at the organizational level. From the individual parks, KNP was shown to be the top contributing park followed by GRNP, TMNP, AENP, GGHNP, and KGNP. Relative to the other national park estates, some individual park emissions might be higher. For example, according to the US National Park Service (NPS), on average, a climate-friendly park should emit 935 tCO
2e yearly from its park operations despite the range in size and tourism numbers [
20,
22]. On average, 13 of the 21 national parks were below that number. However, the parks that contributed the most emissions were above that number. Across SANParks’ estate, following the process used by NPS to define a climate-friendly park, with an outlier (KNP) retained, on average, a climate-friendly park would equate to 1028 tCO
2e. KNP, GRNP, TMNP, AENP, GGHNP, AFNP, GNP, and KGNP were above that number. The results confirmed that these parks contributed 76% to the total SANParks emissions and therefore should be targeted for mass reduction of the organization. The NPS seems to have a similar system in place, all these should be recorded online to aid in understanding the contribution of NBCM within the AFOLU sectors in most countries. However, for transparency, NBCM estates should implement a tracking system of GHG at a park and organizational level to be available for reporting in the global network of protected areas.
This work also demonstrated that different parks varied in emission intensity and per capita. About 40% of the parks accounted for high emission intensity. For those parks, emission intensity per hectare of the park to building size ratio was high. The outlier was GNP which had the least amount of land and is mostly occupied by staff buildings and parking areas. The office park also has the highest number of employees per hectare. Although KNP had the largest amount of land, the emission intensity remained high due to a large amount of infrastructure throughout the park. Kruger National Park, TMNP, and GRNP had the most total emissions, high emission intensity, and high emissions per capita.
Six parks (29%) were at a national per capita rate for 2019 (ranged between 7.5 and 10 tCO
2e per person) [
43], while 5 parks (28%) were below that rate and 8 parks were between 11 and 15 tCO
2e per employee. Three parks with the highest per capita included AFNP (24 tCO
2e per employee), KNP (21 tCO
2e per employee), and KRNP (16 tCO
2e per employee). The Global Carbon Project showed that there can be large differences in per capita emissions, even between countries with similar standards of living. This paper supported this view to be true in terms of variations on t of CO
2 per capita recorded, wherein someparks had more tons of CO
2 per capita than others. In addition some of the remote parks with low staff numbers could be higher than a park with more number of people and infrastructure. It is thus important to reduce both emission intensity and per capita targeted based on park-specific findings. Improving emissions reduction efficiency and optimization especially for energy, waste, and water will go a long way at the park level and ultimately at the NBCM estate level.
4.4. Relationships between Various Variables
According to the results, total SANParks emission showed a highly significant relationships with Scope 2, followed by number of employees and building size, in that order. The focus on Scope 2 is therefore warranted in energy emissions, especially since it is linked to building size and number of employees. This implies that the greater the number of employees and infrastructure, the higher the energy emissions and contribution towards the total SANParks’ emissions. It is thus critical despite higher infrastructure and number of employees that reduction measures are put in place. However, the size of the park was deemed not an important contributor towards the total SANParks emissions. For example, GNP is the smallest park in size, yet, its emissions were higher than some of the parks that are bigger in size as compared to GNP. This meant that the larger and more infrastructure, the more the total SANParks’ emission instead of park size. This might be a novel finding for NBCMs although evidence exists for the building sector. According to the UNEP report on Buildings and Construction, buildings remain a major area that lacks specific mitigation policies, despite its importance to global CO
2 emissions [
44]. The report highlighted that direct building CO
2 emissions need to be halved by 2030 to get on track for net zero carbon building stock by 2050.
For Scope 1 and 3, although they had a significant relationship to the total SANParks emissions, the contribution was minimal compared to the other three mentioned above. A relationship between total SANParks emissions and Scope 1 could be associated with more driving within and outside the parks and the fact that majority of bigger parks have more remote camps that use generators for energy. However, in most of the parks the variation in waste, water, and staff-associated travel did not contribute significantly to the total SANParks emissions.
A relationship between park size and Scope 1 emissions relates to more driving of SANParks vehicles within the parks (from camps to camps), and long distances are traveled for enforcement and protection of the biodiversity. In addition, this relationship may also be due to more stationary fuel combustion used either primarily or alternatively in the camps for energy generation especially in larger parks.
4.5. Future Energy Reduction
The business as usual Lion scenario showed an increase of 29% in energy by 2050. These track the business as usual projections for South Africa and the globe [
45]. A future with more effects from climate change on biodiversity and poor people living near protected areas will be envisaged. This is a future that NBCMs may not survive under. The Orb-web Spider, Leopard Toad, Dolphin, and Peregrine Falcon energy scenarios showed a decline of 23%, 48%, 94%, and close to 100%, respectively. The analysis shows that the Orb-web Spider scenario with between 80% to 60% dependence on purchased ESKOM coal-based electricity will not get NBCMs to carbon neutrality. For other parks globally, continuing business as usual and tracking the national and global future trajectories is not recommended. The Leopard Toad scenario will improve the energy profile within the organization by reducing almost 50% coal-based energy dependence, which although decent, remains insufficient for a net-zero future. This highlights the fact that scenario planning for NBCMs should be in line with national future energy emission reduction trajectories and best-case scenario roadmaps. This is because most NBCMs depend on the national energy grid suppliers. In the national content of SANParks, their commitment seems to follow the moderate future energy scenario of the national DoE [
46]. The Dolphin and Peregrine Falcon scenarios are seen to be more efficient on CO
2 emission reduction for energy. This study recommended that national parks belonging to SANParks with high energy emissions (including KNP, GRNP, TMNP, GGHNP, and AENP) should follow the Dolphin scenario which is similar to the best-case scenarios for the DoE. This work suggested that the parks with moderate to lower emissions may follow the Leopard Toad scenario. The NBCMs may use this multi-pronged approach targeting individual parks with varied contributions towards the whole estate. The carbon footprint and future energy reduction scenarios should be supported by energy optimization, monitoring, and evaluation that links the whole energy mix of the NBCMs. Although not presented here, the best-case scenarios from the SANParks estate demonstrate great financial savings in the long-term if tracking the proposed Dolphin scenario while the Lion scenario (BAU) shows a substantial increase in financial costs by 2050 [
29]. The current SANParks commitment (Leopard Toad scenario) does not get the organization to be carbon neutral and yields moderate savings in costs by 2050.
4.6. Measures to Reduce Emissions from Park to Organizational Level
SANParks must continue to reduce the amount of GHG emissions that come from electricity by shifting towards renewable energy sources. This may be done by transforming from purchased electricity to renewable energy sources such as installing solar panels in all park facilities, especially in rest and tented camps. Solar energy as a supplement to purchased electricity in park facilities is an advantageous strategy to reduce 55% energy-related GHG emissions for SANParks. For SANParks to achieve its target of reducing 2% year-on-year on energy emissions, this switch should be a priority. The renewable energy portfolio must continue growing as evidenced in this paper, especially for the parks with the biggest emissions under Scope 1 and 2. Kruger National Park has done reasonably well in reducing the emissions; however, similar to other parks, the switch from coal-based Eskom electricity remains low. The observed pattern in renewable energy switches has been from energy generated by the use of diesel generators in remote areas. When looking at the 2019 Integrated Resources Plan of the Department of Energy in South Africa, the current commitment shows a dependence of 80% coal-based energy which still remains very high.
While the increase in the number of visitors may lead to an increase in GHG emissions related to electricity consumption, in KNP, positives have been observed despite the increase in occupancy over the last few years. According to [
47], energy consumption went down due to measures implemented by the park including the introduction of renewable energy and replacing old energy-intensive appliances with greener technologies. The report in [
46] showed that there was a 4% year-on-year decline in electricity emissions from KNP especially for the 2017/2018 and 2018/2019 financial years. It was assumed that a decline might be related to the implementation of the solar system in Skukuza, Lower Sabie, and Crocodile Bridge gate. This shows support for transitioning because it was more than the 2% year-on-year commitment by the park in the SANParks Strategic Implementation Plan of 2016/17 until 2020. In the report published by the authors of this paper in 2020, an 8% year-on-year reduction was proposed to achieve energy net emissions by 2050. A more efficient data collection online system was also proposed to enable managers at the organizational and national levels to track progress in GHGs reduction promptly. The analysis showed that parks that moved from monthly billed electricity to pre-paid meters were successful in reducing their energy consumption.
For Scope 1 emissions to be adequately reduced, the current program implemented across the NBCM estates to curb traveling kilometers by staff and more importantly transforming from diesel generators to renewable energy as evidenced in KNP and TKNP will suffice. An emission reduction profile at the park level was also valuable towards contributing to the SANParks reduction profile over the next 20 to 30 years. When used efficiently (cameras off), the introduction of online meetings via Zoom, Teams, Google Meet, and Skype could potentially reduce travel between the parks which may reduce emissions related to travel and save lives in a post-COVID-19 world [
29,
48]. Additionally, the use of technology like drones for law enforcement and monitoring for research could also curb the emissions under this scope in NBCM estates in the near future.
Scope 3 emissions reduction, specifically reducing waste, would entail a life-cycle assessment to enact a reduce, re-use, and recycle approach across the parks challenged by large volumes of waste. Biogas energy production for waste, although difficult to implement near national parks due to environmental legislation, could also be an option for these parks, thereby creating jobs for communities closest to the parks. Lessons learned from successful programs of waste reduction implementation in other cities and countries might add value.
Lastly, science-based targets have been proposed for other sectors (i.e., Building), with the biodiversity sector in the development phase. Pledging under this international initiative and others nationally should keep NBCMs improving their GHGs emissions reduction profile under all three Scopes. Having all these systems set up in an online platform will encourage more NBCM estates globally to contribute towards national and global emission reduction targets.
5. Conclusions
The paper clearly showed the role that NBCMs estates could play in accounting for national to international GHGs emission profile and reduction targets using SANParks estate as a case study. This paper was able to estimate the SANParks C emissions profile at the organization and individual park level, and therefore its contribution at national to international level, as well as to the AFOLU sector. Developing GHGs emission profiles in terms of Scopes and sources was shown to be valuable at the individual park level to organizational and remains an essential avenue towards reducing GHGs in NBCMs. Emissions varied across the different parks in terms of the actual total emissions, emission intensity, and emissions per capita. Promoting green and smart building management will be essential across the entire NBCMs estate based on the strong relationship shown between total SANParks emissions with building size and associated Scope 2 emissions. The study highlighted a need for a whole estate review that helps with prioritizing emissions reduction and interventions at that organizational strategic level. It showed that directing funding into interventions that yield minimum returns in terms of emission reduction can be avoided by painting a holistic picture of the entire NBCMs estate. For example, it enables choosing an appropriate future emissions reduction scenario per park. Targeting parks that tick all boxes in terms of the latter would enable the NBCM estate to focus on reducing their carbon footprint. The paper also demonstrated that purchased electricity, stationary combustion, and waste are responsible for the most emissions. Alternative strategies suggested in the literature to reduce emissions highlighted in this study include a shift from predominantly fossil fuel to renewable energy, energy efficiency and optimization, and technological advancements supported by transparent tracking of emission in all Scopes and sources. This study suggests that this approach may be promoted in NBCMs estates across the globe. Finally, the carbon footprint assessment of SANParks has been shown to be similar to other NBCMs despite slight variation compared to the very limited academic literature on the topic in NBCMs. More research and online platforms to enable a global effort to demonstrate the contribution of NBCMs in the reduction of GHGs emissions globally is advocated.
Using international standards and methodologies to track whether individual contribution by NBCM estates would lead to a 2 degree or 1.5 degree world in the future will be essential as demonstrated by the SBTs targets. Scenario planning using national and organizational derived future energy system trajectories was a fruitful exercise for NBCMs emission reduction. Based on the results of this assessment at the organization and individual park level, it can be concluded that SANParks should consider an ambitious target of 8% year-on-year reduction to achieve carbon neutrality by 2050 and also the 1.5 degree future based on its emissions profile.


