Perceived Economic Value of Ecosystem Services in the US Rio Grande Basin
Abstract
1. Introduction
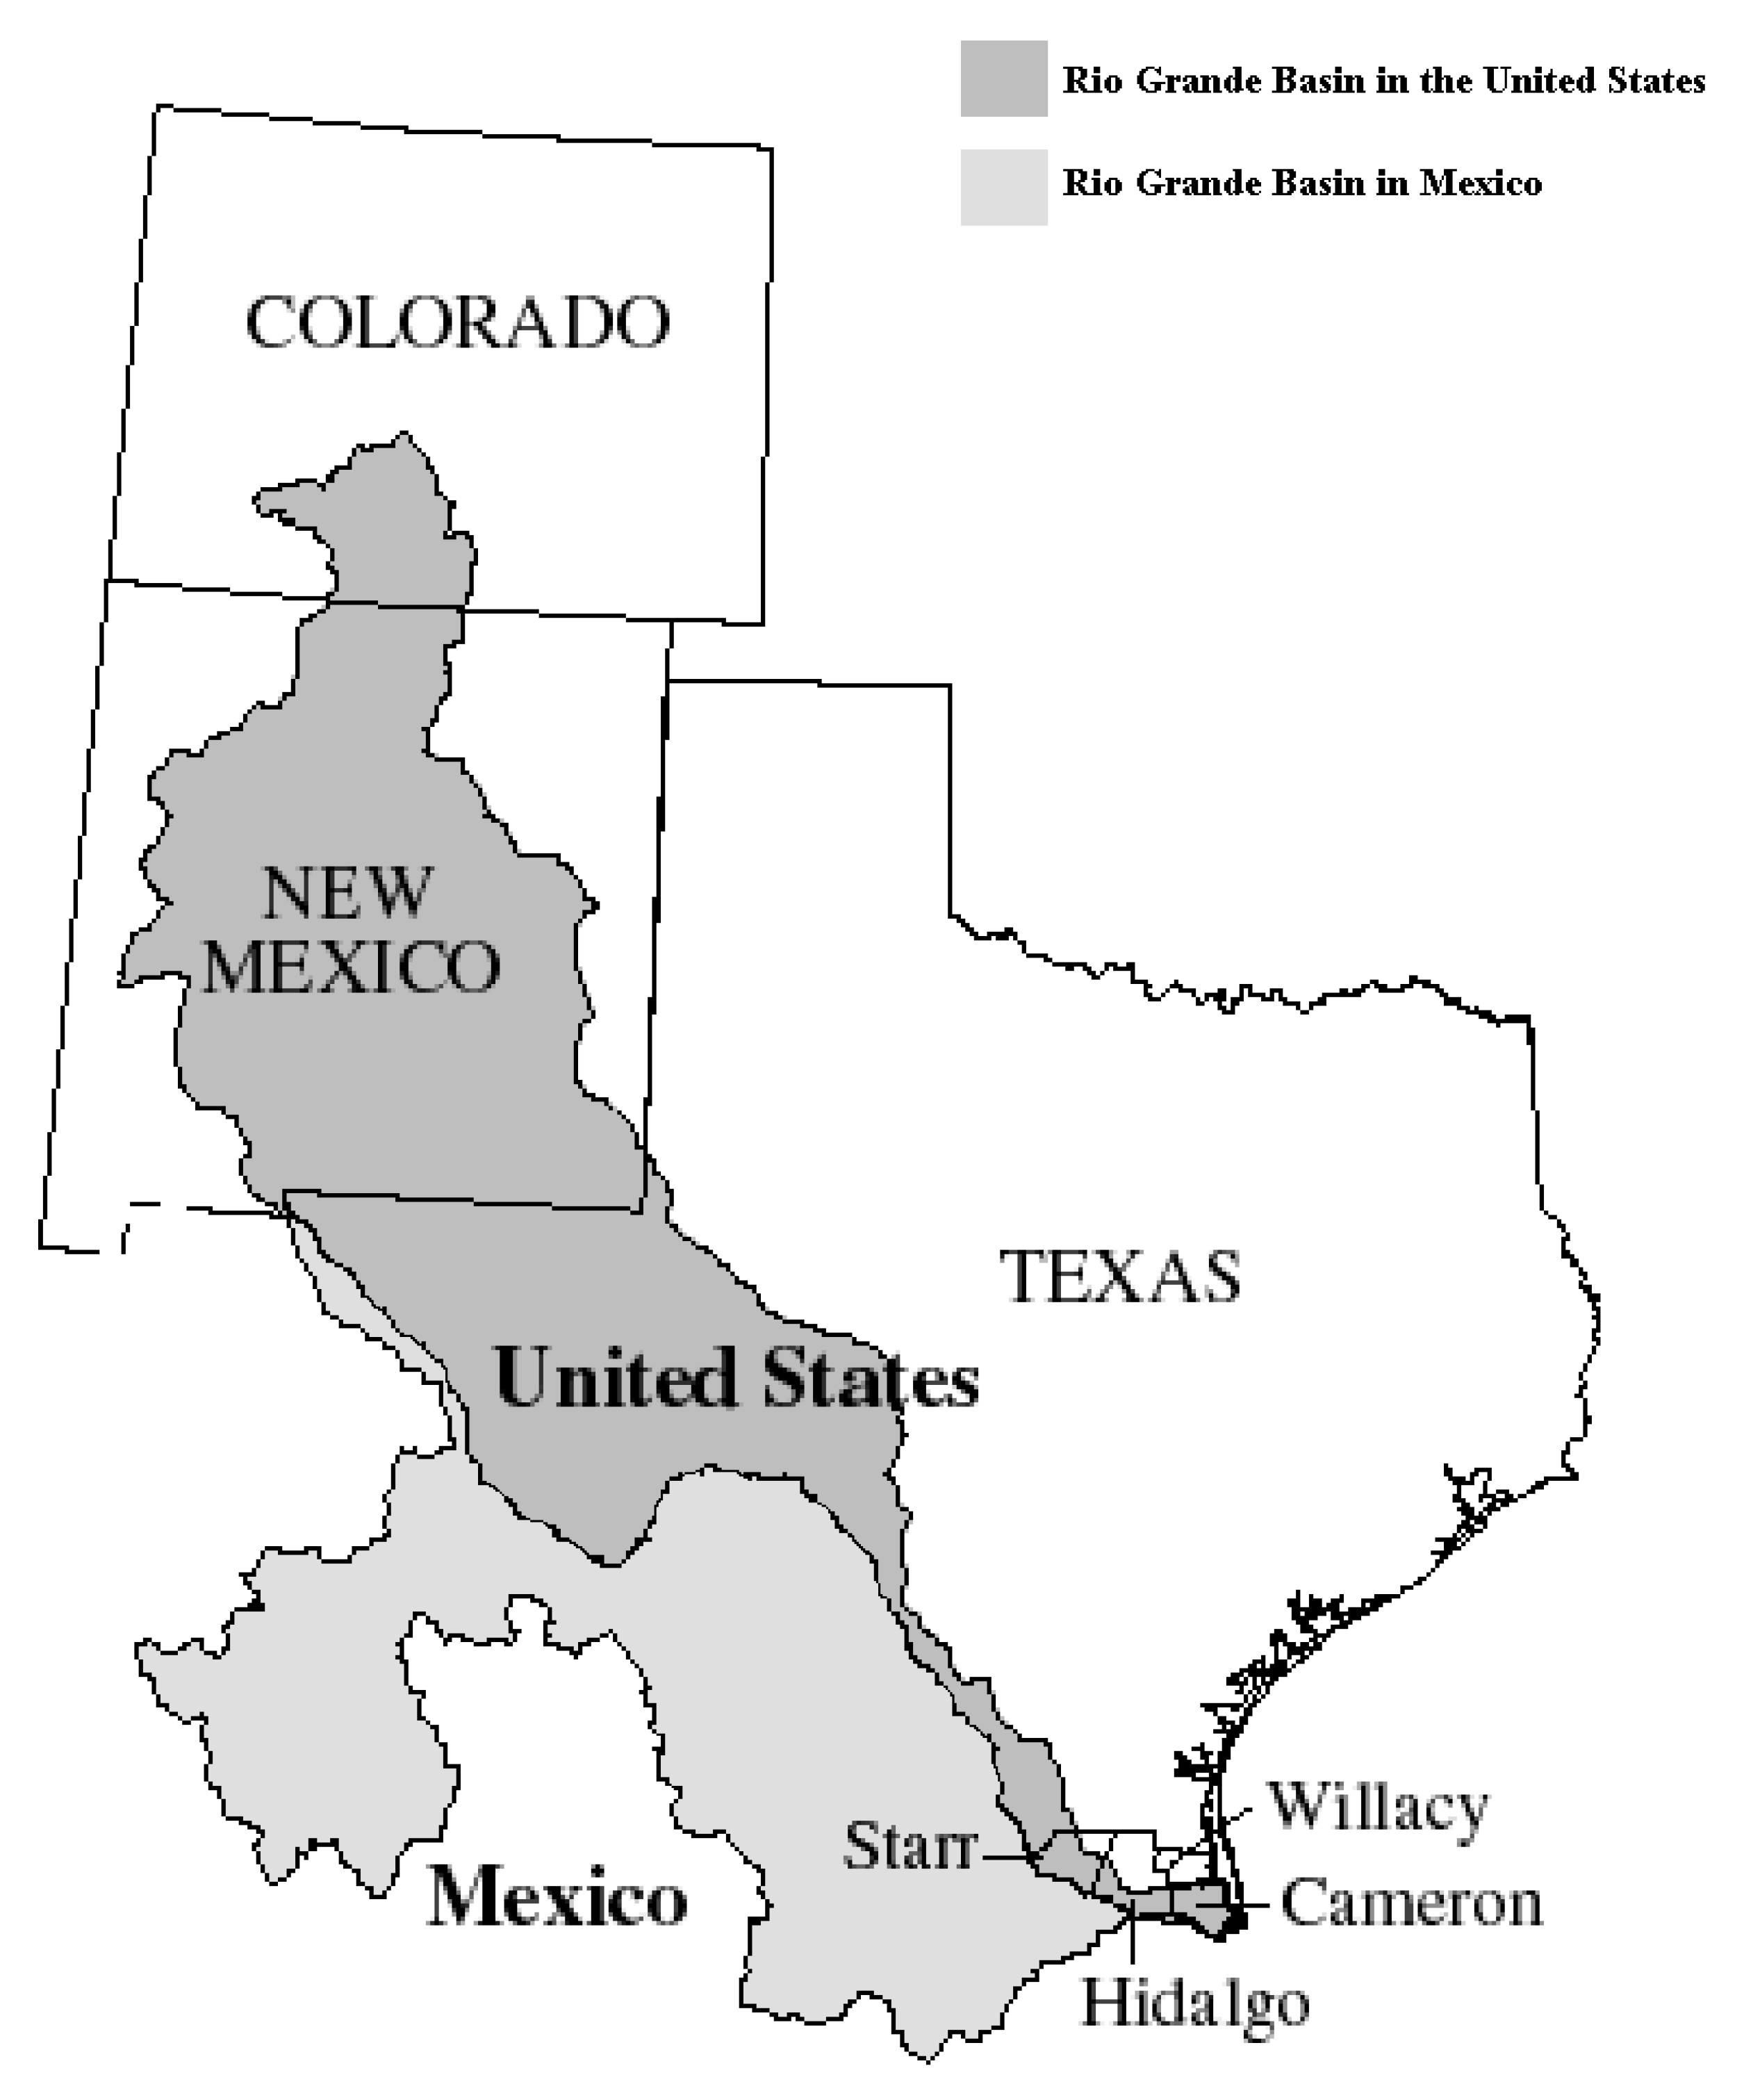
2. Study Area
3. Methods
3.1. Survey Design
3.2. Model Specification
4. Results
4.1. Descriptive Statistics
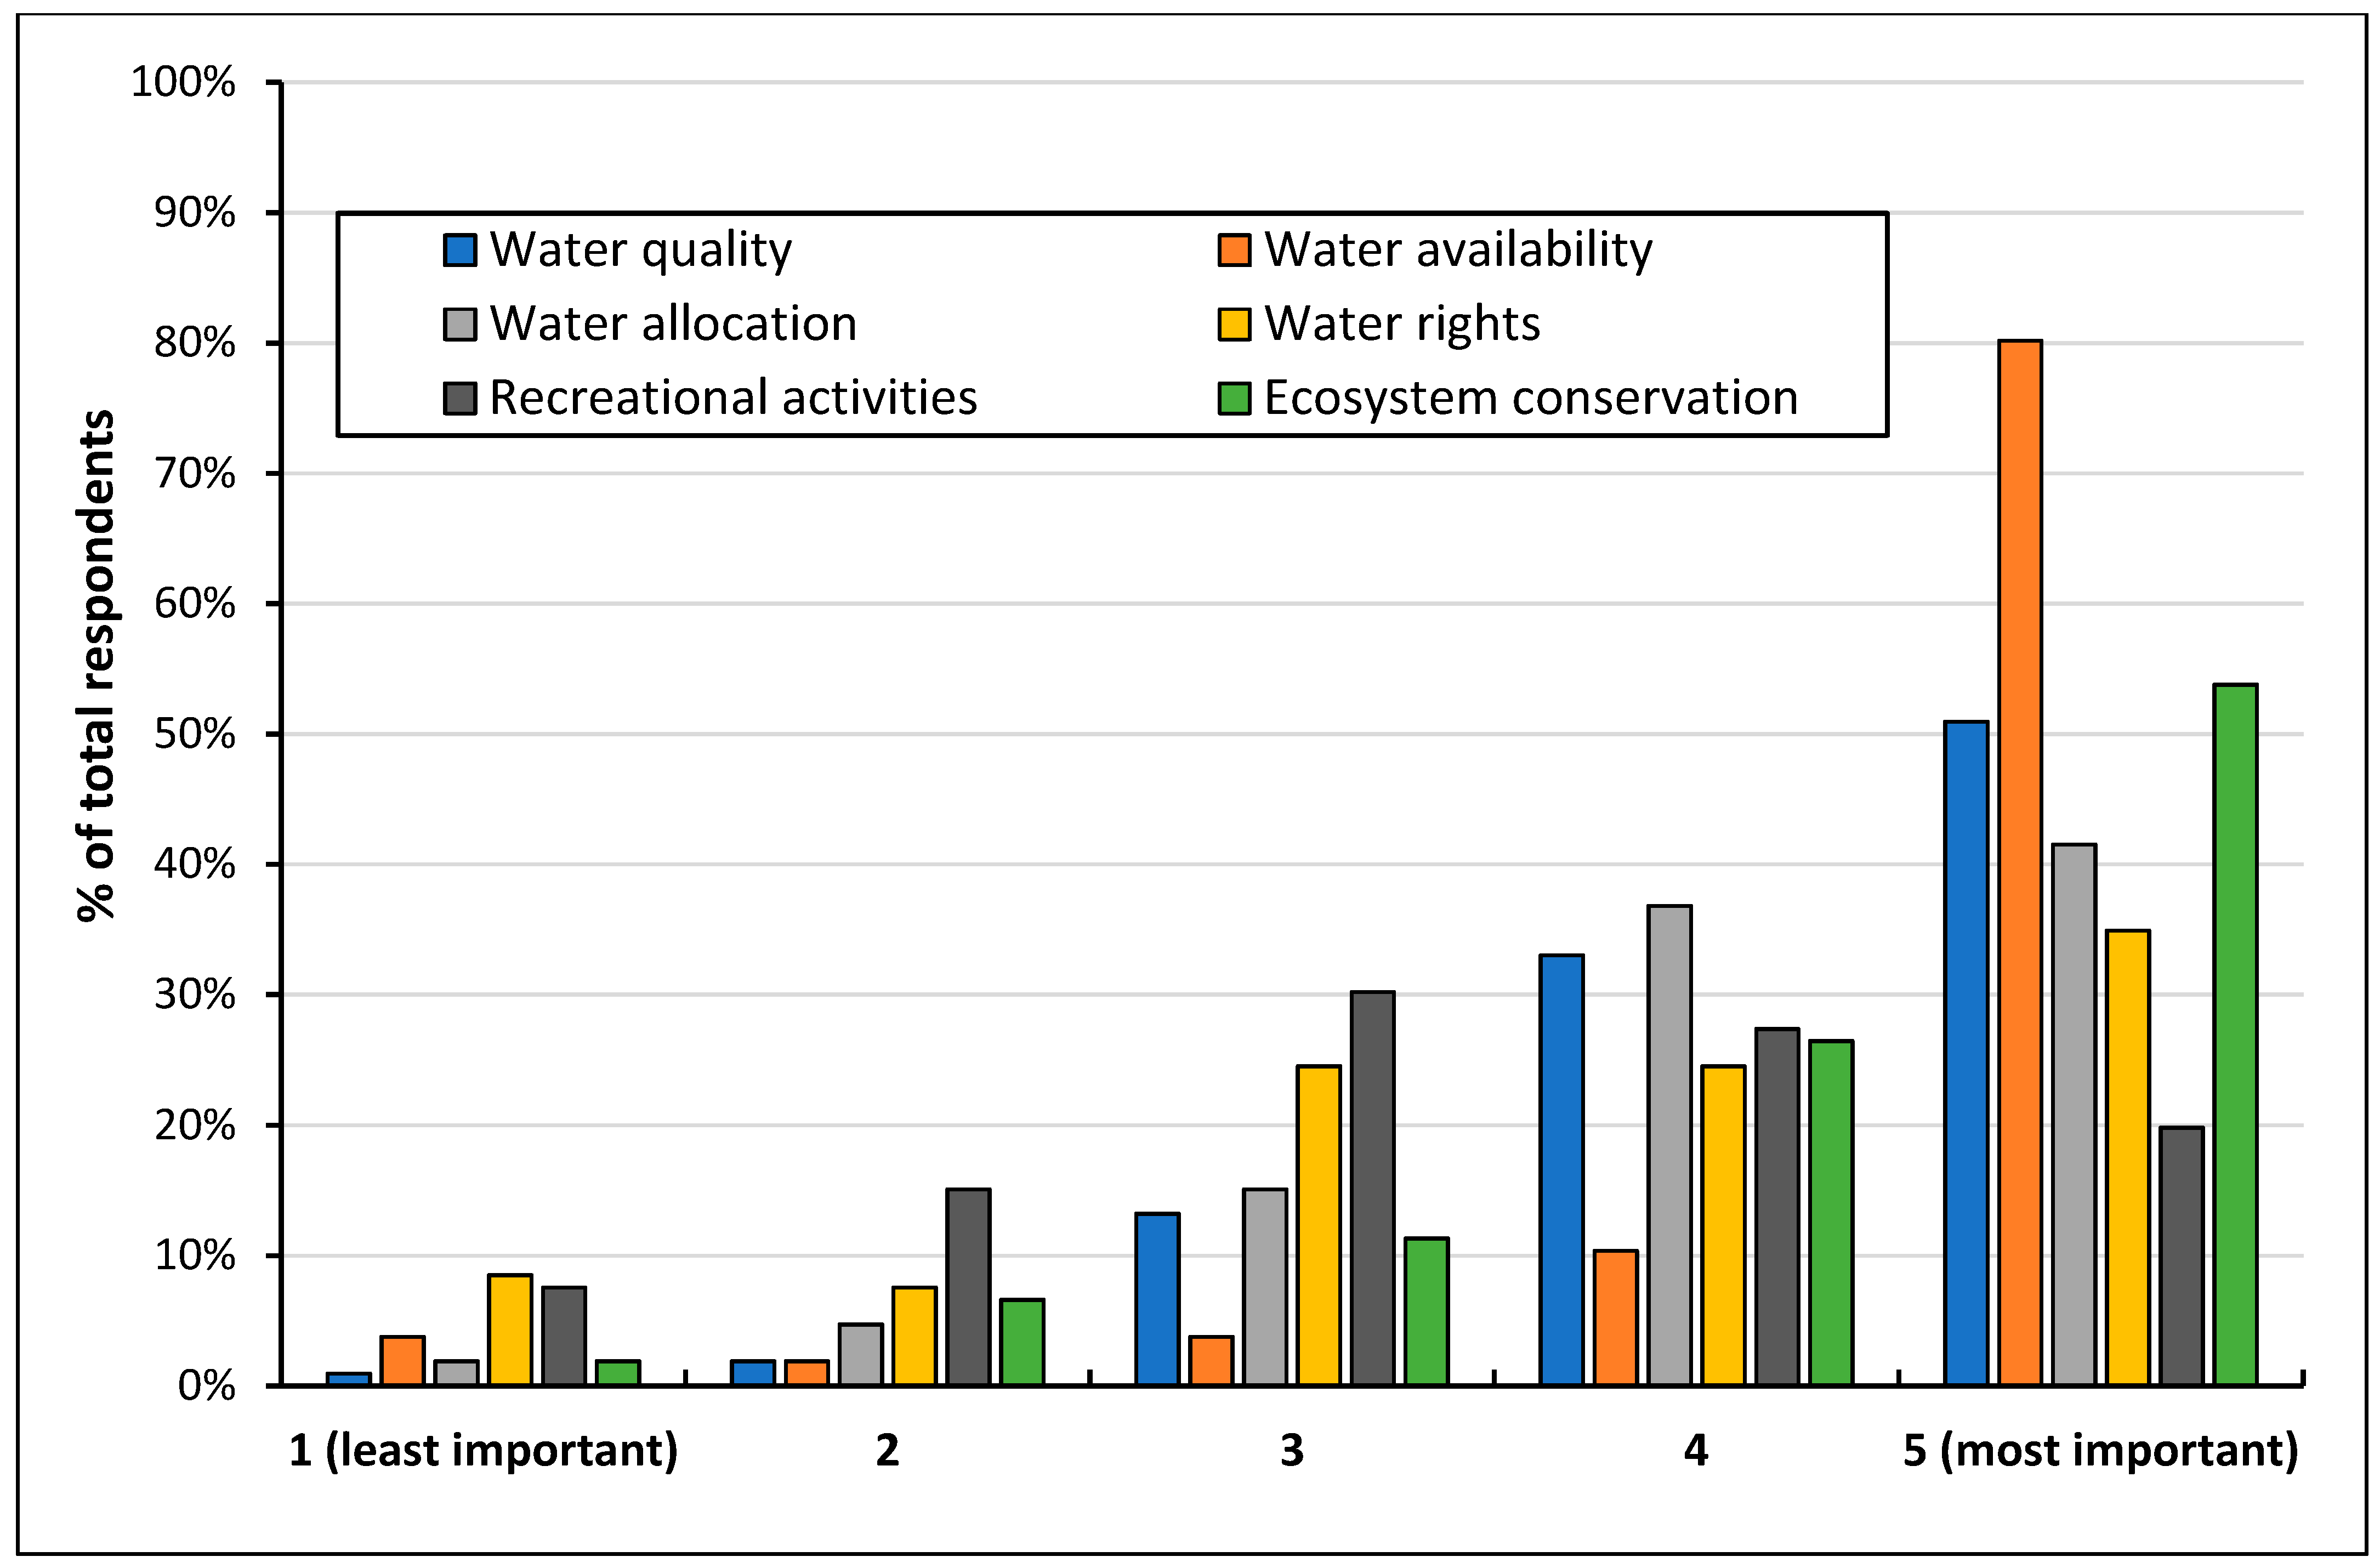
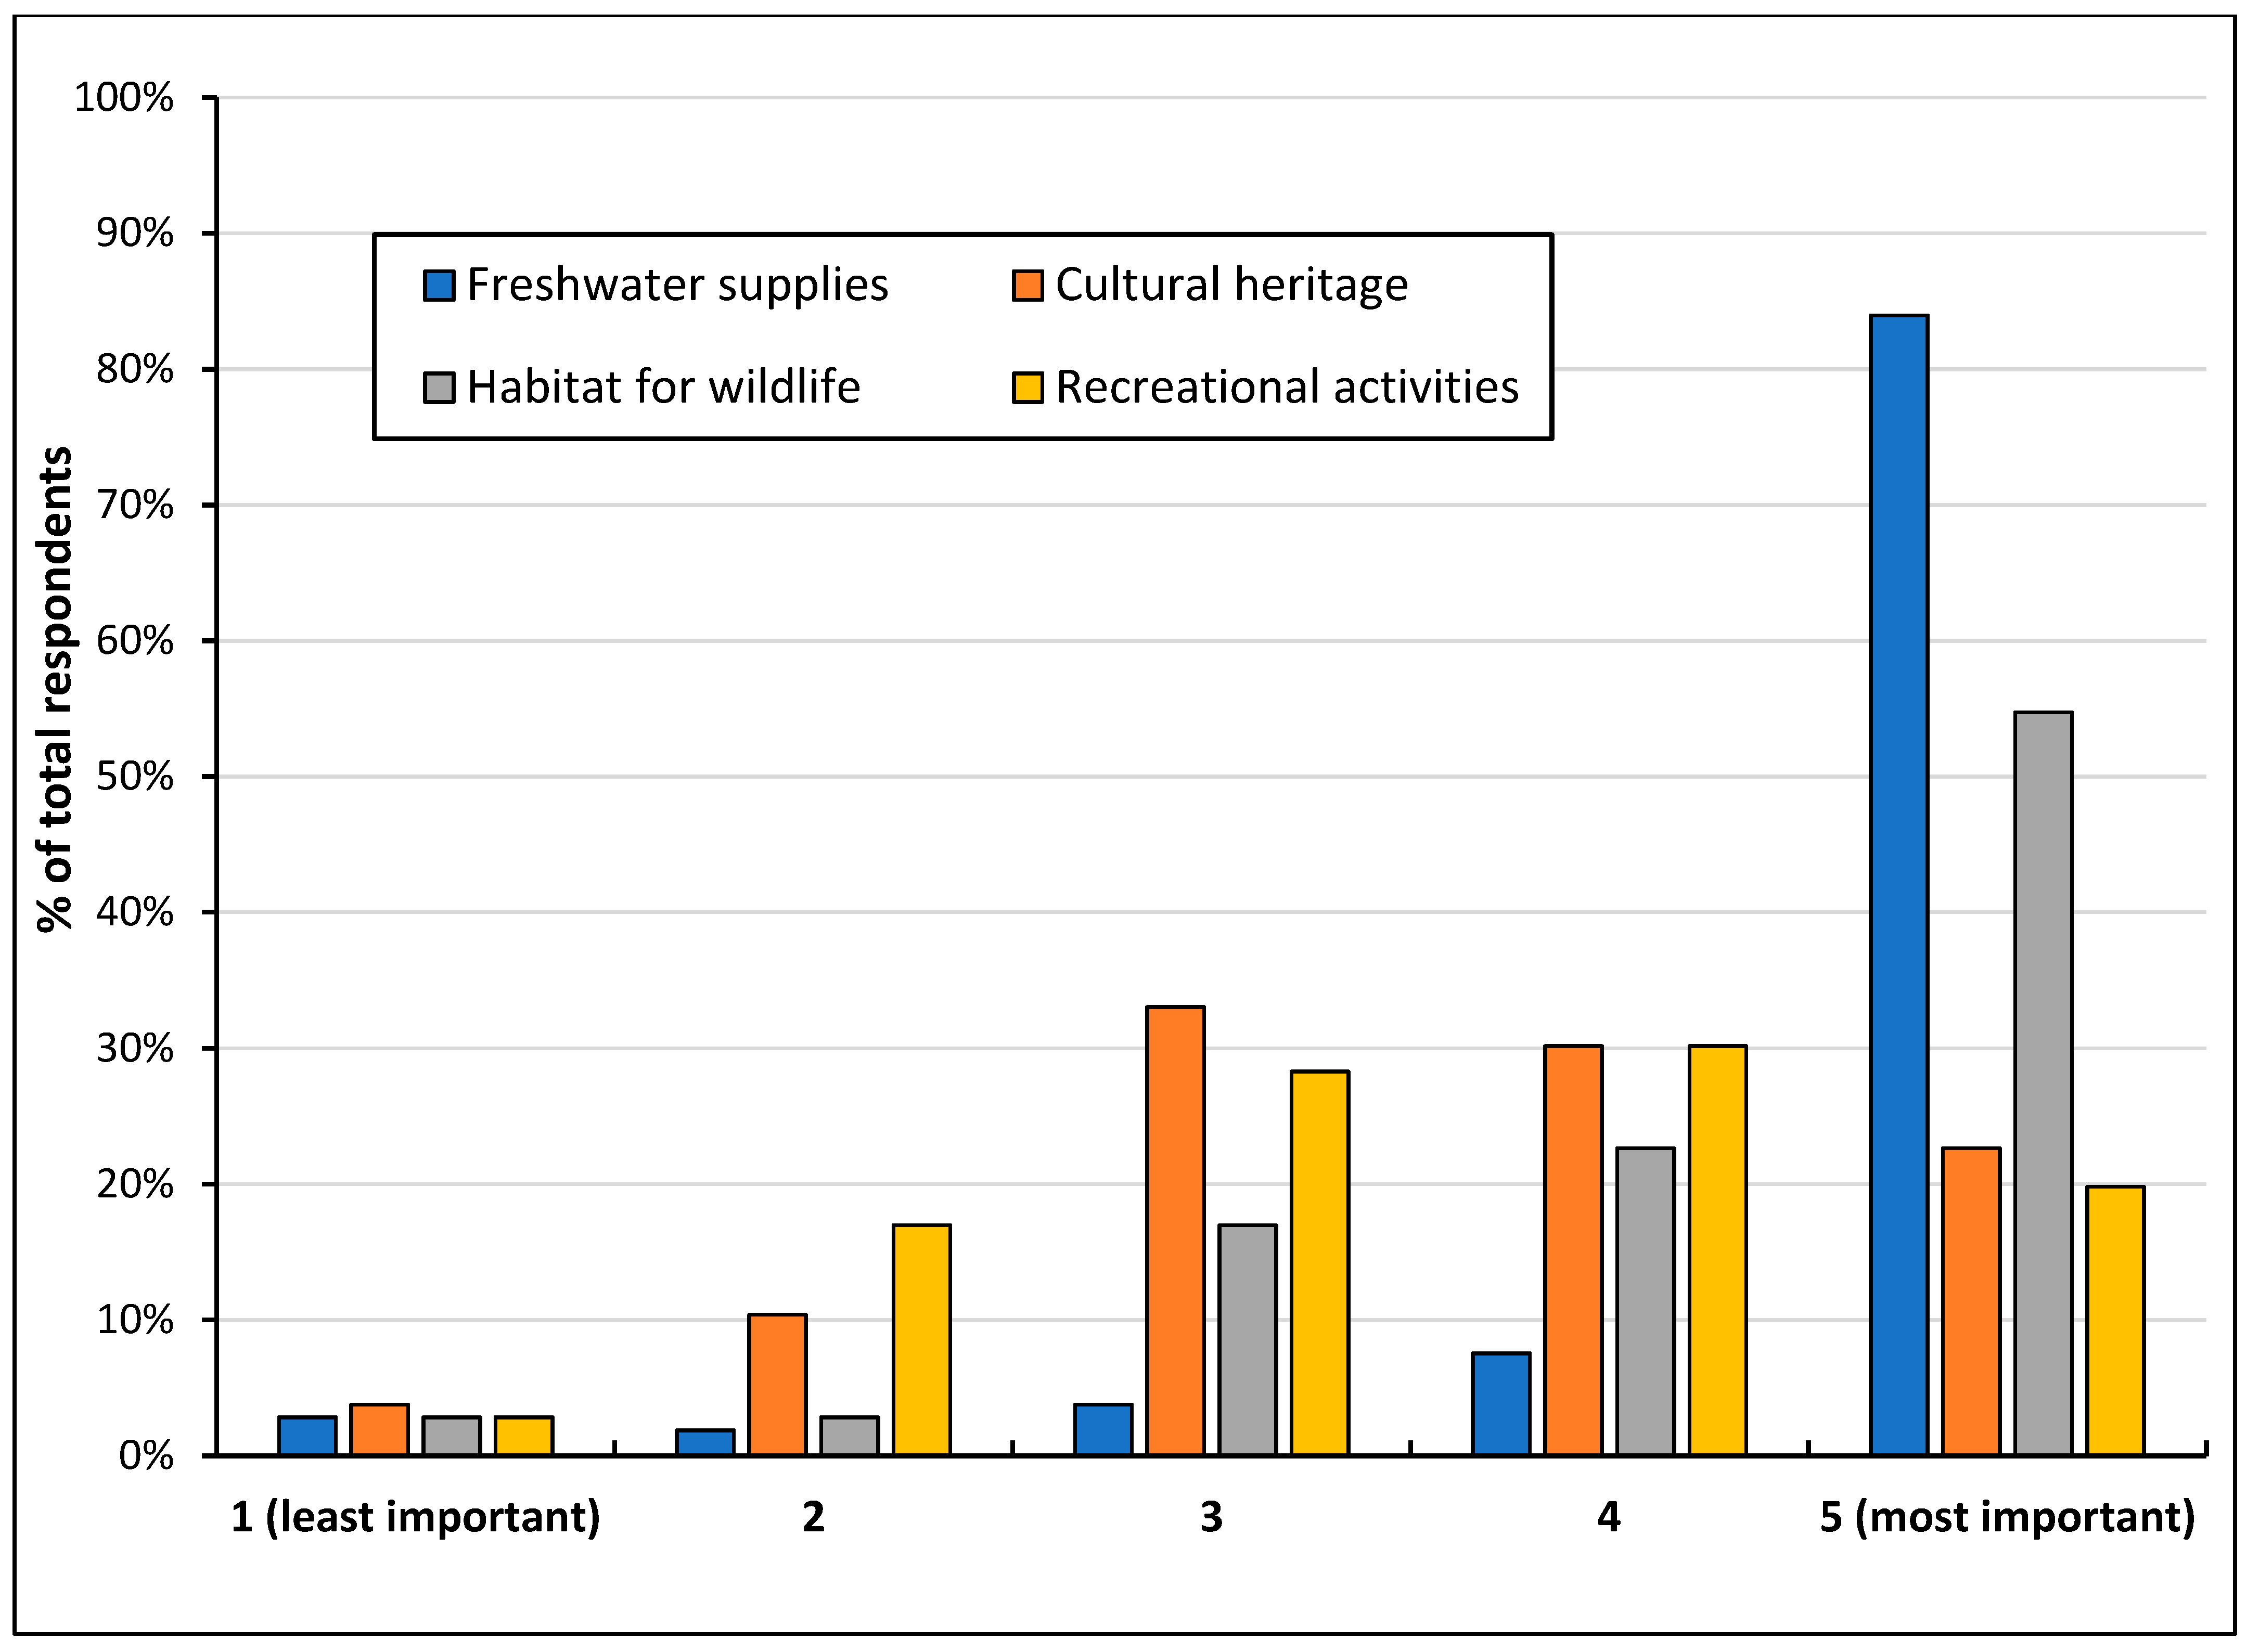
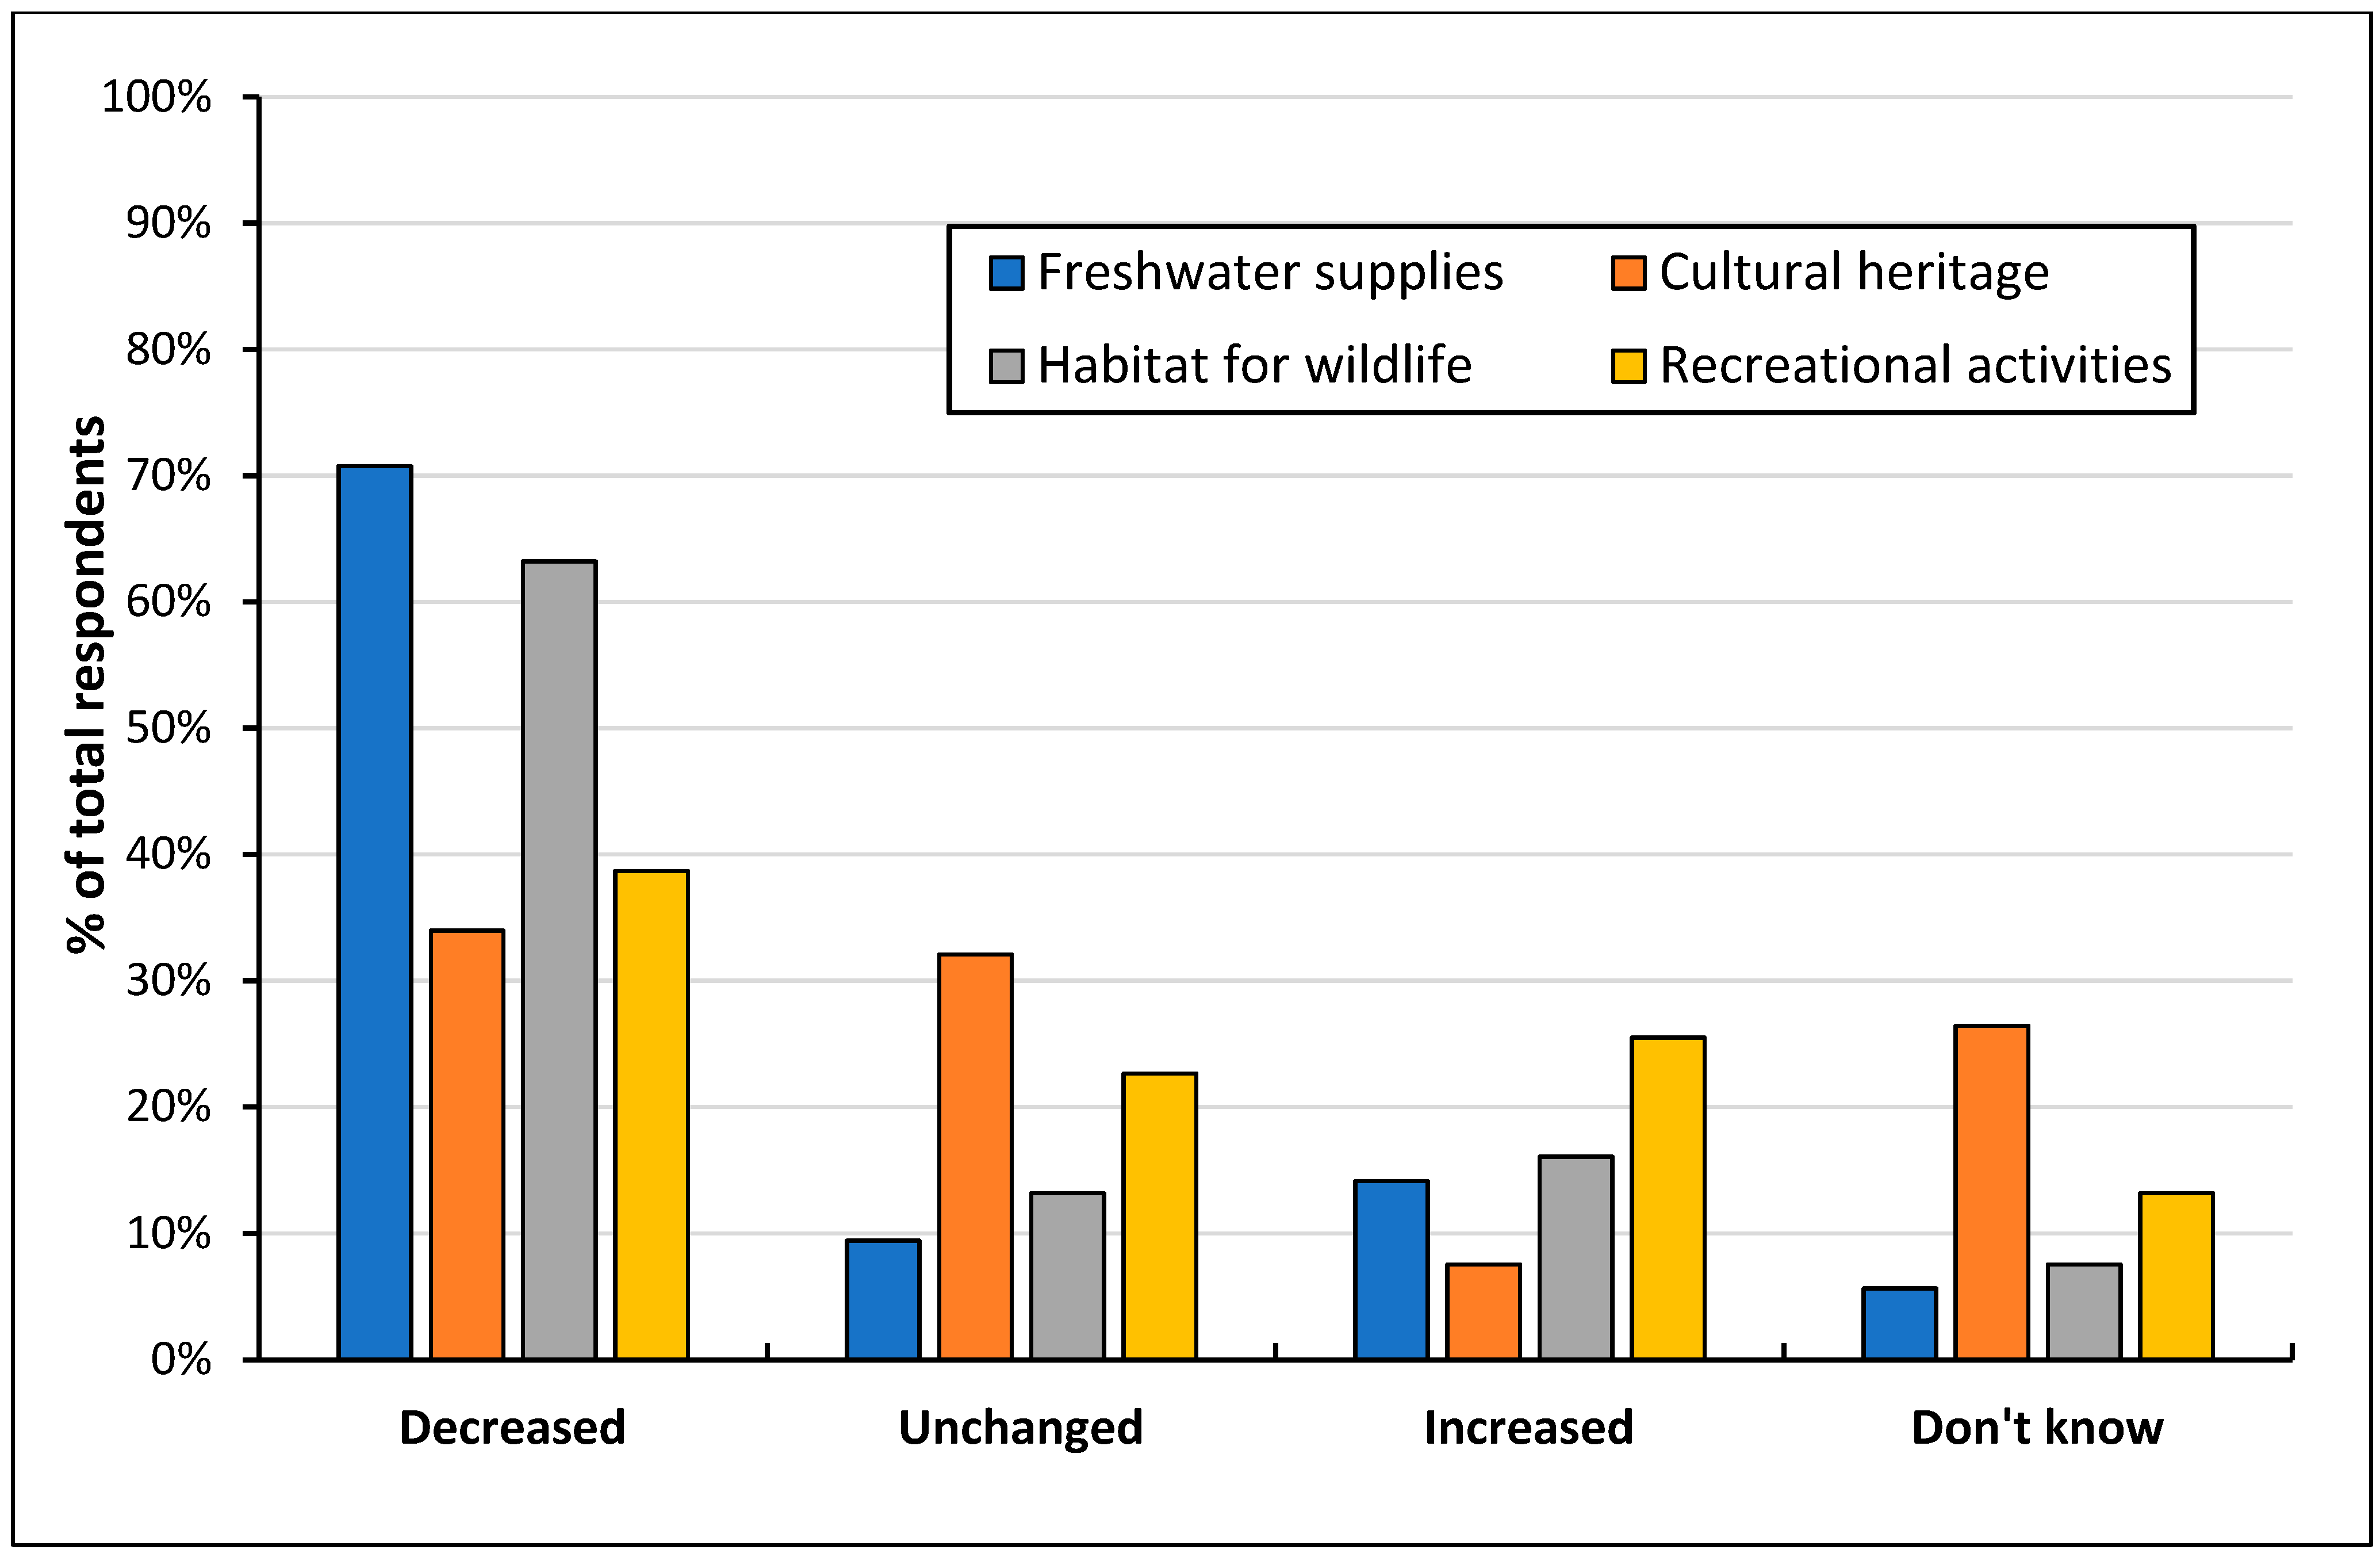
4.2. Perceptions about Water Issues and Ecosystem Services in the US Rio Grande Basin
4.3. Factors Affecting Willingness-to-Pay in the Rio Grande Basin
- (1)
- Regarding the WTP for all ecosystem services combined, the income level and residence of respondents in the region are positively related to the amount of money the respondents would be willing to pay. Accordingly, the higher income level would result in the higher WTP. People living in the basin area were more likely to favor a higher level of financial support for ecosystem services.
- (2)
- In regard to the payments for freshwater supplies, whether the respondent is a resident has a positive impact on the mean WTP, whereas having parents or grandparents living in the basin region has opposite effects.
- (3)
- In regard to cultural heritage, older respondents indicated a lower WTP for maintenance of this ecosystem service. The respondents who gave more on the importance of cultural heritage provided by the basin were more willing to increase their WTP for maintaining this service.
- (4)
- In regard to habitat for wildlife, the model results show that younger respondents and residents of the basin region would be willing to pay more for conserving habitat for wildlife than the rest of the respondents.
- (5)
- In regard to maintaining recreational activities, the same two variables were found to be statistically significant as in the model of culture heritage, which could indicate that recreational activities are viewed similarly as the benefits provided by culture heritage. Younger people and people who have knowledge about the importance of recreational activities were more likely to donate more money.
4.4. Willingness-to-Pay for Preserving Ecosystem Services in the Rio Grande Basin
5. Discussion
6. Conclusions
Author Contributions
Funding
Institutional Review Board Statement
Informed Consent Statement
Data Availability Statement
Acknowledgments
Conflicts of Interest
References
- Millennium Ecosystem Assessment. Ecosystems and Human Well-Being: Synthesis; Island Press: Washington, DC, USA, 2005. [Google Scholar]
- Castro, A.J.; Vaughn, C.C.; García-Llorente, M.; Julian, J.P.; Atkinson, C.L. Willingness to Pay for Ecosystem Services among Stakeholder Groups in a South-Central U.S. Watershed with Regional Conflict. J. Water Resour. Plan. Manag. 2016, 142, 05016006. [Google Scholar] [CrossRef]
- Spash, C.L.; Urama, K.; Burton, R.; Kenyon, W.; Shannon, P.; Hill, G. Motives behind Willingness to Pay for Improving Biodiversity in a Water Ecosystem: Economics, Ethics and Social Psychology. Ecol. Econ. 2009, 68, 955–964. [Google Scholar] [CrossRef]
- Johnson, N.L.; Baltodano, M.E. The Economics of Community Watershed Management: Some Evidence from Nicaragua. Ecol. Econ. 2004, 49, 57–71. [Google Scholar] [CrossRef]
- Loomis, J.B. Environmental Valuation Techniques in Water Resource Decision Making. J. Water Resour. Plan. Manag. 2000, 126, 339–344. [Google Scholar] [CrossRef]
- Thapa, S.; Wang, L.; Koirala, A.; Shrestha, S.; Bhattarai, S.; Aye, W.N. Valuation of Ecosystem Services from an Important Wetland of Nepal: A Study from Begnas Watershed System. Wetlands 2020, 40, 1071–1083. [Google Scholar] [CrossRef]
- Bhandari, P.; Kc, M.; Shrestha, S.; Aryal, A.; Shrestha, U.B. Assessments of Ecosystem Service Indicators and Stakeholder’s Willingness to Pay for Selected Ecosystem Services in the Chure Region of Nepal. Appl. Geogr. 2016, 69, 25–34. [Google Scholar] [CrossRef]
- Mwebaze, P.; Marris, G.C.; Brown, M.; MacLeod, A.; Jones, G.; Budge, G.E. Measuring Public Perception and Preferences for Ecosystem Services: A Case Study of Bee Pollination in the UK. Land Use Policy 2018, 71, 355–362. [Google Scholar] [CrossRef]
- Ren, Y.; Lu, L.; Zhang, H.; Chen, H.; Zhu, D. Residents’ Willingness to Pay for Ecosystem Services and Its Influencing Factors: A Study of the Xin’an River Basin. J. Clean. Prod. 2020, 268, 122301. [Google Scholar] [CrossRef]
- Sehreen, F.; Masud, M.M.; Akhtar, R.; Masum, M.R.A. A Contingent Valuation Approach to Evaluating Willingness to Pay for an Improved Water Pollution Management System in Dhaka City, Bangladesh. Environ. Monit Assess. 2019, 191, 457. [Google Scholar] [CrossRef] [PubMed]
- Koetse, M.J.; Brouwer, R.; van Beukering, P.J.H. Economic Valuation Methods for Ecosystem Services. In Ecosystem Services; Bouma, J.A., van Beukering, P.J.H., Eds.; Cambridge University Press: Cambridge, UK, 2015; pp. 108–131. ISBN 978-1-107-47761-2. [Google Scholar]
- Loomis, J.; Santiago, L. Economic Valuation of Beach Quality Improvements: Comparing Incremental Attribute Values Estimated from Two Stated Preference Valuation Methods. Coast. Manag. 2013, 41, 75–86. [Google Scholar] [CrossRef]
- Loomis, J.B. 2013 WAEA Keynote Address: Strategies for Overcoming Hypothetical Bias in Stated Preference Surveys. J. Agric. Resour. Econ. 2014, 39, 34–46. [Google Scholar]
- Mitchell, R.C.; Carson, R.T. Using Surveys to Value Public Goods: The Contingent Valuation Method; Johns Hopkins University Press: Washington, DC, USA; Baltimore, MD, USA, 1989; ISBN 978-0-915707-32-4. [Google Scholar]
- Meyerhoff, J.; Liebe, U. Determinants of Protest Responses in Environmental Valuation: A Meta-Study. Ecol. Econ. 2010, 70, 366–374. [Google Scholar] [CrossRef]
- Desaigues, B.; Ami, D.; Bartczak, A.; Braun-Kohlová, M.; Chilton, S.; Czajkowski, M.; Farreras, V.; Hunt, A.; Hutchison, M.; Jeanrenaud, C.; et al. Economic Valuation of Air Pollution Mortality: A 9-Country Contingent Valuation Survey of Value of a Life Year (VOLY). Ecol. Indic. 2011, 11, 902–910. [Google Scholar] [CrossRef]
- Jones, N.; Sophoulis, C.M.; Malesios, C. Economic Valuation of Coastal Water Quality and Protest Responses: A Case Study in Mitilini, Greece. J. Socio-Econ. 2008, 37, 2478–2491. [Google Scholar] [CrossRef]
- Meyerhoff, J.; Mørkbak, M.R.; Olsen, S.B. A Meta-Study Investigating the Sources of Protest Behaviour in Stated Preference Surveys. Environ. Resour. Econ. 2014, 58, 35–57. [Google Scholar] [CrossRef]
- O’Connor, E.; Hynes, S.; Chen, W. Estimating the Non-Market Benefit Value of Deep-Sea Ecosystem Restoration: Evidence from a Contingent Valuation Study of the Dohrn Canyon in the Bay of Naples. J. Environ. Manag. 2020, 275, 111180. [Google Scholar] [CrossRef] [PubMed]
- Heckman, J. Sample Selection Bias as a Specification Error. Econometrica 1979, 47, 153–161. [Google Scholar] [CrossRef]
- Garcia, S.; Harou, P.; Montagné, C.; Stenger, A. Models for Sample Selection Bias in Contingent Valuation: Application to Forest Biodiversity. JFE 2009, 15, 59–78. [Google Scholar] [CrossRef]
- Osiolo, H.H. Willingness to Pay for Improved Energy: Evidence from Kenya. Renew. Energy 2017, 112, 104–112. [Google Scholar] [CrossRef]
- Tan, R.; Lin, B. Public Perception of New Energy Vehicles: Evidence from Willingness to Pay for New Energy Bus Fares in China. Energy Policy 2019, 130, 347–354. [Google Scholar] [CrossRef]
- Rister, M.E.; Sturdivant, A.W.; Lacewell, R.D.; Michelsen, A.M. Challenges and Opportunities for Water of the Rio Grande. J. Agric. Appl. Econ. 2011, 43, 367–378. [Google Scholar] [CrossRef][Green Version]
- Raheem, N.; Archambault, S.; Arellano, E.; Gonzales, M.; Kopp, D.; Rivera, J.; Guldan, S.; Boykin, K.; Oldham, C.; Valdez, A.; et al. A Framework for Assessing Ecosystem Services in Acequia Irrigation Communities of the Upper Río Grande Watershed: A Framework for Assessing Ecosystem Services in Acequia Irrigation Communities. WIREs Water 2015, 2, 559–575. [Google Scholar] [CrossRef]
- Weber, M.A.; Stewart, S. Public Values for River Restoration Options on the Middle Rio Grande. Restor. Ecol. 2009, 17, 762–771. [Google Scholar] [CrossRef]
- Yoskowitz, D.W.; Montagna, P.A. Socio-Economic Factors That Impact the Desire to Protect Freshwater Flow in the Rio Grande, USA; Brebbia, C.A., Tiezzi, E., Eds.; Ecosystems and Sustainable Development VII; WIT Press: Chianciano Terme, Italy, 2009; pp. 547–558. [Google Scholar]
- Lewis, S.E.; Popp, J.S.; English, L.A.; Odetola, T.O. Willingness to Pay for Riparian Zones in an Ozark Watershed. J. Water Resour. Plann. Manag. 2017, 143, 04017006. [Google Scholar] [CrossRef]
- Tentes, G.; Damigos, D. Discrete Choice Experiment for Groundwater Valuation: Case of the Asopos River Basin, Greece. J. Water Resour. Plan. Manag. 2015, 141, 04014089. [Google Scholar] [CrossRef]
- Wainger, L.A.; King, D.M.; Mack, R.N.; Price, E.W.; Maslin, T. Can the Concept of Ecosystem Services Be Practically Applied to Improve Natural Resource Management Decisions? Ecol. Econ. 2010, 69, 978–987. [Google Scholar] [CrossRef]
- Wainger, L.; Mazzotta, M. Realizing the Potential of Ecosystem Services: A Framework for Relating Ecological Changes to Economic Benefits. Environ. Manag. 2011, 48, 710. [Google Scholar] [CrossRef] [PubMed]
- USGS. Monitoring the Water Quality of the Nation’s Large Rivers: Rio Grande NASQAN Program. Fact Sheet. 1998. Available online: https://pubs.usgs.gov/fs/1998/0083/report.pdf (accessed on 12 December 2021).
- USGS. USGS Water Data for the Nation. Available online: https://Waterdata.Usgs.Gov/nwis. (accessed on 1 September 2021).
- Tibshirani, R. Regression Shrinkage and Selection Via the Lasso. J. R. Stat. Soc. Ser. B Methodol. 1996, 58, 267–288. [Google Scholar] [CrossRef]
- Tibshirani, R. Regression Shrinkage and Selection via the Lasso: A Retrospective: Regression Shrinkage and Selection via the Lasso. J. R. Stat. Soc. Ser. B Stat. Methodol. 2011, 73, 273–282. [Google Scholar] [CrossRef]
- Efron, B.; Hastie, T.; Johnstone, I.; Tibshirani, R. Least Angle Regression. Ann. Statist. 2004, 32, 407–499. [Google Scholar] [CrossRef]
- Gleick, P.H. Transitions to Freshwater Sustainability. Proc. Natl. Acad. Sci. USA 2018, 115, 8863–8871. [Google Scholar] [CrossRef] [PubMed]
- Retallack, M. The Intersection of Economic Demand for Ecosystem Services and Public Policy: A Watershed Case Study Exploring Implications for Social-Ecological Resilience. Ecosyst. Serv. 2021, 50, 101322. [Google Scholar] [CrossRef]
- Ali, M.A.S.; Khan, S.U.; Khan, A.; Khan, A.A.; Zhao, M. Ranking of Ecosystem Services on the Basis of Willingness to Pay: Monetary Assessment of a Subset of Ecosystem Services in the Heihe River Basin. Sci. Total. Environ. 2020, 734, 139447. [Google Scholar] [CrossRef] [PubMed]
- Castro, A.J.; Vaughn, C.C.; Julian, J.P.; García-Llorente, M. Social Demand for Ecosystem Services and Implications for Watershed Management. J. Am. Water Resour. Assoc. 2016, 52, 209–221. [Google Scholar] [CrossRef]
- Förster, J.; Schmidt, S.; Bartkowski, B.; Lienhoop, N.; Albert, C.; Wittmer, H. Incorporating Environmental Costs of Ecosystem Service Loss in Political Decision Making: A Synthesis of Monetary Values for Germany. PLoS ONE 2019, 14, e0211419. [Google Scholar] [CrossRef] [PubMed]
- Grêt-Regamey, A.; Altwegg, J.; Sirén, E.A.; van Strien, M.J.; Weibel, B. Integrating Ecosystem Services into Spatial Planning—A Spatial Decision Support Tool. Landsc. Urban Plan. 2017, 165, 206–219. [Google Scholar] [CrossRef]
- Alexander, S.; Aronson, J.; Whaley, O.; Lamb, D. The Relationship between Ecological Restoration and the Ecosystem Services Concept. Ecol. Soc. 2016, 21, art34. [Google Scholar] [CrossRef]
- Chaikaew, P.; Hodges, A.W.; Grunwald, S. Estimating the Value of Ecosystem Services in a Mixed-Use Watershed: A Choice Experiment Approach. Ecosyst. Serv. 2017, 23, 228–237. [Google Scholar] [CrossRef]
- Torres, C.; Hanley, N. Communicating Research on the Economic Valuation of Coastal and Marine Ecosystem Services. Mar. Policy 2017, 75, 99–107. [Google Scholar] [CrossRef]
- Turpie, J.K. The Existence Value of Biodiversity in South Africa: How Interest, Experience, Knowledge, Income and Perceived Level of Threat Influence Local Willingness to Pay. Ecol. Econ. 2003, 46, 199–216. [Google Scholar] [CrossRef]
| Variable | US Census | Survey | ||
|---|---|---|---|---|
| Colorado | New Mexico | Texas | Mean | |
| Median age (years) | 36.8 | 37.7 | 34.7 | 49.3 |
| Female (%) | 49.5 | 50.5 | 50.4 | 35.8 |
| Race/ethnicity (%) White | 68.2 | 37.4 | 41.9 | 62.9 |
| Hispanic | 21.5 | 48.8 | 39.4 | 28.9 |
| Black or African American | 3.9 | 1.8 | 11.8 | 1.0 |
| Asian | 3.1 | 1.3 | 4.8 | 0 |
| American Indian or Alaska Native | 0.6 | 8.8 | 0.3 | 2.1 |
| Others | 2.7 | 1.9 | 1.8 | 5.1 |
| Education attainment * (%) High school graduate or lower | 29.7 | 40.5 | 41.4 | 0 |
| College or higher | 70.3 | 59.5 | 58.6 | 100 |
| Median household income ($) | 60,629 | 44,964 | 53,207 | 60,000–80,000 |
| Persons per household (person) | 2.6 | 2.7 | 2.8 | 2.7 |
| Variables | Description | Median | Mean (std. dev,) | Min | Max |
|---|---|---|---|---|---|
| Education level | Highest level of academic education completed (no schooling completed (1) to doctorate degree (9)) | 7 | 6.99 (1.43) | 3 | 9 |
| Age | Respondent’s age | 50 | 49.98 (12.98) | 19 | 87 |
| Income level | Annual household income (<$20,000 (1) to >$80,000 (5)) | 4 | 4.03 (1.28) | 1 | 5 |
| Female | If the respondent is female (=1 yes; 0 otherwise) | 1 | 0.36 (0.48) | 0 | 1 |
| Household size | Number of household members | 2 | 2.69 (1.10) | 1 | 6 |
| Hispanic | If the respondent is Hispanic (=1 yes; 0 otherwise) | 0 | 0.26 (0.44) | 0 | 1 |
| Resident | If the respondent lives in the basin (1 = yes; 0 otherwise) | 1 | 0.67 (0.47) | 0 | 1 |
| Grandparent | If the respondent’s grandparents come from the basin (1 = yes; 0 otherwise) | 0 | 0.34 (0.48) | 0 | 1 |
| Association | If the respondent is a member in any association, society, or other organization (1 = yes; 0 otherwise) | 1 | 0.69 (0.47) | 0 | 1 |
| Community | If the respondent participates in any community activities (1 = yes; 0 otherwise) | 1 | 0.82 (0.39) | 0 | 1 |
| Drought | If the respondent realizes negative impacts of drought on water flow (1 = yes; 0 otherwise) | 1 | 0.67 (0.47) | 0 | 1 |
| Upstream | If the respondent realizes negative impacts of upstream water use on water flow (1 = yes; 0 otherwise) | 1 | 0.61 (0.49) | 0 | 1 |
| Ecosystem perception (fresh water) | Perception of the importance of freshwater supplies in the basin (least important (1) to most important (5)) | 5 | 4.74 (0.82) | 1 | 5 |
| Ecosystem perception (culture heritage) | Perception of the importance of cultural heritage in the basin (least important (1) to most important (5)) | 4 | 3.58 (1.08) | 1 | 5 |
| Ecosystem perception (habitat for wildlife) | Perception of the importance of habitat for wildlife in the basin (least important (1) to most important (5)) | 4 | 4.12 (0.90) | 1 | 5 |
| Ecosystem perception (recreation) | Perception of the importance of recreational activities in the basin (least important (1) to most important (5)) | 4 | 3.47 (1.09) | 1 | 5 |
| Time | Duration (in minutes) of finishing the online survey | 1.69 | 18.96 (130.19) | 1.52 | 1306.17 |
| Location_Lat | Latitude of respondent’s location | 35.07 | 33.71 (5.75) | 18.87 | 44.24 |
| Location_Lon | Longitude of respondent’s location | −105.32 | –104.09 (8.77) | −155.14 | −73.99 |
| Reasons for Non-WTP | Number of Responders | % in Non-WTP Responders | % in Overall Sample | Responder Type |
|---|---|---|---|---|
| Government/polluters should pay | 9 | 34.6% | 8.5% | Protest |
| Lack of sufficient information/details to decide | 5 | 19.2% | 4.7% | Protest |
| Environment associations are not effective/trustable | 5 | 19.2% | 4.7% | Protest |
| I am not a resident of the basin | 3 | 11.5% | 2.8% | True zero |
| I cannot afford it | 2 | 7.7% | 1.9% | True zero |
| Other | 2 | 7.7% | 1.9% | True zero |
| Variables | Selection Equation | Outcome Equation | ||||
|---|---|---|---|---|---|---|
| Zi | Total WTP | Freshwater Supplies | Culture Heritage | Habitat for Wildlife | Recreational Activities | |
| Education level (low (1) to high (9)) | 0.5445 *** | −0.0747 | 0.5451 | 0.6189 | 0.7180 | |
| (0.2049) | (0.1521) | (1.3794) | (0.7752) | (0.9777) | ||
| Age | −0.0302 | −0.0106 | −0.1176 | −0.1721 ** | −0.1482 * | −0.1742 ** |
| (0.0184) | (0.0150) | (0.1262) | (0.0889) | (0.0836) | (0.0791) | |
| Income level (low (1) to high (5)) | 0.4359 *** | 0.4685 | ||||
| (0.1165) | (0.8195) | |||||
| whether is female | −0.3705 | 0.0250 | −2.3930 | −1.2943 | ||
| (0.4640) | (0.2747) | (2.4866) | (1.7501) | |||
| Household size | 0.2296 | −0.1308 | 0.2823 | −0.3456 | ||
| (0.1890) | (0.1272) | (0.8787) | (0.8201) | |||
| Whether is Hispanic | 1.8694 *** | 0.4801 | 4.3299 | −0.1461 | ||
| (0.6179) | (0.5375) | (4.1547) | (3.2224) | |||
| Whether is resident | 1.3458 *** | 0.4592 *** | 1.9269 *** | 2.1885 * | ||
| (0.4706) | (0.1182) | (0.4070) | (1.3067) | |||
| Whether grandparents are residents | −1.7290 *** | −0.1894 | −9.1419 ** | −1.9021 | ||
| (0.4539) | (0.5584) | (4.5451) | (3.4607) | |||
| Whether is association member | 0.3480 | 0.1197 | 2.5475 | |||
| (0.4772) | (0.2779) | (2.5723) | ||||
| Whether participating in community activities | 0.2896 | 0.0999 | 3.2655 | 2.4050 | 3.2468 | |
| (0.5710) | (0.3913) | (2.6001) | (2.3938) | (2.7914) | ||
| Whether realizing negative impacts of drought on water flow | 0.2069 (0.3833) | 0.2950 (0.2431) | 2.3641 (1.7562) | |||
| Whether realizing negative impacts of upstream water use on water flow | 1.2158 | |||||
| (1.7785) | ||||||
| Importance of ecosystem services | 2.4575 ** | 3.0064 *** | 2.1231 *** | 2.7834 *** | ||
| (1.0165) | (0.7511) | (0.6786) | (0.8038) | |||
| Time to finishing the online survey | −0.0016 | −0.0016 | 0.0104 | −0.0078 | ||
| (0.0022) | (0.0028) | (0.0258) | (0.0172) | |||
| Respondents’ location latitude | 0.0841 * | −0.0326 | 0.0579 | 0.2208 | 0.0946 | |
| (0.0429) | (0.0269) | (0.2506) | (0.1739) | (0.1727) | ||
| Respondents’ location longitude | −0.0217 | 0.0047 | −0.0935 | −0.0833 | −0.1083 | |
| (0.0236) | (0.0127) | (0.0938) | (0.0822) | (0.1005) | ||
| Constant | −8.2704 ** | 2.0182 *** | −6.6140 ** | −26.0853 | −16.7574 | −24.3879 |
| (3.4854) | (0.6507) | (3.1066) | (18.0388) | (13.3268) | (20.1037) | |
| Mills lambda | 0.4915 | 9.1608 | −1.6139 | 5.8926 | 3.6748 | |
| (1.0091) | (7.4524) | (3.6294) | (6.0775) | (3.8510) | ||
Publisher’s Note: MDPI stays neutral with regard to jurisdictional claims in published maps and institutional affiliations. |
© 2021 by the authors. Licensee MDPI, Basel, Switzerland. This article is an open access article distributed under the terms and conditions of the Creative Commons Attribution (CC BY) license (https://creativecommons.org/licenses/by/4.0/).
Share and Cite
Wang, W.; Mu, J.E.; Ziolkowska, J.R. Perceived Economic Value of Ecosystem Services in the US Rio Grande Basin. Sustainability 2021, 13, 13798. https://doi.org/10.3390/su132413798
Wang W, Mu JE, Ziolkowska JR. Perceived Economic Value of Ecosystem Services in the US Rio Grande Basin. Sustainability. 2021; 13(24):13798. https://doi.org/10.3390/su132413798
Chicago/Turabian StyleWang, Weiwei, Jianhong E. Mu, and Jadwiga R. Ziolkowska. 2021. "Perceived Economic Value of Ecosystem Services in the US Rio Grande Basin" Sustainability 13, no. 24: 13798. https://doi.org/10.3390/su132413798
APA StyleWang, W., Mu, J. E., & Ziolkowska, J. R. (2021). Perceived Economic Value of Ecosystem Services in the US Rio Grande Basin. Sustainability, 13(24), 13798. https://doi.org/10.3390/su132413798


