Article

Low Nickel, Ceria Zirconia-Based Micro-Tubular Solid Oxide Fuel Cell: A Study of Composition and Oxidation Using Hydrogen and Methane Fuel

by
Hazrul Adzfar Shabri
1,
Siti Norlaila Faeizah Mohd Rudin
2,
Shahirah Deraman
1,
Mazlinda Ab Rahman
1,
Mohd Hafiz Dzarfan Othman
3,*,
Siti Munira Jamil
4,
Tonni Agustiono Kurniawan
5,
Tao Li
6,
Suriani Abu Bakar
7,
Nafisah Osman
8,
Juhana Jaafar
3,
Mukhlis A Rahman
3 and
Ahmad Fauzi Ismail
3
1
Advanced Membrane Technology Research Centre (AMTEC), Universiti Teknologi Malaysia, Skudai 81310, Malaysia
2
Process System Engineering Center (PROSPECT), Universiti Teknologi Malaysia, Skudai 81310, Malaysia
3
Department of Energy Engineering, School of Chemical and Energy Engineering (FCEE), Universiti Teknologi Malaysia, Skudai 81310, Malaysia
4
School of Professional and Continuing Education (SPACE), Universiti Teknologi Malaysia, Skudai 81310, Malaysia
5
Key Laboratory of the Coastal and Wetland Ecosystems (Xiamen University), Ministry of Education, College of Environment and Ecology, Xiamen University, Xiamen 361102, China
6
School of Energy & Environment, Southeast University, Nanjing 210096, China
7
Nanotechnology Research Centre, Faculty of Science and Mathematics, Universiti Pendidikan Sultan Idris, Tanjung Malim 35900, Malaysia
8
Fakulti Sains Gunaan, Universiti Teknologi MARA Cawangan Perlis, Kampus Arau, Arau 02600, Malaysia
*
Author to whom correspondence should be addressed.
Sustainability 2021, 13(24), 13789; https://doi.org/10.3390/su132413789
Submission received: 14 November 2021 / Revised: 10 December 2021 / Accepted: 11 December 2021 / Published: 14 December 2021
(This article belongs to the Special Issue Fuel Cells and Hydrogen Economy)

Abstract

:
The study examines the effect of using low nickel (Ni) with high ceria (CeO2) anode content towards the oxidation of H2 and CH4 fuel by evaluating the activation energy of the ohmic process and charge transfer process. Using a micro-tubular solid oxide fuel cell (MT-SOFC), the anodes are made up of 50% YSZ with varying NiO:CeO2 percentages from 0% NiO, 50% CeO2 to 50% NiO, 0% CeO2. The performance is measured based on maximum power density (MPD), electrochemical impedance spectroscopy (EIS) and activation energy, Ea of the ohmic (Rohm) and charge transfer (Rct) processes. We found that by lowering the Ni content to lower than 50% NiO, anode conductivity will drop by 7-fold. An anode containing 37.5% NiO, 12.5% CeO2 yield MPD of 41.1 and 2.9 mW cm−2 when tested on H2 and CH4 fuels thus have the lowest Ni content without an abrupt negative effect on the MPD and EIS. The significant effect of conductivity drops on MPD and EIS are observed to occur at 25% NiO, 25% CeO2 and lower NiO content. However, anode content of 25% NiO, 25% CeO2 has the lowest Ea for Rct (29.74 kJ mol−1) for operation in CH4, making it the best anode composition to oxidize CH4. As a conclusion, an anode containing 25% NiO:25% CeO2:50% YSZ and 37.5% NiO:12.5% CeO2:50% YSZ shows promising results in becoming the low Ni anode for coking-tolerant SOFC.

1. Introduction

The emission of greenhouse gases, mainly carbon dioxide, from fossil fuel burning has led to climate changes where the global average temperature has been rising by 0.08 °C per decade since 1880 [1]. This emission is mainly attributed to electricity generation by coal burning, involving multiple steps of energy conversion. The stored chemical energy in fuel is changed to heat, then mechanical, and later, electrical energy, losing a small portion of energy due to inefficiency in the energy exchanging process in each step.
Hydrocarbon fuel is being actively researched as a fuel for solid oxide fuel cells (SOFCs) due to the high operating temperature of SOFC that sits well in the hydrocarbon reforming region. Producing electricity by means of a fuel cell involves only one step, potentially limiting energy losses due to inefficiency in multiple steps. The well-known challenge associated with nickel-cermet anodes with hydrocarbon fuel is the coking of the anode or carbon deposition on the surface of the anode [2]. The problem existed due to Ni’s tendency of nucleating carbon growth, which also explains its function as one of the dehydrogenation catalysts in other processes [3].
Coking eventually blocks the anode for further contact and reaction with reactant gas fuels, thus reducing the performance over time. Subsequently, ceria or CeO2 is actively researched as a possible carbon oxidation catalyst to mitigate this issue. The catalytic properties of CeO2 are well-known as it is used as a catalyst in a catalytic converter to oxidize unburned hydrocarbon in vehicles’ emissions [4]. The recently landed Mars Perseverance Rover on Mars even carried an onboard solid oxide electrolyzer cell (SOEC) with an electrode made up of Ni–YSZ and Ni–CeO2 to produce O2 from CO2 [5].
CeO2 used in an SOFC study can be in the form of pure or doped CeO2, such as gadolinium doped ceria (GDC) and samarium doped ceria (SDC). Use of doped CeO2 is more favorable due to higher oxide ion conductivity compared to pure ceria, which also made them a common electrolyte material as well. Studies using a doped GDC electrolyte have shown a maximum power density (MPD) of 0.67 to 1.7 W cm−2 on H2 fuel and 0.13 to 1.4 W cm−2 on CH4 [6,7,8].
On the other hand, the usage of ceria is still favorable compared to doped ceria due to its lower cost. Additionally, SOFC based on doped ceria as an electrolyte (termed as intermediate temperature-SOFC due to lower operating temperature) suffers current leakage due to the tendency of Ce(IV) to be reduced to Ce(III) in highly reducing environments. This unwanted reduction occurs during anode reduction processes or prolonged operation, which creates n-type conductivity in the electrolyte, lowering performances [9]. Furthermore, doped ceria such as samarium doped ceria (SDC) used as electrolyte material was shown to exhibit different catalytic properties compared to ceria deposited as an anode [10].
Currently, most methods employed in creating a ceria-loaded Ni–YSZ anode of a micro-tubular solid oxide fuel cell (MT-SOFC) involve infusing soluble cerium salt such as cerium nitrate followed by calcination and oxidation to turn the cerium to cerium oxide [11,12]. This method managed to produce an MPD of 0.283 to 0.55 Wcm−2 on H2 fuel and 0.16 to 0.241 Wcm−2 on CH4 at 900 °C, respectively [11,12]. Whilst this method was shown to be successful in creating a low-ceria-content Ni–YSZ anode, higher ceria content in a Ni–YSZ anode is harder to be fabricated due to the increasing number of deposition cycles. Furthermore, the oxidation of the soluble cerium metal to form CeO2 sometimes also produces other forms of cerium oxides, mainly Ce2O3. Furthermore, to our knowledge, there is no study that employs the direct use of CeO2 into an anode of MT-SOFC. Thus, in this paper, we explored another potential of a high-CeO2-content Ni–YSZ anode of MT-SOFC in order to create a coking-tolerant SOFC anode. In this method, CeO2 was directly added during single-step fabrication of an anode/electrolyte dual-layer hollow fiber in order to avoid the two-step process, i.e., repetitive deposition process and sintering.
Micro-tubular solid oxide fuel cell (MT-SOFC) is gaining attention as one of the candidates to commercialize SOFC as opposed to traditional planar SOFC [13]. In MT-SOFC, the tubular form consisting of an anode, electrolyte and cathode was fabricated in less time with lower costs than the planar SOFC and had a micron-size lumen and thinner anode, thus having higher performance compared to planar SOFC. MT-SOFC may be fabricated using a phase inversion process, followed by calcination and sintering at high temperatures. One, two or even three layers can even be fabricated together, creating a single-layer, dual-layer [14] or triple-layer (TL) hollow fiber (HF) [15]. For example, the anode and electrolyte layer can be fabricated together in dual-layer hollow fiber (DL-HF) and complete cells of anode, electrolyte and cathode can be fabricated as a triple-layer hollow fiber (TL-HF).
In anodes, the charge transfer process involves a reaction between oxide ion and fuel that leads to oxidation of the fuel and release of electrons, which generates electricity. The study of the charge transfer process is important since the process depends greatly on the catalytic properties of the anode material [10]. Similar to every other chemical process, reactions between fuel and oxide ions on the anode surface require the reactant to overcome an energy barrier, termed activation energy or Ea. Lower Ea will result in more reactants having minimum energy requirements and hence more reactions occurring, thus increasing the current density of the fuel cell. Investigating the Ea value of the charge transfer process can be achieved via an Arrhenius plot of the Rct value at different operating temperatures.
The objective of this study is to investigate the effect of CeO2 and Ni content in the anode of MT-SOFC on that of the oxidation of H2 and CH4 fuel by using evaluation of the activation energy of the ohmic process and charge transfer process. Unlike other studies, CeO2 was fabricated together with the NiO–YSZ anode to produce the Ni–CeO2–YSZ anode with a YSZ electrolyte. The two layers were fabricated together in the form of dual-layer hollow fiber using a co-extrusion-based phase inversion process. The MT-SOFC uses pure YSZ electrolytes, and the anode is composed of 50% YSZ, with the remaining 50% made up of mixtures of Ni and CeO2. The Ni and CeO2 content were varied to investigate the effect of the Ni and CeO2 content on the physical structure such as morphology, gas permeability and mechanical strength. The effect was also investigated in terms of anode conductivity, power density and impedance spectroscopy in H2 and CH4 fuel at varying temperatures. Finally, analysis of activation energy, Ea, by means of an Arrhenius plot was performed on the ohmic resistance, Rohm, and charge transfer resistance, Rct, from the EIS of the SOFC obtained at temperatures from 700 to 900 °C on H2 and CH4 fuel. This is to examine the effect of temperature on the ohmic and charge transfer process of the varying Ni and CeO2 content. The produced MT-SOFC was expected to increase the performance of MT-SOFC on operating with CH4 fuel while using a low content of Ni. This work will enable MT-SOFC to operate stably using methane fuel, which can later be extended to hydrocarbon-based renewable fuel such as biogas as well.

2. Methodology

2.1. Materials

Commercially available 8% molar yttria-stabilized zirconia (YSZ) with a size of 0.35–0.45 μm and surface area 9 m2 g−1, nickel oxide (NiO) with a size of 0.5–1.5 μm and surface area 5 m2 g−1, and lanthanum strontium manganite, (La0.80Sr0.20)0.95MnO3-δ (LSM) with a surface area 10.9 m2 g−1 were obtained from NexTech Material Ltd. (Columbus, OH, USA). Cerium (IV) oxide (CeO2) with size <5 μm was obtained from Sigma Aldrich. N-methyl-2-pyrrolidone (NMP) (Sigma Aldrich (M) Sdn. Bhd, Petaling Jaya, Malaysia) was used as the solvent while polyethyleneglycol 30-dipolyhydroxystearate (Arlacel P135) (Uniqema, Goole, UK) and polyethersulfone, (PES, Radel A-300) (Solvay, Shanghai, China) were used as the dispersant and polymer binder, respectively. Tap water was used as both internal and external coagulants.

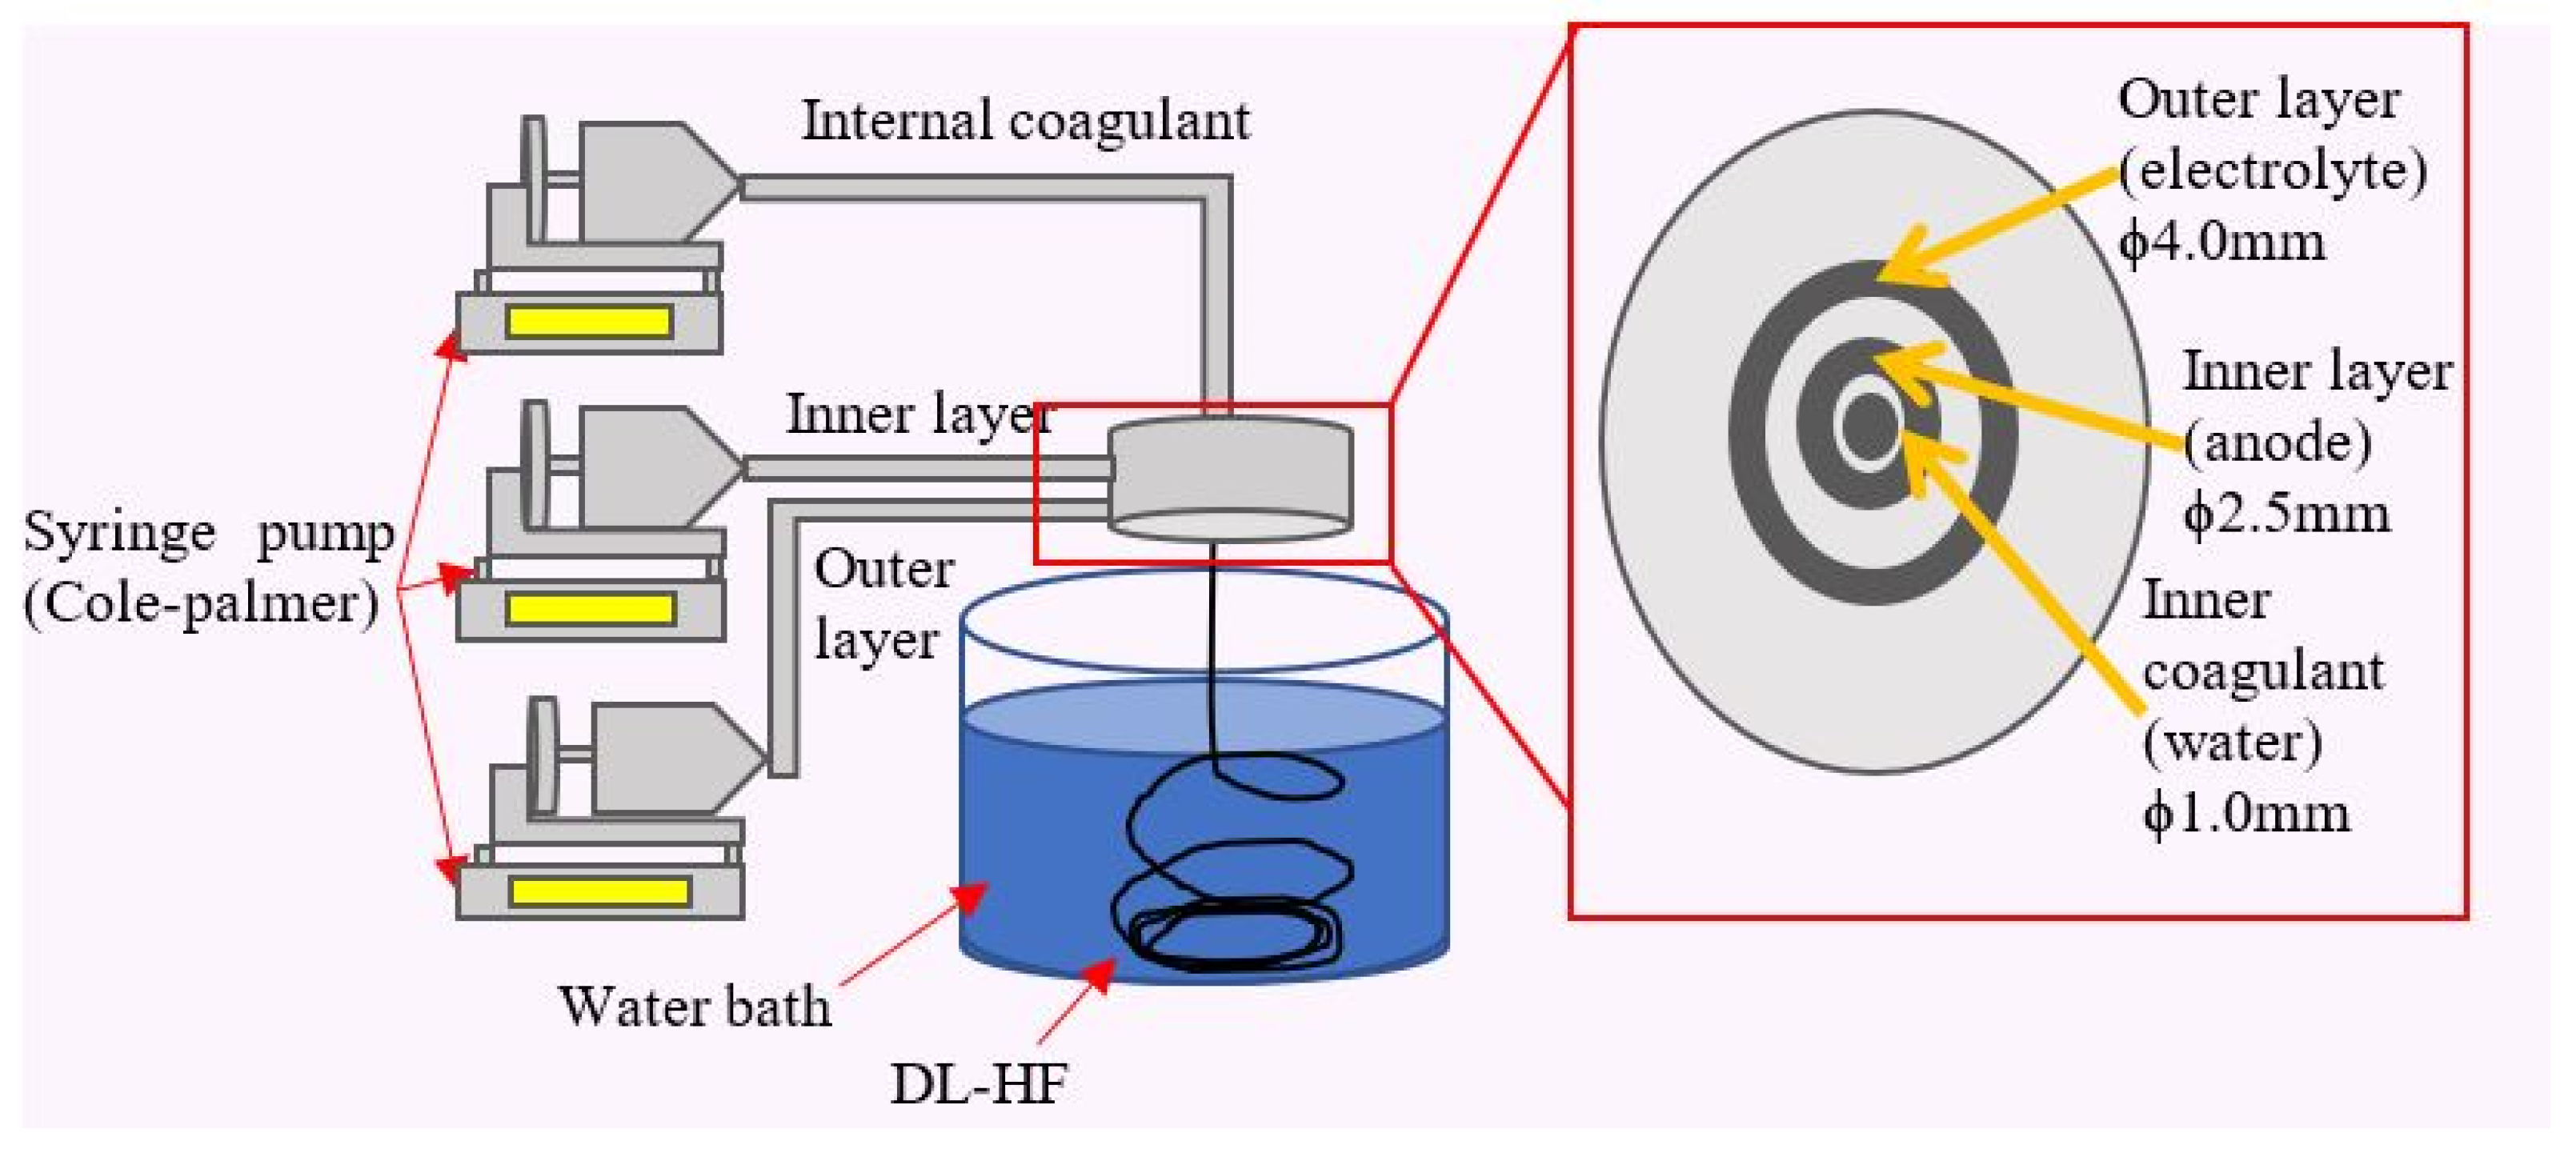
2.2. Fabrication of DL-HF

The fabrication of anode/electrolyte DL-HF was performed as mentioned in [13,14]. Briefly, the suspension of the inner and outer layer of DL-HF was prepared separately. The outer layer made up the electrolyte layer entirely and consists of YSZ, while the inner layer formed the anode layer and was made up of mixtures of NiO, CeO2 and YSZ as the ceramic component, as shown in Table 1. Five compositions of anodes were prepared with varying NiO and CeO2 content, named Mat_A, Mat_B, Mat_C, Mat_D and Mat_E.
The electrolyte layer was made of 100YSZ as the ceramic component. The suspension was made up of 65% ceramic, 6.5% polyethylethersulfone (PESf) as polymer binder, 0.12% Arlacel P135 as surfactant and 28.38% N-Methyl-2-pyrrolidone (NMP) as solvent. The ceramic components were mixed with the solvent and dispersant in a planetary ball milling machine (Magna Value), then ball milled for 24 h, followed by the addition of polymer binder and further ball milled for 24 h. The suspensions were pumped through an orifice opening called spinneret, as shown in Figure A1 in Appendix A.
The flow rates used were 3, 10 and 10 mL min−1 each for the outer layer, inner layer and water acting as an internal coagulant into the water bath, which acts as external coagulant at an air gap of 10 cm. Phase inversion follows in which solvent/non-solvent exchange occurred, leaving a solidified polymer phase with ceramic powders. The produced material, called DL-HFs, was soaked in the water and air-dried for 24 h. Then, the produced DL-HF was calcined at 600 °C for 1 h (ramp up rate = 5 °C min−1) followed by sintering at 1450 °C for 8 h (ramp up rate 10 °C min−1, ramp down rate 5 °C min−1) using a tube furnace (Magna Value). Both calcination and sintering were performed using air as the atmosphere. These ceramic DL-HFs produced were subjected to characterization analysis.

2.3. Characterization

Unreduced ceramic DL-HFs were scanned using SEM-EDX (Hitachi TM3030) to examine the morphology and the distribution of elements in the sample. The samples were carefully snapped in the middle and mounted onto a sample holder to examine the cross section view of the ceramic DL-HFs. Images and EDX elemental mapping were taken at a magnification of 60× for the overall cross section shape, 500× to examine the layering of the electrolyte and anode and 1500× at the anode to examine the microstructure. The samples were then crushed and tested with X-ray Diffraction (XRD) using Rigaku Smart Lab to examine the crystallinity structure of the Ni–CeO2–YSZ material. Similarly, the structure of the reduced Mat_C DL-HF was scanned using XRD to examine the reducibility of Ni and the effect of reduction on the reducibility of CeO2.
Gas permeation tests were performed on the unreduced and reduced anode layer as performed by [13,14]. To perform this, the sample was mounted on 3/8” tube-thread male connectors, as shown in Figure A2 in Appendix A using epoxy resin. The sample was fitted to a permeation cell where the flow rate of N2 gas flowing through the anode was measured using a bubble flow meter at varying inlet pressures.
Gas permeability was determined from Equation (1), where P is the value of gas permeability (mol m−2 s−1 Pa−1). Q, Di, Do, L and P are each gas permeation rate (mol s−1), inner diameter (m), outer diameter (m), length of hollow fiber (m) and pressure difference (P).
P = Q   ln ( D o / D i ) π L ( D o D i Δ P )
Mechanical strength of the ceramic DL-HF was measured via the Modulus of Rupture (MOR) method using mechanical testing equipment INSTRON 8032, as performed by [13,14]. This is to examine the effect of the sintering temperature and anode composition on the strength of the fiber. The sample was placed between two supports at a distance of 5 cm each, as shown in Figure A3 in Appendix A. The load was applied by the machine, and the bending strength was calculated using Equation (2) below.
B F = 8   NLD c π ( D o 4 D i 4 )
where N is the load value when the break occurs.

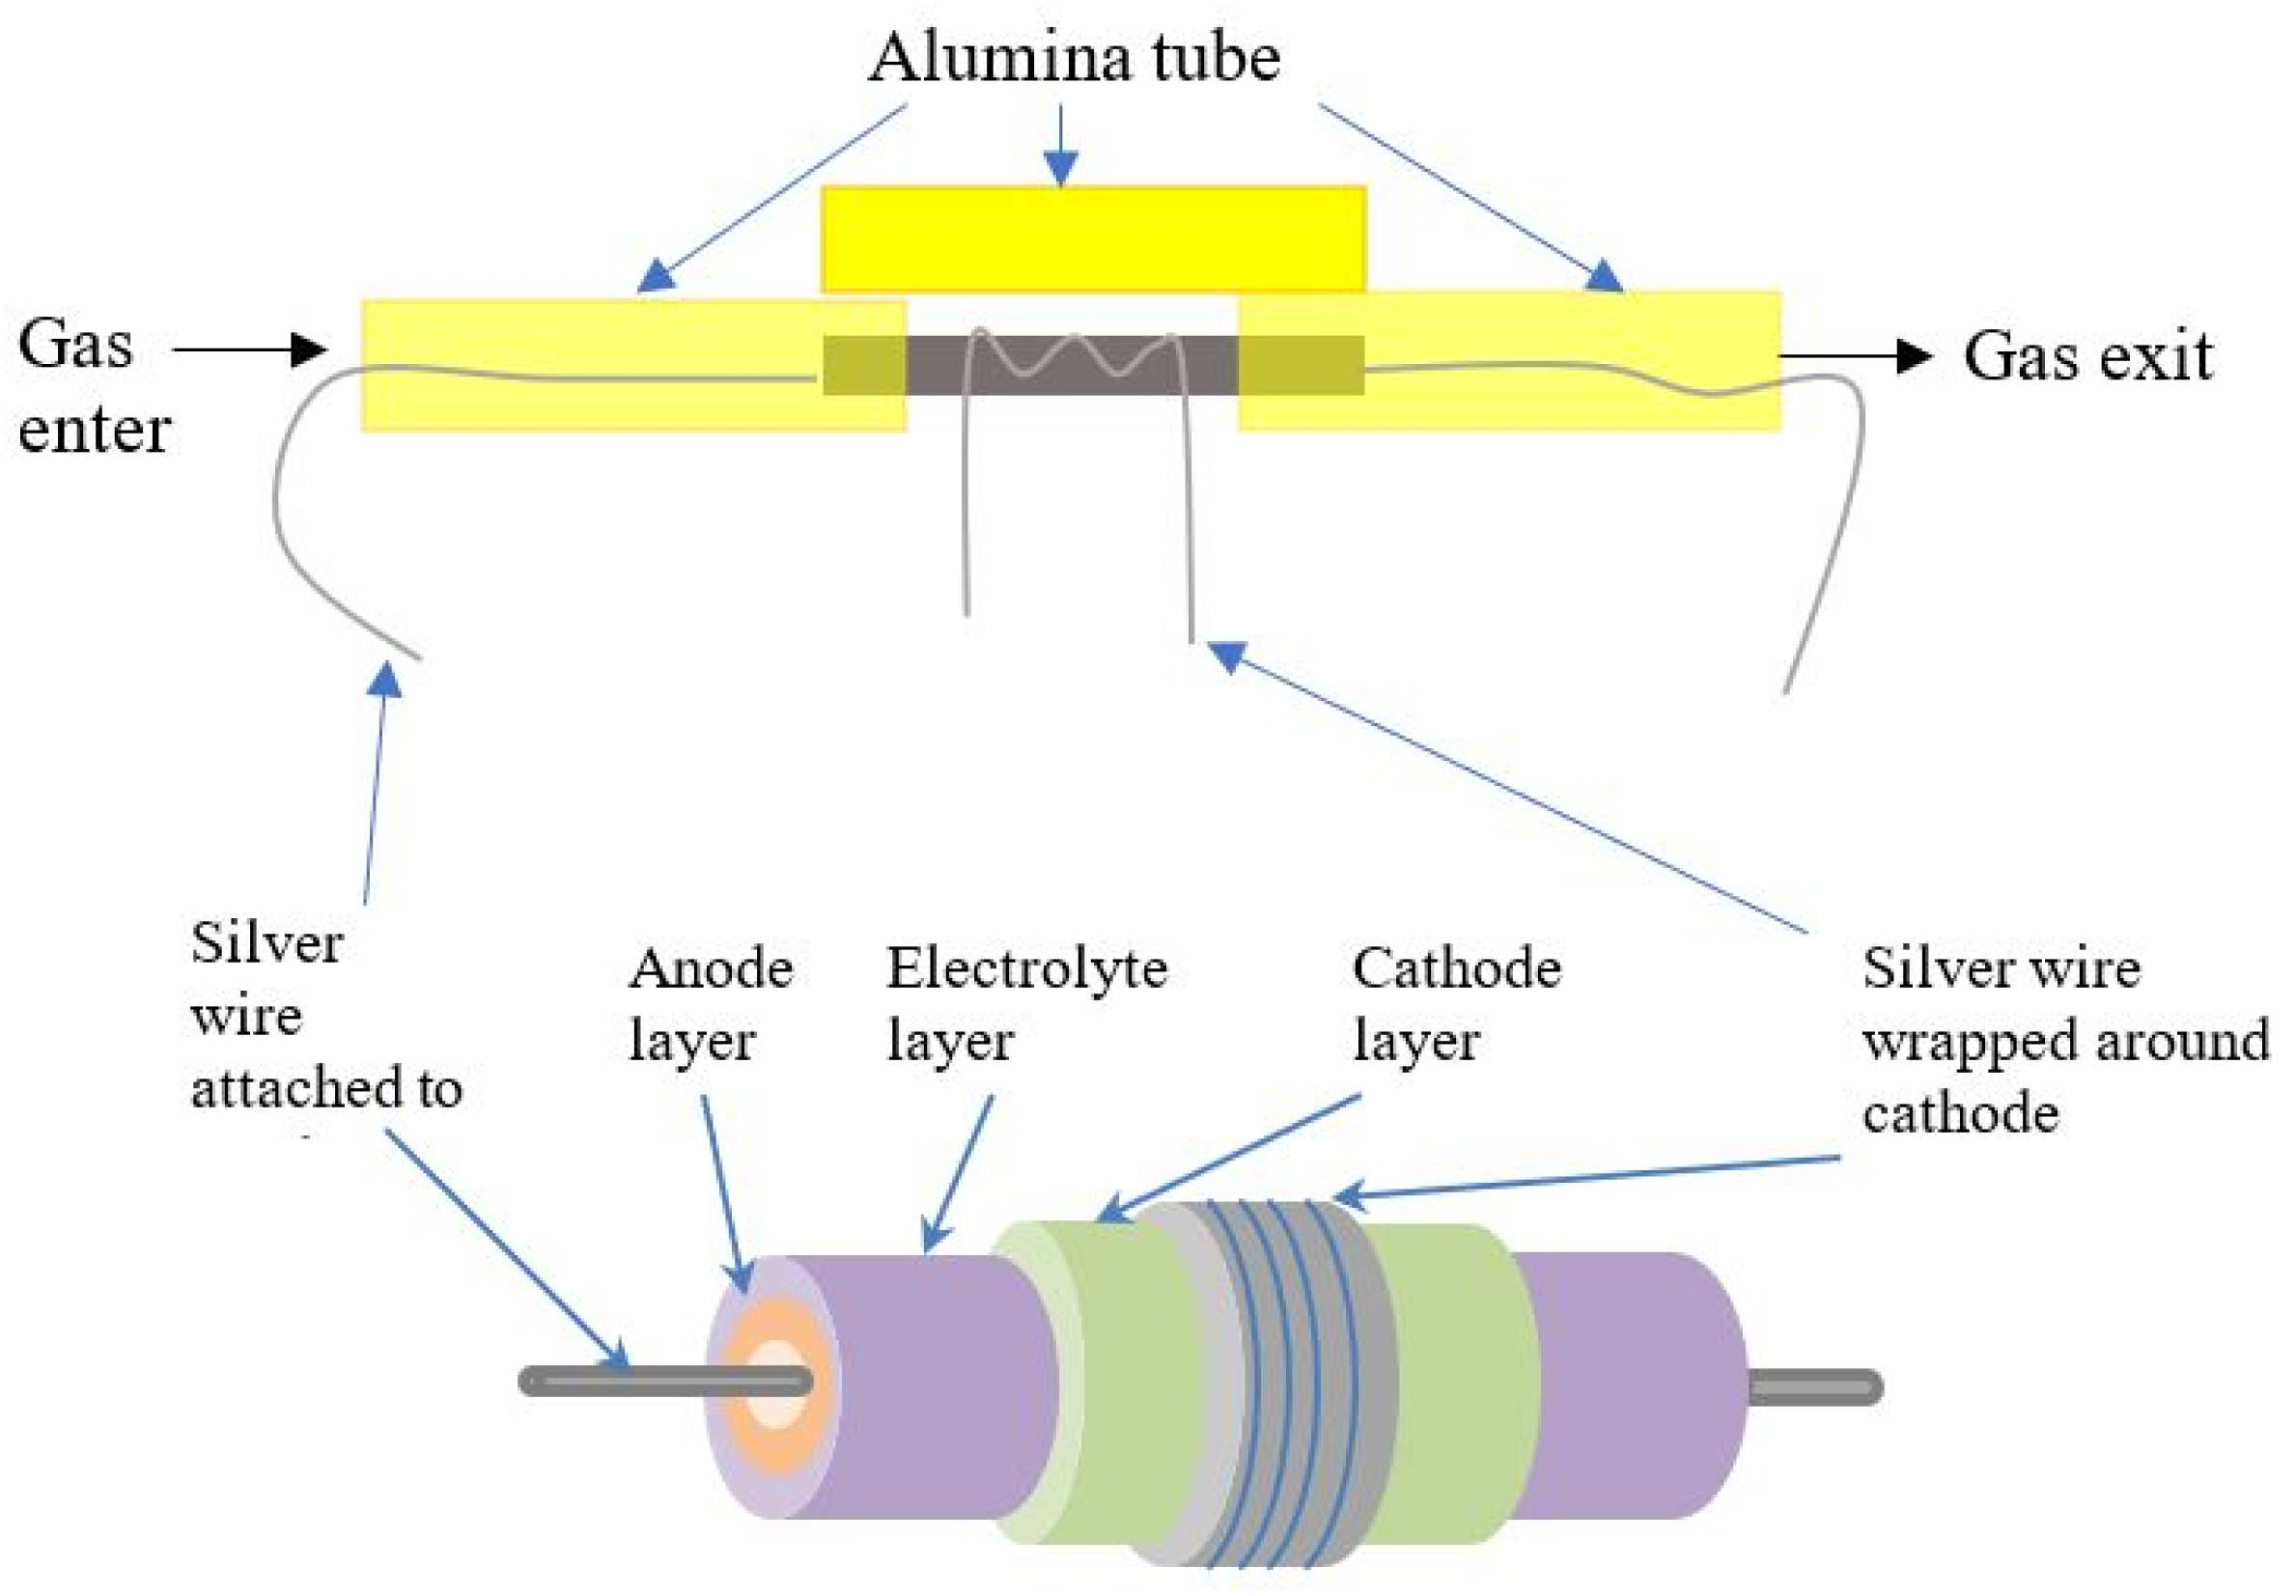
2.4. Conductivity Test

The electrical conductivity of the single-layer anode was measured using a 2-point direct-current (DC) technique using a potentiostat/galvanostat (Autolab PGSTAT 30, EcoChemie, The Netherlands). Potential between 0 and 1 V was applied across WE/S and RE/CE, and the resultant current was measured. The voltage–current plot was made, where the slope was taken as resistance, ρa. The conductivities were calculated according to Equation (3).
σ = L ρ a   A
where σ = conductivities, S cm−1, L = length of fiber, cm, ρa = resistance, A = area. A = π (Do2 − Di2)/4.
The plot of conductivities against percentage by volume, % volume Ni were plotted. The value of percentage by volume were obtained by dividing the mass with density for each component.

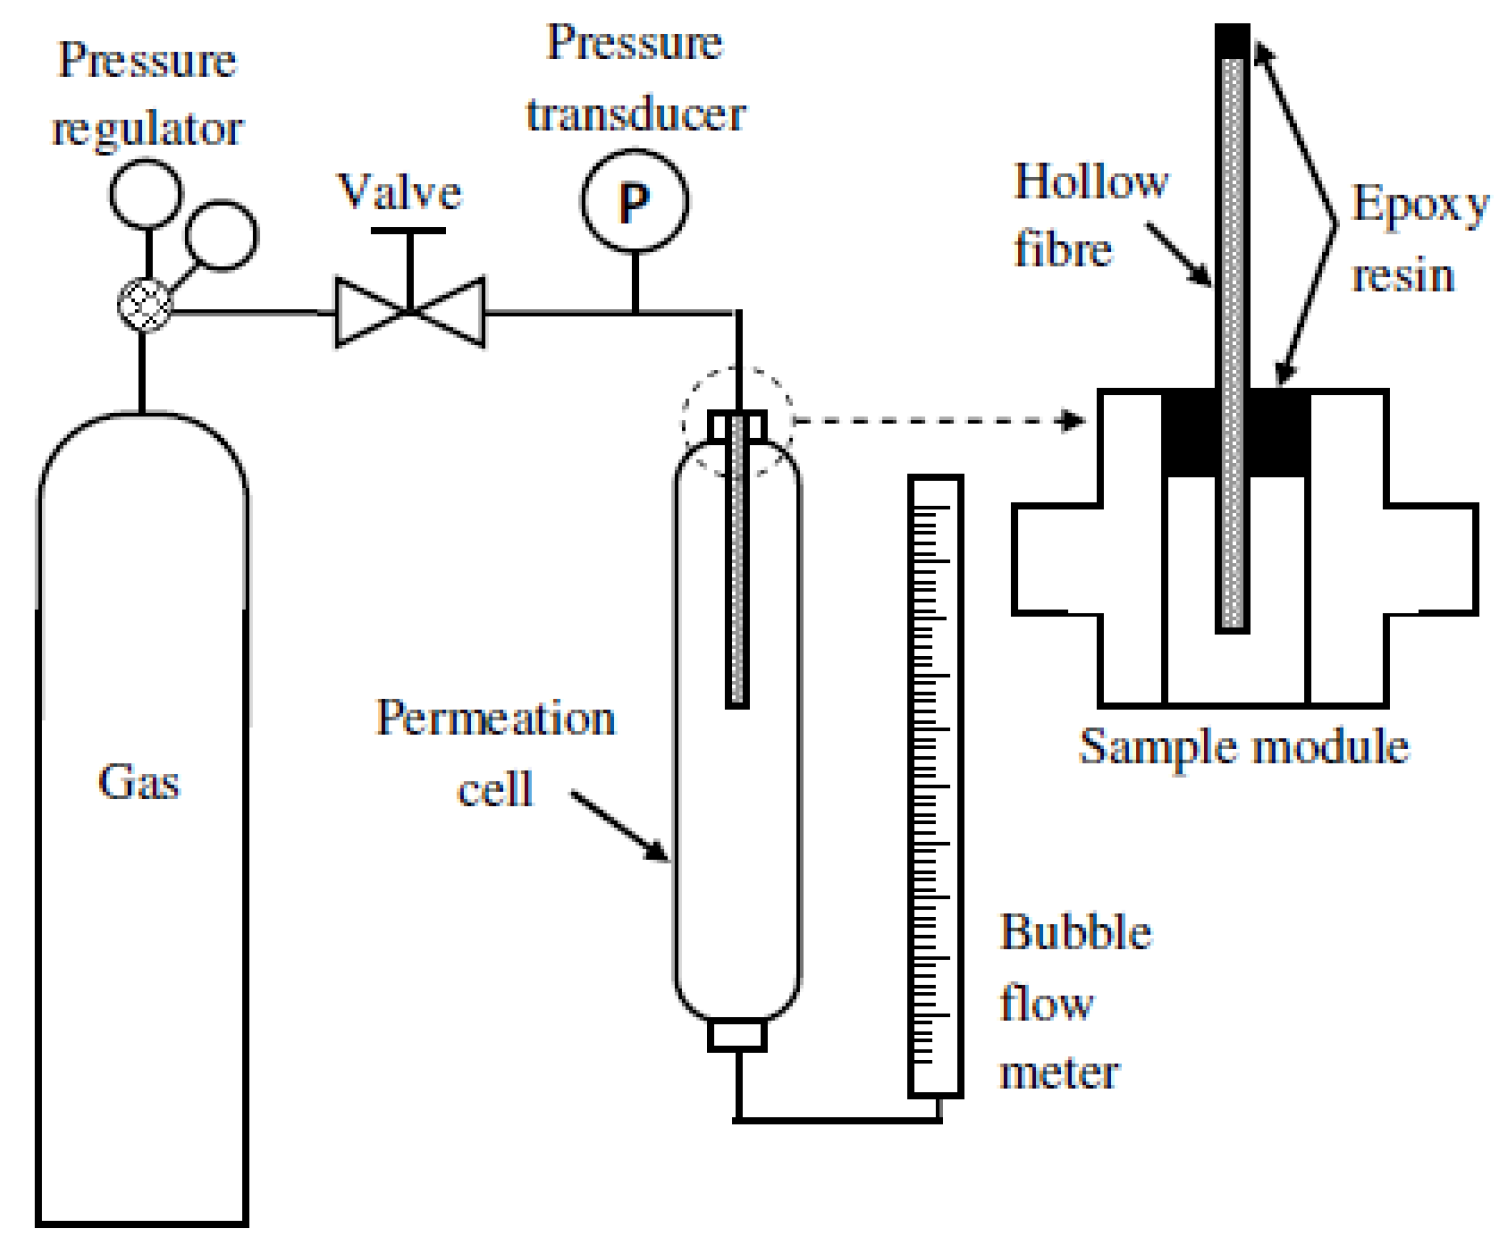
2.5. Performance Test

Finally, for the performance test, the ceramic DL-HF was coated with a cathode via a paint brush technique consisting of 3 layers where the first and second layers were 50% LSM and 50% YSZ, and the third layer was 100% LSM. The cathode material was prepared in suspension made of equal weight propylene glycol. The cell is sintered similarly as before but at 1250 °C sintering temperature.
To test for electrochemical performance, completed cells consisting of an anode, electrolyte and cathode were mounted onto the setup, as shown in Figure A4 in Appendix A. To perform this, silver wire was passed through the lumen or the anode side of the completed cells while another silver wire was wrapped around the cathode, as shown in Figure A4. The completed cells were mounted onto two alumina tubes at each end and sealed with a ceramic sealant (Aremco Ceramabond 552).
The anode collecting wire was connected to the WE/S electrode of PGSTAT as in the conductivity test, while the cathode collecting wire was connected to the RE/CE electrode. Fuel gas was passed through the lumen of the completed cells, while air was used as the oxidant on the cathode side. The cells were tested using H2 and CH4 gas at 10 mL min−1 at 700, 750, 800, 850 and 900 °C. At each fuel and temperature, maximum power density (MPD) was obtained by testing the cell for the current–voltage (I-V) curve. The completed cells were also tested for electrochemical impedance spectroscopy (EIS). From the EIS result, the ohmic resistance (Rohm) was obtained by measuring the distance on the real axis from 0 to the left side of the first semicircle on the Nyquist plot, and the charge transfer resistance (Rct) was measured as the diameter of the semicircle on the real axis. These values were subsequently plotted in the Arrhenius plot to investigate the activation energy (Ra) of the ohmic and charge transfer process.

3. Results and Discussion

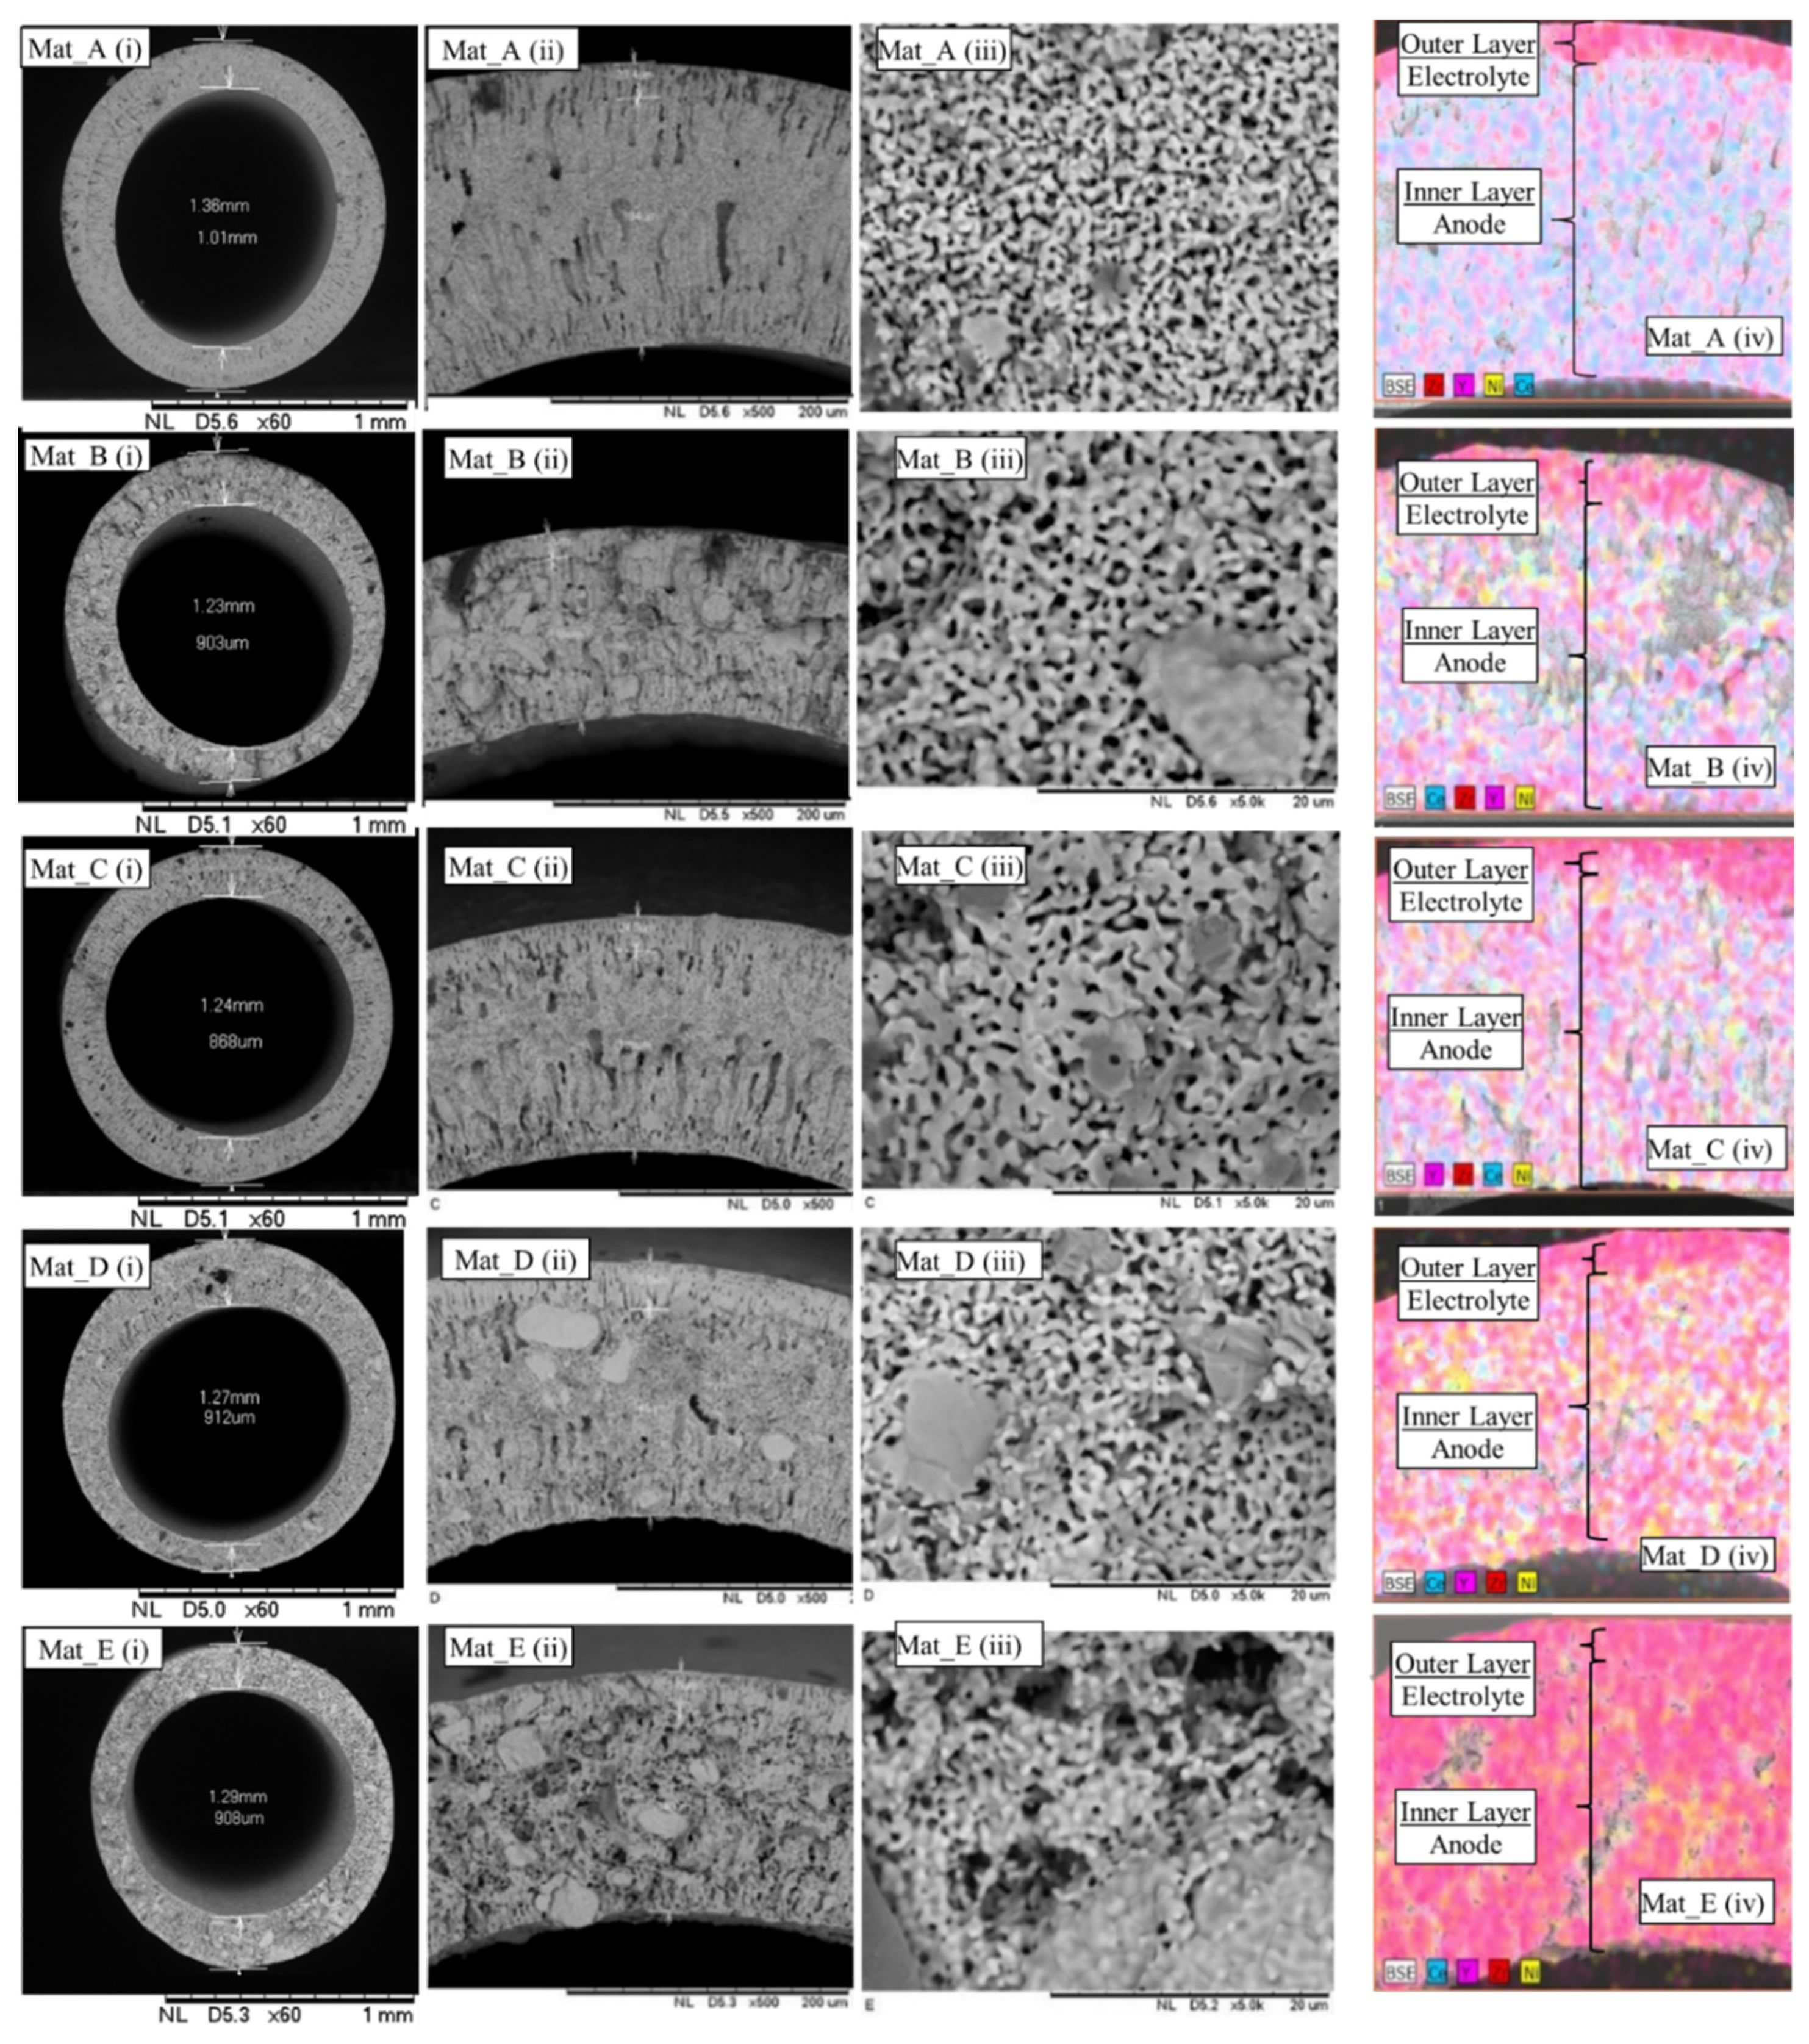
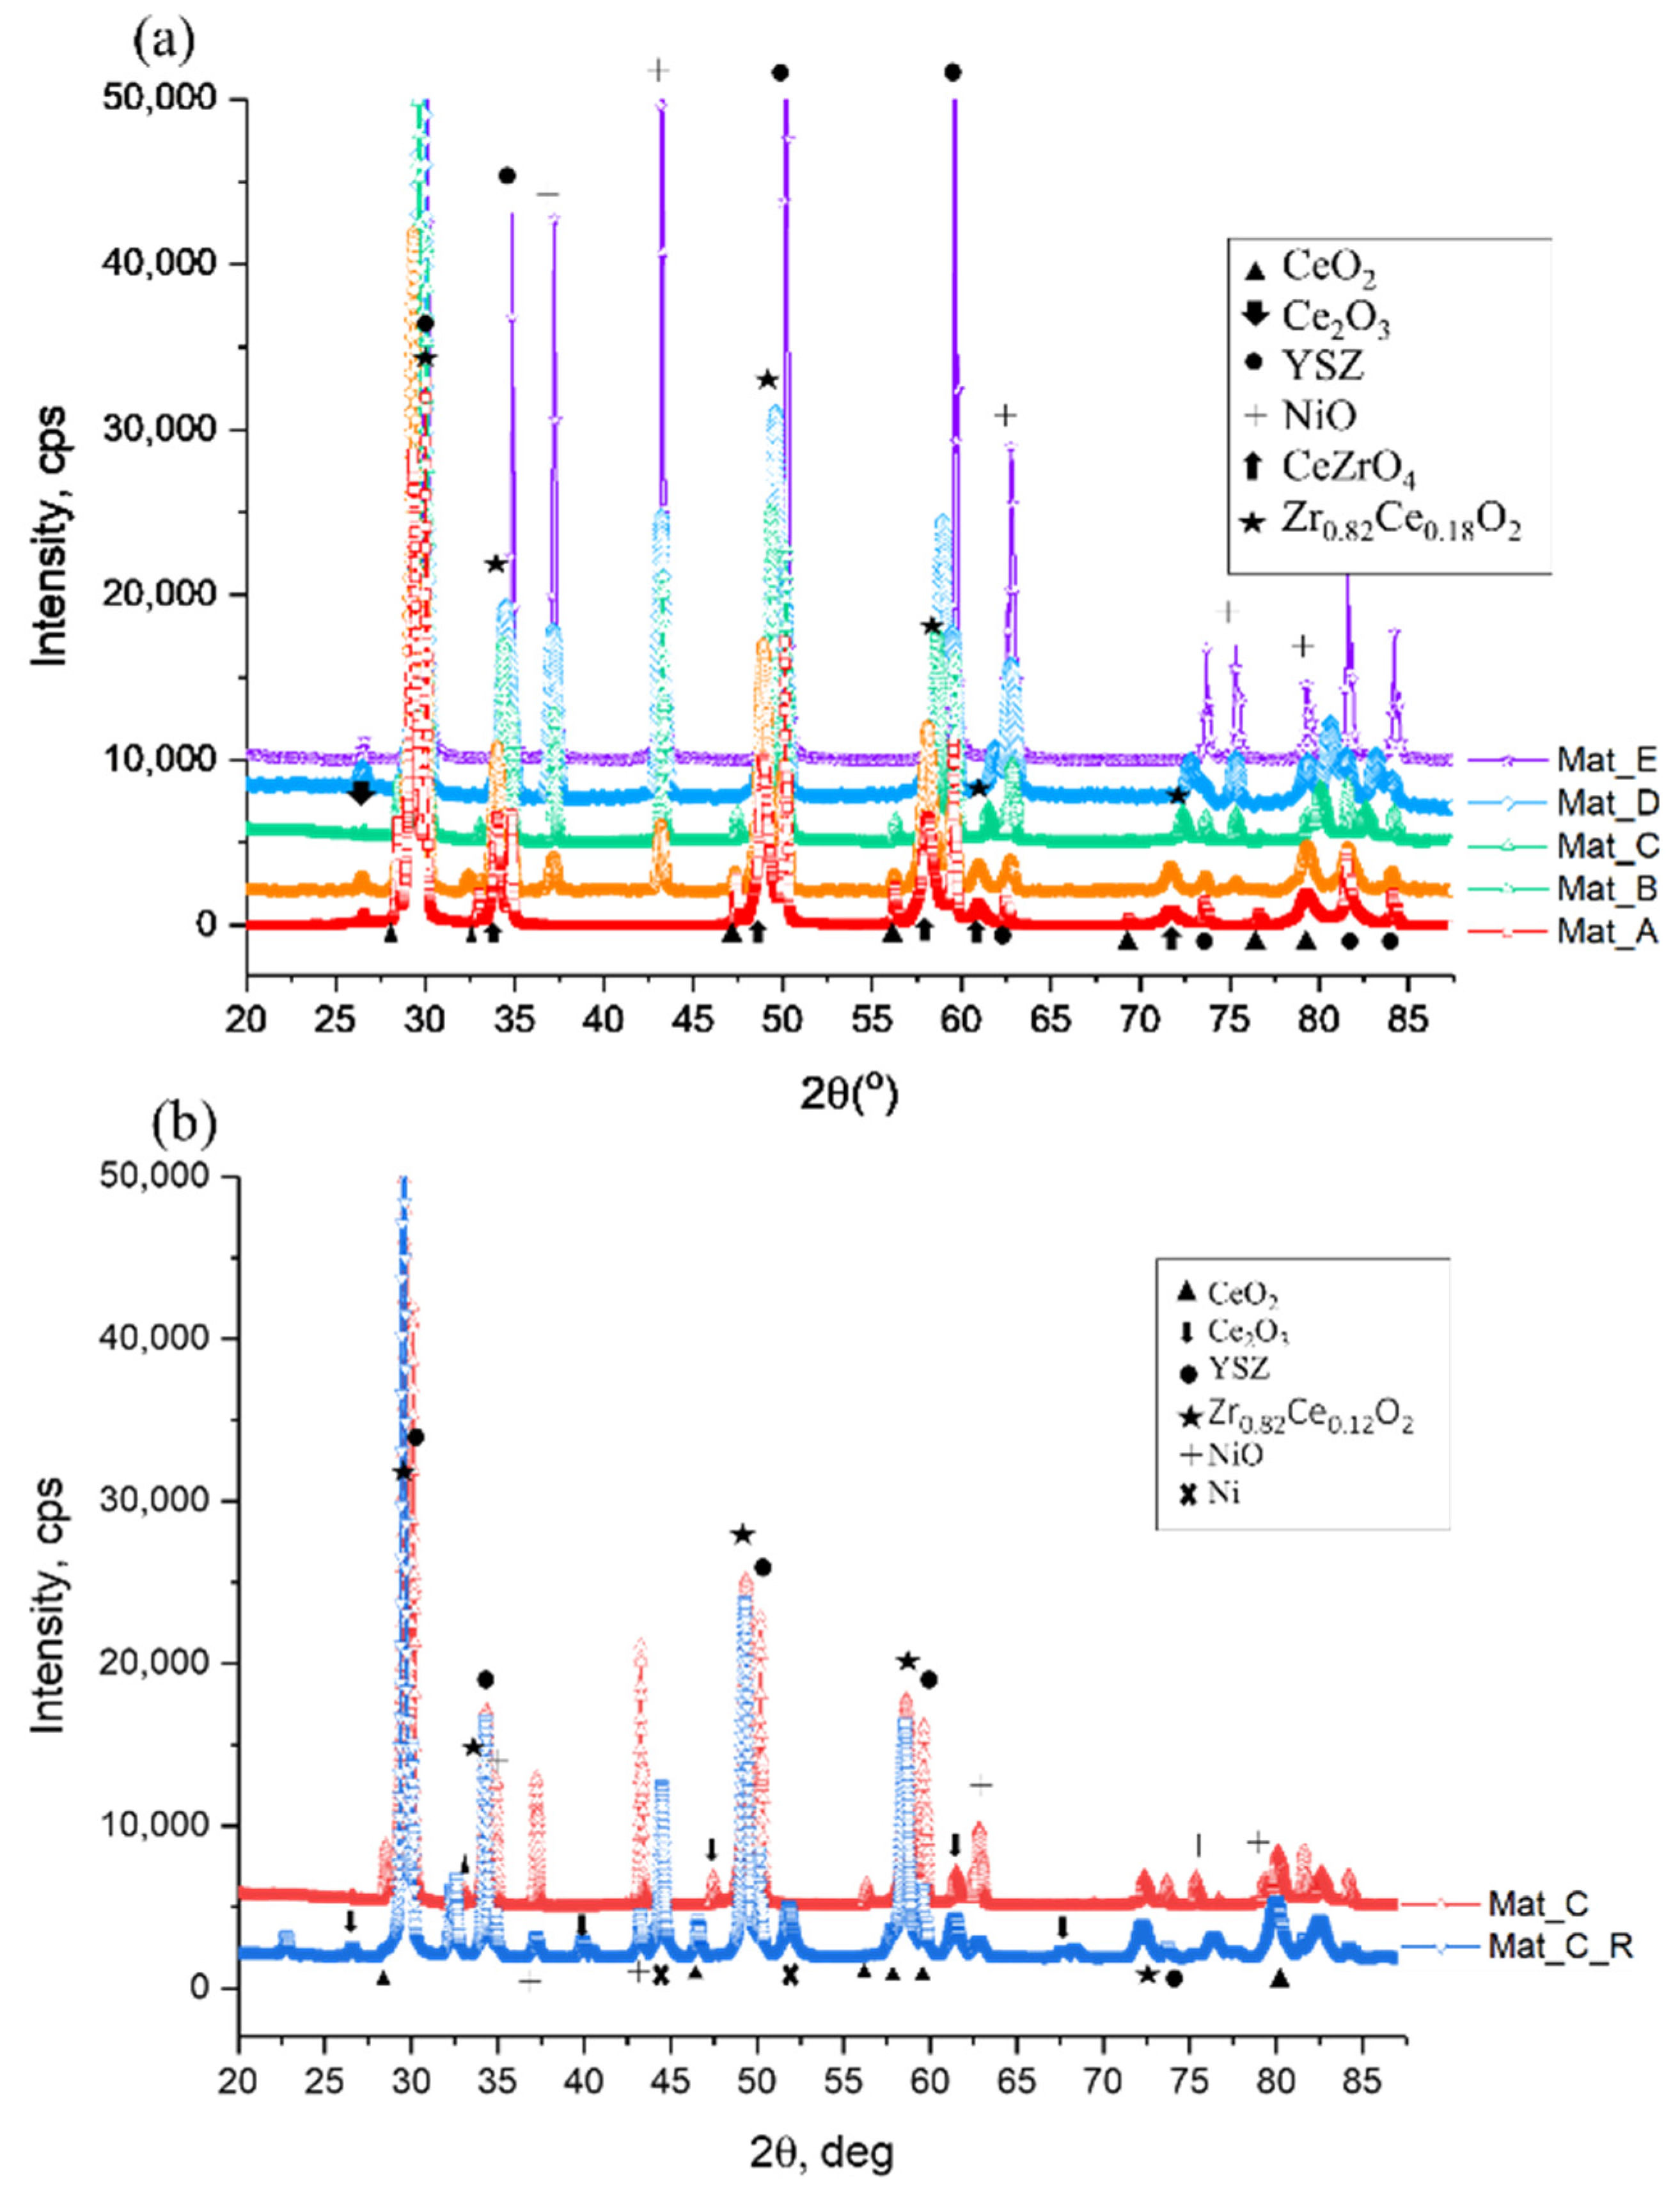
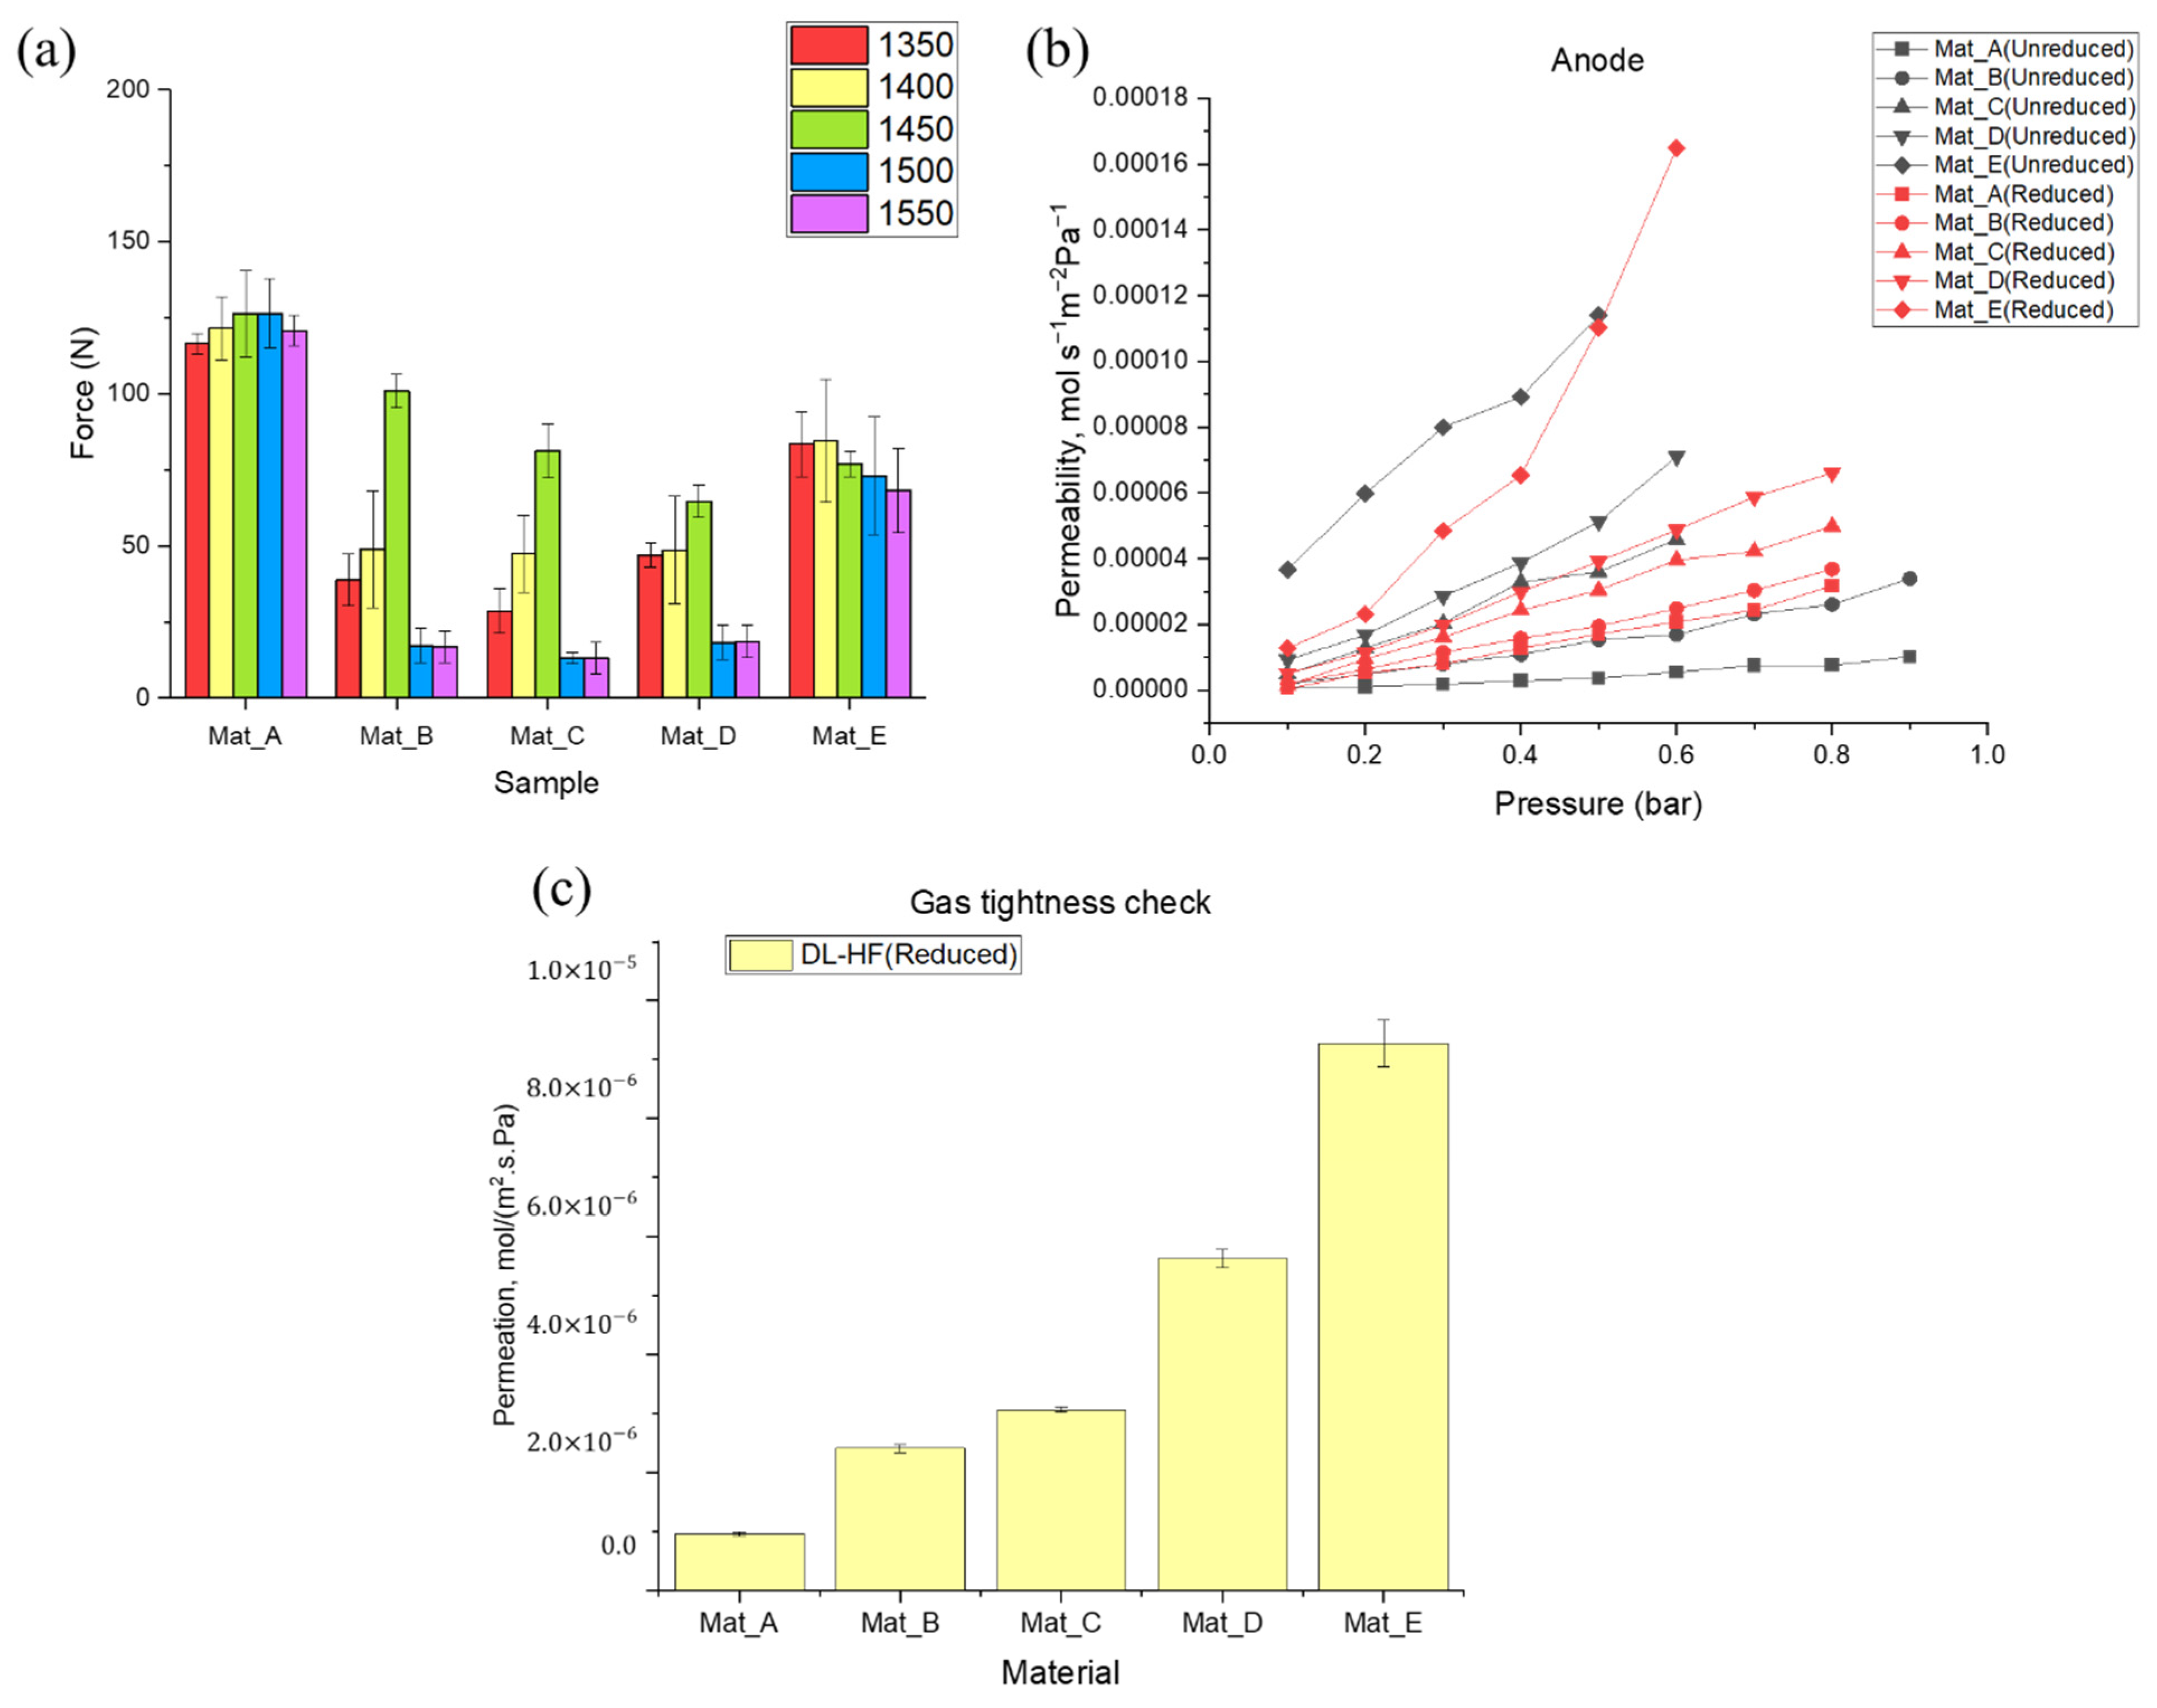
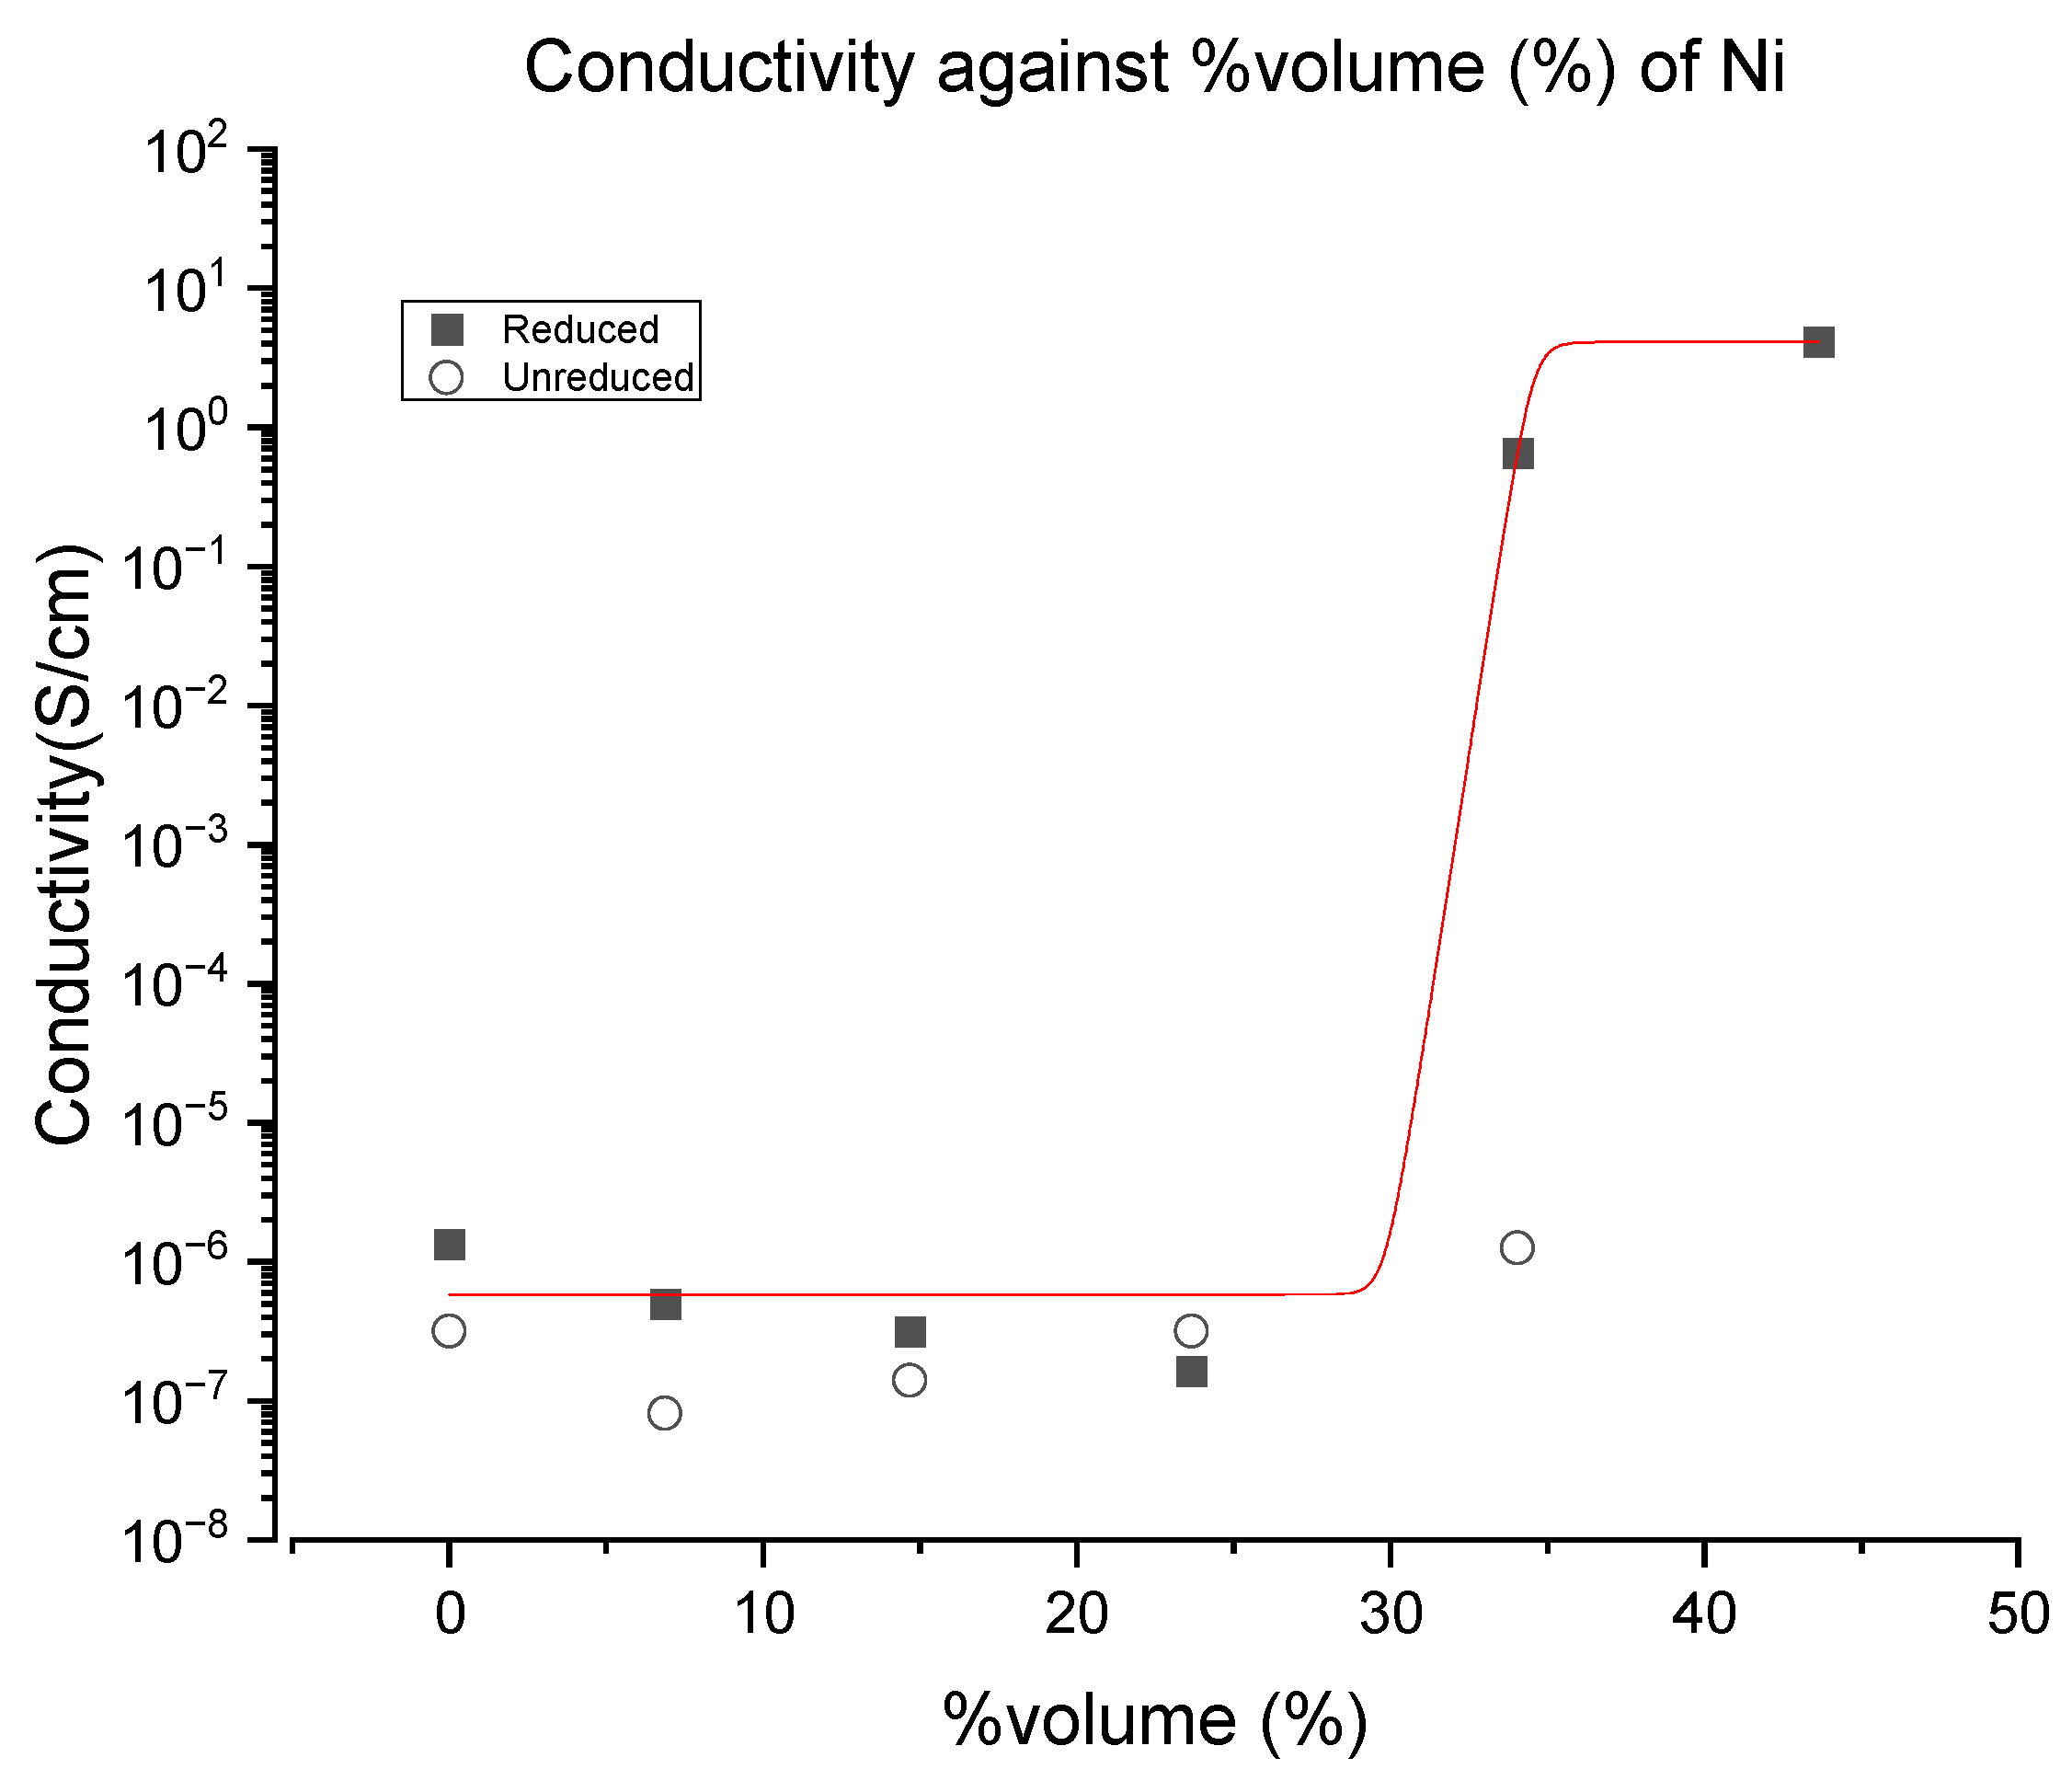
3.1. Morphology and Properties

SEM imaging and EDX mapping of the cross section of the ceramic DL-HFs are shown in Figure 1. Based on Figure 1i,ii, the finger-like voids were present in all of the DL-HFs. The finger-like voids have been observed and reported in all of the studies, producing hollow fibers using a phase inversion/co-extrusion method and Ni-GDC and Ni–YSZ [8,15]. Finger-like formation occurs due to the phase inversion process between the water-soluble phase in the internal and external coagulant phase and the solvent-polymer phase in the suspension. The movement of the solvent NMP from suspension into the water caused the remaining ceramic polymer to solidify. The affinity of the NMP towards water and ceramic-polymer determines the structure of the solid ceramic-polymer formed. Since different ceramic components are known to have different affinities towards NMP, different ceramic materials will cause different formations, sometimes with undesirable effects. However, in this study, it was found that a finger-like formation with a sponge-like structure is well-formed in the NiO–CeO2–YSZ anode and in the electrolyte. This geometry was formed since both the anode and electrolyte layers were in contact with water during the phase inversion process.
The finger-like formation created a large porose structure with a diameter of around 1 micrometer, while the sponge-like structure gave submicron porosity to the structure. Based on Figure 1i, the average DL-HF obtained have diameters ranging from 1.23 to 1.36 mm with lumen from 0.868 to 1.01 mm. The electrolyte thicknesses ranged from 23.4 to 27 µm, which was preferable since the reduced thickness ensures lower resistance towards the flow of oxygen ions [16].
High magnification images of 1500× were taken for all of the fibers, as shown in Figure 1iii, to examine the morphologies at the grain level. Large chunks of matter were found to present increasingly in size from Mat_A to Mat_E in the anode layer. EDX mapping, as shown in Figure 1iv, shows that the large chunks consist mainly of Y and Zr elements. Thus, it was found that the YSZ had sintered and agglomerated into larger chunks as the content of NiO increased (or CeO2 decreased). Based on XRD results in the next section, YSZ was found to form a new phase with CeO2 forming multiple ceria–zirconia phases. In low NiO content or high CeO2 content, the YSZ formed a uniform ceria–zirconia structure without large chunks of YSZ. However, in high NiO content or low CeO2 content, the YSZ agglomerated together to form a larger YSZ structure.
An X-ray diffraction study on unreduced Mat_A, Mat_B, Mat_C, Mat_D and Mat_E is shown in Figure 2a. Based on Figure 2a, in Mat_A (50% YSZ, 50% CeO2 anode), the XRD result shows a major peak of YSZ and CeO2, whilst the minor peaks of the phases of ceria–zirconia (CeZrO4) are present as found using the database search. The major sharp peaks of YSZ were expected to come from the electrolyte and anode layers. Little of the CeO2 content, however, was found to enter the lattice of the ZrO2 in YSZ to create the ceria–zirconia compound. This event was observed when zirconia and ceria were present and sintered at high temperatures in another study [17]. In Mat_E, however, the NiO and YSZ mixture was not found to produce another phase, as shown in Figure 2a (50% YSZ, 50% NiO anode).
It is interesting to note that two types of ceria–zirconia phases were detected in each Mat_A, Mat_B, Mat_C and Mat_D, which are CeZrO4 and Zr0.82Ce0.12O2. The CeZrO4 found in Mat_A and Mat_B contain higher molar ratios of Ce compared to Zr0.82Ce0.12O2 found in Mat_C and Mat_D. Mat_A to Mat_C were also found to contain minority peaks of Ce(III) in the form of Ce2O3, as found by the database search. Such event was observed in a few studies, where sintering of CeO2 at short lengths of time tends to cause low oxygen content in the ceria compound, where the oxide from the CeO2 escaped, leaving more oxygen-deficient Ce2O3 behind [18]. The presence of Zr is also known to create the Ce(IV)/Ce(III) pair in the CeO2 compound [19]. The database search also indicates that the Y2O3 phase was present, showing the leaching of Y2O3 out of the YSZ phase. Since the ceria–zirconia phase was also detected, this result might suggest that the CeO2 has replaced the yttria in the YSZ material, which is also observed in other studies [20].
Two regions of interest are shown in Table 2. The region at 2θ of 47.5° corresponds to phase (2 0 2) of CeO2, while 50.2° corresponds to the (2 0 2) of ZrO2 in the YSZ used. Intermediate peaks found between these two peaks are 48.2° and 48.5°, corresponding to the phase (4 4 0) and (1 1 2) of CeZrO4 and Zr0.82Ce0.12O2 each. Thus, when the amount of CeO2 increases in a mixture of CeO2 and YSZ, sintering will produce a CexZr1−xO2 phase with a large x value, increasing the d-spacing in the process. A similar trend can be seen in 2θ of 56.3° and 59.6°. No insertion of NiO into the ZrO2 or CeO2 was found in any sample. This shows that, in the presence of the NiO–CeO2–ZrO2 system, the interacting materials are only between CeO2 and ZrO2, which made the system behave equally to CeO2–ZrO2.
XRD results of Mat_C and reduced Mat_C are shown in Figure 2b. Only results of Mat_C are shown here as it contains similar amounts of NiO and CeO2, and it can be used to represent the result of other SOFC since it contains all the ceria–zirconia species present in Mat_A and Mat_E. Upon reduction with H2 gas, Mat_C produced Ni metal together with decreasing peaks of CeO2 and increased peaks of Ce2O3. The increased amount shows that not only the NiO reduction occurred but the reduction of Ce(IV) to Ce(III) also took place in the sample. This phenomenon is well-known to occur in the operation of CeO2 in a highly reducing environment, where the usage of electrolytes is unfavorable to the n-type conductivity gained in the Ce(IV)–Ce(III) mixture [21]. However, the existence of the Ce(IV)–Ce(III) mixture was suggested by few studies to actually have higher catalytic activity towards oxidizing hydrocarbon compared to Ce(IV) alone [22,23]. The increased electronic conduction and different oxidation state might give more electron and oxide ion mobility to the mixture, causing it to perform a better oxidation reaction.
Figure 3 shows the results for the mechanical testing. The bending strength is shown in Figure 3a for Mat_A to Mat_E from sintering temperatures of 1350 to 1550 °C. This temperature range was chosen based on the optimal sintering temperature of CeO2 and YSZ [24,25]. The bending strength of Mat_A was shown to be the highest in all temperature ranges compared to the other DL-HF.
The bending strength of Mat_A reached the optimal point at sintering temperatures from 1450 to 1500 °C before declining, while the bending strength of Mat_B, Mat_C and Mat_D achieved optimal strength at a temperature of 1450 °C before significantly dropping at 1500 °C. Mat_E achieved optimal bending strength at 1400 °C, before declining slowly. Mat_E with 50% NiO–50% YSZ, nonetheless, has relatively similar bending strength from 1350 to 1550 °C, which is expected since YSZ is known to exhibit almost similar density over 1350 °C sintering temperature [25]. The rate of shrinkage of YSZ also increases as the sintering temperature increases, which might further explain this observation [25].
Mat_A (50% CeO2, 50% YSZ) was found to achieve optimal strength at a slightly higher temperature compared to Mat_E (50% NiO, 50% YSZ). From an XRD perspective, the diffusion of CeO2 into the ZrO2 lattice producing the ceria–zirconia compound was found to produce a ceramic with a higher strength compared to YSZ alone in Mat_A (no diffusion of NiO was observed).
Low mechanical strength in the mixture of the CeO2–Ni anode (Mat_B, Mat_C, Mat_D) was observed at all temperatures. At the low temperature of 1350 °C, mechanical strength decreases from Mat_A to Mat_C and increases back to Mat_E. For sintering temperatures from 1350 to 1550 °C, the lowest mechanical strengths are all in Mat_C. The low mechanical strength may possibly be attributed to the presence of different types of ceria–zirconia compounds found in this membrane (and also in Mat_B and Mat_D) compared to Mat_A. Since Mat_E did not have these Zr0.82Ce0.12O2 compounds, it is possible that the compound actually reduces the mechanical strength of the ceramic DL-HF. The same trend was also found in Mat_D, as this sample contains these Zr0.82Ce0.12O2 compounds as well. Higher mechanical strength in Mat_A compared to Mat_E, however, indicates that CeZrO4 actually gives larger mechanical strength. The authors of [24] noted that the increase in gadolinium-doped ceria (GDC) content in YSZ induces the shift in oxide peak plane in the XRD content, signifying possible dissolution of CeO2 into the ZrO2 [26]. The dissolution may create a denser CeO2–ZrO2 structure as compared to YSZ [20]. A study on the GDC–YSZ system shows that as the YSZ component increases, even though the coefficient of thermal expansion (CTE) increases, the chemical expansion is actually higher in the GDC–YSZ mixture compared to GDC or YSZ alone [27]. NiO–YSZ was shown to have a CTE from 10.3 × 10⁻⁶ (pure YSZ) to less than 14 × 10−6 K−1 (60% NiO:40% YSZ) [28], which is different from the CTE from 13.2 × 10⁻⁶ to 14.7 × 10⁻⁶ K−1 in the ceria–zirconia system [29]. Low mechanical strength experienced in the mixture might be the result of the CTE mismatch between ceria–zirconia species and NiO–YSZ material.
Gas permeability across the anode is given in Figure 3b. Gas permeability is the lowest in Mat_A and increased from Mat_A to Mat_E. This property suggests that the higher the CeO2 content, the lesser the gas permeation. As observed in Figure 1ii, the low permeability is also caused by the lesser presence of finger-like formations in the anode of ceramic DL-HF [30]. The lower gas permeability in higher CeO2 content combined with the higher mechanical strength observed from Mat_C to Mat_A signifies that the presence of CeO2 or ceria–zirconia does not only yield a harder anode but also a less porous one. This might be explained by the smaller finger-like projection and more sponge-like porous structure obtained from Mat_E to Mat_A, as observed in Figure 1ii. The lack of a large porous structure in Mat_A resulted in lower gas permeability. Furthermore, at sintering temperatures above 1350 °C, the rate of shrinkage in YSZ is larger than the rate of shrinkage in the ceria–zirconia structure [31].
Gas permeability was found to increase after reduction by H2 gas. This is expected as when the NiO was reduced to Ni, volume shrinkage occurred, causing enlargement of pores and hence higher gas permeation. However, it is also to be noted that even though Mat_A contains no NiO, reduction elevates the gas permeability as well. This is caused by a reduction of Ce(IV) to Ce(III) or from CeO2 to Ce2O3, as observed in XRD, which similarly leads to volume shrinkage and higher gas permeation. Similar trends of gas permeability are also observed in the gas tightness test, as shown in Figure 3c. We expect that the explanation of the behavior of the gas tightness check of the electrolyte is similar to the gas permeation in the anode. Since the thickness of the electrolyte was the same in all samples, the gas tightness of the electrolyte was found to be affected by the gas permeation rate through the anode in this study.
The anode conductivity obtained is shown in Figure 4. The conductivity of the Ni-containing anode shows percolation was achieved at above 30% Ni by volume, which is Mat_E (50% NiO by weight). Lowering the content of NiO to below 50% NiO will lead the conductivity to drop by a magnitude of six, as observed in Mat_D. This is similarly reported in early studies [32]. It is important to note that the conductivity obtained was lower than that reported in the literature, which is due to different methodologies. The conductivity, as reported in other studies, was measured by pressuring the sharp probe onto the anode surface and is only applicable since the geometry of the SOFC is planar. Here, the same methodology cannot be used due to the tubular geometry, and less pressure is able to be applied to the lumen of the tubular SOFC. Nonetheless, a large jump in conductivities is observed as in other studies, showing the good reliability of our method.
Anode conductivity is crucial in the performance of SOFC, and low anode conductivity has been shown to correlate with lower performance. Low conductivity is expected in this study due to the low content of Ni. However, since Ni is also known to cause coking, a negative effect of lowering the Ni content was offset with the addition of CeO2, which was known to provide conductivity upon reduction. It is interesting to note that the conductivity of Mat_A is slightly higher than the conductivity of Mat_B. A similar trend was also observed in the GDC–YSZ system, where it was found that the conductivity of pure GDC and YSZ is higher than the mixture of GDC–YSZ [20]. Another explanation for the higher conductivity is possibly due to the denser packing structure in Mat_A compared to Mat_B, as shown in the SEM imaging in Figure 1. A denser structure allows for a better conductance path of electrons and hence higher conductivity [33].

3.2. Fuel Cell Performance

Fuel cell performance testing was performed at 700, 750, 800, 850 and 900 °C. The temperature of 700 °C was selected as the lowest temperature for testing since the YSZ electrolyte was found to have lower performance below this point [2]. High operating temperatures are expected to yield better performance for SOFC operating in hydrocarbon fuel since higher temperature ensures operation in the hydrocarbon reforming area [34]. Nonetheless, in this setup, we would like to test the effect of CeO2 as an oxidizing catalyst in SOFC without depending much on the reforming process; thus, 900 °C was selected as the highest operating temperature to be tested.

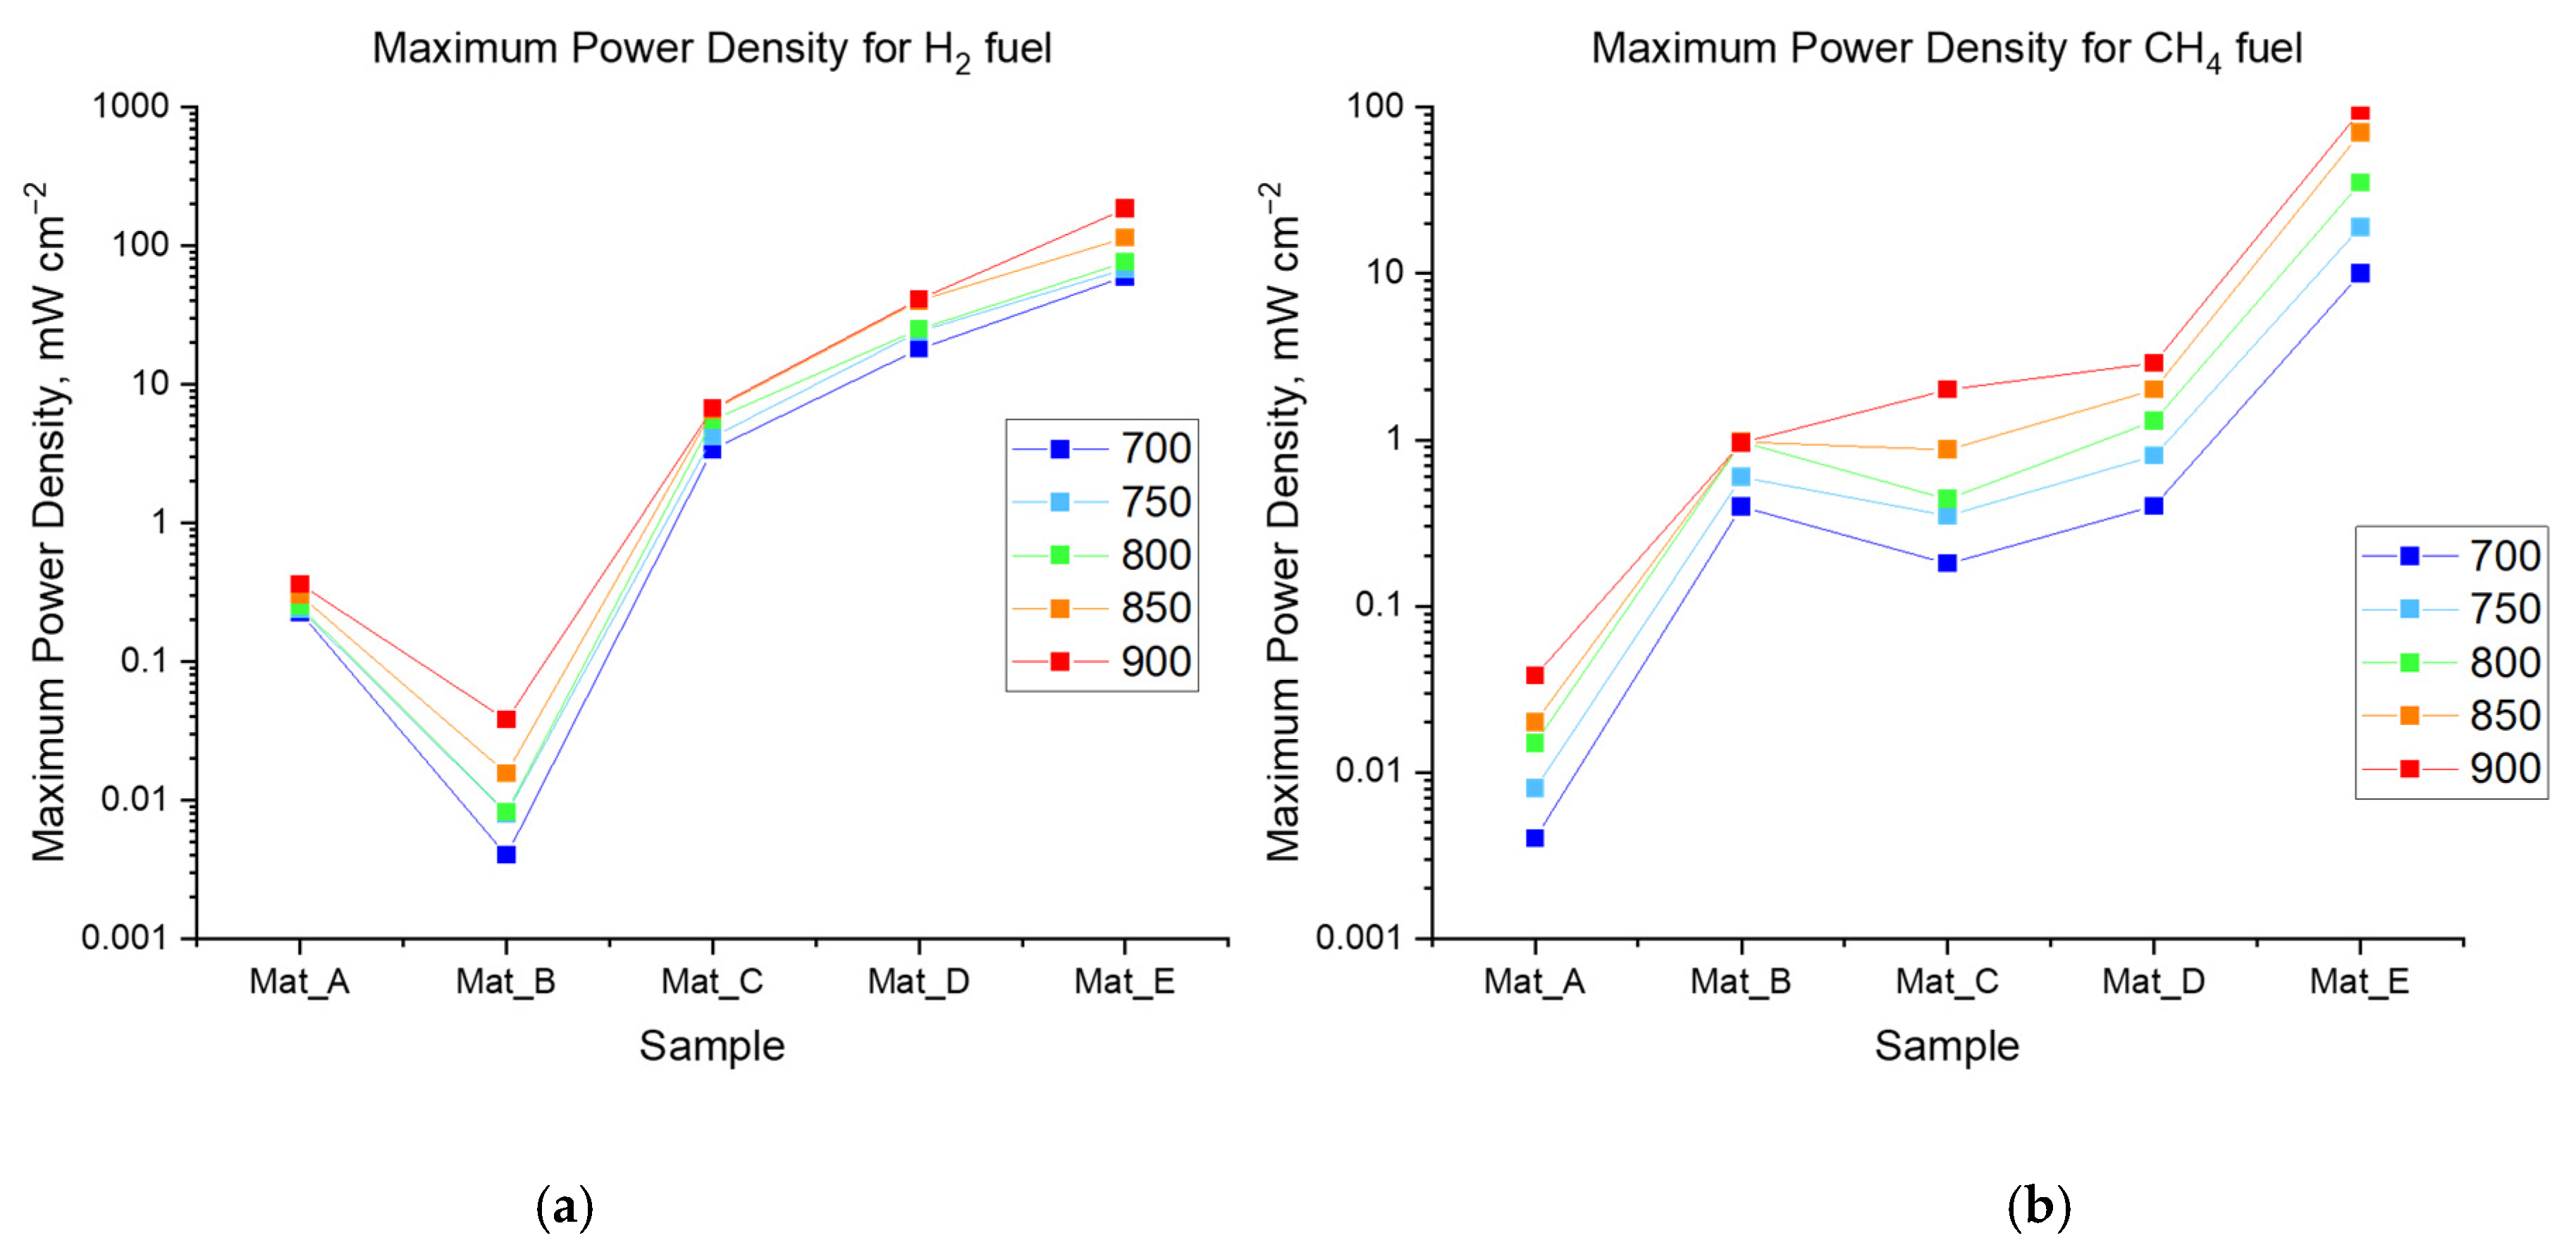
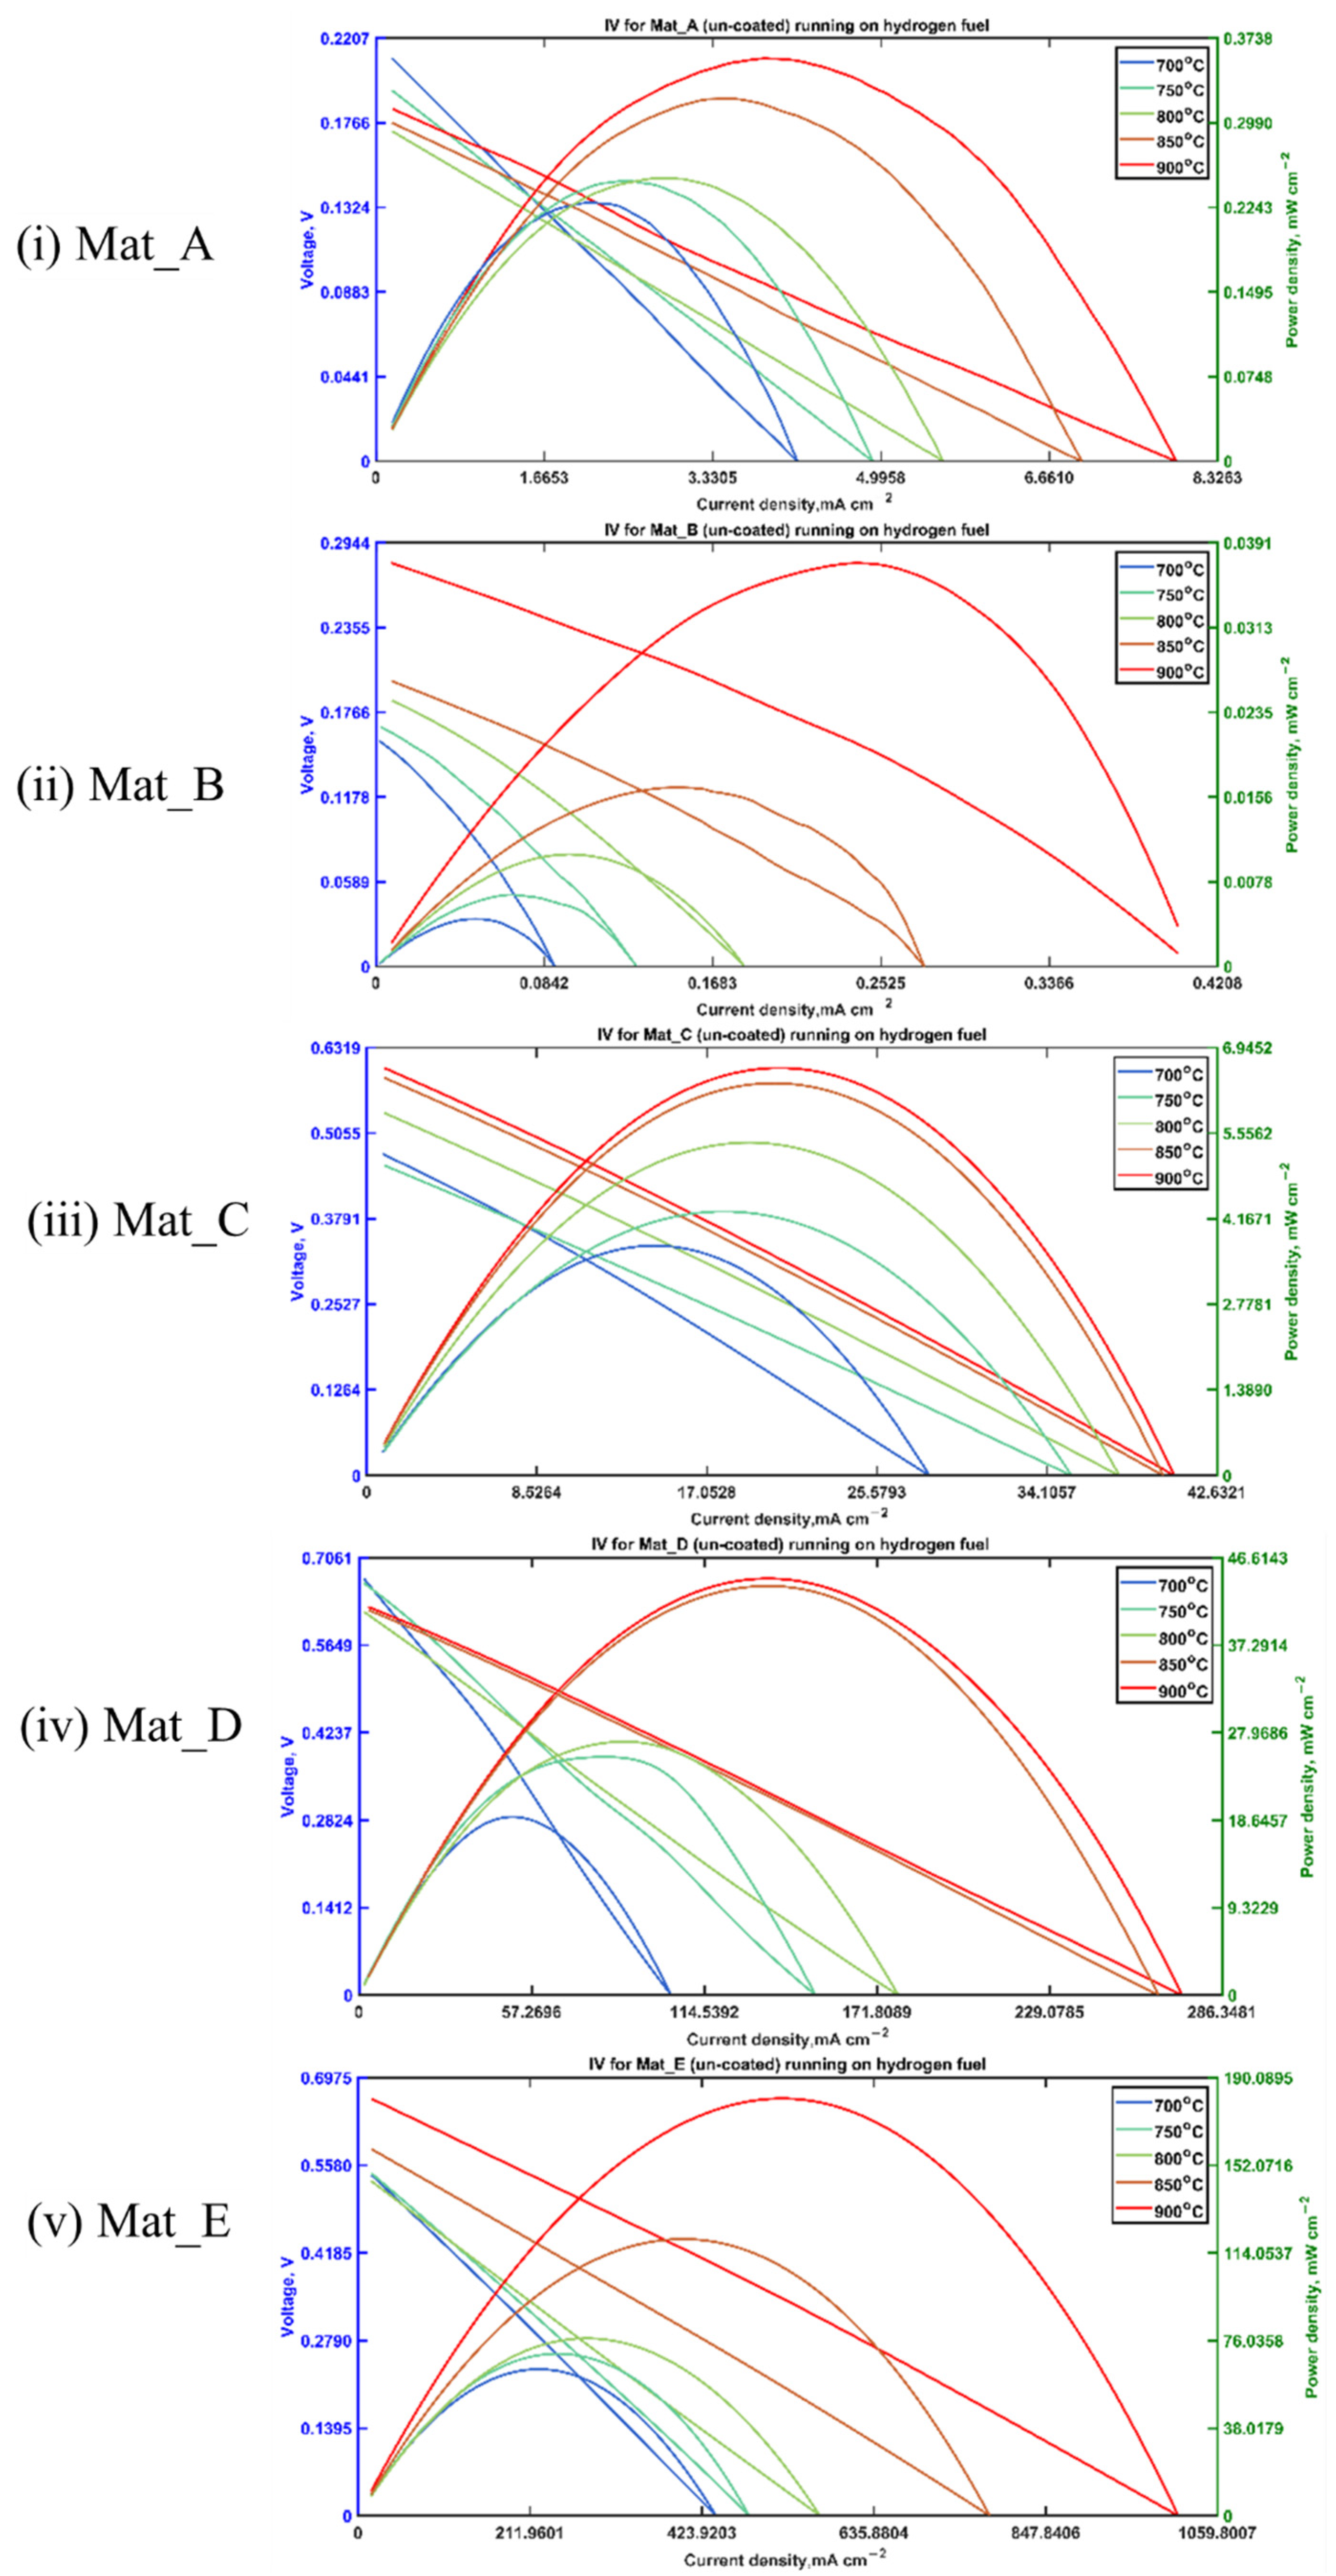
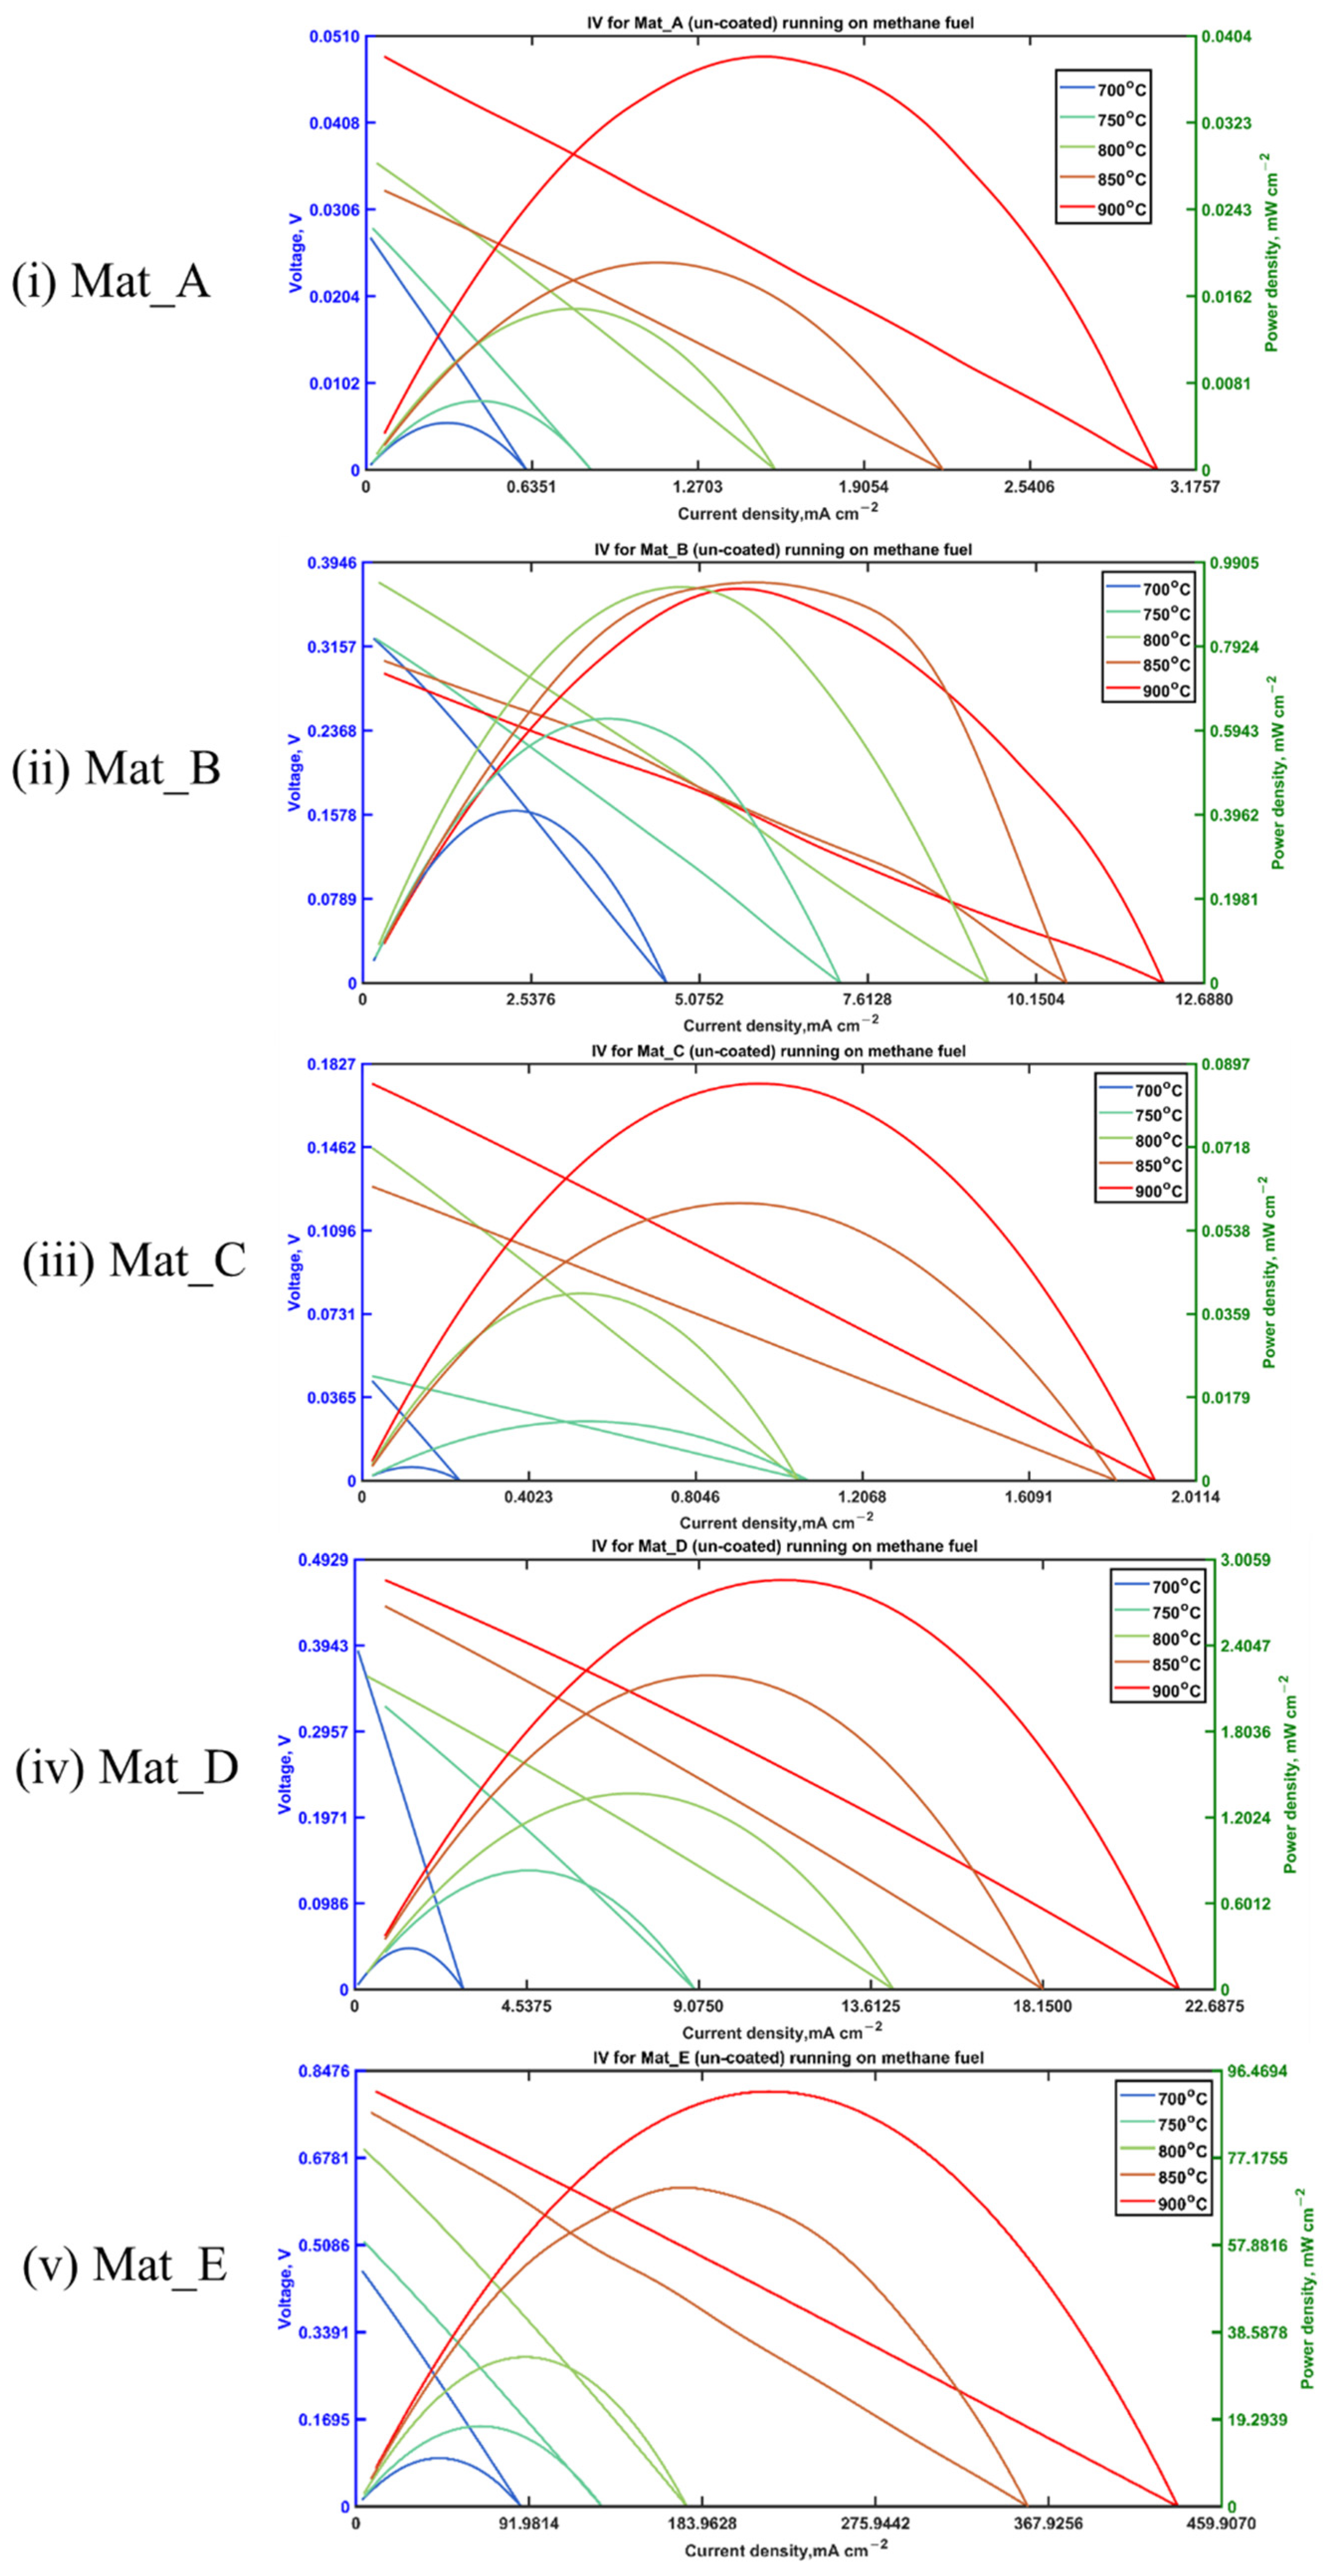
3.2.1. Power Density Analysis (I-V Diagram)

The current–voltage (I-V) diagram and power measurements are given in Figure A5 and Figure A6, and Electrochemical Impedance Spectroscopy (EIS) is given in Figure A7 and Figure A8 in Appendix A for each H2 and CH4 fuel.
For I-V measurements, generally, when run in H2 fuel, the MPD increased as the operating temperature increased, which is typical in YSZ-type cells for this operating temperature range. The MPD for SOFC running on H2 and CH4 is summarized in Figure 5. The MPD was found to unexpectedly drop from Mat_A to Mat_B and rise back again from Mat_B to Mat_E. The increment observed from Mat_B to Mat_E signifies that Ni presence is crucial in SOFC operating in H2 fuel, in which it acts as a catalyst and conductor. Nonetheless, Mat_A was found to have a higher MPD than Mat_B despite having no Ni content at all. The low catalytic activity of CeO2 in oxidizing H2 was well understood and explained by Density Functional Theory (DFT) modeling, which was shown to be inferior compared to Ni [35]. Therefore, this high MPD might be possibly explained by the presence of Ce(III) and possibly the ceria–zirconia compound as well, where both were shown to be able to function as an oxidation catalyst [36,37]. Apart from that, the presence of a large amount of CeO2 in Mat_A compared to Mat_B might yield more Ce(IV)–Ce(III), increasing the anode conductivity and giving a slightly better performance [21]. This slightly higher conductivity can be observed in Figure 4.
It is interesting to note that even though Mat_D has conductivity below the threshold value, the MPD values of Mat_D (41 and 2.9 mW cm−2 at 900 °C in H2 and CH4 each) are relatively near to that of Mat_E (185 and 95 mW cm−2 at 900 °C in H2 and CH4 each) compared to that of Mat_C (6.7 and 2.0 mW cm−2 at 900 °C in H2 and CH4 each). Since Mat_D contains 12.5% less NiO content than Mat_E, Mat_D can be considered as a promising low-nickel-content anode to be used.

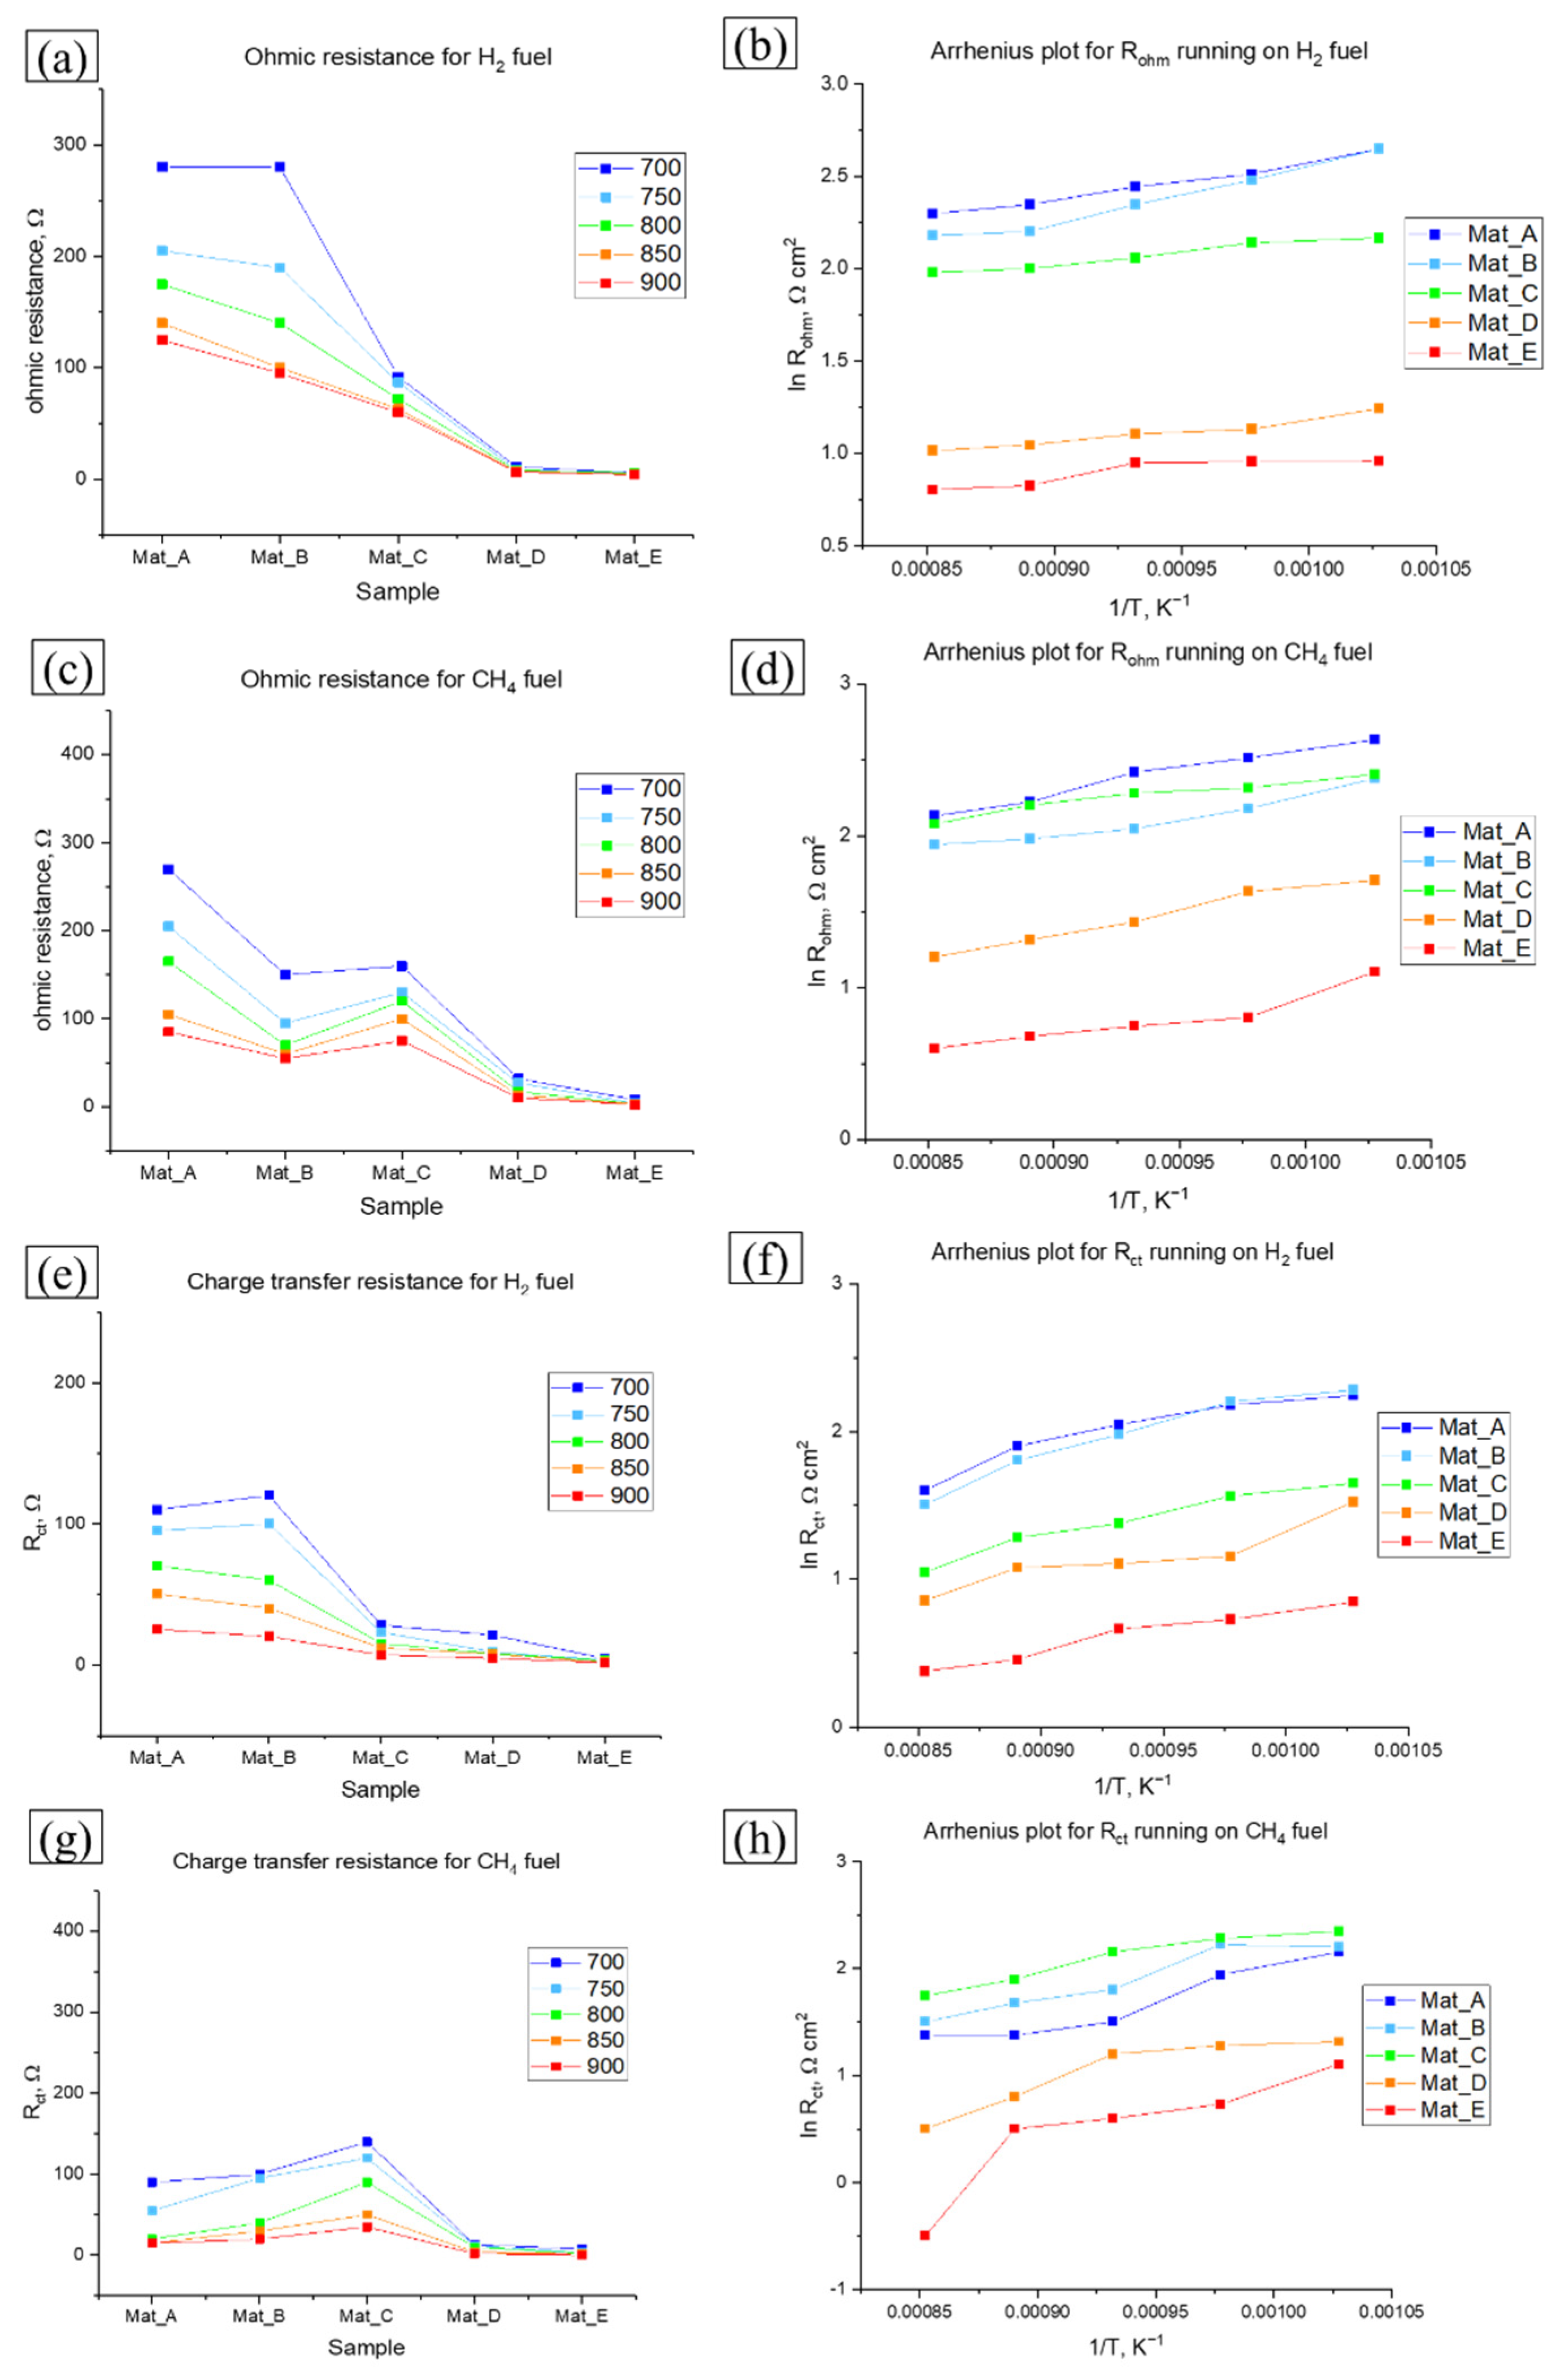
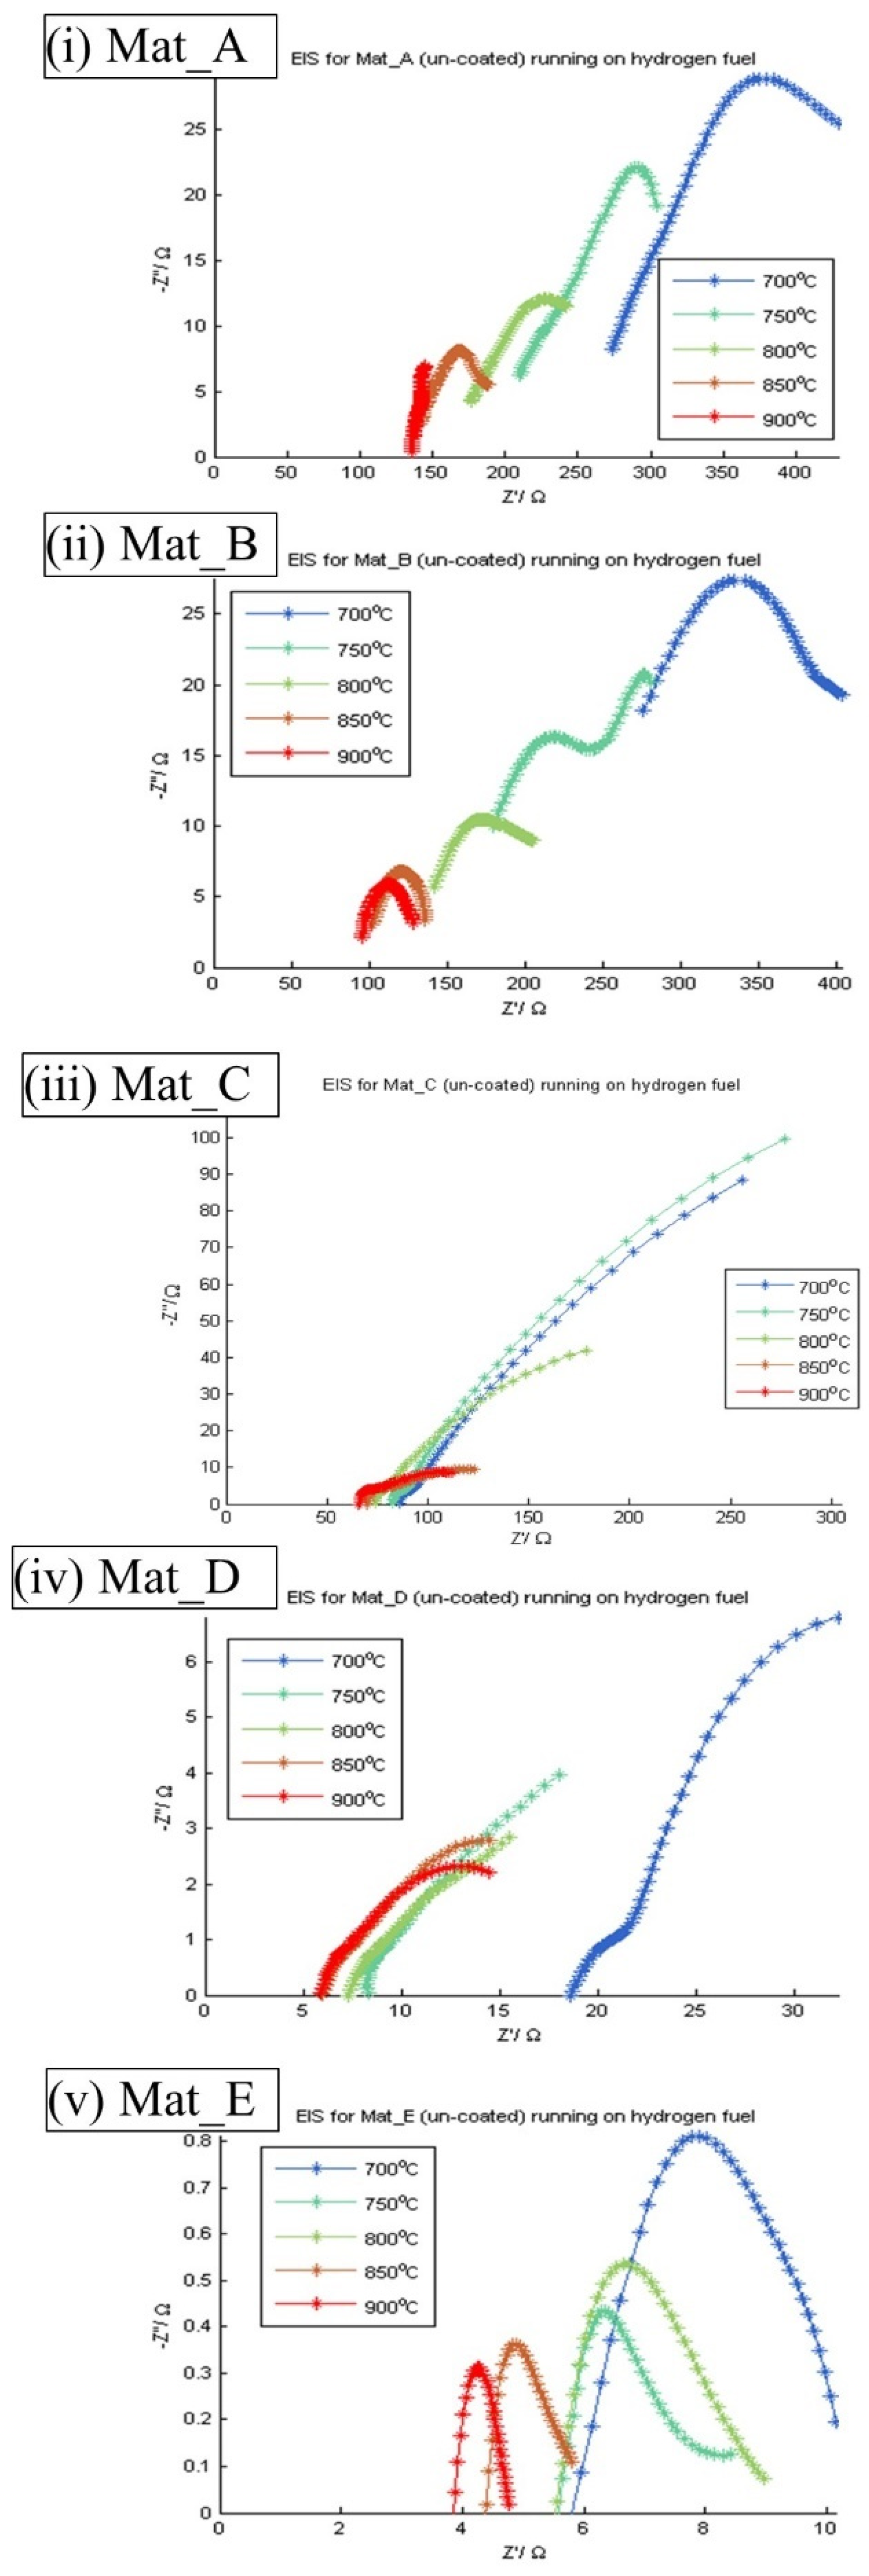
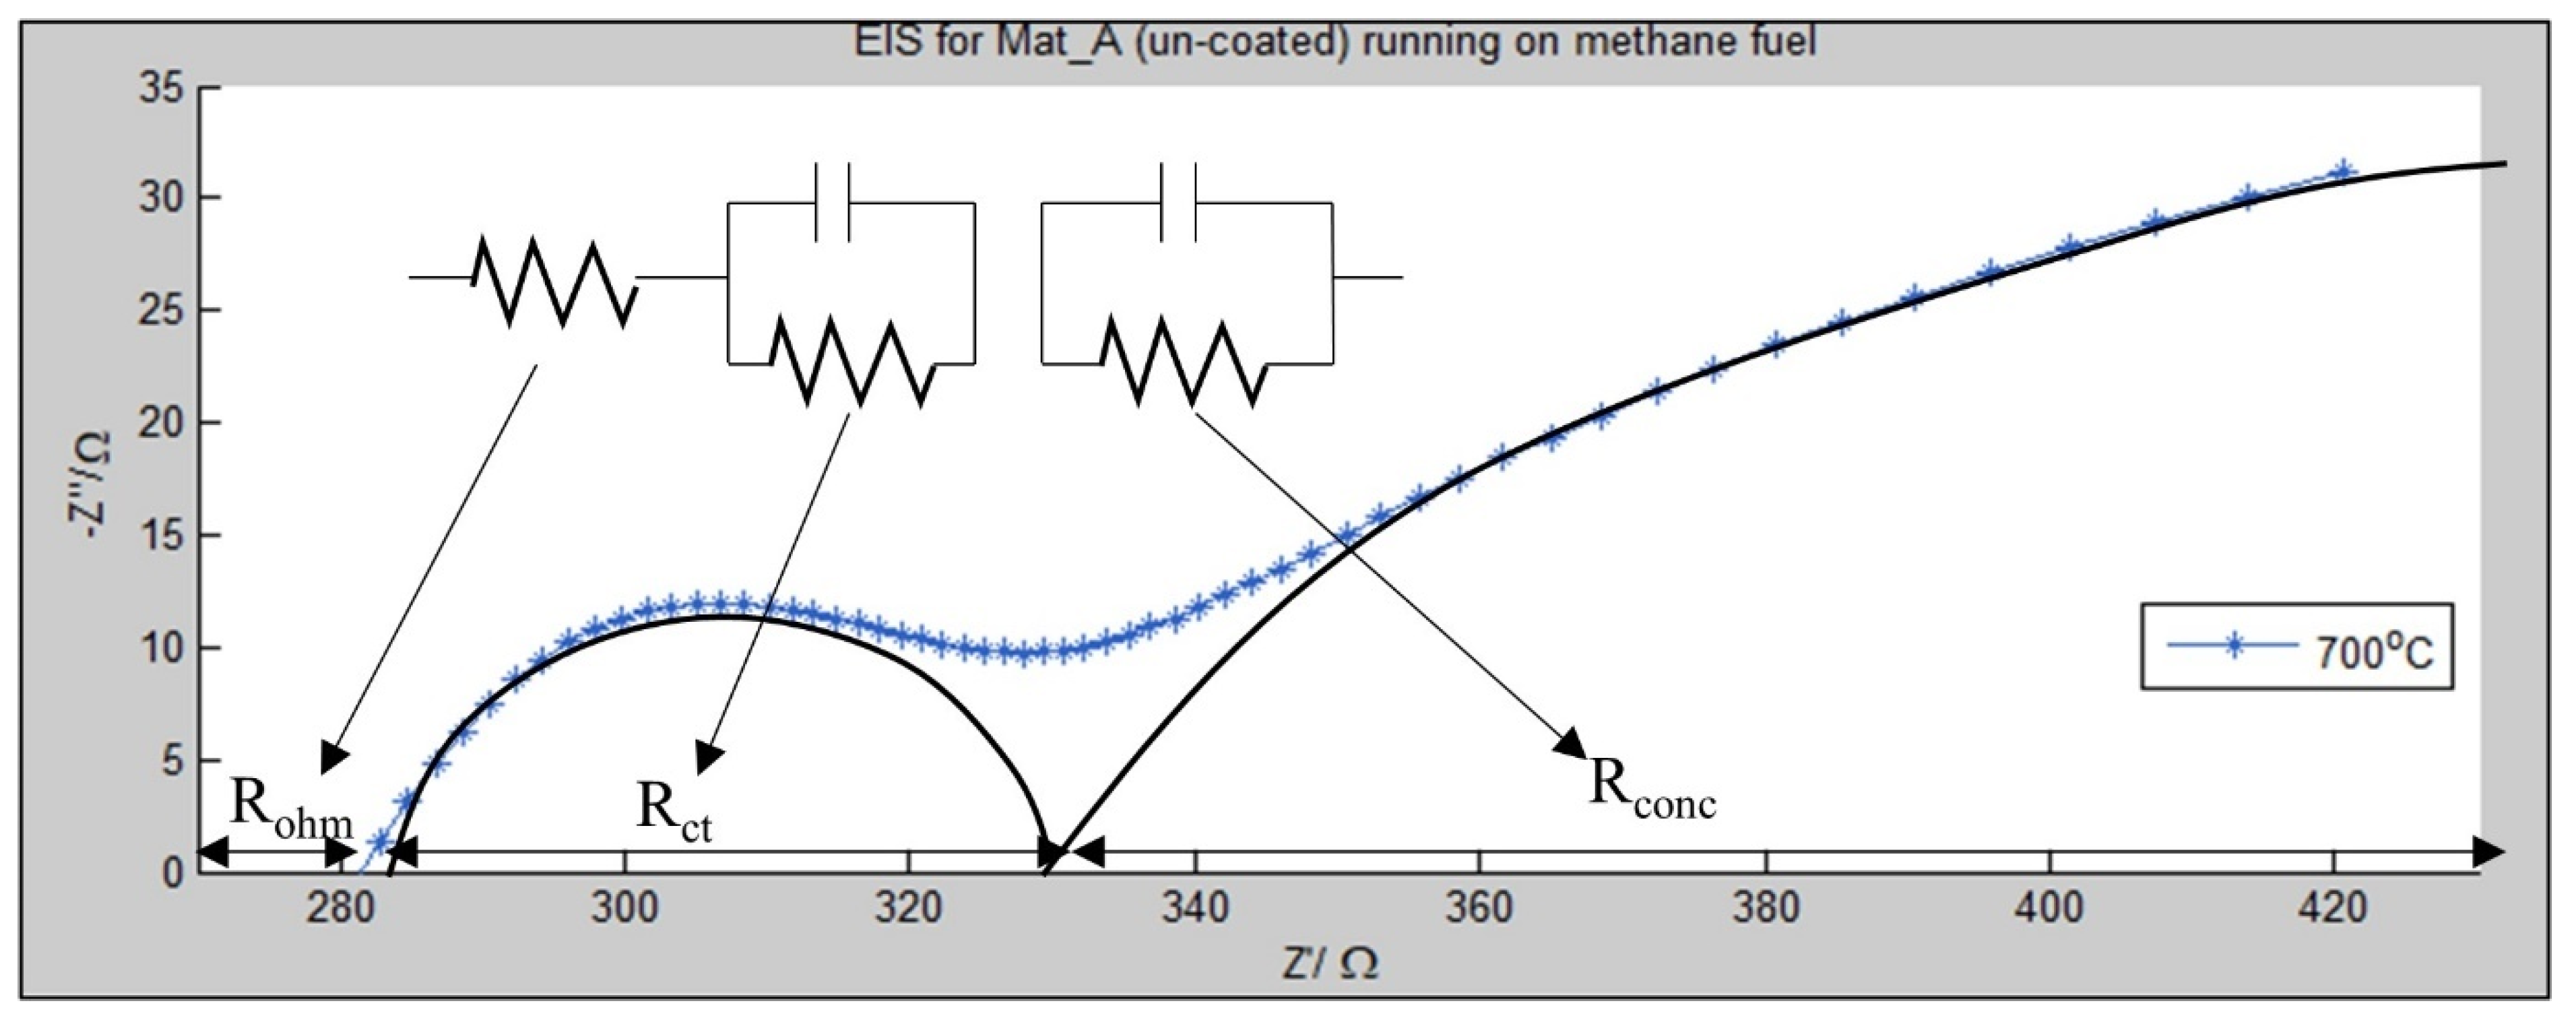
3.2.2. Electrochemical Impedance Spectroscopy (EIS)

When run on hydrogen fuel, generally the impedance for all of the samples decreases as the temperature increase. This is a typical characteristic of ohmic resistance due to resistance towards oxide ion movement through the electrolyte [20]. As ionic conductivity of YSZ increases as the temperature increases, the ohmic resistance drops as the operating temperature increases, as ionic conductivity is a temperature-activated process [38].
The impedance spectroscopy also shows characteristics of gas transfer limitations in SOFC with higher CeO2 content (Mat_A to Mat_C). This is observed with an increasing value of impedance at low frequency with the characteristic of 45o inclination, described as the Warburg process [39]. However, in Mat_A to Mat_C, the peak at low frequency started to form a loop at higher temperatures, suggesting the reduction in gas transfer resistance. Another characteristic is that the impedance seems to consist of two loops that converge to form one loop at higher temperatures. As shown in Figure A9 in Appendix A, the first loop is often described as the polarization resistance, (Rct), associated with the accumulation of charge at the electrode due to the difficulty of charge transfer to reactants. It is also associated with the resistance towards the transfer of the electron from the cathode surface to the oxygen, or transfer of electron from the oxide ion to the anode, which occurs due to the catalytic limitation of the electrode. The second loop is often called concentration polarization, Rconc resistance, which occurs due to mass transport limitation in the electrode associated with morphology of the electrode [39].
The value of Rohm for each EIS was measured and plotted according to temperatures, and subsequently, an Arrhenius plot was prepared from the data to obtain the activation energy, Ea, for the ohmic process, as shown in Figure 6a,b,e,f. Similar data processing was applied to Rct and is shown in Figure 6c,d,g,h. The activation energy, Ea, obtained for the ohmic process and charge transfer process is shown in Figure 7.

3.2.3. Rohm for Operation in H2 and CH4

The Rohm value was found to decrease as the Ni content increased from Mat_A to Mat_E in both H2 and CH4 fuel. The ohmic resistance is understood to be the process involving the movement of O2− ions across the cathode, electrolyte and anode, where a lower Rohm is favored for a higher MPD of the cell [20]. This is reflected in the reading of MPD shown in Figure 5. For all SOFC, Rohm decreases as temperature increases, showing typical temperature-activated processes of the O2− movement. The trend in Rohm follows exactly the trend seen in conductivity, where higher conductivity was found to yield lower Rohm, despite having similar content of YSZ in the cathode, electrolyte and anode. This shows that anode conductivity plays a crucial role in Rohm. Anode conductivity may have made it easier for the electron to move through the anode. The oxidation of O2- at the anode might have been impeded if the anode conductivity was low simply because the electron cannot leave O2− or the oxidation reaction because there is no conduction path, leaving the O2- transport impeded as well [40].
It is interesting to note that even though Mat_D has conductivity below a threshold value, the Rohm values of Mat_D (6.5 and 10.0 Ω cm2 at 900 °C in H2 and CH4 each) are relatively near to that of Mat_E (4.0 and 2.5 Ω cm2 at 900 °C in H2 and CH4 each) compared to that of Mat_C (60.1 and 70.2 Ω cm2 at 900 °C in H2 and CH4 each). Since Mat_D contains 12.5% less NiO content than Mat_E, Mat_D can be considered as a promising low-nickel-content anode to be used.

3.2.4. Rct for Operation in H2 and CH4

Rct involves the transfer of charge where oxygen is reduced at the cathode or the fuel is oxidized at the anode [31]. However, since the cathode thickness is the same for all of the SOFCs, the value of Rct here reflects the oxidation of fuel at the anode.
Rct was found to be lower as Ni content increased in H2. This is expected since the oxidation of H2 is catalyzed by the Ni metal, hence increasing the Ni content resulted in lower Rct values. The trend is actually similar to the trend of anode conductivity as well. As explained in the Rohm section, there might be another factor affecting the Rct when operating in H2, which is anode conductivity. Here, the high conductivity and high catalytic rate both led to the reduction of Rct as the Ni content increased.
Rct in CH4, on the other hand, increased from Mat_A to Mat_C, then decreased rapidly to Mat_D and Mat_E. The charge transfer process in CH4 oxidation is catalyzed both by Ni and at lower rates by CeO2 [35]. However, as explained in the Rohm section, Rct may actually depend on the value of Rohm and hence anode conductivity as well, since lower anode conductivity may make oxidation harder to proceed since the electron cannot leave the oxidation reaction [41]. With the lack of Ni (Mat_A and Mat_B), oxidation is catalyzed by CeO2, but since the anode conductivity is low, the rate is lower, resulting in higher Rct. In the presence of Ni (Mat_D and Mat_E), it can be achieved with Ni at a higher rate and, coupled with high conductivity, push the Rct value even lower. We believe that the Mat_C mixture provided higher Rct, possibly due to lesser catalytic activity due to less CeO2 and Ni, coupled with a lower-than-threshold value of anode conductivity.
It needs to be noted that the anode composition of Mat_D has almost similar Rct (4.5 and 1.9 Ω cm2 at 900 °C in H2 and CH4 each) to Mat_E (1.5 and 0.2 Ω cm2 at 900 °C in H2 and CH4 each) compared to Mat_C (7.2 and 34.9 Ω cm2 at 900 °C in H2 and CH4 each), showing 37.5% Ni, 12.5% CeO2 and 50% YSZ to be the suitable low-Ni anode for use.

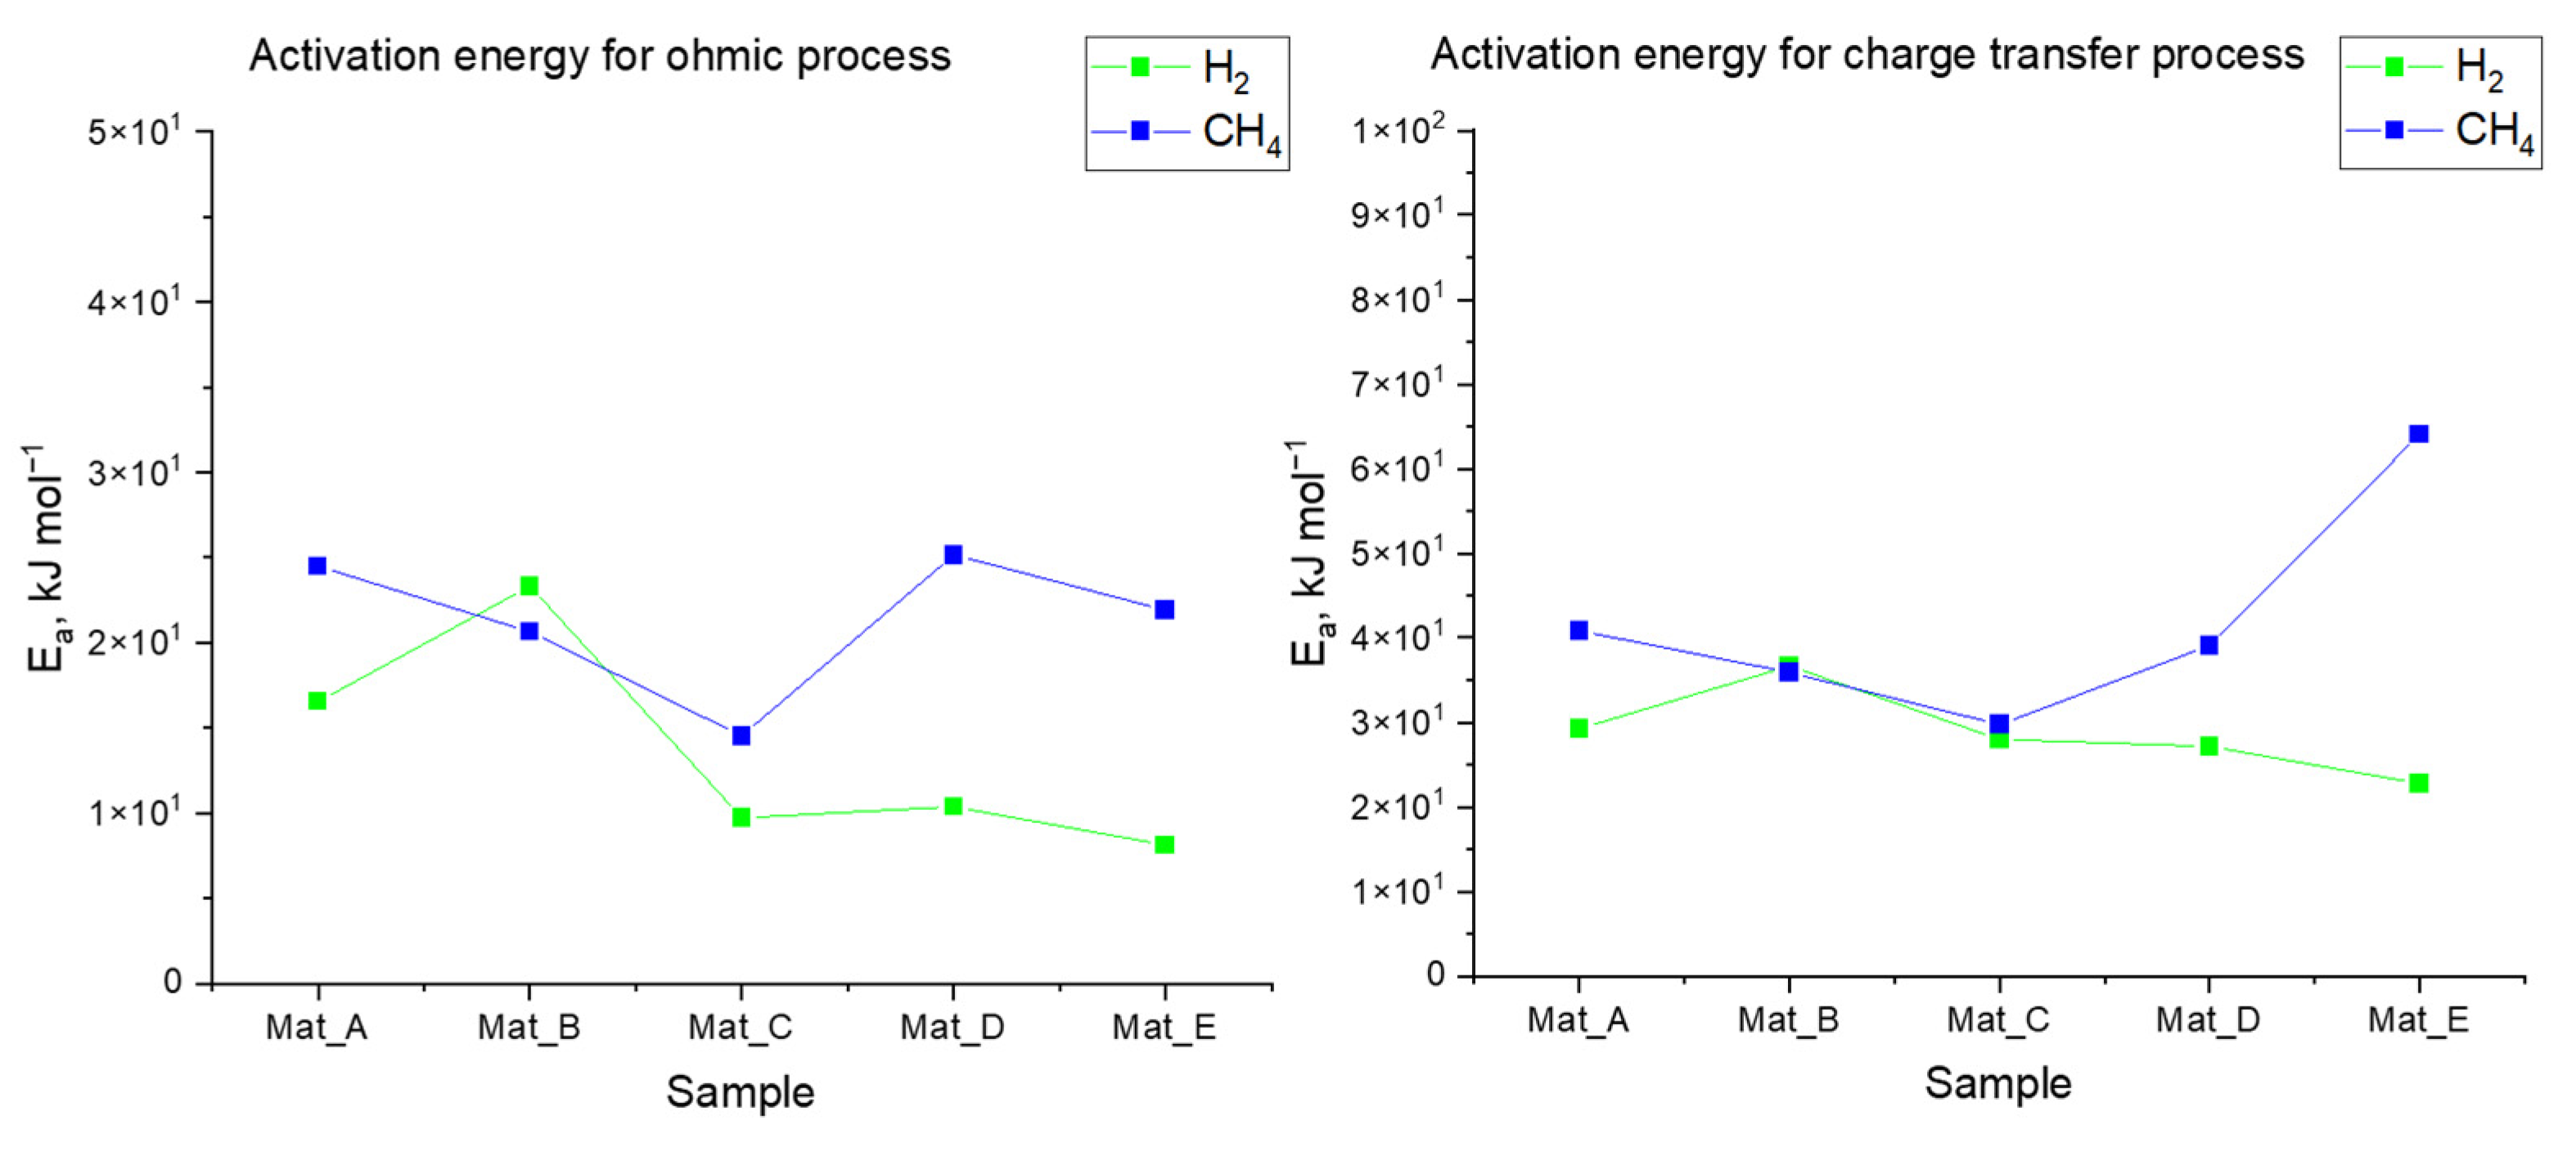
3.2.5. Ea for Rohm for Operation in H2 and CH4

The value of Ea for Rohm shows the energy barrier for the ohmic process or the resistance towards the flow of oxide ions in the electrolyte [14,20]. Greater changes in Rohm that result from changes in temperature yield higher Ea, signifying that higher temperature will supply more energy for the reactant to overcome the energy barrier. In the case of Rohm, higher Ea indicates a higher energy barrier for ionic transportation of mainly the O2− ion to move through the electrolyte. Higher Ea is undesirable since the process usually requires a high operating temperature.
The value of Ea for Rohm and Rct for each H2 and CH4 is shown in Figure 7. Briefly, the Ea for Rohm for H2 was found to be 16.5, 23.3, 9.7, 10.3 and 8.1 kJ mol−1 for Mat_A, Mat_B, Mat_C, Mat_D and Mat_E. Ea for Rohm for operation in H2 generally follows the same trendline as in conductivity, where Mat_A is lower than Mat_B but becomes lower as the composition approaches Mat_E. A possible explanation for this observation is that movement of the oxide ion through the electrolyte is a multistep process, which partly consists of the process of electron transport movement, as illustrated in Figure 8a,b. For example, for the O2− ion to move, O2− production via reduction at the cathode and O2− oxidation at the anode involves the transfer of an electron from and to the oxygen, and thus, should the flow of electron be resisted at the anode (or cathode), the flow of oxide ions will also be affected across the electrolyte [20].
The Ea for H2 Rohm is also generally lower than for CH4 (except for Mat_B), showing the effect of fuel on the resistance to O2− movement. This is known since the presence of H2 in a CeO2-containing anode is known to reduce the CeO2 to Ce2O3, which offers an alternate O2- movement pathway other than through the YSZ, which has lower Ea. This increases the O2− mobility and hence the flow of the O2− ion [40]. However, in the operation in H2, the anode conductivity seems to be the limiting factor in the Rohm, while in CH4, the anode conductivity is not the limiting factor [31].
The Ea for Rohm for CH4 was found to be 24.4, 20.6, 14.5, 25.1 and 21.9 kJ mol−1 for Mat_A, Mat_B, Mat_C, Mat_D and Mat_E. Compared to H2, Ea for Rohm for operation in CH4, on the other hand, drops from Mat_A to Mat_B, increased to Mat_D and decreased slightly to Mat_E. The possible explanation for this phenomenon is similar to that of Rct for H2, where the movement of oxide ion is a multistep process consisting of an electron conduction process and O2− ion generation process, etc., as shown in Figure 8c.
In a sample with high Ni content (Mat_D to Mat_E), the drop in Ea is actually the result of the increase in the anode conductivity, giving lower Ea for electron conductance and hence Rohm. The Ea for Mat_A to Mat_C also has a downward trend due to a similar effect. However, as the CeO2 content decreases from Mat_A to Mat_E, the conductance of O2− also decreases, giving a higher Ea. This can be observed in higher Ea in Mat_D and Mat_E compared to Mat_B and Mat_C. From Mat_A to Mat_C with low Ni content but with high CeO2 content, the low Ea for Rohm is actually caused by the presence of high amounts of CeO2, Ce(IV)/Ce(III) pairs and ceria–zirconia compounds, which are known to be able to conduct O2− [40].

3.2.6. Ea for Rct for Operation in H2

The Ea for Rct for H2 was found to be 29.2, 36.6, 27.9, 27.1 and 22.7 kJ mol−1 for each Mat_A, Mat_B, Mat_C, Mat_D and Mat_E. The trend of Ea for the charge transfer process in H2 follows a similar pattern as Rohm and anode conductivity. For H2, Ea increases from Mat_A to Mat_B and decreases back to Mat_E, achieving a maximum at Mat_B. While the pattern suggests anode conductivity as the rate-limiting step, we believe that the charge transfer process of H2 is also a multiple-step process, as shown in Figure 8b, but the other process has lower Ea than the electron conduction process. This is because the oxidation of H2 may follow a different route depending on the content of ceria–zirconia, the Ce(IV)/Ce(III) pair and Ni [19]. Lowering the concentration of both CeO2 or NiO (as in Mat_B to Mat_D) results in higher Ea. Both Ni and CeO2 are known to be able to adsorb H2 gas onto their surface, where the rate of adsorption of H2 onto Ni is greater than the rate of adsorption on CeO2 [42]. However, unlike Ni that requires ZrO2 (in YSZ) to oxidize the adsorbed hydrogen, CeO2 can oxidize the H2 by directly turning it into Ce2O3. Thus, from Mat_A to Mat_B where the concentration of Ni is still too low to catalyze H2 oxidation, the oxidation is performed by CeO2, and the increment of Ea observed from Mat_A to Mat_B is the result of the lowering of CeO2 content. However, in Mat_C to Mat_E, the presence of higher content of Ni led to a rapid reduction of Ea for Rct of H2. This effect is obvious in the charge transfer process of CH4.

3.2.7. Ea for Rct for Operation in CH4

The Ea for Rct for CH4 was found to be 40.8, 35.9, 29.7, 39.0 and 64.0 kJ mol−1 for Mat_A, Mat_B, Mat_C, Mat_D and Mat_E. For oxidation of CH4, the trend is the reverse of the trend seen in H2, where the Ea decreased from Mat_A to Mat_C and increased back to Mat_E. This trend is also almost similarly observed by [17], which found the presence of Ni on ceria–zirconia increased oxidation of methane [19]. The performance is high when small amounts of Zr are present in the Ni–ceria–zirconia compound, where the rate of methane oxidation was found to be Ni–ZrO2 < Ni–Ce0.17Zr0.83O2 < Ni–CeO2 < Ni–Ce0.83Zr0.17O2. Similarly, in our result, Mat_A containing CeO2, Ce0.5Zr0.5O2 and ZrO2 (in YSZ) has higher Ea compared to Mat_C containing Ni–CeO2, Ni–Ce0.18Zr0.82O2 and Ni–ZrO2 (in YSZ). Mat_E that contains only Ni–ZrO2 (in YSZ) has the highest Ea for Rct. This observation indicates that oxidation of CH4 takes more energy if performed by Ni alone compared to ceria–zirconia alone. Oxidation of CH4 in a mixture of Ni–Ce1−xZrxO2 takes different pathways that have lower Ea than on Ni or ceria–zirconia alone.

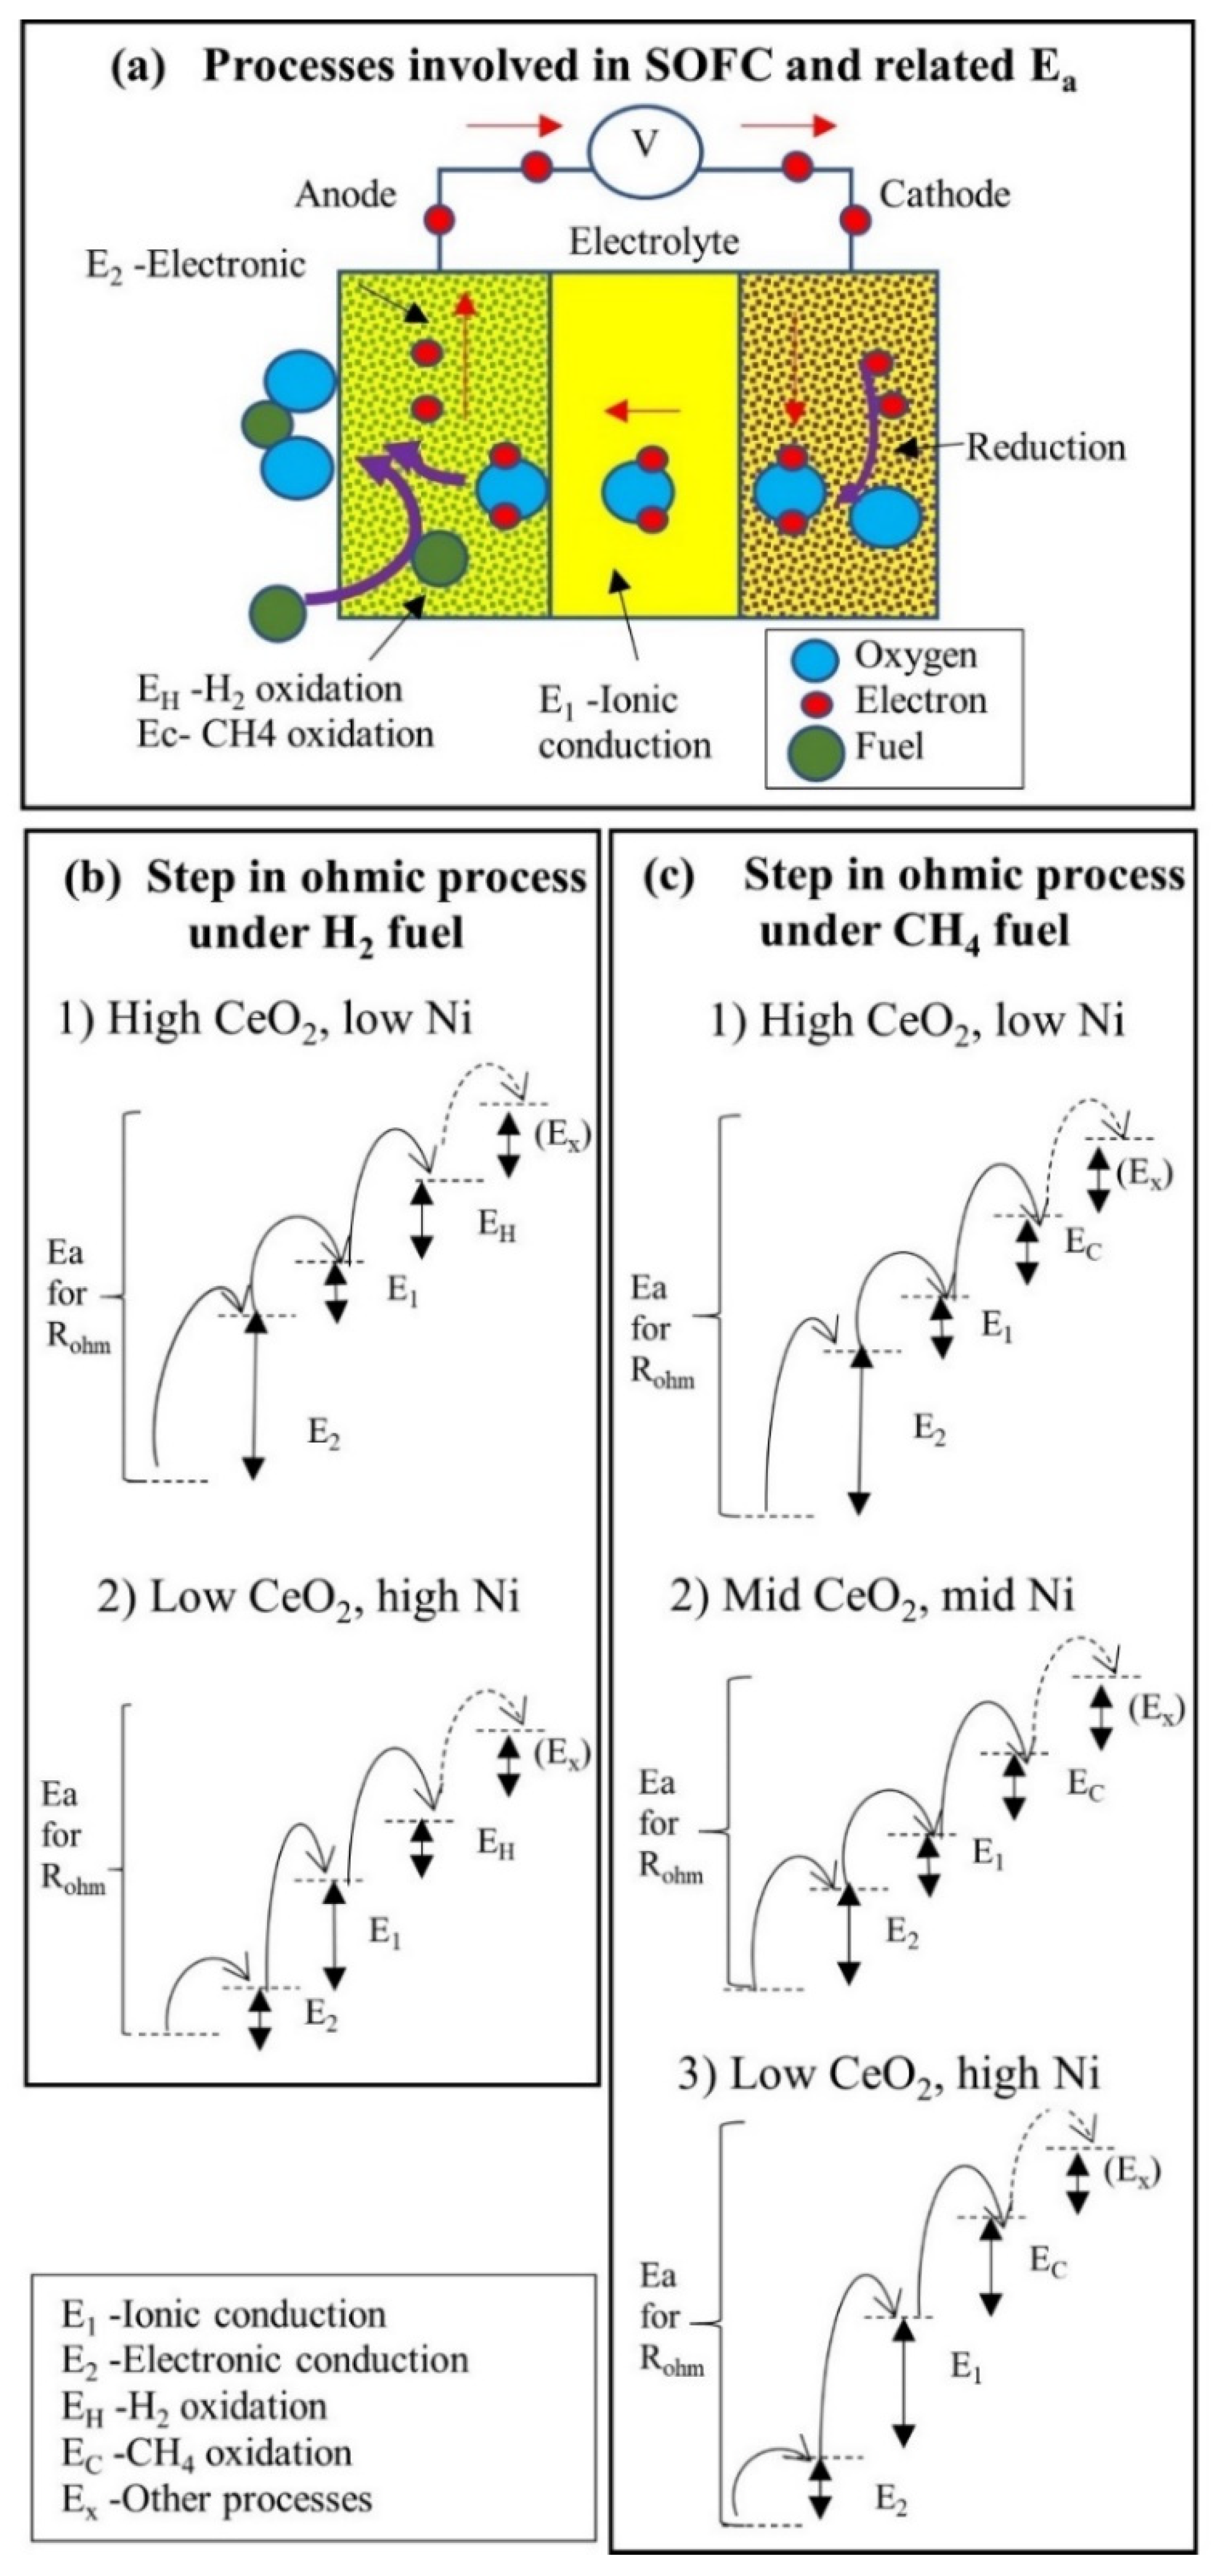
3.2.8. Comparison of Effects of Ni and CeO2 Content on Rohm and Rct on H2 and CH4 Fuel

A summary of the effect of Ni and CeO2 content on electronic conductivity, O2− conductivity, H2 oxidation and CH4 oxidation was made based on observations from the I-V curve, MPD, EIS and Ea and is shown in Table 3. Also based on these observations, a summary of Ea for Rohm and Rct when operating in H2 and CH4 fuel is shown in Table 4.
Based on the anode conductivity reading, lowering the Ni content to lower than 50% NiO (Mat_E) in the anode was shown to produce a detrimental effect on the conductivity, where the anode conductivity drastically falls more than 107 times. However, based on the MPD value, large losses in the value were actually observed when the Ni content lowered to below 37.5% NiO (Mat_D), which sees the abrupt losses in MPD. Similarly, based on EIS data in H2 and CH4 fuel, a large value of impedance is observed in lower than 37.5% NiO. However, lowering of Ni coupled with an increasing amount of CeO2 yield benefits in terms of reduction of Ea for Rct for operation in CH4, especially when the content of NiO–CeO2–YSZ is balanced at 25%:25%:50% (Mat_C). Having relatively similar Ea for Rohm for operation under H2 and CH4 with the lowest Ea for Rct for CH4, this anode content may be concluded to be the best to function as an anode for operation in CH4. The property exhibited by Mat_C and Mat_D shows great potential in becoming a coking-tolerant anode for SOFC. Further study will be conducted to investigate the long-term performance of this anode in CH4 fuel.
To date, there is no known study that fabricates CeO2 directly into the Ni–YSZ anode of MT-SOFC via phase-inversion techniques as exhibited in this study, and hence no direct comparison of performance can be made. However, this study shows that it is possible to use low Ni content in an SOFC anode to limit the coking of an anode when used with hydrocarbon fuel in MT-SOFC. Low content Ni of 37.5% NiO with 12.5% CeO2 (Mat_D) is shown here to obtain comparable performance with an anode containing 50% NiO (Mat_E) when compared in terms of MPD and impedance. MPD obtained by Mat_D is relatively low compared to traditional SOFC with 60% NiO and 40% YSZ but almost similar to another study that aims to reduce carbon deposition by using CeO2 or ceria–zirconia anodes, as shown in Table 5.
It is important to note that the value of MPD may be low due to different fuel mixes used since this study uses pure CH4 while other studies used mixtures of CH4, H2 and CO2. The later fuel mixture indicates the reforming process in other studies. Furthermore, other studies use mainly planar geometry, which involves more preparation steps and more costs compared to the micro-tubular geometry in this study. The low MPD value is also caused by the thin electrolyte (~20 μm) used in this study that led to low gas tightness [14]. Low gas tightness may lead to leakage of oxygen from the cathode into the anode and fuel into the cathode, leading to the oxidation of fuel at the cathode and the reduction in oxygen in the anode, reducing the power output.
The low MPD problem in this SOFC can be mitigated by fabricating a thicker electrolyte to enhance the gas tightness. It can also be mitigated with a parallel stacking of MT-SOFC to increase current production or stacking in series to increase the voltage of the power sources if the MT-SOFC is to be commercialized [13]. Given the ease of fabrication and the smaller size of MT-SOFC compared to planar SOFC, the study provides great insight into fabricating low-nickel coking-tolerant SOFC. Furthermore, this type of SOFC can be used with renewable energy sources that contain hydrocarbon, such as biogas, or to extract energy from methane-based energy storage technology to ensure the most environmentally friendly application possible [46,47].

4. Conclusions

From this study, we found that lowering the Ni content to lower than 50% NiO (Mat_E) in the anode caused conductivity to drop by a magnitude of six, below the conductivity percolation threshold. However, the effect of anode conductivity on the MPD and EIS reading is only prominent when it reaches below 37.5% NiO. MPD for low Ni content, which are Mat_A, Mat_B and Mat_C (0% to 25% NiO), is generally low, while MPD for Mat_D and Mat_E (37.5% to 50% NiO) is high. In terms of Ea for Rct (which shows the catalytic properties of anodes), Ea are low for Mat_A to Mat_D compared to Mat_E. This resulted in Mat_D (37.5% NiO, 12.5% CeO2) showing the lowest amount of Ni without abrupt negative effect on the MPD and impedance. Nonetheless, Mat_C was found to have the lowest Ea for Rct for operation in CH4, making it the best content to oxidize CH4, but at a low MPD value.
By using Ea for Rohm and Rct as a method for investigation, we found a few differences between the oxidation of H2 and CH4 in the Ni–CeO2–YSZ anode. They are:
  • In H2 operation, Ea for Rohm and Rct is limited by anode conductivity, where higher anode conductivity will provide lower Ea. This implies that anode conductivity is a rate-limiting step in H2 operation.
  • In CH4 operation, Ea for Rohm is limited by anode conductivity, oxide ion conductivity and fuel oxidation rate.
  • In CH4 operation, lower Ea for Rct or CH4 oxidation is observed in the Ni–CeO2–YSZ anode. The presence of Ni in ceria–zirconia increases the oxidation of methane.
Thus, based on this study, anode compositions containing 25% NiO:25% CeO2:50% YSZ (Mat_C) and 37.5% NiO:12.5% CeO2:50% YSZ (Mat_D) show promising results in becoming the low-Ni anode for coking-tolerant SOFC operation under CH4 fuel.

Author Contributions

Conceptualization, H.A.S.; methodology, H.A.S.; software, H.A.S. and S.N.F.M.R.; validation, S.D. and M.A.R. (Mazlinda Ab Rahman); formal analysis, H.A.S. and S.N.F.M.R.; investigation, H.A.S., S.D. and M.A.R. (Mazlinda Ab Rahman); resources, H.A.S.; data curation, H.A.S. and S.N.F.M.R.; writing—original draft preparation, H.A.S. and S.N.F.M.R.; writing—review and editing, M.H.D.O., S.M.J., T.A.K., T.L., S.A.B. and N.O.; visualization, H.A.S. and S.N.F.M.R.; supervision, M.H.D.O. and S.M.J.; project administration, M.H.D.O.; funding acquisition, M.H.D.O., J.J., M.A.R. (Mukhlis A Rahman) and A.F.I. All authors have read and agreed to the published version of the manuscript.

Funding

The authors gratefully acknowledge the financial support from the Ministry of Higher Education Malaysia under the Fundamental Research Grant Scheme (FRGS) (Project Number: R.J130000.7809.5F161) and Malaysia Research University Network (MRUN) Grant (Project number: R.J130000.7809.4L867), and also Universiti Teknologi Malaysia under the UTM-UiTM SOFC Research Collaboration Grant (Project number: R.J130000.7309.4B676), Matching Grant (Project number: Q.J130000.3009.03M23) and UTM Zamalah Scholarship.

Institutional Review Board Statement

Not applicable.

Informed Consent Statement

Not applicable.

Data Availability Statement

The data presented in this study are available in Figure A5, Figure A6, Figure A7 and Figure A8 in Appendix A.

Conflicts of Interest

The authors declare no conflict of interest.

Appendix A

Figure A1. Setup for DL-HF co-extrusion, phase inversion process.
Sustainability 13 13789 g0a1
Figure A2. Gas permeation setup.
Sustainability 13 13789 g0a2
Figure A3. Schematic of the triple point bending test.
Sustainability 13 13789 g0a3
Figure A4. Illustration and image of setup for performance testing.
Sustainability 13 13789 g0a4
Figure A5. I-V and power measurement for Mat_A to Mat_E from temperatures 700 to 900 °C running in H2 gas at 10 mL min−1.
Sustainability 13 13789 g0a5
Figure A6. I-V and power measurement for Mat_A to Mat_E from temperatures 700 to 900 °C running in CH4 at 10 mL min−1.
Sustainability 13 13789 g0a6
Figure A7. EIS for Mat_A to Mat_E from temperatures 700 to 900 °C running in H2 gas at 10 mL min−1.
Sustainability 13 13789 g0a7
Figure A8. EIS for Mat_A to Mat_E from temperatures 700 to 900 °C running in CH4 gas at 10 mL min−1.
Sustainability 13 13789 g0a8
Figure A9. Equivalent circuit and measurement of Rohm and Rct.
Sustainability 13 13789 g0a9

References

  1. Ades, M.; Adler, R.; Allan, R.; Anderson, J.; Argüez, A.; Arosio, C.; Augustine, J.A.; Azorin-Molina, C.; Barichivich, J.; Barnes, J.; et al. Global Climate. Bull. Am. Meteorol. Soc. 2020, 101, S9–S128. [Google Scholar] [CrossRef]
  2. Shabri, H.A.; Othman, M.H.D.; Mohamed, M.A.; Kurniawan, T.A.; Jamil, S.M. Recent progress in metal-ceramic anode of solid oxide fuel cell for direct hydrocarbon fuel utilization: A review. Fuel Process. Technol. 2021, 212, 106626. [Google Scholar] [CrossRef]
  3. Ahmed, S.; Aitani, A.; Rahman, F.; Al-Dawood, A.; Al-Muhaish, F. Decomposition of hydrocarbons to hydrogen and carbon. Appl. Catal. A Gen. 2009, 359, 1–24. [Google Scholar] [CrossRef]
  4. Lee, J.; Theis, J.R.; Kyriakidou, E.A. Vehicle emissions trapping materials: Successes, challenges, and the path forward. Appl. Catal. B Environ. 2019, 243, 397–414. [Google Scholar] [CrossRef]
  5. Hartvigsen, J.; Elangovan, S.; Elwell, J.; Larsen, D. Oxygen Production from Mars Atmosphere Carbon Dioxide Using Solid Oxide Electrolysis. ECS Trans. 2017, 78, 2953–2963. [Google Scholar] [CrossRef]
  6. Lee, J.G.; Jeon, O.S.; Hwang, H.J.; Jang, J.; Lee, Y.; Hyun, S.H.; Shul, Y.G. Durable and High-Performance Direct-Methane Fuel Cells with Coke-Tolerant Ceria-Coated Ni Catalysts at Reduced Temperatures. Electrochim. Acta 2016, 191, 677–686. [Google Scholar] [CrossRef]
  7. Lee, D.; Myung, J.; Tan, J.; Hyun, S.-H.; Irvine, J.T.; Kim, J.; Moon, J. Direct methane solid oxide fuel cells based on catalytic partial oxidation enabling complete coking tolerance of Ni-based anodes. J. Power Sources 2017, 345, 30–40. [Google Scholar] [CrossRef]
  8. Omar, A.F.; Othman, M.H.D.; Gunaedi, C.N.; Jamil, S.M.; Mohamed, M.H.; Jaafar, J.; Rahman, M.A.; Ismail, A.F. Performance analysis of hollow fibre-based micro-tubular solid oxide fuel cell utilising methane fuel. Int. J. Hydrogen Energy 2019, 44, 30754–30762. [Google Scholar] [CrossRef]
  9. Riegraf, M.; Dierickx, S.; Weber, A.; Costa, R.; Schiller, G.; Friedrich, K.A. Electrochemical Impedance Analysis of Ni/CGO10-Based Electrolyte-Supported Cells. ECS Trans. 2019, 91, 1985–1992. [Google Scholar] [CrossRef] [Green Version]
  10. Osinkin, D. Complementary effect of ceria on the hydrogen oxidation kinetics on Ni—Ce0.8Sm0.2O2-δ anode. Electrochim. Acta 2020, 330, 135257. [Google Scholar] [CrossRef]
  11. Öksüzömer, M.F.; Sarıboğa, V. Combined Cu-CeO2/YSZ and Ni/YSZ dual layer anode structures for direct methane solid oxide fuel cells. Int. J. Energy Res. 2018, 42, 3228–3243. [Google Scholar] [CrossRef]
  12. Rabuni, M.F.; Li, T.; Punmeechao, P.; Li, K. Electrode design for direct-methane micro-tubular solid oxide fuel cell (MT-SOFC). J. Power Sources 2018, 384, 287–294. [Google Scholar] [CrossRef]
  13. Sumi, H.; Shimada, H.; Yamaguchi, T.; Fujishiro, Y.; Awano, M. Development of Portable Solid Oxide Fuel Cell System Driven by Hydrocarbon and Alcohol Fuels. Adv. Bioceram. Porous Ceram. II 2019, 39, 159–163. [Google Scholar]
  14. Ab Rahman, M.; Othman, M.H.D.; Wibisono, Y.; Harun, Z.; Omar, A.F.; Shabri, H.A.; Deraman, S.; Rahman, M.A.; Jaafar, J.; Ismail, A.F. Effect of electrolyte thickness manipulation on enhancing carbon deposition resistance of methane-fueled solid oxide fuel cell. Int. J. Energy Res. 2021, 45, 2837–2855. [Google Scholar] [CrossRef]
  15. Ab Rahman, M.; Othman, M.H.D.; Fansuri, H.; Harun, Z.; Omar, A.F.; Shabri, H.A.; Ravi, J.; Rahman, M.A.; Jaafar, J.; Ismail, A.F.; et al. Development of high-performance anode/electrolyte/cathode micro-tubular solid oxide fuel cell via phase inversion-based co-extrusion/co-sintering technique. J. Power Sources 2020, 467, 228345. [Google Scholar] [CrossRef]
  16. Jamil, S.M.; Rahman, M.A.; Shabri, H.A.; Othman, M.H.D. Solid Electrolyte Membranes for Low- and High-Temperature Fuel Cells. In Membrane Technology Enhancement for Environmental Protection and Sustainable Industrial Growth; Zhang, Z., Zhang, W., Chehimi, M.M., Eds.; Springer International Publishing: Cham, Switzerland, 2021; pp. 109–125. [Google Scholar]
  17. Eguchi, K.; Akasaka, N.; Mitsuyasu, H.; Nonaka, Y. Process of solid state reaction between doped ceria and zirconia. Solid State Ionics 2000, 135, 589–594. [Google Scholar] [CrossRef]
  18. Tuller, H. Ionic conduction in nanocrystalline materials. Solid State Ionics 2000, 131, 143–157. [Google Scholar] [CrossRef] [Green Version]
  19. Chen, J.; Carlson, B.D.; Toops, T.J.; Li, Z.; Lance, M.J.; Karakalos, S.G.; Choi, J.; Kyriakidou, E.A. Methane Combustion Over Ni/CexZr1−xO2 Catalysts: Impact of Ceria/Zirconia Ratio. ChemCatChem 2020, 12, 5558–5568. [Google Scholar] [CrossRef]
  20. Xu, H.; Cheng, K.; Chen, M.; Zhang, L.; Brodersen, K.; Du, Y. Interdiffusion between gadolinia doped ceria and yttria stabilized zirconia in solid oxide fuel cells: Experimental investigation and kinetic modeling. J. Power Sources 2019, 441, 227152. [Google Scholar] [CrossRef] [Green Version]
  21. Kurapova, O.Y.; Shugurov, S.M.; Vasil’Eva, E.A.; Savelev, D.A.; Konakov, V.G.; Lopatin, S.I. Thermal prehistory, structure and high-temperature thermodynamic properties of Y2O3-CeO2 and Y2O3-ZrO2-CeO2 solid solutions. Ceram. Int. 2021, 47, 11072–11079. [Google Scholar] [CrossRef]
  22. Danielis, M.; Betancourt, L.E.; Orozco, I.; Divins, N.J.; Llorca, J.; Rodríguez, J.A.; Senanayake, S.D.; Colussi, S.; Trovarelli, A. Methane oxidation activity and nanoscale characterization of Pd/CeO2 catalysts prepared by dry milling Pd acetate and ceria. Appl. Catal. B Environ. 2021, 282, 119567. [Google Scholar] [CrossRef]
  23. Liu, Z.; Zhang, F.; Rui, N.; Li, X.; Lin, L.; Betancourt, L.E.; Su, D.; Xu, W.; Cen, J.; Attenkofer, K.; et al. Highly Active Ceria-Supported Ru Catalyst for the Dry Reforming of Methane: In Situ Identification of Ruδ+–Ce3+ Interactions for Enhanced Conversion. ACS Catal. 2019, 9, 3349–3359. [Google Scholar] [CrossRef]
  24. Ahmad, S.I.; Rao, P.K.; Syed, I.A. Sintering temperature effect on density, structural and morphological properties of Mg- and Sr-doped ceria. J. Taibah Univ. Sci. 2016, 10, 381–385. [Google Scholar] [CrossRef] [Green Version]
  25. Panthi, D.; Hedayat, N.; Du, Y. Densification behavior of yttria-stabilized zirconia powders for solid oxide fuel cell electrolytes. J. Adv. Ceram. 2018, 7, 325–335. [Google Scholar] [CrossRef] [Green Version]
  26. Sariboğa, V.; Öksüzömer, M.F. Cu-CeO2 anodes for solid oxide fuel cells: Determination of infiltration characteristics. J. Alloys Compd. 2016, 688, 323–331. [Google Scholar] [CrossRef]
  27. Zhou, X. Electrical conductivity and stability of Gd-doped ceria/Y-doped zirconia ceramics and thin films. Solid State Ionics 2004, 175, 19–22. [Google Scholar] [CrossRef]
  28. Mori, M.; Yamamoto, T.; Itoh, H.; Inaba, H.; Tagawa, H. Thermal Expansion of Nickel-Zirconia Anodes in Solid Oxide Fuel Cells during Fabrication and Operation. J. Electrochem. Soc. 1998, 145, 1374–1381. [Google Scholar] [CrossRef]
  29. Wang, X.; Liu, T.; Wang, C.; Yu, J.; Li, L. Crystal structure, microstructure, thermal expansion and electrical conductivity of CeO2–ZrO2 solid solution. Adv. Appl. Ceram. 2017, 116, 477–481. [Google Scholar] [CrossRef]
  30. Jamil, S.M.; Othman, M.H.D.; Rahman, M.A.; Jaafar, J.; Ismail, A.F.; Honda, S.; Iwamoto, Y. Properties and performance evaluation of dual-layer ceramic hollow fiber with modified electrolyte for MT-SOFC. Renew. Energy 2019, 134, 1423–1433. [Google Scholar] [CrossRef]
  31. Feng, J.; Qiao, J.; Sun, W.; Yang, P.; Li, H.; Wang, Z.; Sun, K. Characteristic and preparation of Ce0.5Zr0.5O2 as the anode support for solid oxide fuel cells by phase inversion technology. Int. J. Hydrogen Energy 2015, 40, 12784–12789. [Google Scholar] [CrossRef]
  32. Dees, D.W.; Claar, T.D.; Easler, T.E.; Fee, D.C.; Mrazek, F.C. ChemInform Abstract: The Conductivity of Porous Ni/ZrO2-Y2O3 Cermets. Chemin 1987, 18, 5–10. [Google Scholar] [CrossRef]
  33. Yu, J.H.; Park, G.W.; Lee, S.; Woo, S.K. Microstructural effects on the electrical and mechanical properties of Ni–YSZ cermet for SOFC anode. J. Power Sources 2007, 163, 926–932. [Google Scholar] [CrossRef]
  34. Sasaki, K.; Teraoka, Y. Equilibria in Fuel Cell Gases. J. Electrochem. Soc. 2003, 150, A885–A888. [Google Scholar] [CrossRef]
  35. Shishkin, M.; Ziegler, T. Direct modeling of the electrochemistry in the three-phase boundary of solid oxide fuel cell anodes by density functional theory: A critical overview. Phys. Chem. Chem. Phys. 2014, 16, 1798–1808. [Google Scholar] [CrossRef] [PubMed]
  36. Vita, A. Catalytic Applications of CeO2-Based Materials. Catalysts 2020, 10, 576. [Google Scholar] [CrossRef]
  37. Shutilov, A.A.; Simonov, M.N.; Zaytseva, Y.A.; Zenkovets, G.A.; Simakova, I. Phase composition and catalytic properties of ZrO2 and CeO2-ZrO2 in the ketonization of pentanoic acid to 5-nonanone. Kinet. Catal. 2013, 54, 184–192. [Google Scholar] [CrossRef]
  38. Coles-Aldridge, A.V.; Baker, R.T. Oxygen ion conductivity in ceria-based electrolytes co-doped with samarium and gadolinium. Solid State Ionics 2020, 347, 115255. [Google Scholar] [CrossRef]
  39. Lasia, A. Electrochemical Impedance Spectroscopy and Its Applications; Springer: New York, NY, USA, 2014; ISBN 978-1-4614-8932-0. [Google Scholar] [CrossRef]
  40. Luciani, G.; Landi, G.; Imparato, C.; Vitiello, G.; Deorsola, F.A.; Di Benedetto, A.; Aronne, A. Improvement of splitting performance of Ce0.75Zr0.25O2 material: Tuning bulk and surface properties by hydrothermal synthesis. Int. J. Hydrogen Energy 2019, 44, 17565–17577. [Google Scholar] [CrossRef]
  41. Deng, J.; Li, S.; Xiong, L.; Jiao, Y.; Yuan, S.; Wang, J.; Chen, Y. Preparation of nanostructured CeO2-ZrO2-based materials with stabilized surface area and their catalysis in soot oxidation. Appl. Surf. Sci. 2020, 505, 144301. [Google Scholar] [CrossRef]
  42. Shishkin, M.; Ziegler, T. The Electronic Structure and Chemical Properties of a Ni/CeO2 Anode in a Solid Oxide Fuel Cell: A DFT + U Study. J. Phys. Chem. C 2010, 114, 21411–21416. [Google Scholar] [CrossRef]
  43. Escudero, M.; Serrano, J. Individual impact of several impurities on the performance of direct internal reforming biogas solid oxide fuel cell using W-Ni-CeO2 as anode. Int. J. Hydrogen Energy 2019, 44, 20616–20631. [Google Scholar] [CrossRef]
  44. Hou, X.; Zhao, K.; Marina, O.A.; Norton, M.G.; Ha, S. NiMo-ceria-zirconia-based anode for solid oxide fuel cells operating on gasoline surrogate. Appl. Catal. B Environ. 2019, 242, 31–39. [Google Scholar] [CrossRef]
  45. Fuerte, A.; Valenzuela, R.X.; Escudero, M.J. Role of Dopants on Ceria-based Anodes for IT-SOFCs Powered by Hydrocarbon Fuels. Univers. J. Electr. Electron. Eng. 2017, 5, 45–55. [Google Scholar] [CrossRef]
  46. Rudin, S.N.F.M.; Ab Muis, Z.; Ramli, A.F.; Shabri, H.A.; Zailan, R.; Hashim, H.; Ho, W.S. Sustainable Supply of Hydrogen for Integrated Power Plant with Methanation via Pinch Analysis. In IOP Conference Series: Materials Science and Engineering; IOP Publishing: Bristol, UK, 2020; Volume 884. [Google Scholar] [CrossRef]
  47. Rudin, S.N.F.M.; Ab Muis, Z.; Hashim, H.; Ho, W.S. Techno-economic assessment of integrated power plant with methanation. Chem. Eng. Trans. 2018, 63, 451–456. [Google Scholar]
Figure 1. Ceramic DL-HF showing the external layer of the electrolyte and internal layer of the anode. Magnification is (i) 60×, (ii) 500× and (iii) 1500× at the inner layer anode, (iv) 60× with the EDX elemental mapping.
Sustainability 13 13789 g001
Figure 2. XRD results of ceramic DL-HFs for (a) Mat_A to Mat_E, (b) unreduced Mat_C and reduced Mat_C.
Sustainability 13 13789 g002
Figure 3. Sub-figure (a) shows the mechanical strength measured through bending strength of ceramic DL-HF from Mat_A to Mat_E at sintering temperatures from 1350 to 1450 °C (sample number = 3), (b) shows the gas rate of gas permeation through the anode and (c) gas tightness of the electrolyte layer.
Sustainability 13 13789 g003
Figure 4. Conductivity of the anode before and after reduction by H2 gas.
Sustainability 13 13789 g004
Figure 5. (a) MPD for H2 fuel and (b) MPD for CH4 fuel.
Sustainability 13 13789 g005
Figure 6. Ohmic resistance for H2 (a) and CH4 (c) and charge transfer resistance for H2 (e) and CH4 (g). Arrhenius plot for ohmic resistance for H2 (b) and CH4 (d), and Arrhenius plot for charge transfer resistance for H2 (f) and CH4 (h).
Sustainability 13 13789 g006
Figure 7. Ea for ohmic resistance and charge transfer process for H2 and CH4.
Sustainability 13 13789 g007
Figure 8. Illustration of processes involved in SOFC and related Ea.
Sustainability 13 13789 g008
Table 1. Ceramic composition sample of anode (weight percentage).
Sample NameNiO, % CeO2, % YSZ, %
Mat_A05050
Mat_B12.537.550
Mat_C252550
Mat_D37.512.550
Mat_E50050
Table 2. Selected region showing changing of d-spacing as zirconia mixed with CeO2 from Mat_A to Mat_E.
2θ, °d-Spacing, APlaneCompoundDL-HF
47.51.9131202CeO2Mat_A, Mat_B, Mat_C
48.21.8640440CeZrO4Mat_A, Mat_B
49.51.8373112Zr0.82Ce0.18O2Mat_C, Mat_D
50.21.8151202ZrO2 in ((ZrO2)0.88(Y2O3)0.12)0.893All
56.31.6315311CeO2Mat_A, Mat_C
58.01.5896622CeZrO4Mat_A, Mat_B
58.51.5759013Zr0.82Ce0.18O2 Mat_C, Mat_D
59.61.5491311ZrO2 in ((ZrO2)0.88(Y2O3)0.12)0.893All
Table 3. Effect of Ni and CeO2 content on electronic conductivity, O2− conductivity, H2 oxidation and CH4 oxidation.
PropertiesLow Ni
High CeO2
High Ni
Low CeO2
Remark
Electronic ConductivityLow
Supplied by Ce(III)–Ce(IV)
High
Supplied by Ni
O2− conductivityHigh
Aided by CeO2
Low
H2 oxidationDone by CeO2–YSZ
Lower rate
Done by Ni–YSZ
High rate
Higher Ea for Ni–CeO2–YSZ
CH4 oxidationLowLowLower Ea in Ni–CeO2–YSZ
Table 4. Conclusion for Ea for Rohm and Rct when operating in H2 and CH4.
FuelEa for RohmEa for Rct
H2Limited by anode conductivity
Higher anode conductivity, lower Ea
Anode conductivity is a rate-limiting step
Limited by anode conductivity
Higher anode conductivity, lower Ea
Anode conductivity is a rate-limiting step
CH4Limited by anode conductivity, oxide ion conductivity, fuel oxidationLower Ea for CH4 oxidation observed in Ni–CeO2–YSZ
Table 5. Comparison of MPD with other studies.
AnodeGeometryFuelMPD,
mW cm−2
Source
37.5% NiO–12.5% CeO2–50% YSZMicro-tubularH241This work
37.5% NiO–12.5% CeO2–50% YSZMicro-tubularCH42.9This work
20% W–10% Ni–70% CeO2Planar70% CH4, 25% CO2, 5% H247.5[43]
50% Ni–50% Ce0.5Zr0.5O2PlanarC8H1880[44]
42% Cu–CeO2 CH4 + H255[45]
Publisher’s Note: MDPI stays neutral with regard to jurisdictional claims in published maps and institutional affiliations.

