1. Introduction
Residential vulnerability is defined as a set of conditions that are related to the residential space in a specific space-time context and indicate situations of social discrimination and structural disadvantage of the population. This concept has been the object of thought and definition by many authors in the field of Social Sciences, especially Geography and Sociology, since the first contributions and discussions of the Chicago School [
1,
2,
3]. Robert Castel defines vulnerability as a situation of uncertainty and disadvantage, “an intermediate unstable zone where job insecurity and the fragility of proximity support networks are entwined” [
4]. Currently, vulnerability is understood in relation to the drop in public protections as a result of the crisis of the welfare state. From a transversal point of view, the United Nations refers to vulnerability as “(...) a state of high exposure to certain risks and uncertainties, combined with a diminishing capacity to protect or defend oneself from risks and face their negative consequences. Vulnerability exists at all levels and dimensions of society. It is an integral part of the human condition and, therefore, can affect both individuals and society as a whole” [
5].
Thus, urban vulnerability is based on a combination of vectors that outline social, professional and residential exclusion [
6]. The coexistence of these components usually leads to a process of spatial segregation and concentration in neighborhoods that become very disadvantaged in urban and social terms [
7]. As some authors conclude [
8], vulnerability refers, on the one hand, to increased risks that affect groups of people, society or states; on the other hand, it refers to the weakening of the mechanisms to face risks. Thus, it is relevant to analyze the concentration of certain indicators of vulnerability in specific places or neighborhoods, to contrast their effect on the socio-residential situation and their temporal evolution in order to identify trends. Accurate knowledge of the sociodemographic, socioeconomic, and residential and urban characteristics is essential to be able to define the complex urban dynamics that describe present inequalities in the neighborhoods and areas of the city [
9,
10]. At the same time, it constitutes a tool for public administrations in large cities and metropolitan areas that require strategies to guide decision-making practices for urban improvement and regeneration policies that aim at improving sustainability in environmental, economic and social terms [
11,
12,
13,
14].
In this regard, recent studies have developed urban vulnerability observatories that have been useful in guiding urban policies for the regeneration of neighborhoods in Europe and Spain [
15,
16,
17,
18]. These previous studies on urban vulnerability in Spain have aimed to detect the most disadvantaged neighborhoods, providing a theoretical framework and methodological proposals that include a process of operation of the concept of vulnerability in analytical terms and measurable indicators, and, in addition, the establishment of an analytical mechanism to measure vulnerability in different territorial areas that can be diagnosed [
19,
20,
21,
22,
23]. An example of this is the research project in which this research has taken place [
24].
In Catalonia there are also referential initiatives for the definition, analysis, and intervention on vulnerable areas. These are sponsored by the Neighborhood Law [
25], whose main objective is to act in those neighborhoods and towns where urban and social problems had been detected. The law encourages a comprehensive approach, taking into account both urban rehabilitation and the development of social and economic projects that aim to promote social cohesion [
26]. Its developed program focuses on neighborhoods and urban areas that are in most need of the public administration support in order to improve living conditions [
27] and promote urban equity. Proposed neighborhoods or urban areas could show any of the following situations: urban regression processes (degradation of buildings, lack of qualified public space, lack of facilities, etc.), demographic problems (due to loss, aging, or too rapid growth of the population), presence of particularly serious economic or social problems, or urban and local development deficits.
The city of Barcelona has had numerous urban regeneration policies with different aims and outcomes [
12]. The city’s current reality is the result of multiple complex phenomena with high urban and social consequences. The socio-spatial integration of migrant population, the touristic boom, and gentrification processes are current situations that are developing simultaneously in the city. At the same time, a framework of economic crisis, in which public investments in urban and social matters decrease, provides a conjuncture that translates into an increase in social polarization and socioeconomic inequality that is manifested and expressed in the territory.
In this context, several studies in the metropolitan area of Barcelona have sought to detect, quantify, characterize, and/or map the existing intra-urban differences [
22,
28,
29], based on quantitative methodologies that include demographic, socioeconomic, and urban data, with the purpose of establishing inequality measures.
In its attempt to inform the design and development of recent redistributive policies, the administration of the city of Barcelona also needed to carry out a deeper characterization of socio-residential vulnerability in the city of Barcelona [
30] based on recent and updated data.
Widely, the methodological search of tools to measure urban vulnerability has proven to require systematic frameworks to integrate very heterogeneous information and data in order to inform decision-makers to better evaluate and prioritize in front of the very complex and multi-faced reality of vulnerable urban areas.
This research shows in depth the methodology and results obtained from the most detailed study of socio-residential vulnerability in the city of Barcelona [
31] up to date. It provides a description of the data sources and the analytical methodology that consists of the measurement of a set of indicators as well as the development of a multi-criteria analysis in GIS. Finally, results allow determining the characterization of neighborhoods and census sections according to each indicator, and the identification of areas with a greater degree of vulnerability according to the multi-criteria synthetic analysis.
3. Methodology
The multidimensional nature of the vulnerability concept implies a major challenge when it comes to operationalizing and measuring it. Likewise, the very availability of updated data and the necessary disaggregated territorial units carry a new difficulty when transferring the concept to a measurable entity.
Reference studies [
20,
21,
22], especially the Urban Vulnerability Atlas (UVA) [
15], advance in the effort to operationalize the concept of vulnerability and make it measurable and analytical. With this objective, the present proposal for the operationalization of the concept includes four large dimensions or basic axes, which include main components specified in statistical measurement indicators.
To address this system of identification, elaboration, and calculation of the most relevant components and indicators, a wide range of indicators has been chosen, refined, and contrasted with experts through an iterative process consisting of various work sessions in which the contents have been analyzed and discussed.
This proposal is set out below.
3.1. Conceptualization and Organization in Axes: The Dimensions of Urban Vulnerability
From the foregoing, it can be deduced that urban vulnerability becomes the result of jointly considering sociodemographic, socioeconomic, residential, and, finally, subjective vulnerability. The identification of these four dimensions implies starting from a global vision of what urban vulnerability entails, and, at the same time, considering and combining specific aspects and processes of different nature that have a direct impact on increasing vulnerability in urban areas [
9,
15,
18,
20,
21,
22,
23].
Regarding the dimension of sociodemographic vulnerability, three demographic phenomena present in current Spanish society have strong implications in increasing social vulnerability. First, demographic aging. The progressive aging of the population is a phenomenon consolidated in Spanish and Catalan societies. This trend is characterized by an increase in life expectancy, an increase in the total number of elderly people, and also in their proportion with respect to adults and young people. While many authors show the correlation between the aging of the population and the prosperity of society [
32], the aging of the population also has a clear impact on social vulnerability. Dependency, health problems, deterioration of housing, lack of income or low income, and the increase of one-person households are factors that can lead to part of the old population being vulnerable. Second, the dimension of sociodemographic vulnerability also includes the greater complexity of the household structure with the appearance and consolidation of typologies with a high risk of social vulnerability. It refers to single-parent households, old people living alone, and extended households, especially those that are formed from the coexistence of a recently arrived migrant population who resort to shared housing as a strategy to access housing, lowering its cost. Finally, the third aspect or main idea would refer to the boom in foreign migration with fewer economic resources. The arrival of foreign migrant population calls for an accompaniment that can guarantee their rights and enable their integration into the arrival society. Different authors identify the formation of spaces of vulnerability as forms of urban segregation in contexts in which there is the strong and sudden growth of migrant population, especially in the case of groups with lower economic resources, if there is no specific public support that fosters integration [
33].
Regarding the dimension of socioeconomic vulnerability, the UVA [
20] defines it as the capacity of households to satisfactorily obtain a certain material and emotional well-being. This area is directly related with the world of employment, considering job access, working conditions, and the professional training and education of the population. For this reason, the three main ideas that are considered in this area are unemployment (especially due to high unemployment rates), job insecurity (unstable working conditions and low wages), and the low educational levels of the working classes (especially derived from the high school dropout rates among young people).
Regarding what this work coined as “residential and socio-urban vulnerability”, many authors integrate indicators that refer to deficiencies in urban services and spaces as well as in residential buildings in a dimension that indicates urban regression [
18,
20,
22,
23]. This dimension highlights the importance of spatial sustenance for the satisfactory development of daily life: the need for quality housing and the quality of the neighboring residential urban environment.
Finally, the dimension of subjective vulnerability [
20] includes the subjective perceptions that residents have of the problems and shortcomings of their urban and social environment. This dimension is based on aspects of social and urban vulnerability that are directly pointed out by the residents of an area. This dimension was not included in the present research given the difficulty to assess new qualitative data, and because the type of information that it would have provided was coincident with that obtained in other quantitative available data.
In this way, it was decided to divide the research into three axes of study:
Axis 1. Socio-economic vulnerability, characterized by unemployment (especially high rates), a precarious labor market (instability and low income), and the low educational level of the working classes (especially related to school dropouts).
Axis 2. Sociodemographic vulnerability, characterized by demographic aging (related to situations of dependency, health problems, deterioration of housing, lack of income or low income, and increase in single-person dwellings), and the greater complexity of the housing structure (linked to the consolidation of family types with high social vulnerability such as extended households of migrant low-income population).
Axis 3. Residential and socio-urban vulnerability refers to the degradation of both housing and neighboring residential urban environment, which becomes a risk of vulnerability among the resident population. Poor housing as well as residential environments that do not meet the basic habitability requirements due to their poor state of conservation, insufficient surface area, or lack of basic facilities, are the highest expressions of residential vulnerability.
Each of the defined axes was approached quantitatively after the set of indicators were drawn up (see
Section 3.2) from the available information sources (see
Table 1).
The universe of buildings to include in this research was determined by identifying those that contained dwellings. These exhaustive previous filtering works were necessary in order to assess the residential dimension of vulnerability.
3.2. Analysis of Indicators, Measurement Scale, and Elaboration of the Model Layer Index
A process for preparing the revised dataset was developed to integrate it into the geographic and multicriterial data analysis process. The preparation of the data set consisted of taking data from the different data sources and developing a first stage of review and preparation, with the following procedure:
Definition of the appropriate descriptors for each axis
Selection and creation of the dataset
Data processing and cleaning
Data transformation
Identification of the geographical units of study
3.2.1. Indicators
In total, 37 quantitative indicators of different issues were considered (
Table 2) at the neighborhood, census unit (the geographic unit that delimitates the population census), and block level. They were adjusted to the concepts that had previously been proved relevant when measuring situations of vulnerability. Thus, after a first analysis and synthesis of the first results, different approaches were produced, and they provided a set of representative indicators of the three axes of study.
The data were structured in a matrix, developing several indicators related to each component (set of indicators on a topic) (see
Table 2). These indicators were analyzed and mapped. Subsequently, they were debated and reviewed in a consultative table of professional, academic, and municipal experts who are familiar with the city, and they set out their data selection criteria. This methodology allowed us to identify valid decision rules to incorporate the components and indicators that are more capable of detecting deficiencies and adding content on those topics that were deemed relevant especially in relation to the situation of fragility of people.
The definition of each indicator and the reasoning of their evaluation is provided in the evaluation section (see
Section 4) where each indicator is further described according to each axis (see
Section 4.1,
Section 4.2 and
Section 4.3)
3.2.2. Measurement Scale
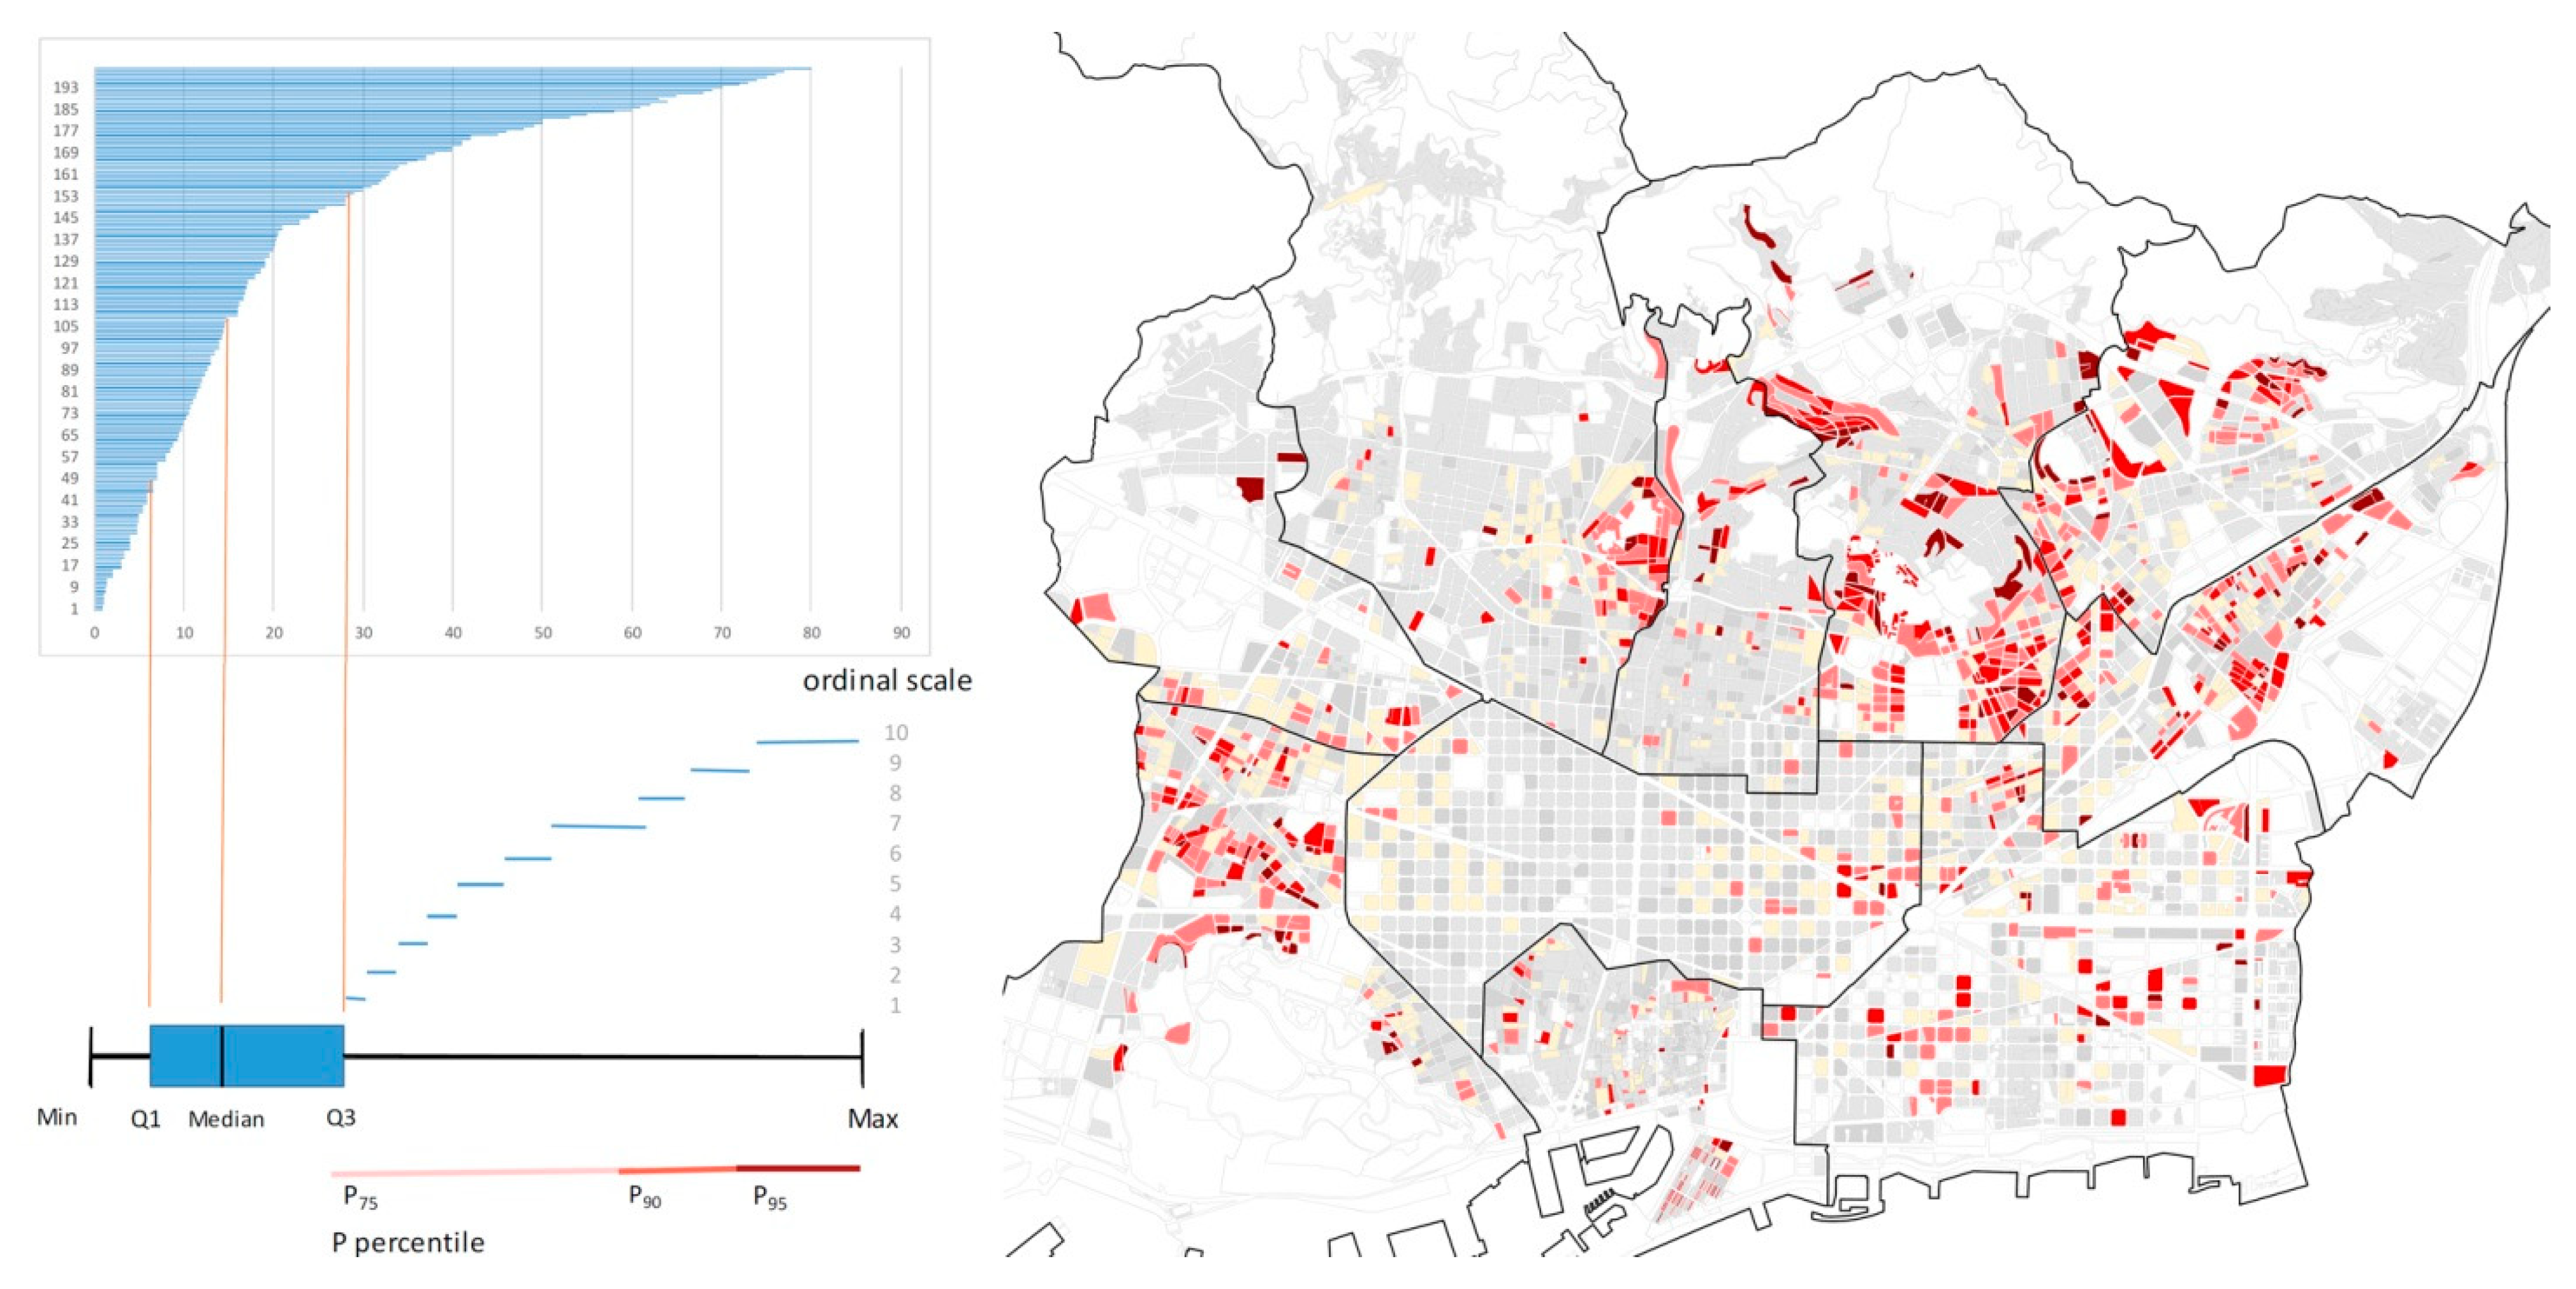
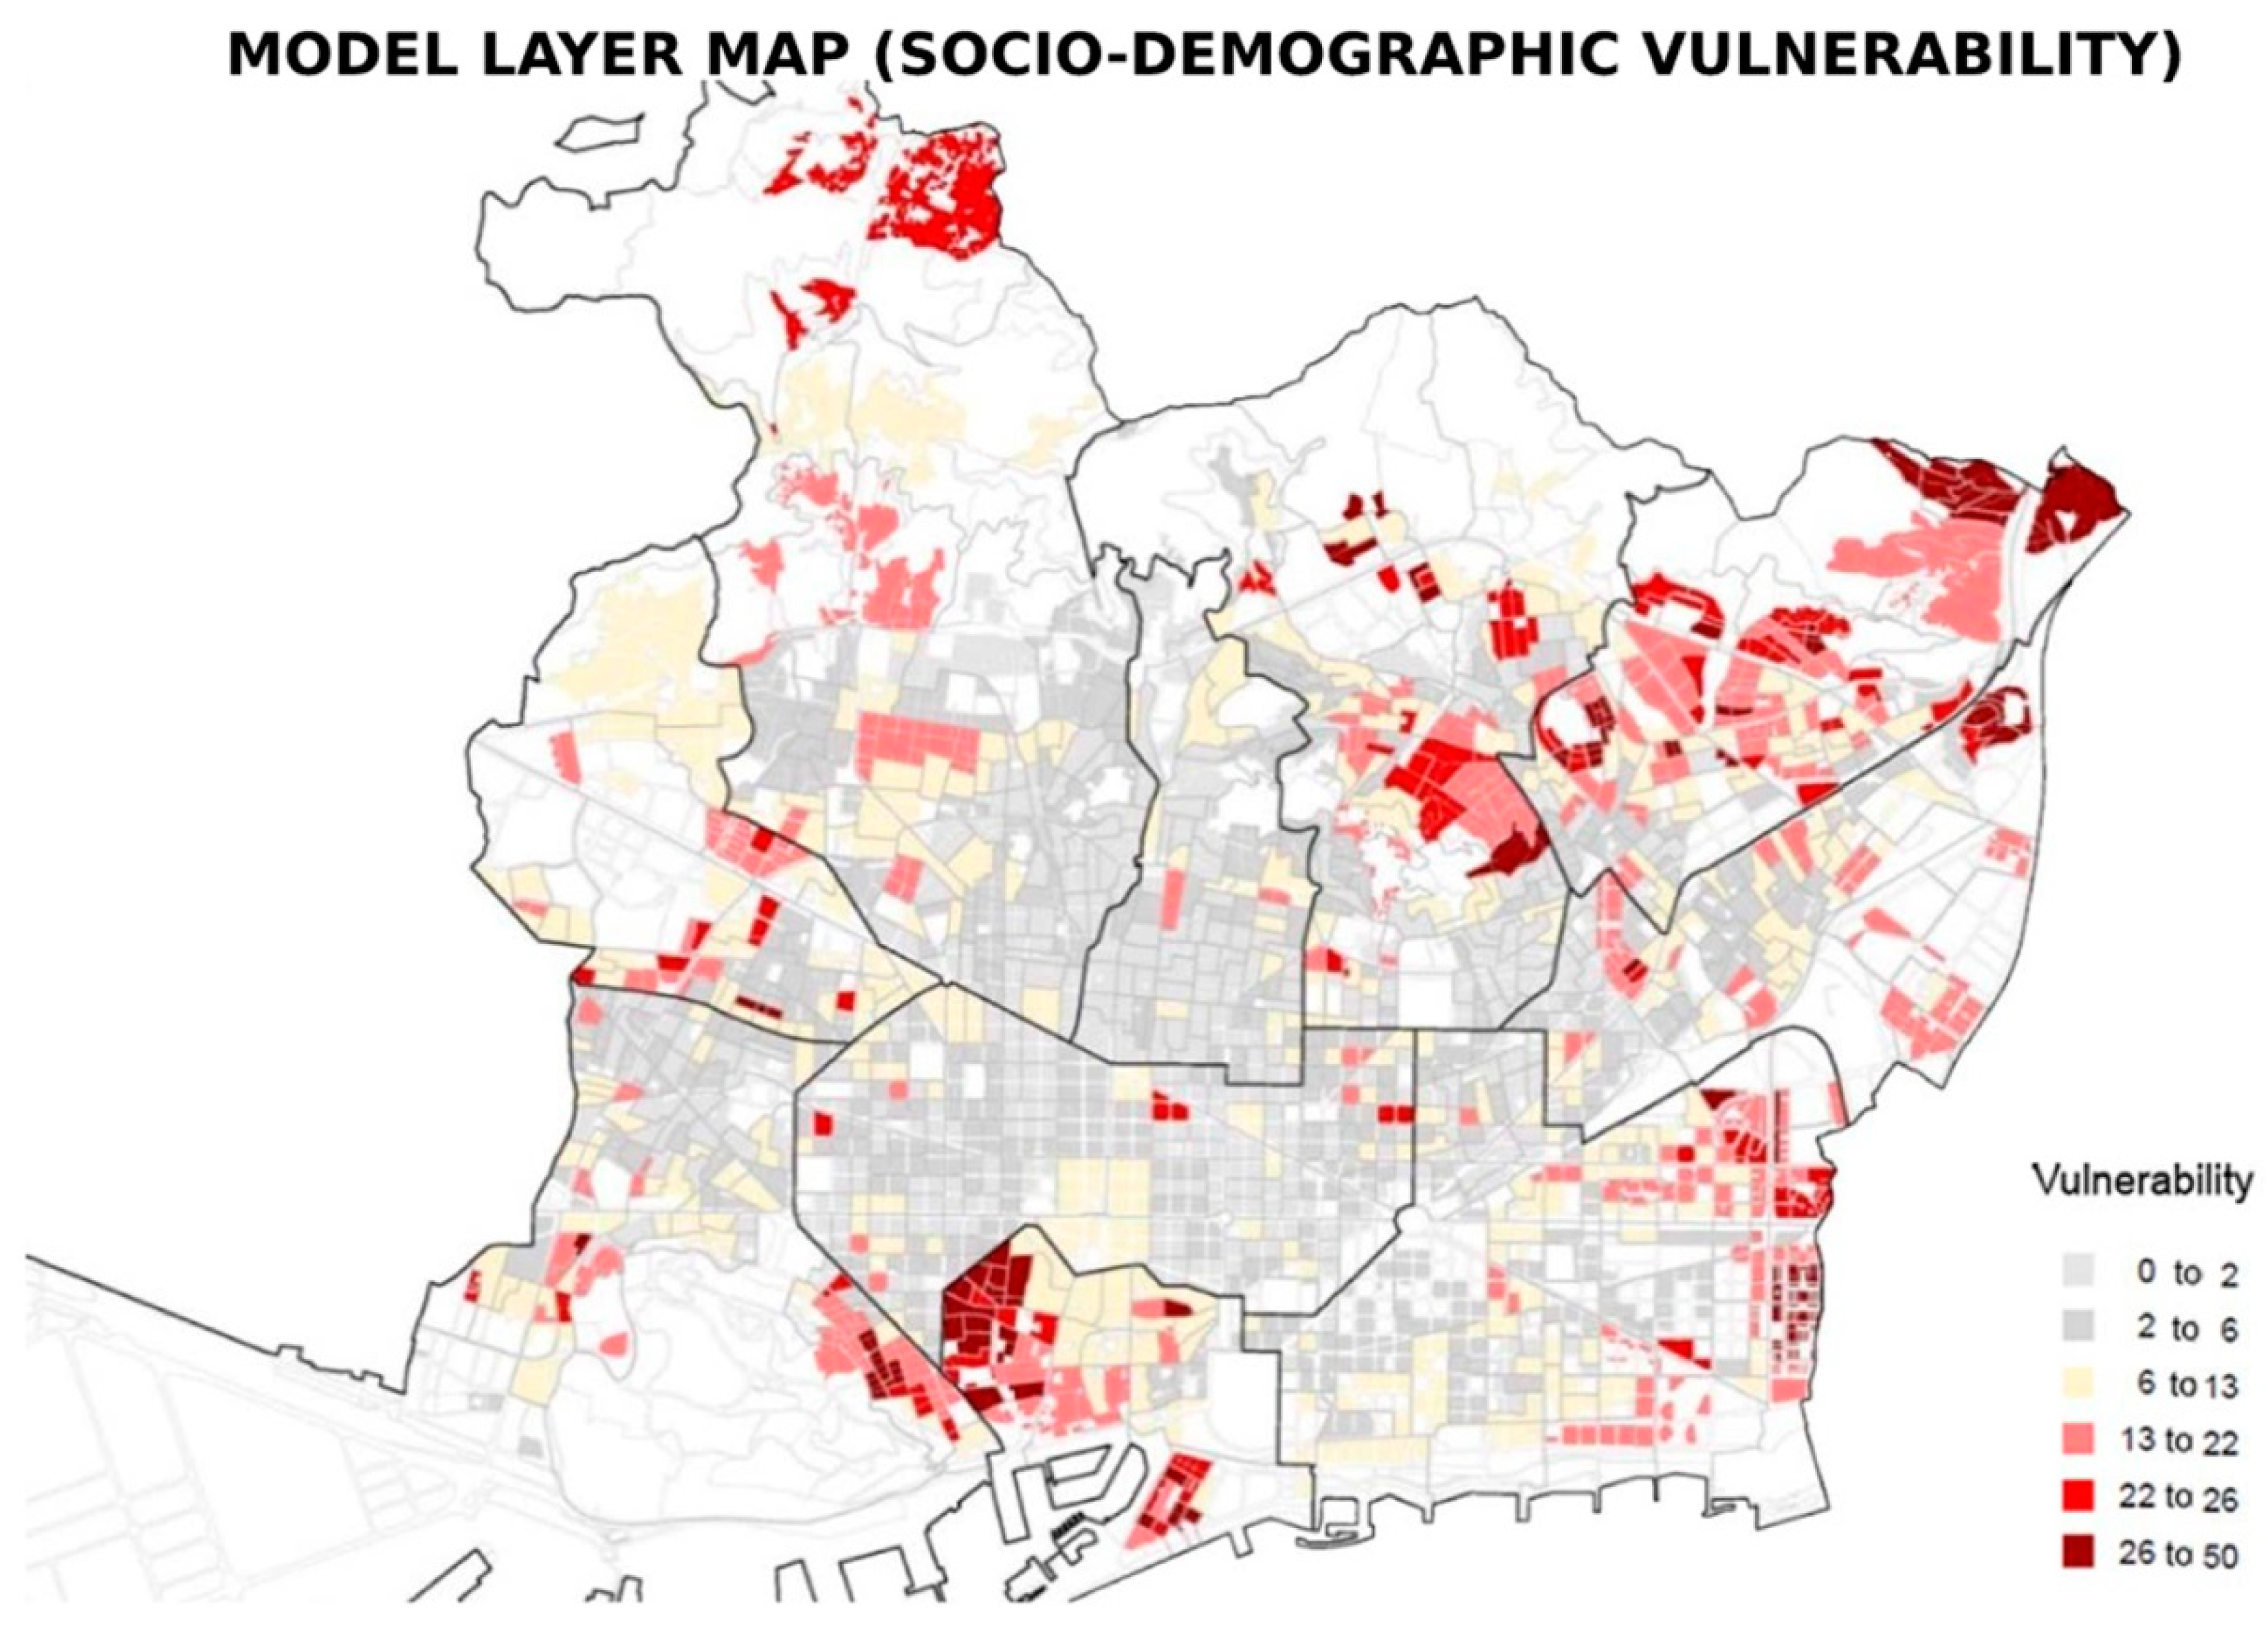
The most unfavorable extreme was identified for each indicator, at census unit or neighborhood level. The extreme quartile that contains 25% of the units is the one that is identified with a situation of vulnerability. On this set of extreme units, a scale from 1 to 10 was established to emphasize the level of fragility and to differentiate the most extreme threshold in all cases (
Figure 1).
This measure establishes a normalized ordinal scale system for each entity (neighborhood, urban block, or census unit) referred to each indicator, in such a way that it positions each case with respect to the most extreme unfavorable situation rate. This procedure allowed us to define a scale that contributes to identifying the most vulnerable areas according to all the indicators in an organized way. This standardization system is usually applied in multicriterial evaluation studies (MCE) that are applied to territorial planning processes [
34].
In the GIS map for each indicator (
Figure 1), the extreme quartile is highlighted in red, considered to be the most unfavorable range of values. Statistics have been obtained at the census unit level, except for indicators that have only been available by district, where statistics were calculated for this area. All plans of census sections (or neighborhoods according to the indicator) were mapped highlighting the extreme quartile, to accentuate where the problems or risk of vulnerability occur and how they were concentrated in certain areas of the city. The fixed ranges range from 25% to 10%, range with more moderate risk -light pink-, from 10% to 5%, range with more pronounced risk -red-, and from 5% to the maximum or minimum value (according to the indicator), range with extreme risk -garnet-.
3.2.3. GIS and MCE Evaluation Model Map
A methodological decision in the research was to integrate Multi-Criteria Evaluation Systems (MCE), commonly used as a decision-making tool in territorial planning processes [
34], with Geographic Information Systems (GIS). This methodology provided greater control of the results thanks to the assessment capacity enabled by their greater geographical visualization through the mapping of different models, isolated indicators, and synthetic maps.
The possibilities of integration of GIS and MCE have shown difficulties since the pioneering works of Voogd [
35], Janssen and Ruetveld [
36], and Barredo and Bosque [
37], although more recent empirical works have shown a substantial improvement in the GIS analytical modules if combined with standard analytical programs in socioeconomic studies [
38].
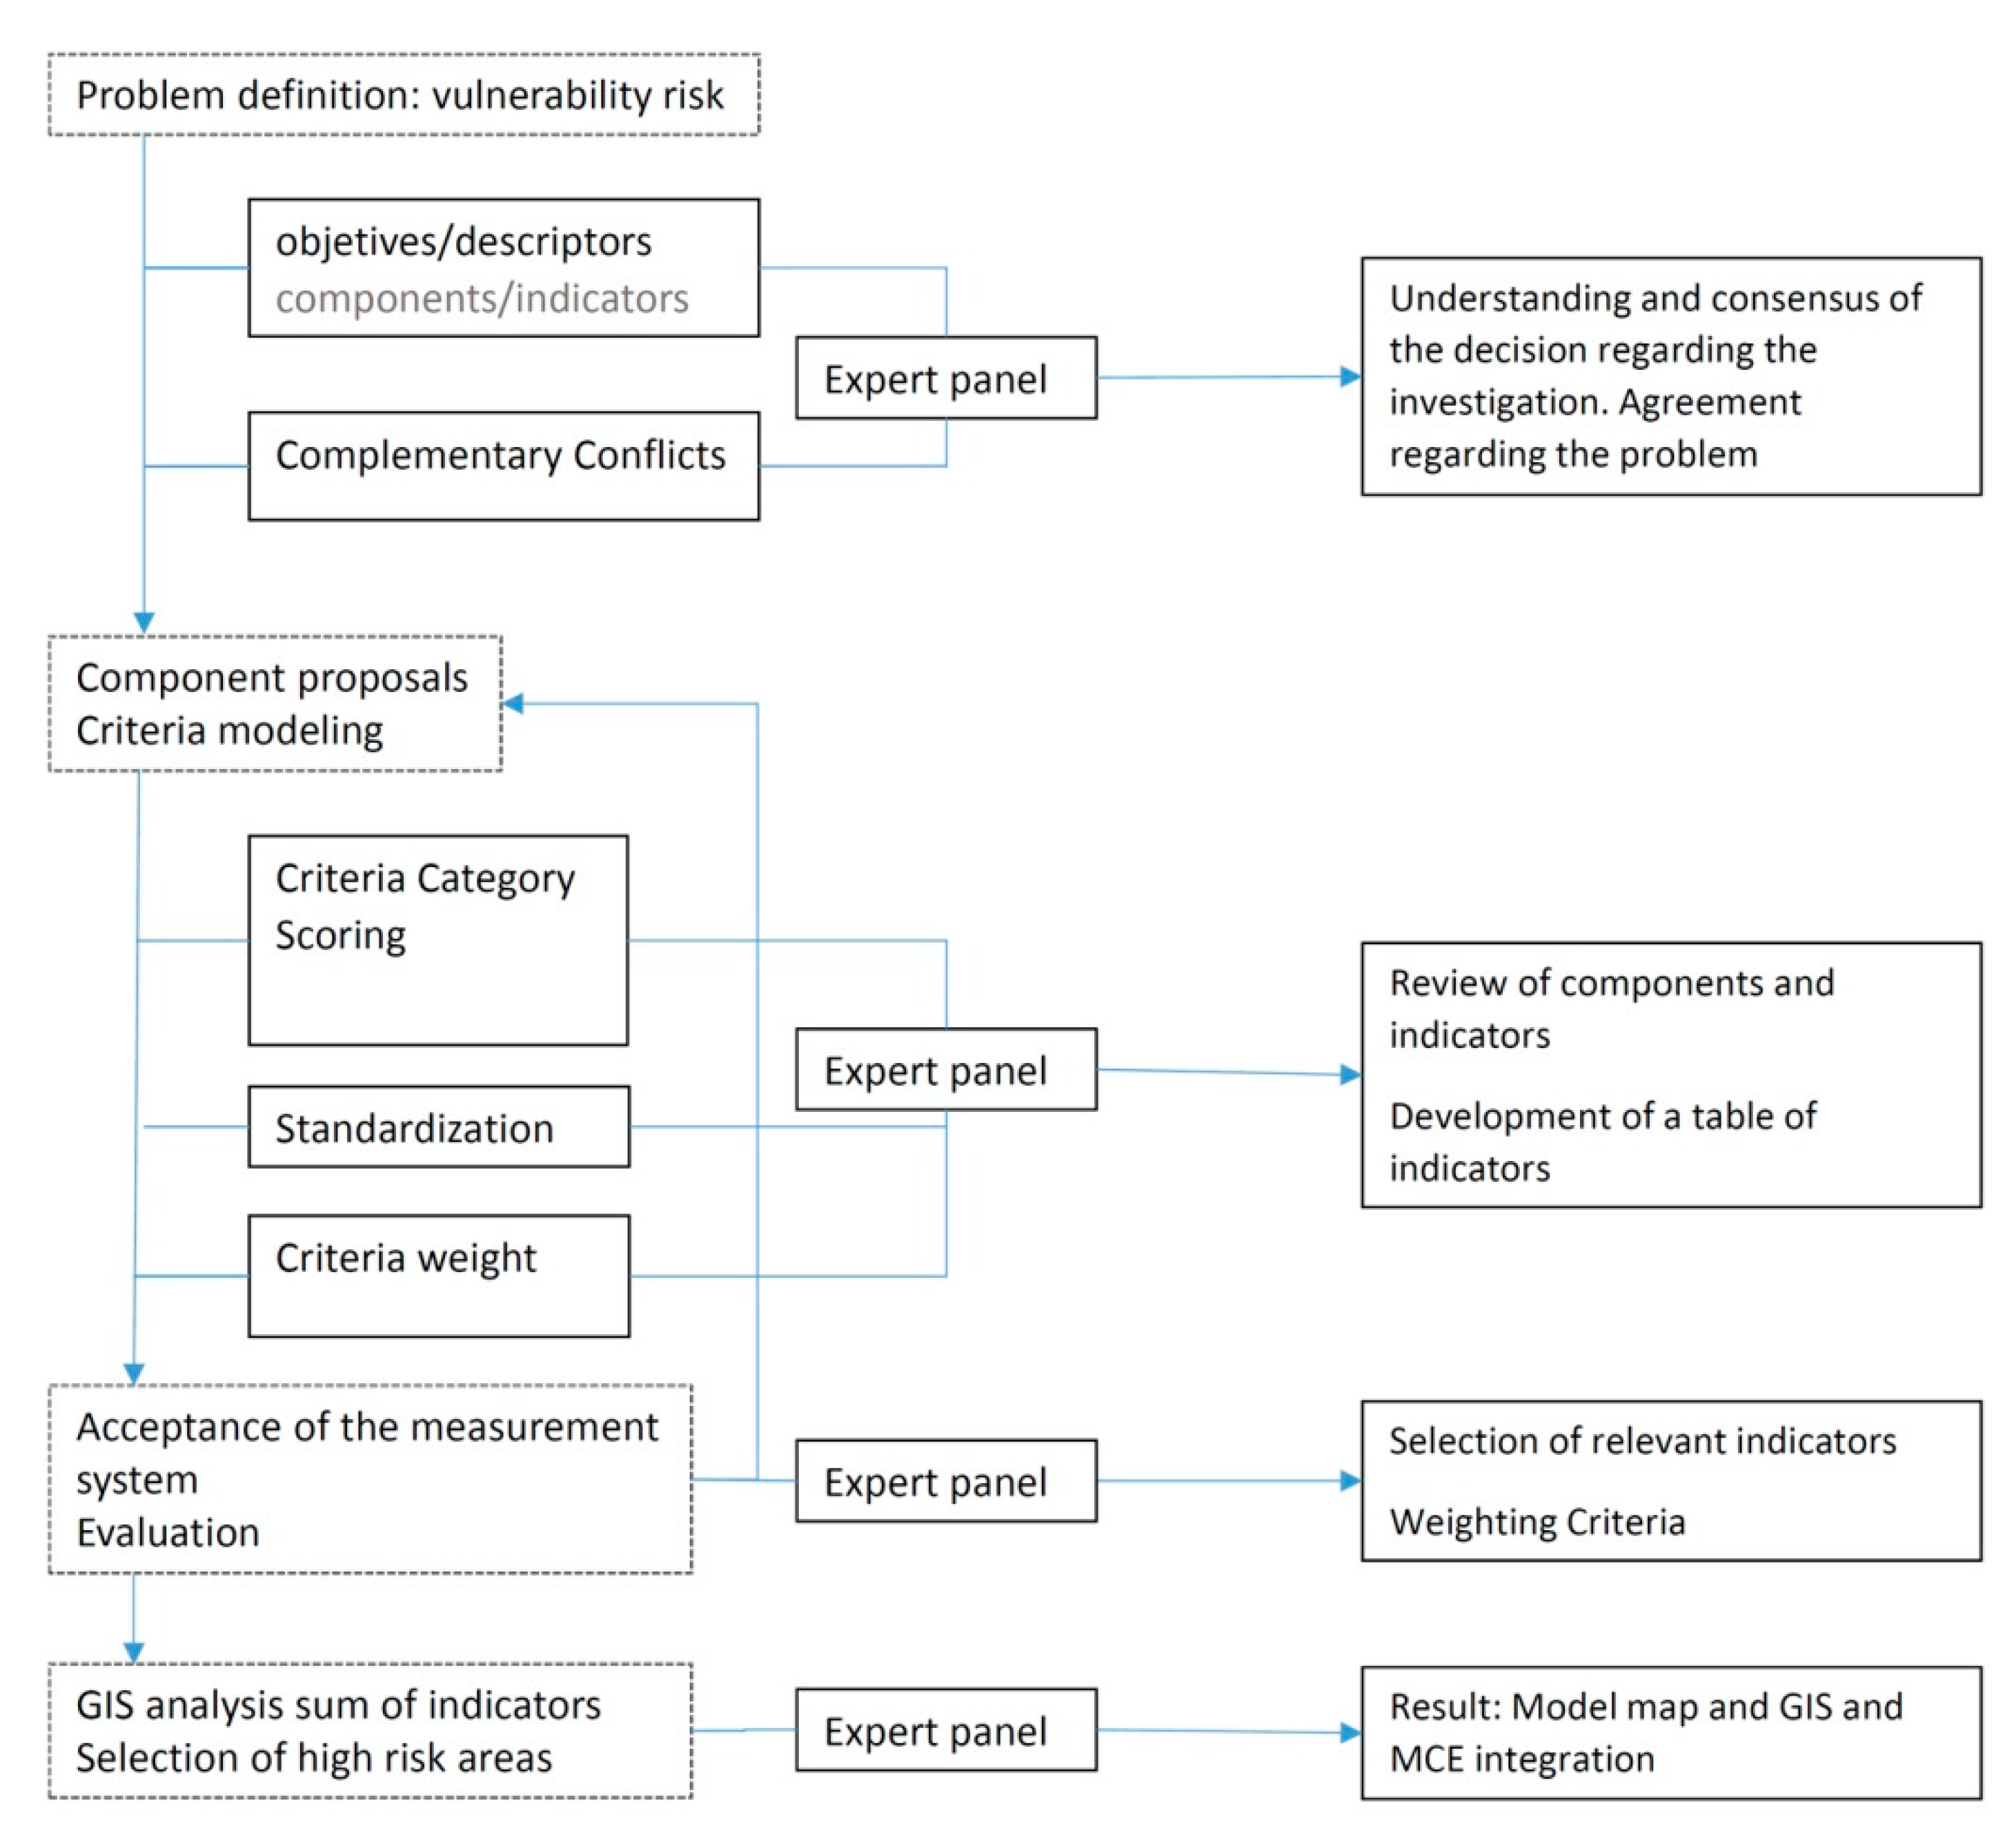
The relative weight matrix of each indicator was established for each of the axes, based on the criteria tested in previous studies and agreed upon in the present research (see
Table 2). The decision-making process brought together the opinions of a panel of experts who, iteratively and in multiple meetings, assigned the weight to each indicator and axis (
Figure 2). This method allows that certain indicators have a higher level of influence on the whole axis of study and its level of vulnerability. Socioeconomic Indicators and Urban and Socio-urban Indicators (axes 1 and 3) were identified as those with the greatest relevance in identifying situations of lack of economic resources and deterioration of physical conditions of housing and its environment. The research was based on a weighting that assigns a meaning of 2/5 to Axis 1, 1/5 to Axis 2, and 2/5 to Axis 3, as shown in
Table 2.
The analytical methodology followed allows the superposition of GIS and EMC information layers in one or more model layers that indicate the global vulnerability value.
4. Evaluation of Indicators and Results
This section shows the research results using the methodology described above. The results are presented according to the three axes of the research: socio-economic vulnerability, socio-demographic vulnerability, and residential and socio-urban vulnerability.
Indicators and components are described in each axis. The values of the entire universe are provided for each indicator, together with an indication of which quartile (in light red below the figures) has been selected for the measure of vulnerability. It is important to note that, in some cases, the highest values of an indicator indicate greater vulnerability, while, in other cases, the lowest values are more unfavorable.
A GIS and MCE evaluation model map is provided for each axis as a result of a synthesis that is obtained according to the weights described in
Table 2.
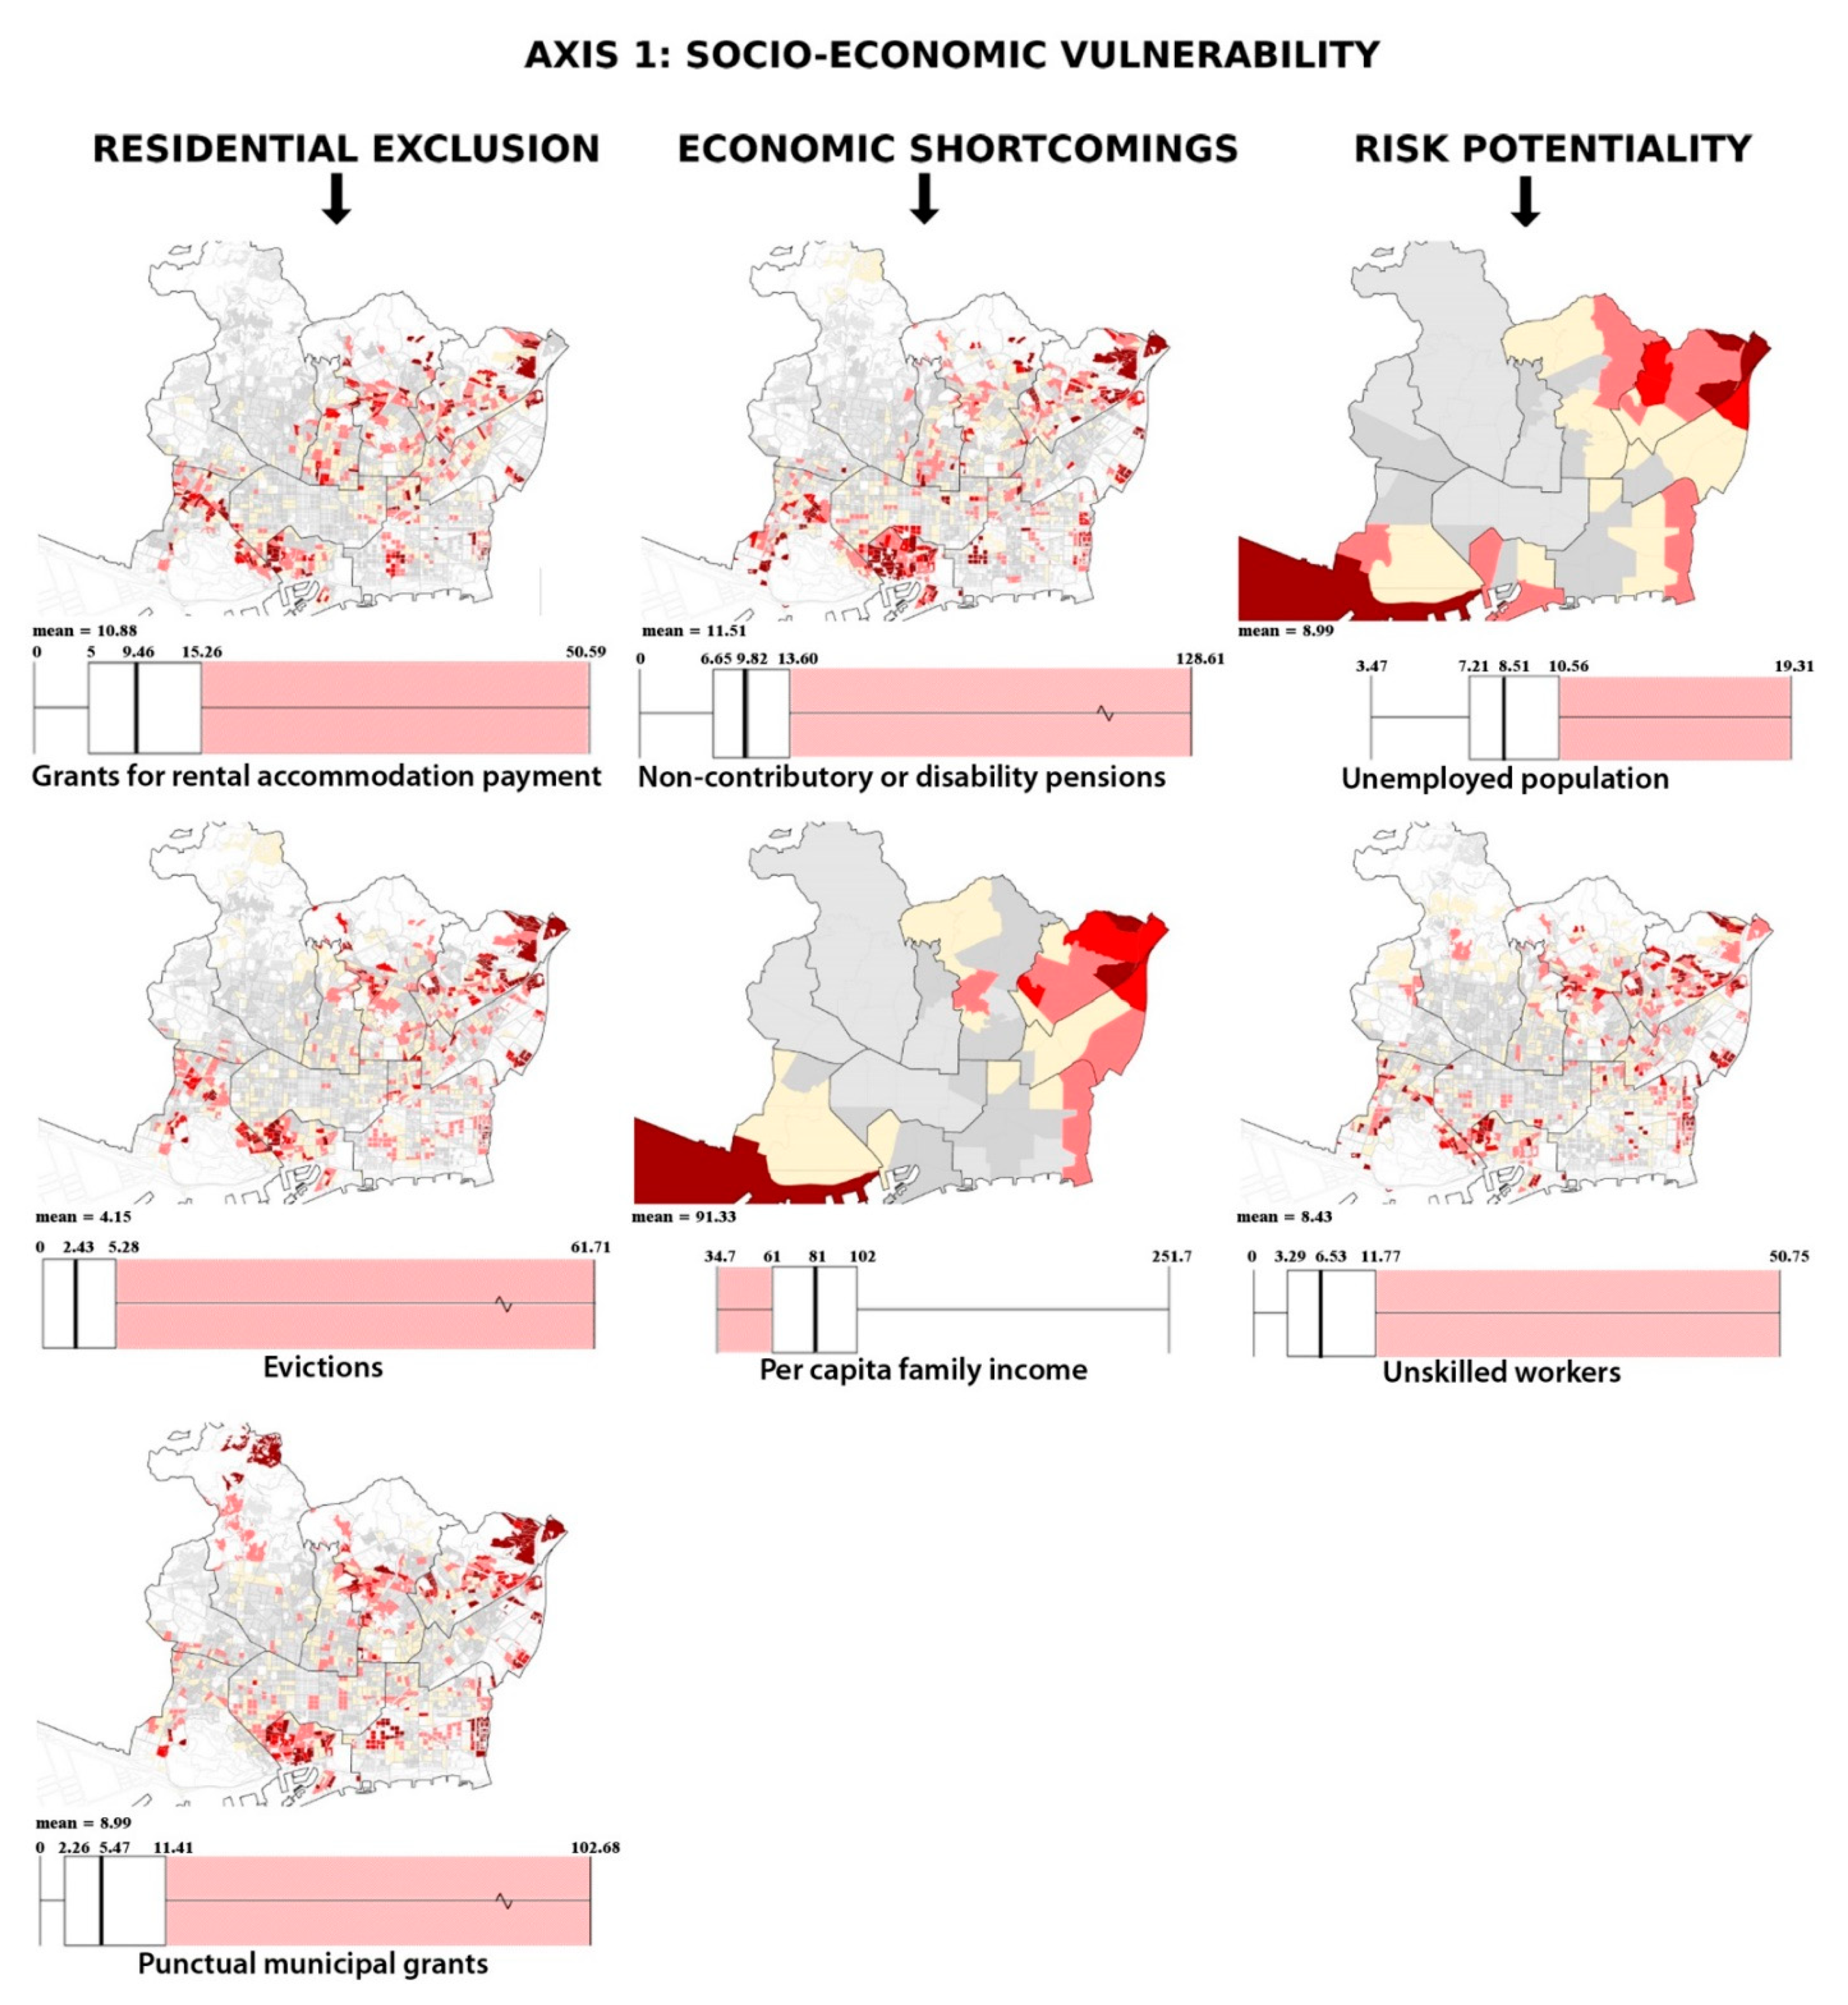
4.1. Socio-Economic Vulnerability
As previously stated, 7 indicators grouped into 3 components were used to assess socio-residential vulnerability:
Grants for rental accommodation payment: number of grants requested per 1000 homes of the census unit. Those census units where there is a greater number of requested grants are highlighted.
Evictions: number of eviction files registered per 1000 homes of the census unit. Those census units where there is a greater number of evictions are highlighted.
Punctual municipal grants: number of grants granted per 1000 homes of the census unit. Those census units where there is a greater number of grants are highlighted.
Non-contributory or disability pensions: number of non-contributory or disability pensions per 1000 inhabitants of the census unit. Those census units where there is a greater number of people who receive these pensions are highlighted.
Per capita family income: per capita family income according to Barcelona City Council for each neighborhood compared with the city average. Neighborhoods with the lowest per capita income are highlighted.
Unemployed population: proportion of unemployed population with respect to the total population aged 20 to 64, according to data by district of the Barcelona City Council. Neighborhoods with a higher unemployment rate are highlighted.
Unskilled workers: proportion of unskilled workers in relation to the total workforce. Neighborhoods with a higher representation of unskilled workers are highlighted.
Figure 3 shows the results and maps of each of the indicators referring to socio-economic vulnerability.
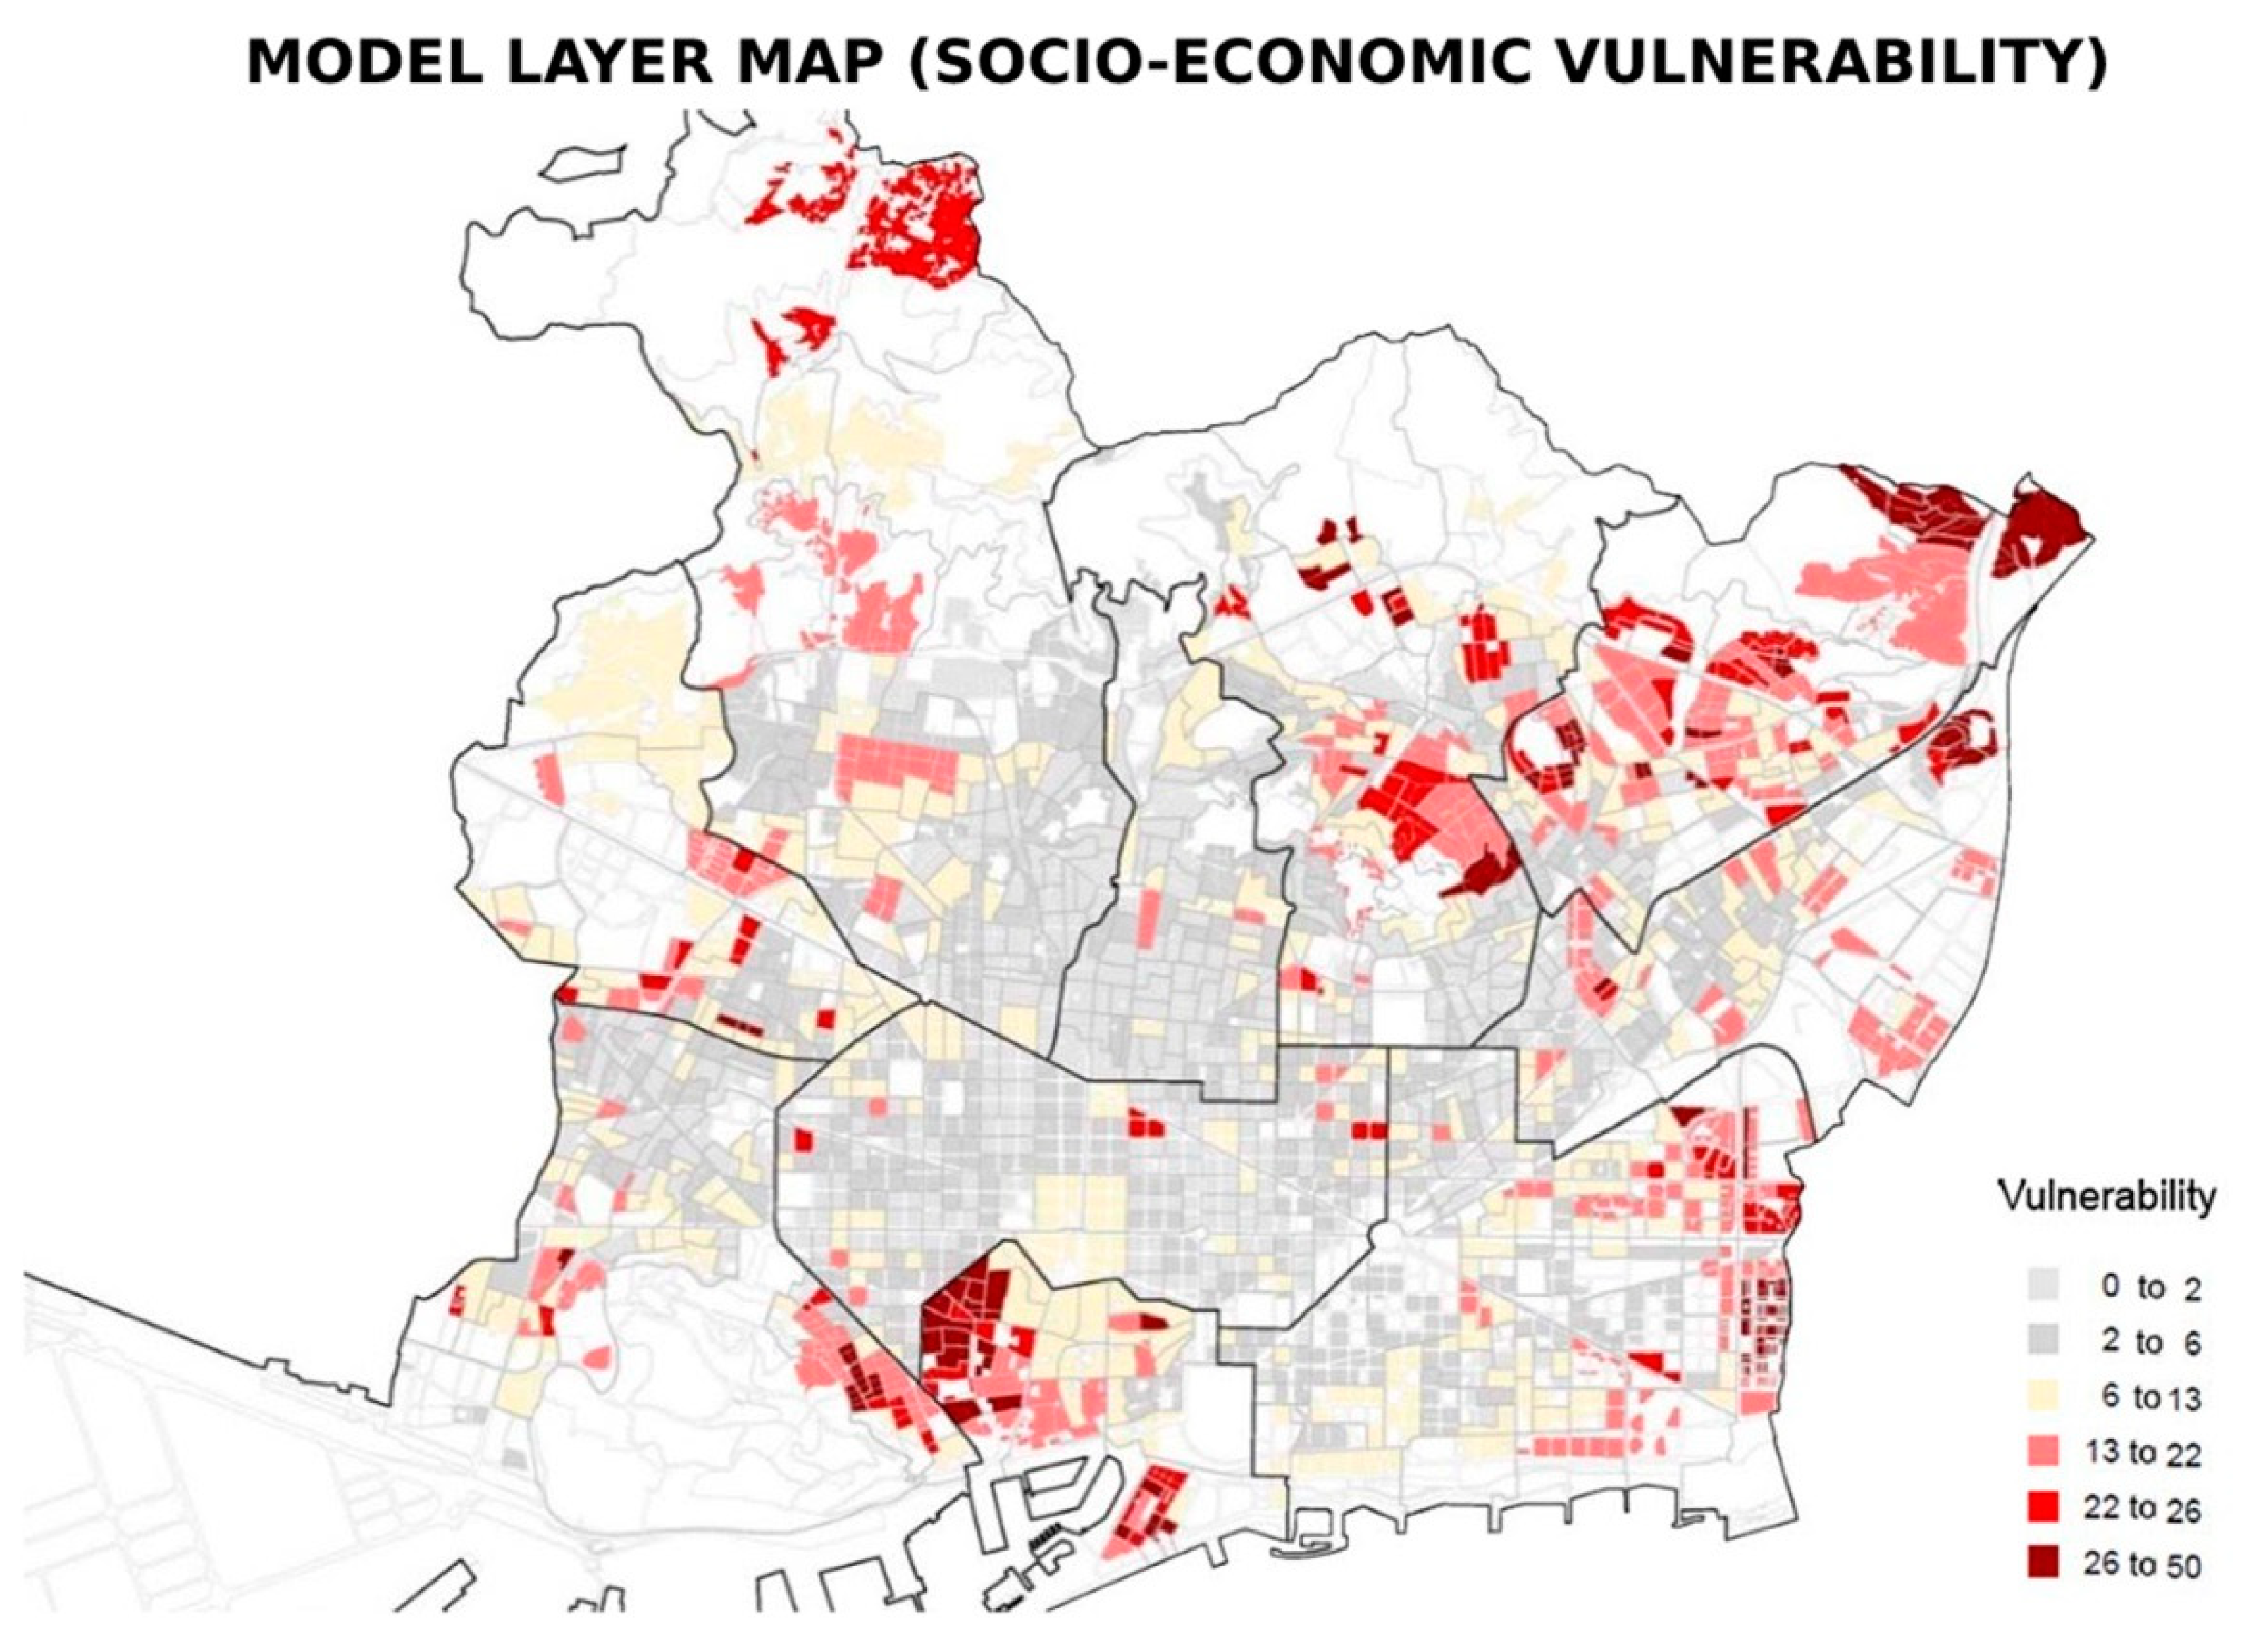
Figure 4 shows the GIS and MCE evaluation model map as a synthesis of this axis.
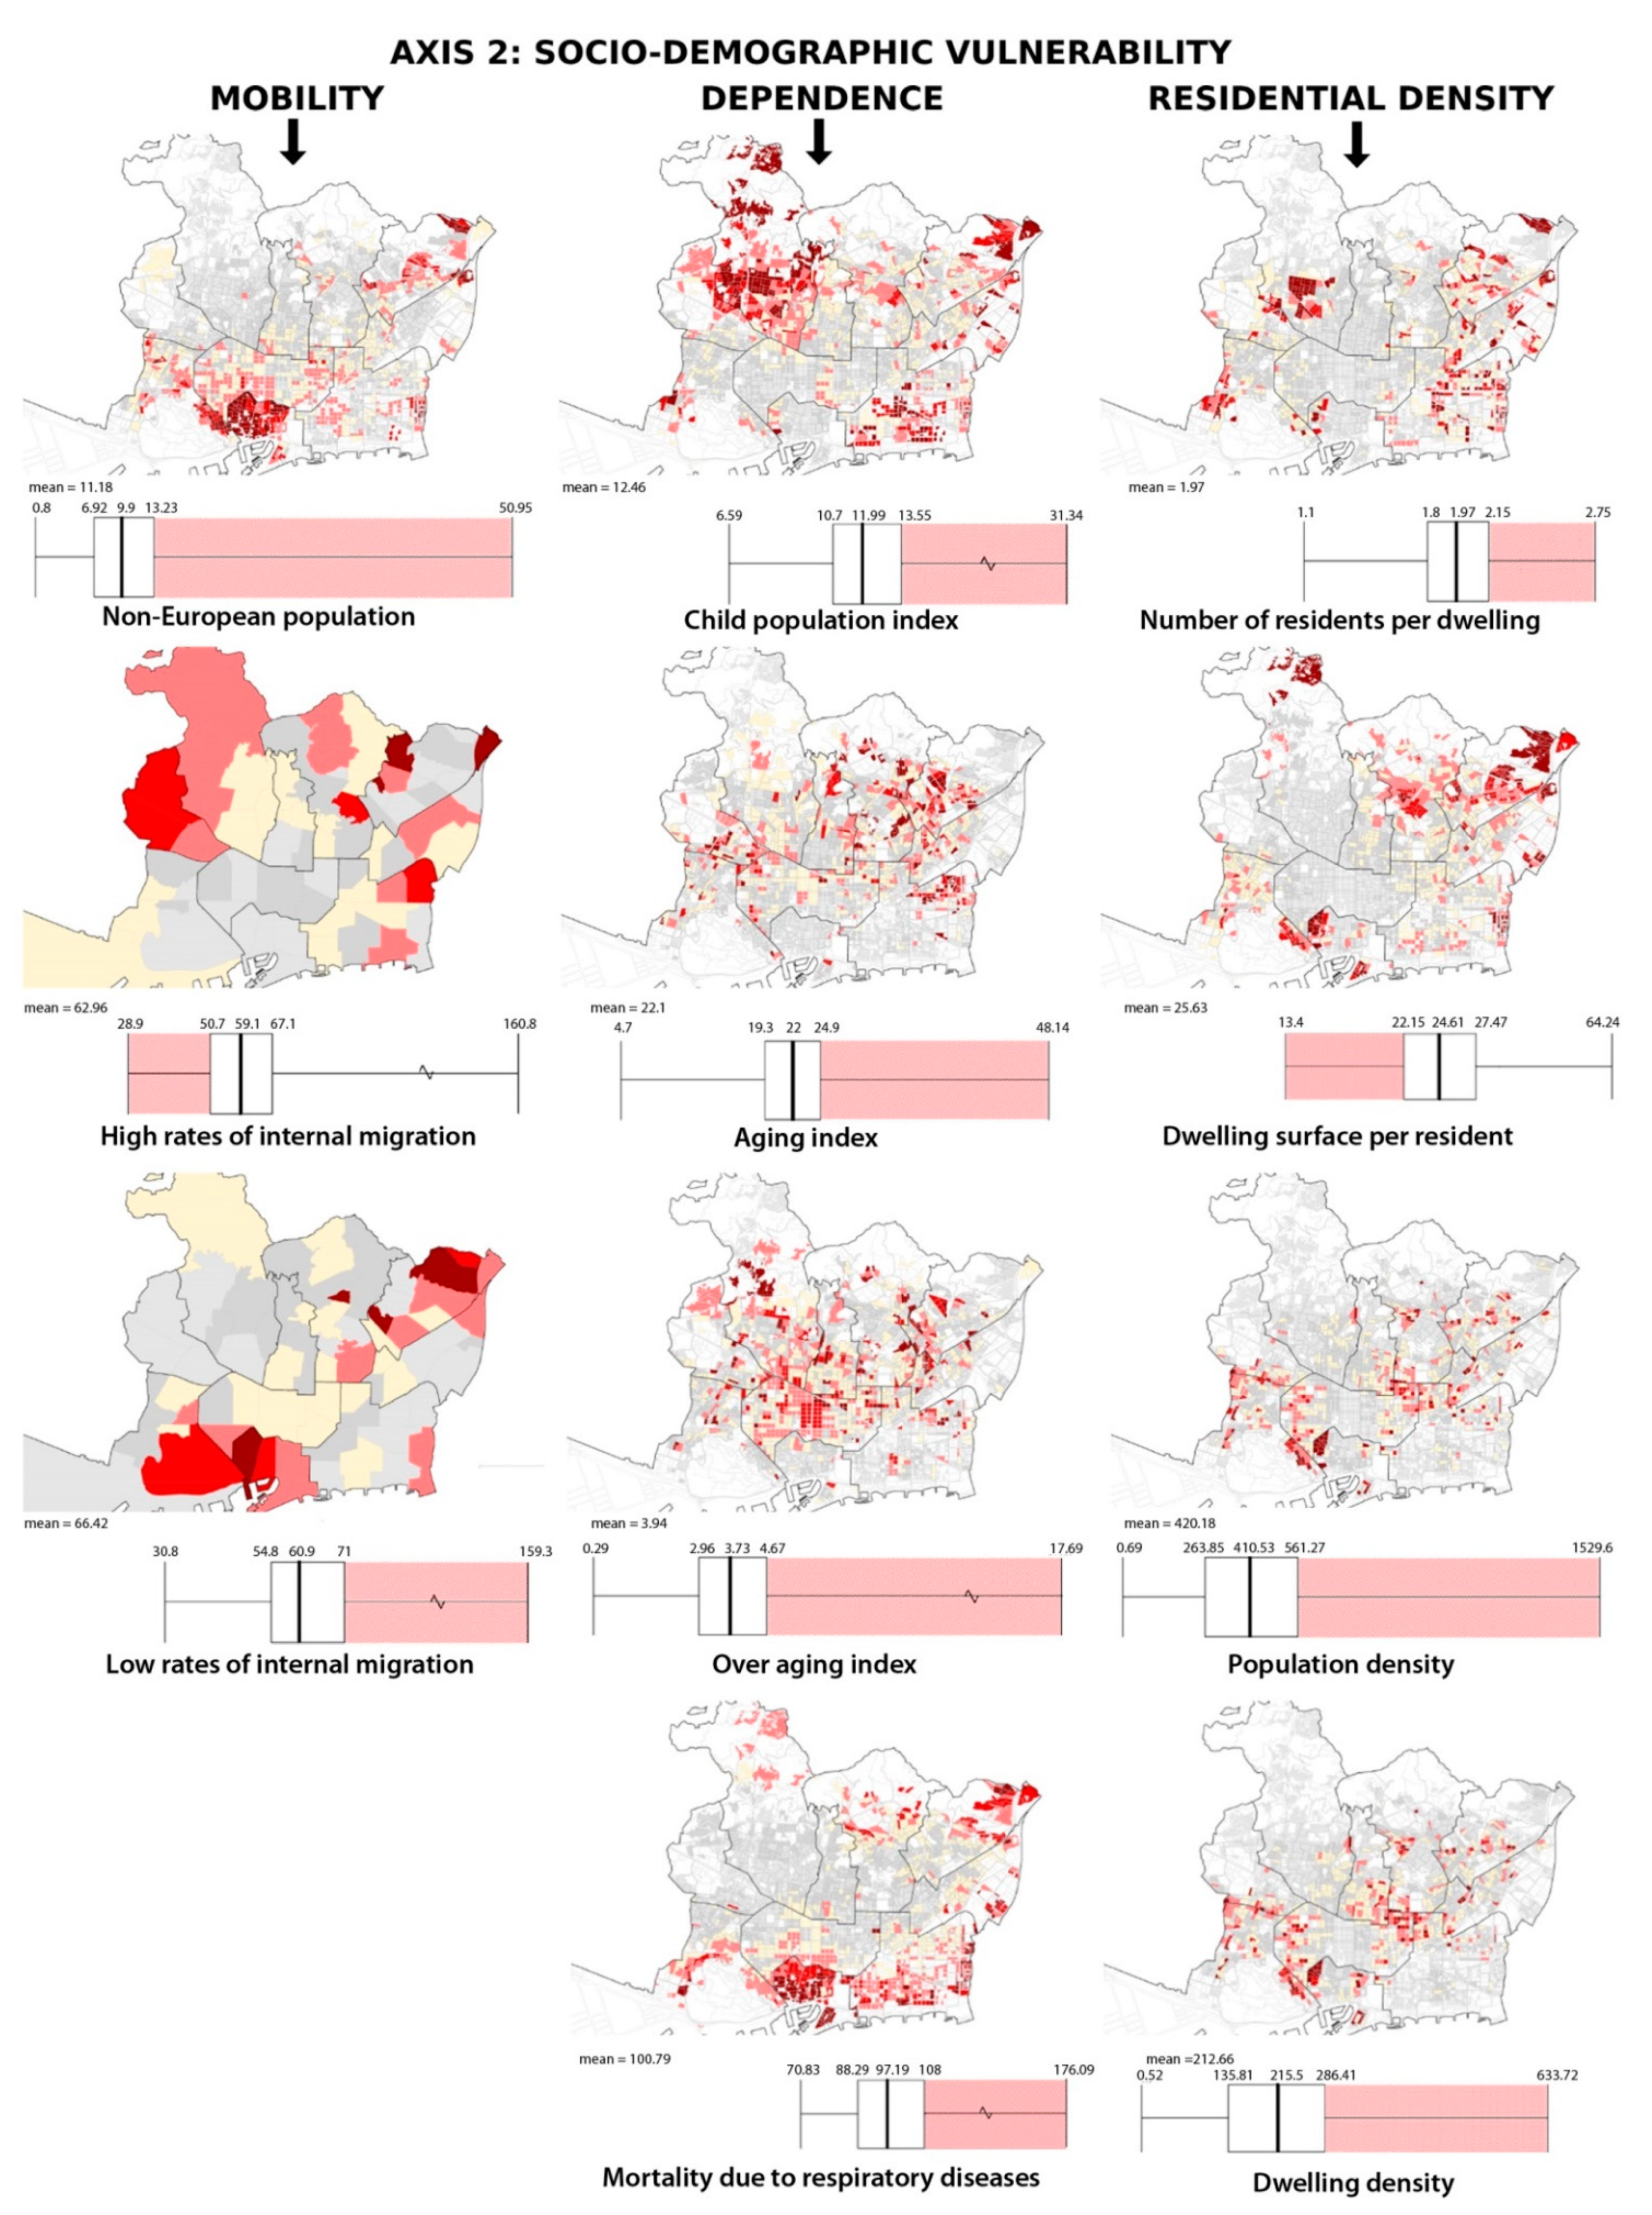
4.2. Socio-Demographic Vulnerability
To assess the socio-demographic vulnerability, 11 indicators grouped into 3 components were used:
Non-European population (nationality): number of inhabitants who do not have a European nationality in relation to the total population of each census unit. Neighborhoods with a greater number of non-European nationalities are highlighted.
High rates of internal migration: number of new neighborhood inhabitants per 1000 inhabitants. This indicator is interpreted positively in high values and negatively in low values. Since they denote an enclosed or potentially isolated population and an unattractive area for new local settlers, the lowest values are highlighted.
Low rates of internal migration: inhabitants that leave the neighborhood per 1000 inhabitants. It is interpreted negatively and neighborhoods with the highest population abandonment are highlighted.
Child population index: population younger than 15 years in relation to the total population. Census units with a greater number of children and, therefore, dependent population, are highlighted.
Aging index: proportion of the population over 65 in relation to the total population of the census unit. Census units with a greater number of inhabitants over 65 are highlighted.
Over aging index: proportion of the population over 85 in relation to the total population of the census unit. Census units with a greater number of inhabitants over 85 are highlighted.
Mortality due to respiratory diseases: ratio of the mortality of people due to respiratory diseases standardized by age and smoothed following Bayesian methods, considering the average between men and women. Many academic studies confirm that living conditions in homes can influence people’s health, especially in relation to respiratory diseases [
39]. This indicator highlights census units where there is a greater number of deaths due to respiratory diseases.
Number of residents per dwelling: measured by census unit. It indicates potential overcrowding, but it must be contrasted with the dwelling’s surface. Those census units with a greater number of inhabitants per dwelling stand out.
Dwelling surface per resident: census units where the dwelling area per inhabitant is smaller are highlighted.
Population density: it refers to the census units where there is a higher general population density.
Dwelling density: number of dwellings per hectare of land. Census units with a higher density of dwellings are highlighted. It is interpreted as potential over-concentration of residential activity.
Figure 5 shows the GIS and MCE evaluation model map as a synthesis of this axis while
Figure 6 shows the results and maps of each of the indicators referring to socio-demographic vulnerability.
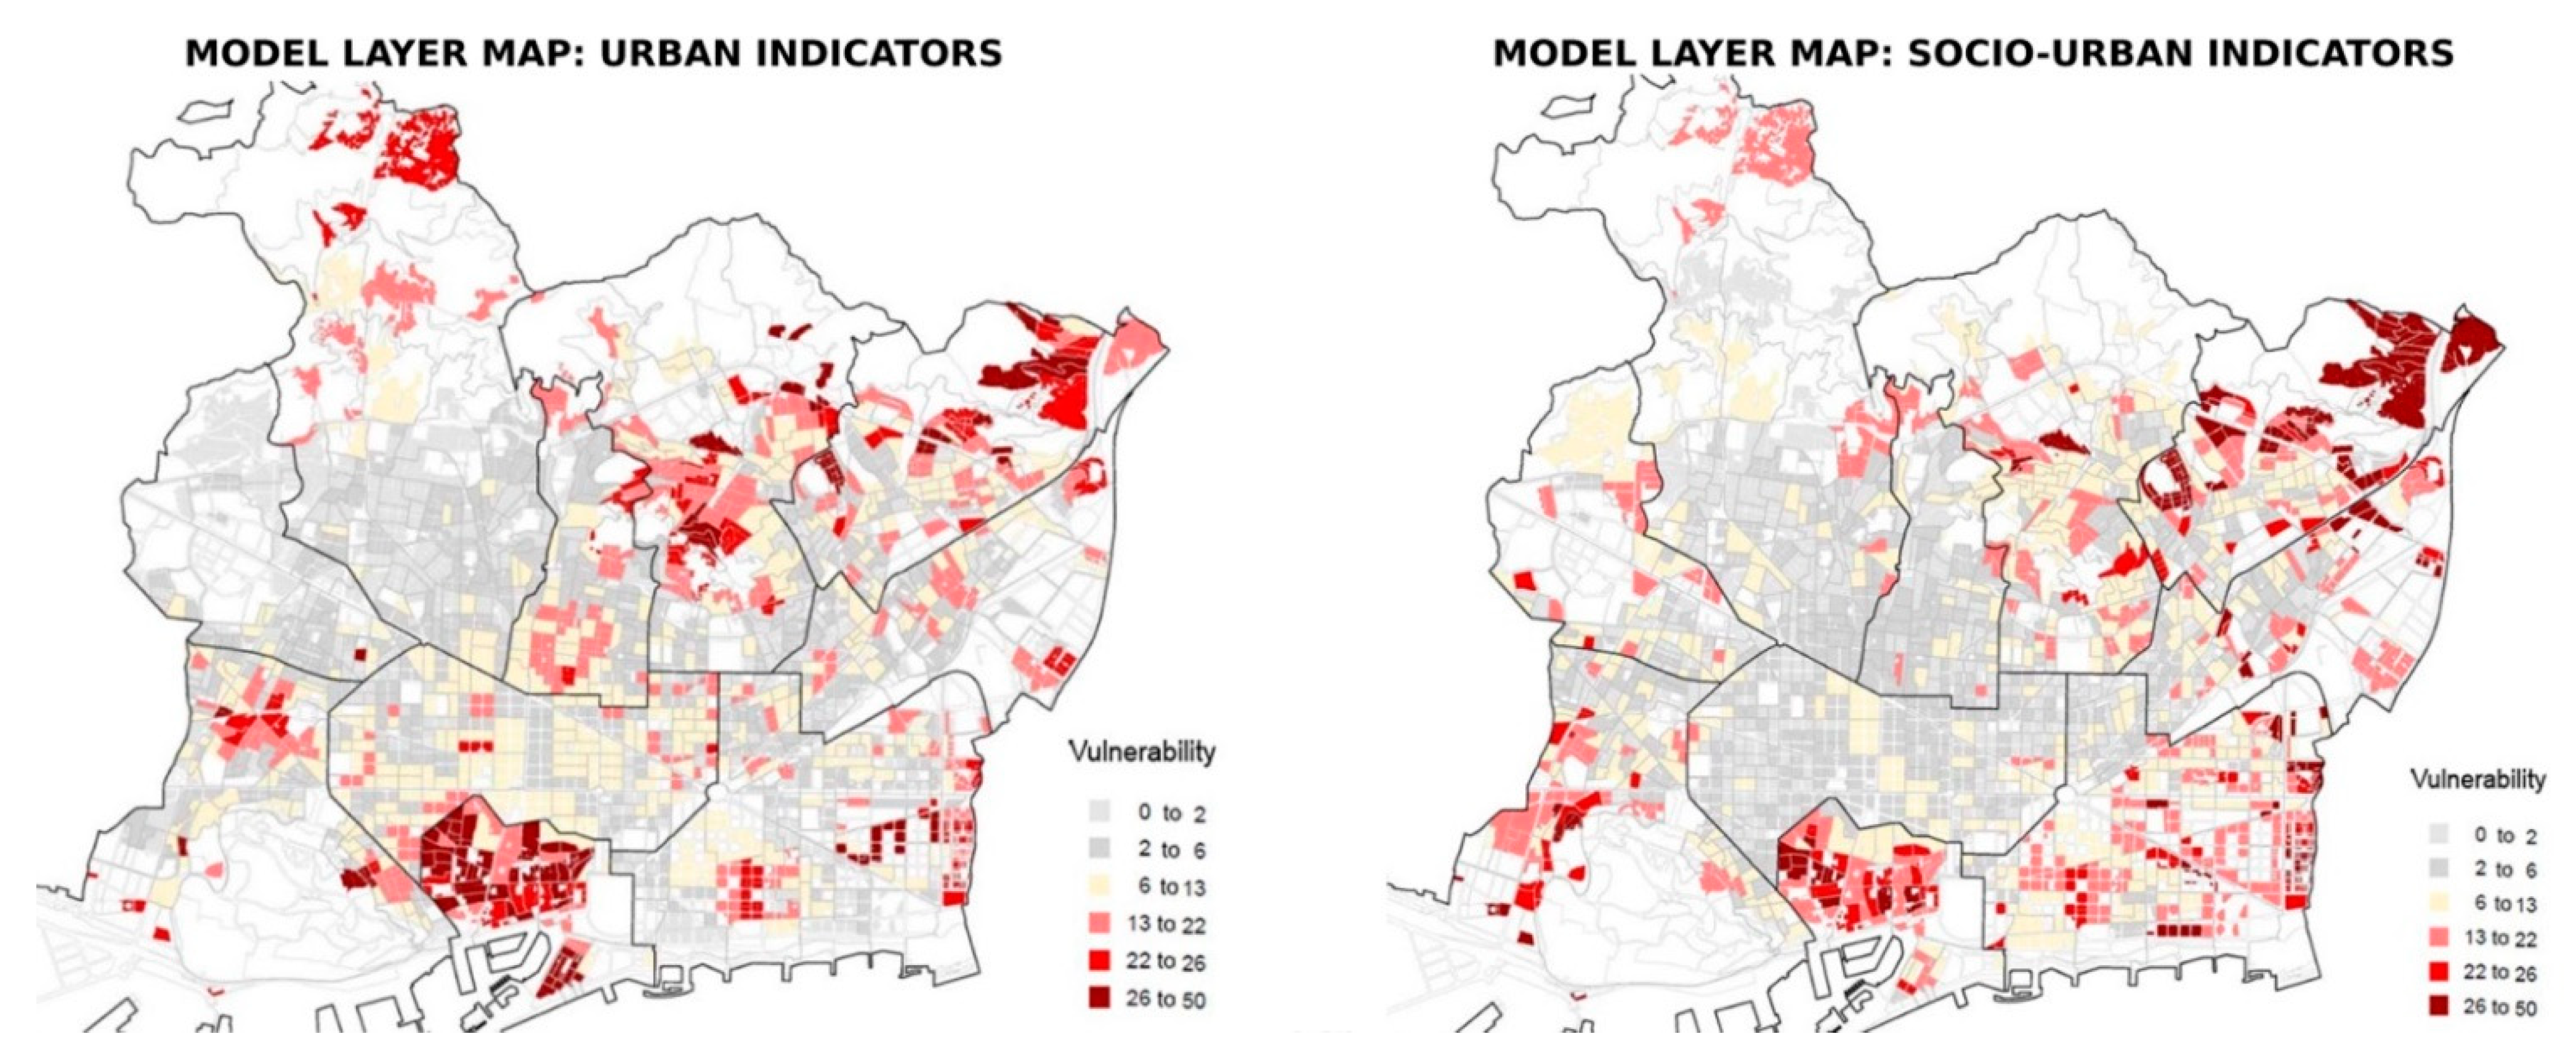
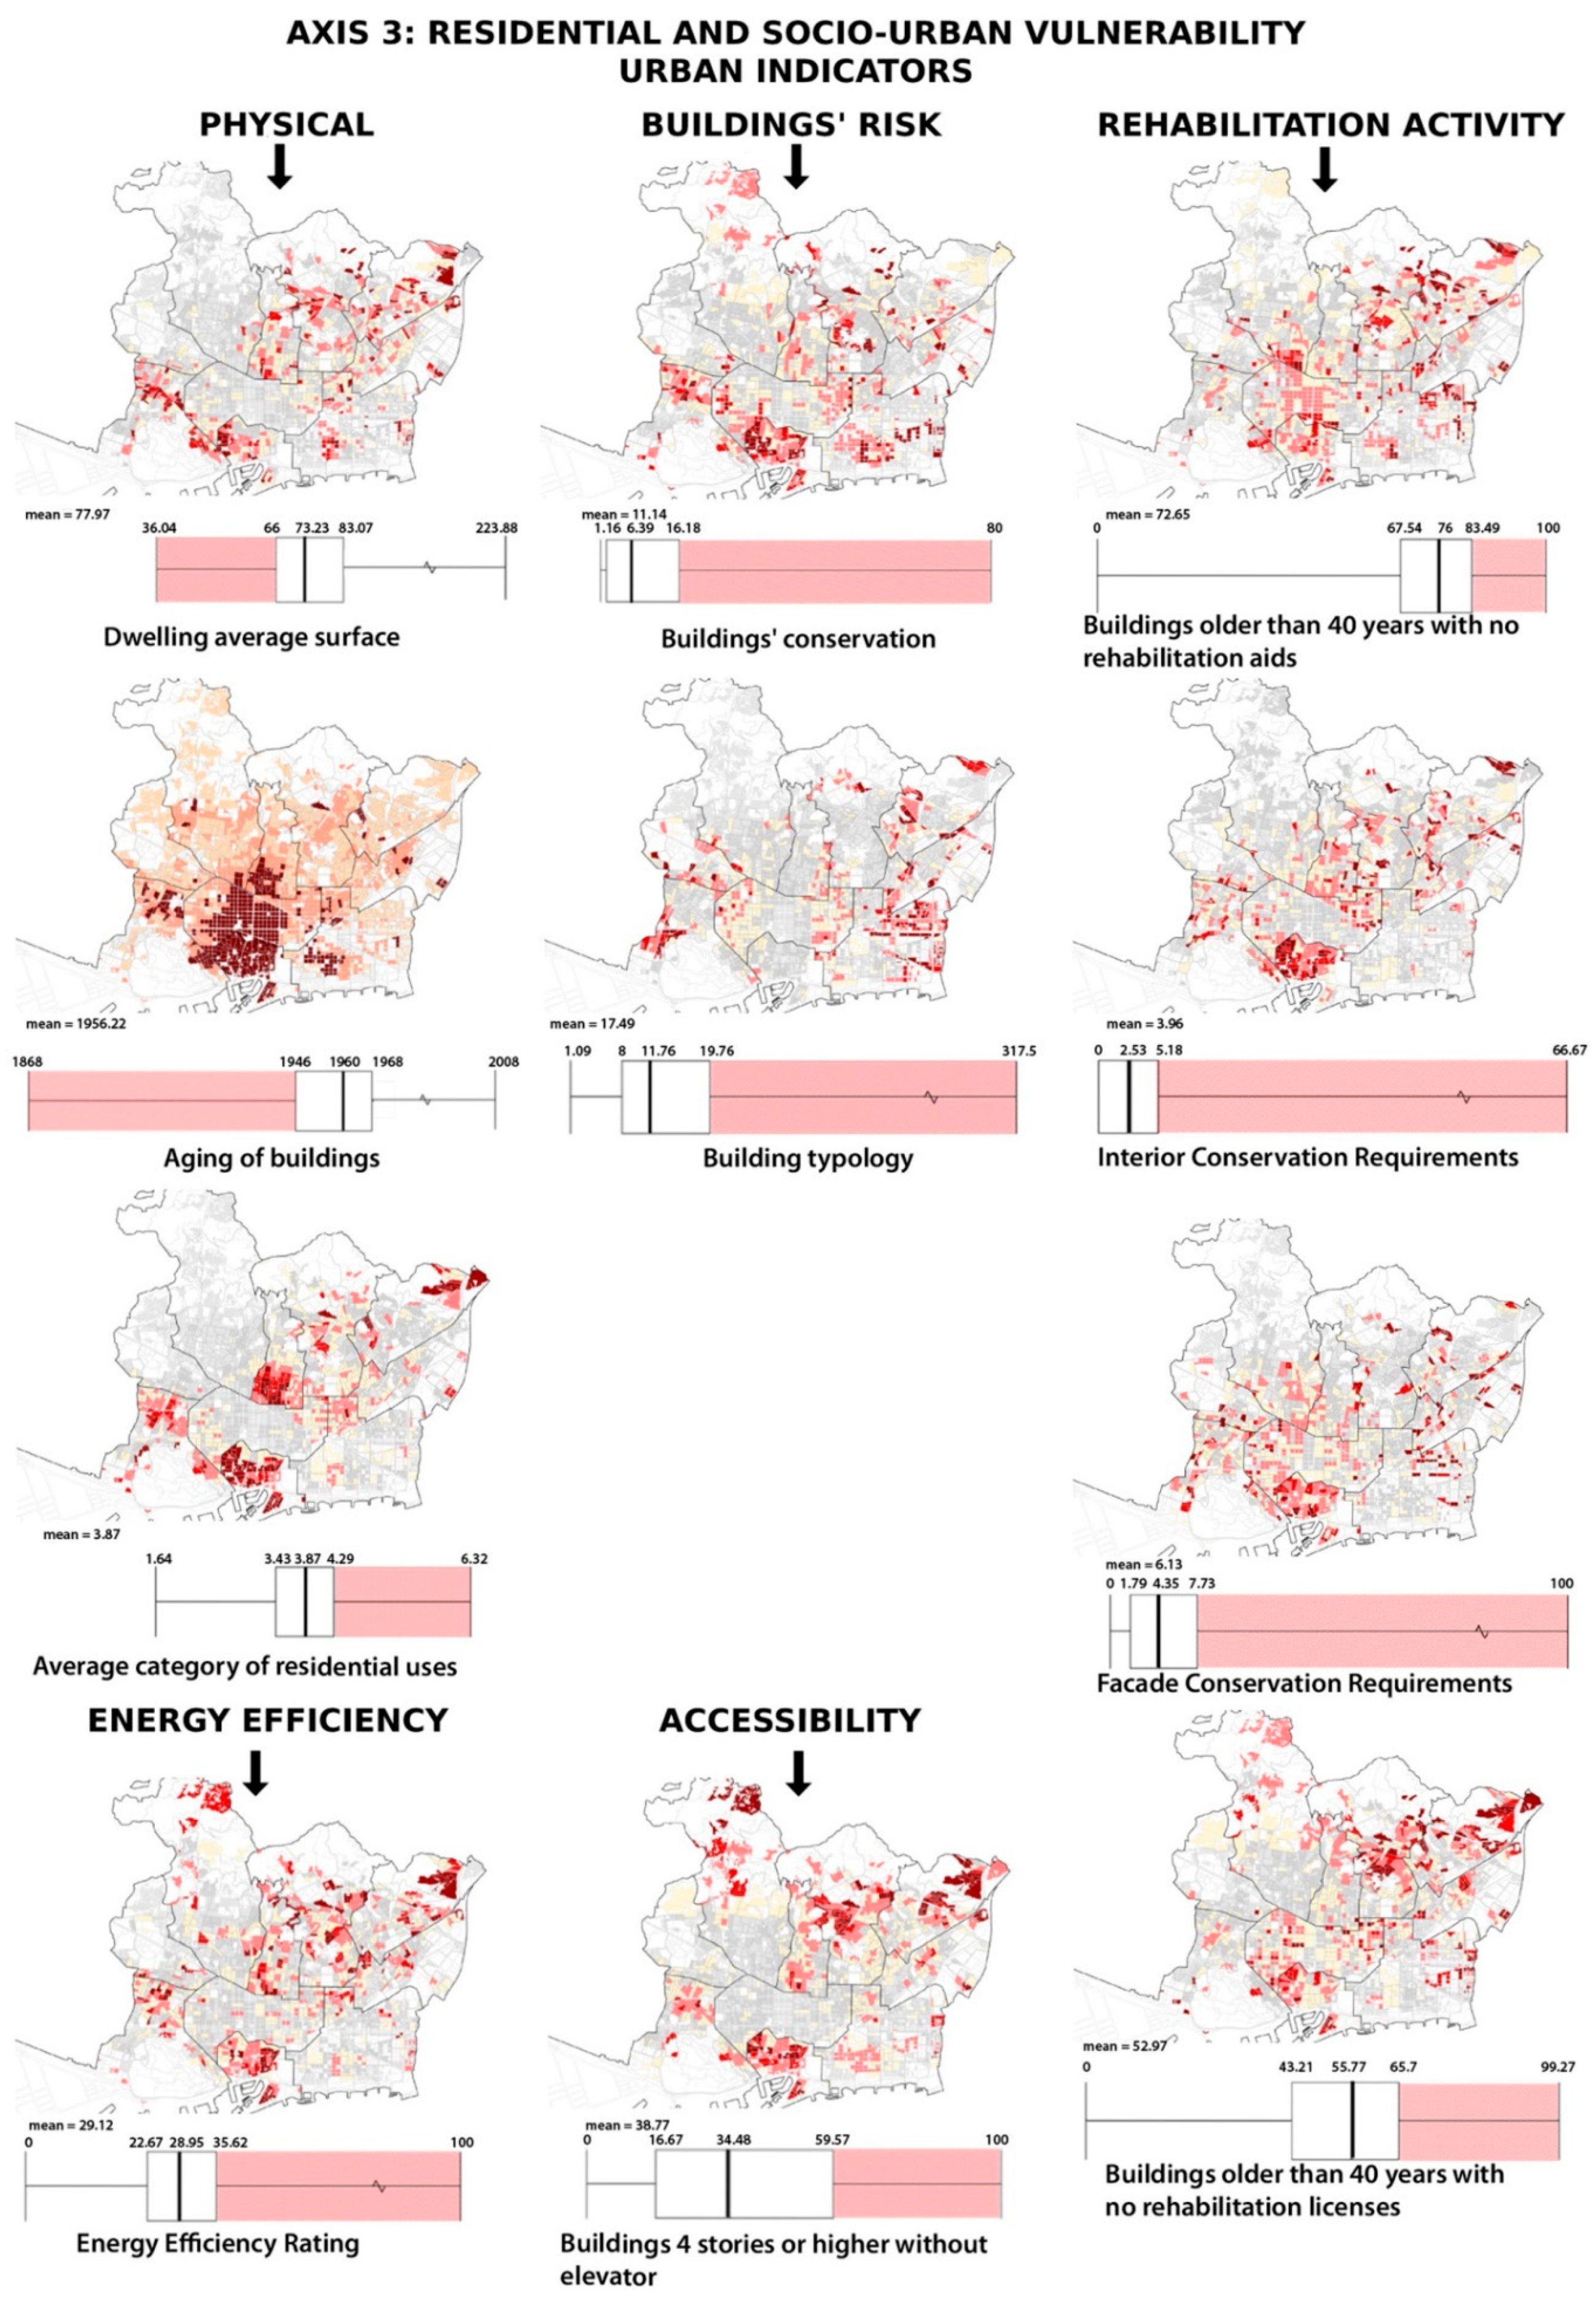
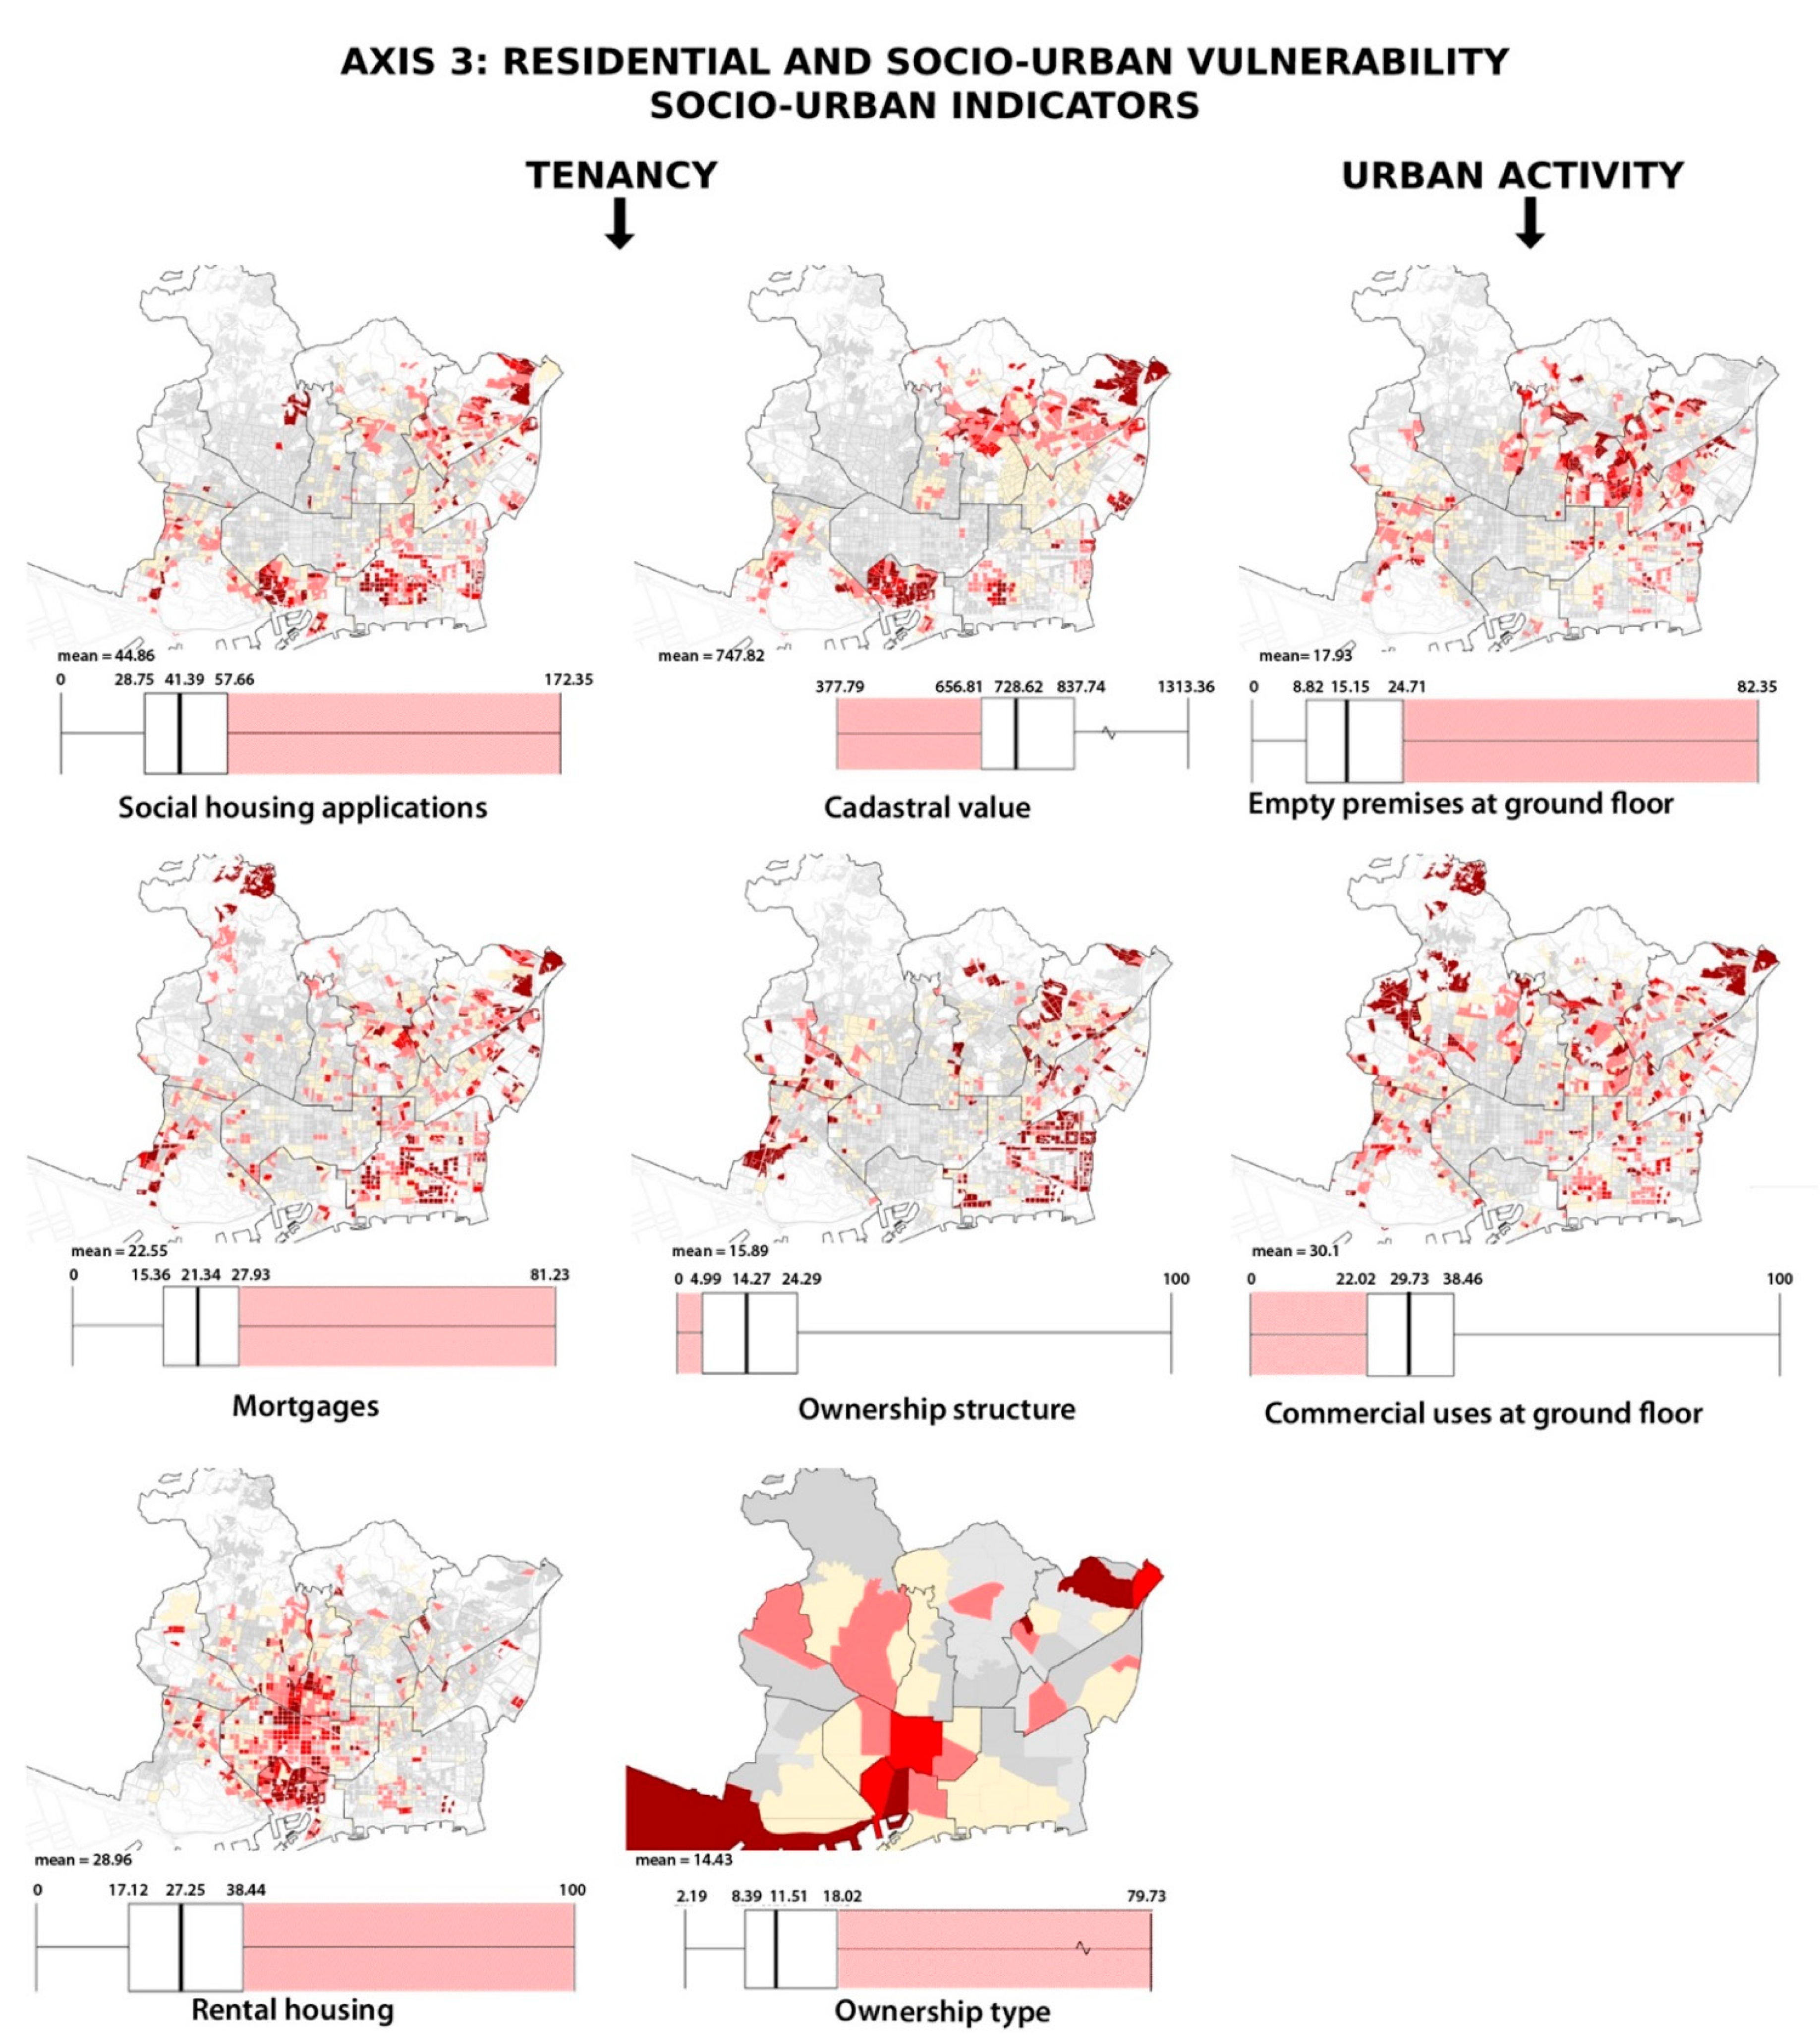
4.3. Residential and Socio-Urban Vulnerability
To assess residential and socio-urban vulnerability, 19 indicators were used, grouped into 7 components. They are as follows:
Urban indicators:
Dwelling average surface: the census units where the dwellings are smaller are highlighted. Low values are potential indicators of overcrowding and substandard housing; this situation is interpreted negatively.
Aging of buildings: census units with older buildings are highlighted.
Average category of residential uses: national indicator included in the Cadaster database that provides information on the original quality of materials and construction according to the period and context of construction. Census units scored according to the cadaster with the highest construction category indices are highlighted. These correspond to the lowest level of construction quality of the buildings.
Buildings’ conservation: census units with a greater number of buildings considered to be in state of ruin, bad, or deficient, according to census data, are highlighted.
Building typology: number of dwellings per building. High values are interpreted as more unfavorable, as they can lead to difficulties in community management and coexistence.
Buildings 4 stories or higher without elevator: those census units with a greater number of buildings with 4 or more floors without elevator are highlighted.
Buildings older than 40 years with no rehabilitation aids: those census units with a greater number of buildings older than 40 years where no rehabilitation aid has been requested are highlighted.
Interior Conservation Requirements: it refers to the number of interior conservation requirements by the city council to the owners of the buildings or dwellings due to evident lack of maintenance. Those census units where the number of requirements is higher are highlighted.
Facade Conservation Requirements: it refers to the number of facade conservation requirements by the city council to the owners of the buildings or dwellings due to an evident lack of maintenance. Those census units with a higher number of requirements are highlighted.
Buildings older than 40 years with no rehabilitation licenses: those census units with a greater number of buildings older than 40 years where no rehabilitation works have been carried out are highlighted.
Energy Efficiency Rating F or G: census units with a greater number of buildings that present the lowest possible energy efficiency ratings in energy evaluation tests (F or G) are highlighted, as they indicate a very low energy performance of buildings.
Socio-urban indicators:
Social housing applications: census units with the highest number of applications for social housing are highlighted.
Mortgages: census units where there is a high number of home buyers with outstanding mortgage payments are highlighted. It can be interpreted as an indicator of fragility in the access to housing.
Rental housing: census units where there is a higher number of rental dwellings are highlighted. It can be interpreted as an indication of fragility in access to housing that may involve greater difficulties to carry out maintenance and rehabilitation actions.
Cadastral value: census units with the lowest cadastral values in the city are highlighted.
Ownership structure: census units with the lowest percentage of dwellings in vertically owned buildings are highlighted. High values are related to a greater fragility since a greater number of horizontally owned buildings involve a greater complexity in building maintenance and rehabilitation processes and a greater need for management support.
Ownership type: neighborhoods where there is a higher percentage of dwellings owned by legal persons are highlighted because this is a potential indicator of greater difficulties in access to housing and gentrification.
Empty premises at ground floor: census units where there is a higher number of premises on the ground floor with no activity are highlighted.
Commercial uses at ground floor: census units where there is a lower number of commercial premises on the ground floor are highlighted. The lack of commercial activity is interpreted as a lack of activity in the public space.
Figure 7 shows the GIS and MCE evaluation model maps as a synthesis of this axis carried out with the weights described in
Table 2.
Figure 8 and
Figure 9 show the results and maps of each of the urban indicators and socio-urban indicators respectively.
4.4. Residential Vulnerability Map
Following the analytical methodology previously described (
Figure 1), the chosen geographic entities were scaled to a relative measure from 1 to 10 in the scale of ordinal value assigned to each criterion (indicator), considering 1 the lowest level of vulnerability and 10 the highest. This information was superimposed by layers of different axes according to the weights defined in
Table 2 in an additive way, so that scaled values assigned to each entity provided an aggregated summation. This additive measure is classified in a decision scale in which the most vulnerable entities (urban blocks) are highlighted with the highest aggregated values and are structured according to three levels or ranges. The result is a map that is formulated from the aggregation of superimposed values of each geographic entity. The map obtained provides the global vulnerability value of the city of Barcelona assigned to each geographic entity and presented in ranges of “extreme, pronounced, and high” vulnerability (
Figure 10).
The resulting map highlights the highest values of residential vulnerability in Barcelona, that is, those that are included in the highest quartile of vulnerability. The three highest values are distinguished in red colors on the map as “extreme, pronounced, and high”. Likewise, values included in the third quartile have been colored and indicated in the map as “moderated vulnerability”, those included in the second quartile are marked as “low”, and those values in the lowest quartile are indicated as “imperceptible”.
In general terms, the city presents a low level of vulnerability. Nevertheless, the results of the present study highlight situations of extreme vulnerability affecting some neighborhoods, characterized by socio-economic, socio-demographic, urban, and socio-urban fragilities and weaknesses.
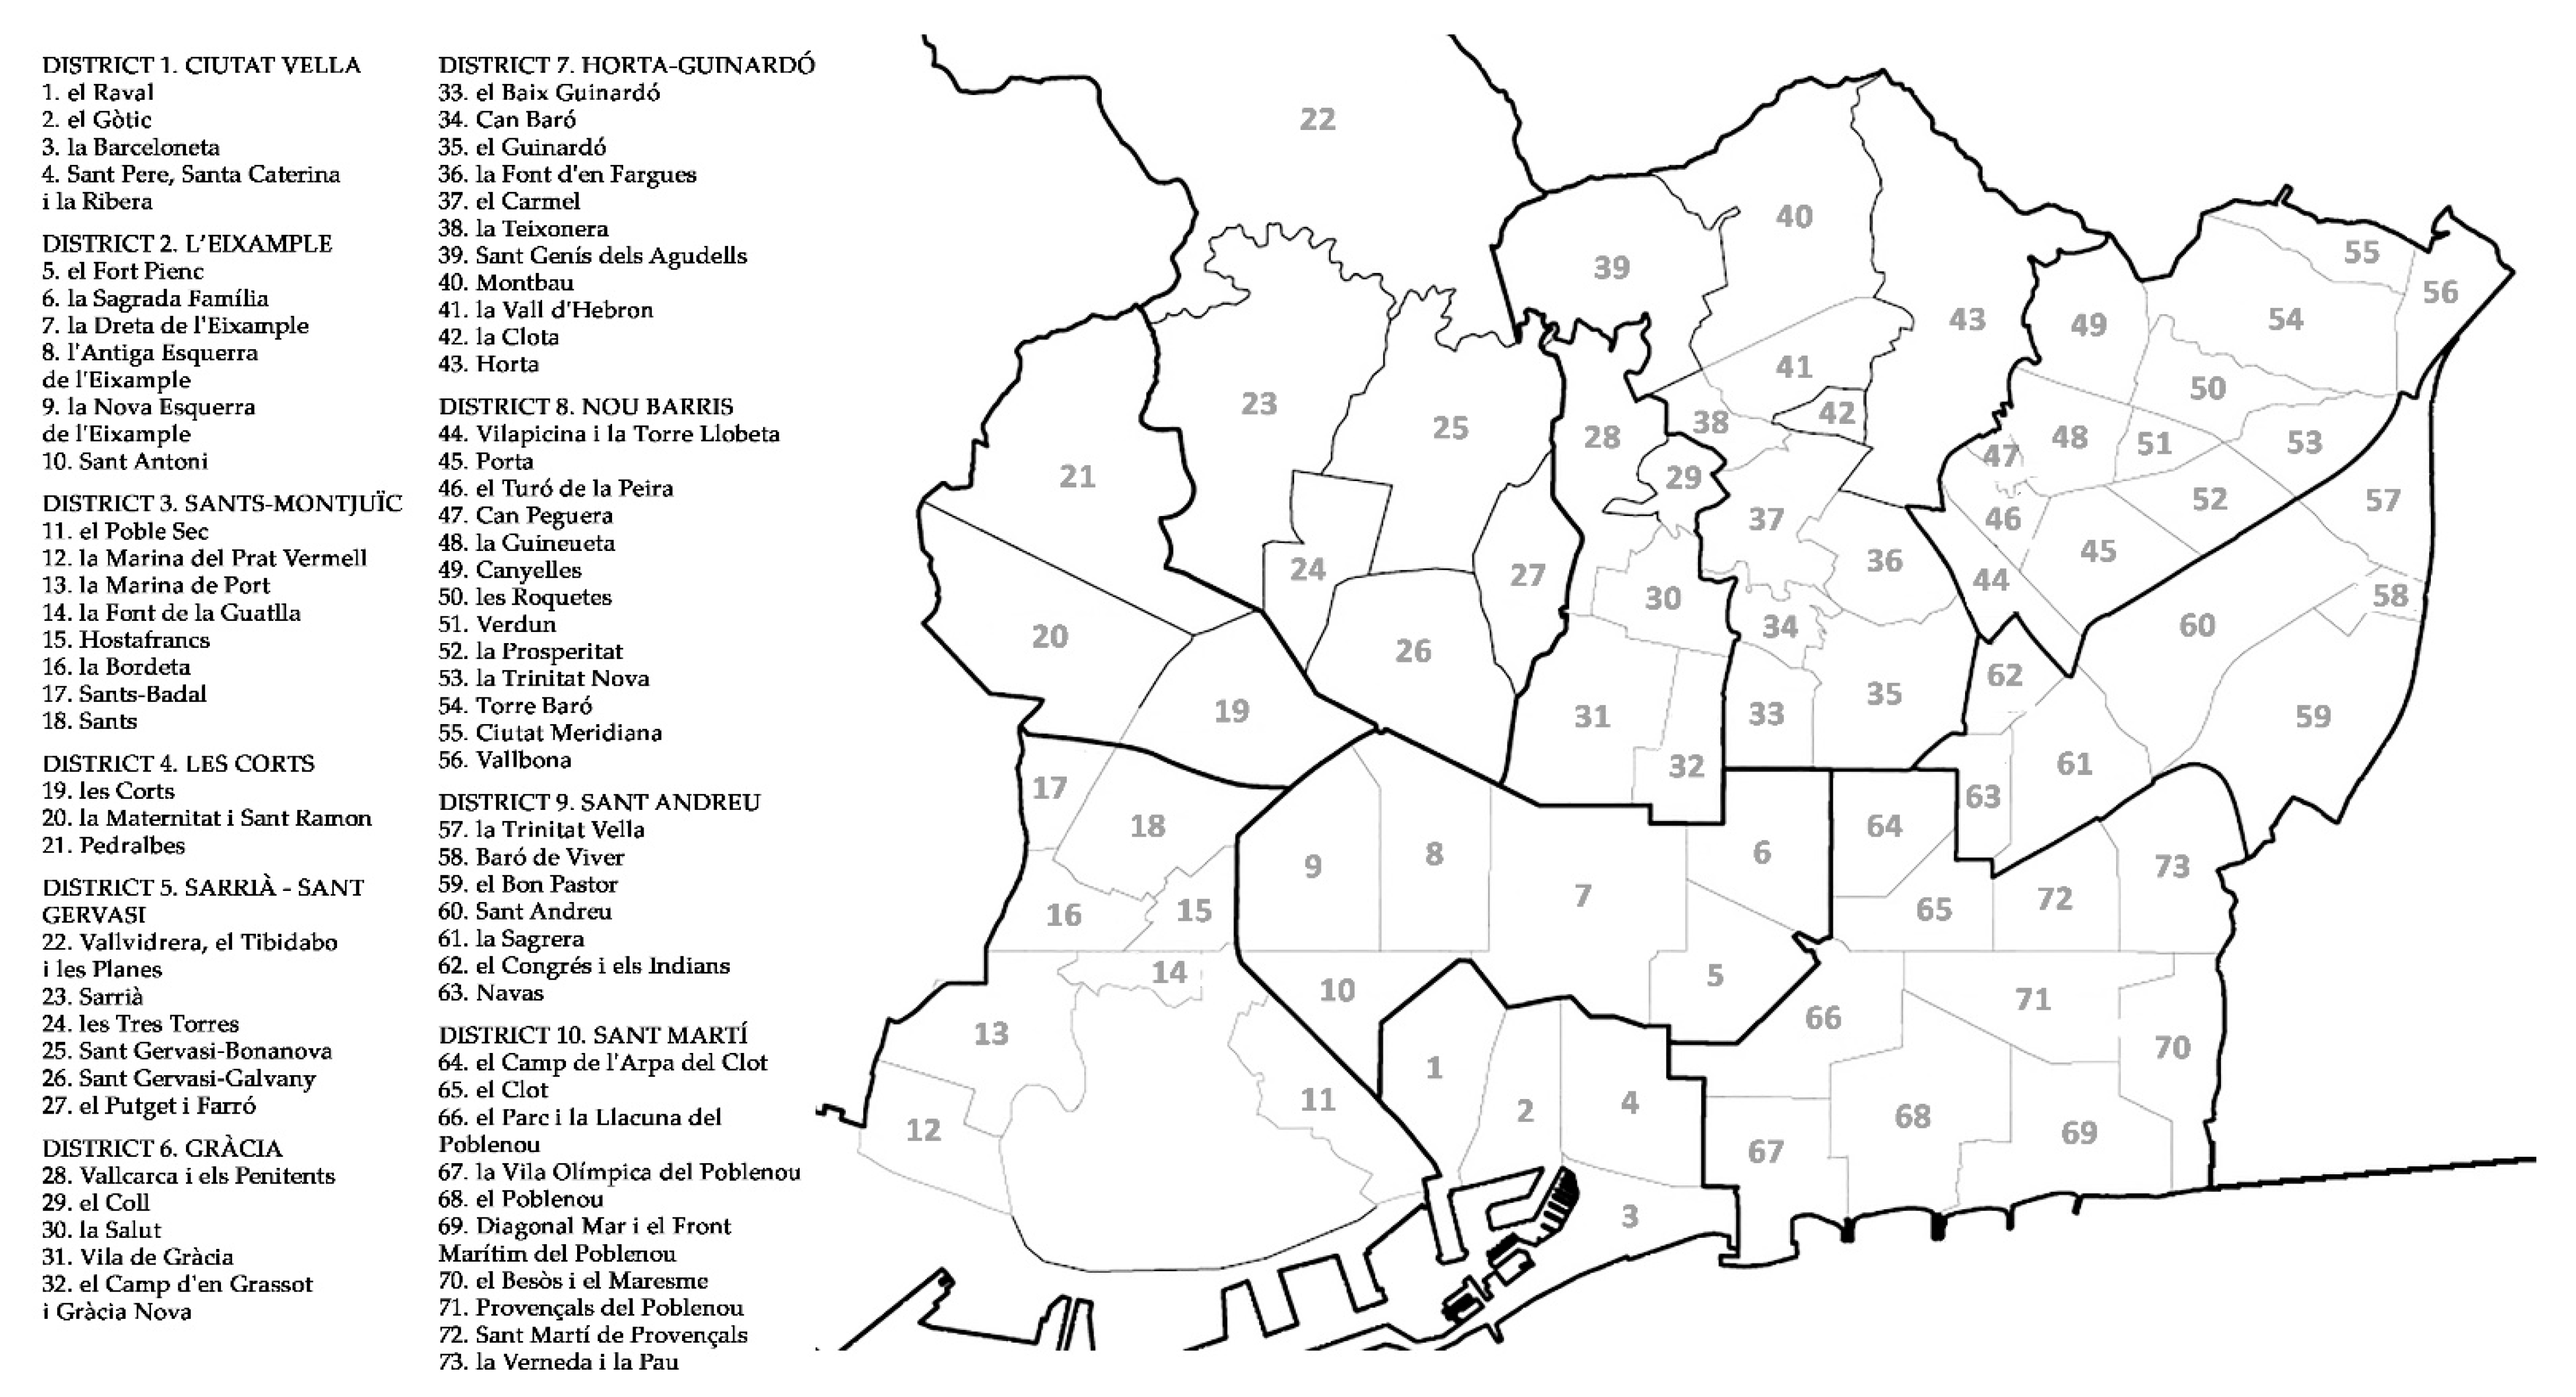
The highest vulnerability levels are confirmed in the district of Ciutat Vella (city center) and particularly in the whole neighborhood of El Raval, the southern side of El Barri Gòtic, and specific areas of La Barceloneta (
Figure 11). This central area together with some less extremely vulnerable areas in Poble Sec, Sants-Montjuic, Hostafrancs, Marina de Port, and Marina del Prat Vermell configure a potential vulnerable bigger area around Montjuic, with particular intensity in the historic City Center. Another greater concentration of vulnerable areas is noticed at the north-east border of the city with particularly extreme situations in the “Zona Nord”: Ciutat Meridiana, Torre Baró, and Vallbona, as well as Trinitat Vella, Can Peguera, La Clota, some areas in Trinitat Nova, Roquetes, and El Carmel. Thirdly, neighborhoods arranged in the Besòs axis (near river Besòs in the eastern limit of the city) configure a similar vulnerable arrangement: Baró de Viver, El Bon Pastor, La Verneda i La Pau, with a special remark of extreme fragility observed in the neighborhood of Besòs-Maresme. Besides the mentioned neighborhoods, Sant Andreu district presents a moderated and low vulnerability in its central extension. Sant Martí district is characterized by its current transformation and will have to be further analyzed in the future to describe its evolution. The mentioned areas of Besòs-Maresme in the south-east are extremely vulnerable, whereas central zones and areas of transformation show more moderate situations. Finally, Districts of l’Eixample or Les Corts have barely any zone with moderate or low levels of vulnerability. The Sants-Montjuïc district presents some punctual vulnerable areas located in Poble Sec and Hostafrancs. While the district of Sarrià-Sant Gervasi shows a very low level of vulnerability in its central area, there are sectors of higher risk in Vallvidrera and Les Planes. Precisely, the area of Les Planes Vallvidrera in the northern border of the city is an identified zone that should be defined and described in a more detailed scale. Gràcia district also offers a good state in general.
5. Discussion
In synthesis, this research aimed to develop a precise and transparent methodology that provided a consensual result that could judge the validity or not of each indicator attending multiple components. Thus, it provided a tool to understand simultaneously the geographic and urban built environment, the state of the building stock, and the housing conditions in relation to refurbishment actions. It aimed to read both data sources to better understand the morphology of the city under rehabilitation; translating both classes of information in a conceptual common frame. It also aimed at offering a system of measurement of social and socio-economic indicators that could enable synthetic forms of analysis for further work with residential, urban, socio-demographic, and socio-economic data bases.
The use of methodologies of multidimensional statistical analysis, usually performed for the spatial stratification of the city, had been useful in previous works of the research team [
33]. Nevertheless, these methodologies were not considered optimal because some of the results obtained from techniques of factorial analysis by principal components were not consensual among academic and professional experts in the case of residential vulnerability in the city of Barcelona. The combination of MCE and GIS enabled to elaborate a more robust tool to address this very complex topic by incorporating data visualization techniques, which allowed for a comprehensive approach to information stored in databases and consensus in the relative weight of issues or indicators studied.
The measure of residential vulnerability is here provided by the elaboration of a methodological proposal for the operationalization of the concept in an analytical dimension through measurable indicators as well as the systematization of each indicator analysis. The final result of the study is materialized in a multivariable matrix that is structured in three axes: socio-economic, socio-demographic, and residential and socio-urban. All three contribute to the identification of areas with a major level of residential vulnerability. This approach is based on conditions that are obtained from the study data sources and treated with an analytical methodology that contributes to generating a compared measure of the current situation of the city neighborhoods.
The most vulnerable areas are those contained in the historic center and the extreme northeast of the city, and they can be identified or grouped according to the axis of Montjuic-Paral·lel (surroundings of the Montjuic hill in the south-western limit of the city) with a special remark in the neighborhood of El Raval, the north-east limits of the city with a remarkable concentration in the north-eastern extreme (Zona Nord), and the axis of Besòs (neighborhoods near the eastern limit of the city limited by river Besòs) with special extreme values in the south-eastern neighborhood of Besòs-Maresme.
These three confirmed axes or larger groups of vulnerable areas strongly reaffirm previous results on the topic of study [
6,
13,
14,
15,
16,
19,
20,
26,
27,
28,
29], and can be also related to historical factors of disadvantage and the historical evolution of the city [
40]. Districts of Horta-Guinardó and Nou Barris (north-east) continue to concentrate a very important part of the most vulnerable areas. It is important to note that those are neighborhoods that faced an important part of the post-war migration processes, hosting population that was located in peripheral housing estates, informal self-constructed low-dense agglomerations, and very dense but yet informal neighborhoods at the northeast of Barcelona between the years 1950–1975. Indeed, Nou Barris was conformed initially with strong urban and socio-urban internal shortcomings such as the construction of new neighborhoods in topographically inaccessible spots which lacked any connection to basic facilities and to the rest of the city. Similar conditions characterized some of the south-western neighborhoods near Montjuic, and some of those in the Besòs south-eastern axis. Finally, the concentration of extremely fragile zones in the historic center and their apparent extension towards the Paral·lel axis (Ciutat Vella and Poble Sec) confirm a third large very relevant area. Historic centers are sites that agglomerate the oldest constructions. Their history of adaptation, renewal, and rehabilitation is determinant to their capacity of fulfilling today’s residents’ needs, and it has been a central challenge in the debate and design rehabilitation policies in the past decades in Europe [
41]. Despite the display of many public programs of rehabilitation and urban regeneration requiring high public investments in specific areas such as El Raval neighborhood [
12,
42], it is clearly characterized by very extreme values of simultaneously socio-economic, socio-demographic, urban, and socio-urban vulnerabilities. Some studies relate this situation with the pressing processes of real-estate profit and touristification in the Barcelona City Center [
43,
44], which have contributed to exacerbating existing situations of fragility and risk in an area that has been, similarly to the previously mentioned areas in the north-east, historically and successively home to historic and most recent migration waves [
33] and inhabited by unprivileged groups.
Although the city of Barcelona, as a whole, has a relatively low level of vulnerability, the detection of extremely vulnerable areas confirms the existence of seemingly increasing inequalities that have a geographical manifestation and call for strategic and redistributive actions by the public administration. The verification of clear geographic groupings of areas and neighborhoods that are historically, socially, and geographically very different but that share a similar level of high and extreme vulnerability confirms the need and adequacy of policies such as the Neighborhood Plan [
45] that are specifically addressed to these clearly unprivileged areas conforming nearly the 30% of the city. Nevertheless, this study provides a distinctive clarification on which vulnerability dimensions are more prominent in each area, and also highlights differences within the neighborhoods. The series of maps provided enable the addressing of public policies specifically to the spots and areas intra-neighborhood where resources are more needed, as well as orientation to the type of policy that is more adequate, either on the socio-economic, socio-demographic, or socio-urban dimension. For example, public policies that address unprivileged areas will have to prioritize certain areas of El Raval where residential and socio-urban vulnerability is extreme over other areas of socioeconomic vulnerability in Ciutat Vella. Similarly, in the north-eastern axis and Nou Barris District, Ciutat Meridiana neighborhood stands out in the socioeconomic and sociodemographic dimensions while neighboring areas have similar residential and socio-urban levels of vulnerability.
6. Conclusions
Cities experience growth in their capability to generate data and data sources on the characteristics of their buildings and inhabitants. These data sets are collected in open repositories that, in many cases, are georeferenced. This data availability provides opportunities for analytical explorations based on data sources that are unprecedently rich in content.
Barcelona Open Data contains an important data volume on different topics such as demographics, socio economics, urban and building registers, among other public data sources that provide a lot of information useful for urban designers and planners. Nevertheless, the usability of these data is restricted by the adoption of non-standard storing formats, the very specific origin of some data, and the lack of concepts that are semantically clear enough in some cases. The methodology that is presented here seeks to extract significant information from available data by using strategies of geographic representation, multicriterial, and semantic evaluation.
This methodology elaborates a system of indicators based on the exploitation of habitual open statistical data (Open Data BCN) complemented with specific unprecedented data elaborated, updated, and provided by the Barcelona City Council. This pioneering study required an exhaustive previous phase of data georeferencing and processing, which opens pathways of work for further studies. This first research could develop an analysis based on secondary data that are structured in axis, components, and georeferenced indicators that help to determine sociodemographic, socioeconomic, residential, and socio-urban characteristics at neighborhood, census unit, and urban block scales.
The applied methodology combined technologies of statistical analysis of habitual data with geospatial analysis of GIS (superposition) and the normalization of data values with techniques of Multicriterial Evaluation Systems. This procedure enabled us to work with data visualization, which allowed for better communication and understanding of information stored in databases, its interrelations, and the relative weight of issues or indicators studied. The process culminated with the additive layered construction of a model map of the vulnerability of the city of Barcelona.
The following main considerations can be drawn from this process:
- (1)
Visualization techniques of data in extreme quartiles (entities in the most unprivileged situation) enable highlighting patterns that are not obvious to trained professionals and academic experts. The use of a normalization system in an ordinal scale of the value of indicators allows superposing or adding information that initially could not have been added. This enables the comprehensive reading of conceptual data.
- (2)
This proposal called for the analysis of a great number of existing data sets, as well as the creation of new synthetic data based on base data. These tasks enable the identification of the most sensitive indicators of residential vulnerability and their comprehension on the plane or layer in a compact synthetic visualization of their interaction with other indicators.
- (3)
Data that did not count with a disaggregated cartography were displayed with multiple visualization techniques that enabled to relate it with data in more disaggregated entities (population, residential surface, etc.). More significant information can be extracted through techniques of disaggregation in geometric entities of an inferior order.
- (4)
The present methodology is a significant advance in the understanding of the knowledge that is stored in existing databases, through processes that are centered in data mining based on the application of Lachine Learning algorithms. This unprecedented study focuses on creating a first set of referential indicators that is debated and consensual to offer an exhaustive exploration of the topic of residential vulnerability, a topic that lacked extensive bibliographic and practical expertise and consensus at the moment of executing this research.
Results of this research constitute a solid base that can be useful for the design of future redistributive intervention policies, plans, or rehabilitation policies in the city and its districts and neighborhoods. The detection and analysis of areas with higher levels of vulnerability has already proven a powerful tool to delimitate which areas deserve higher attention when implementing rehabilitation policies and programs [
12], such as the Neighborhood Plan [
45]. The situations and areas detected will be further studied through fieldwork campaigns and qualitative on-site analyses to confirm the results obtained and broaden the understanding achieved through the present data analysis.
To conclude, it is worth emphasizing that, in general, the level of vulnerability of the city of Barcelona is relatively low. Nevertheless, there is a high concentration of quite homogeneous extremely vulnerable areas that can be clearly identified geographically. This confirmed evidence calls for the need to continue and advance in the implementation of redistributive policies and actions that aim to improve the most vulnerable areas.


