Article

Factors Controlling the Hydraulic Efficiency of Green Roofs in the Metropolitan Area of Milan (Italy)

1
Water Research Institute, National Research Council, IRSA-CNR, 20861 Brugherio, Italy
2
Institute of Polar Sciences, National Research Council, ISP-CNR, 30172 Venezia, Italy
3
Water Research Institute, National Research Council, IRSA-CNR, 00015 Monterotondo, Italy
4
Department of Agricultural, Forest and Food Sciences, University of Turin, 10095 Grugliasco, Italy
5
Construction Technologies Institute, National Research Council, ITC-CNR, 20098 Milan, Italy
*
Authors to whom correspondence should be addressed.
Franco Salerno and Laura Marziali equally contributed to this paper.
Sustainability 2021, 13(24), 13638; https://doi.org/10.3390/su132413638
Submission received: 2 November 2021 / Revised: 29 November 2021 / Accepted: 7 December 2021 / Published: 10 December 2021
(This article belongs to the Section Social Ecology and Sustainability)

Abstract

:
Green roofs (GRs) are considered sustainable solutions for the adaptation of urban water management to climate change. The use of GRs is particularly promising in urban environments like the Metropolitan Area of Milan, the most urbanized area in Italy. In this work, we evaluated the subsurface runoff coefficient at the event-time scale, for more than one year of observations, of 68 small-scale test beds comprising different configurations of green roofs (e.g., different vegetations, types and depths of growing media, and different slopes) installed in the Metropolitan Area of Milan. The objectives of this study are three-fold. Firstly, the controlling factors of the hydraulic have been assessed for efficiency. We calculated a mean drainage flow rate of 51%, finding that growing media play a significant role in determining the drainage flow during the spring, at the beginning of the vegetative period. During this season, water retention in fertilized beds increases significantly. At the beginning of the summer, the vegetation cover is able to significantly reduce the drainage flow, playing an even more crucial role with respect to the growing medium material. However, we found that the vegetation type (grass field and Sedum) does not play a significant role in the retention processes. Secondly, the delay of the peak flow rate was determined. We found a precipitation peak delay from 1 to 2 h, which would be sufficient to guarantee environmental benefits for urban drainage. Finally, the factors controlling the hydraulic efficiency of GRs for individual precipitation events were assessed. We found that soil moisture and cumulated precipitation are both significant factors determining the drainage flow rate. In conclusion, we point out that soil moisture is one of the main parameters characterizing GR drainage and should be further considered in future research efforts devoted to the analysis of GR performance.

1. Introduction

Assessing the effects of climate change and developing mitigation/adaptation measures are of primary importance in urban environments, as cities will comprise two-thirds of the global population by 2050 [1]. Urbanization is creating large impervious surfaces that dramatically affect the natural hydrology of areas located near surface water bodies [2]. The main effects of urbanization on stormwater management include changes to urban hydrology, altered geomorphology, water pollution, and the loss of riparian habitats [3,4]. Furthermore, climate change is expected to increase the frequency and intensity of extreme temperature and precipitation events, towards which urban areas play a crucial role, as reported in the fifth IPCC (Intergovernmental Panel on Climate Change) Assessment Report [5]. As highlighted in the Sustainable Development Goals (SDGs; www.sdgs.un.org/goals, accessed on 10 November 2021), environmentally sustainable construction upgrades to current and new urban infrastructure are of paramount importance to enhance urban health and to adapt to climate change (i.e., SDG 11 Sustainable Cities and Communities, and SDG 13 Climate Change).
The use of sustainable solutions as an alternative to conventional techniques has become a general goal of urban water management. To move in this sustainable direction, nature-based solutions (NBS) have been suggested as a potential eco-solution [6,7,8,9]. Several studies have shown that green roofs (GRs) have significant effects from a hydraulic efficiency perspective [7,10], particularly on (1) retaining rainfall volumes, (2) delaying the peak flow rate, and (3) reducing the runoff volume discharged into combined sewer systems (CSSs) [6,11,12]. CSSs are networks of underground pipes that carry domestic sewage and storm water runoff into the same centralized treatment facility. In the urban areas of Central Europe and the United States, CSSs are common for conveying sewage water [13]. The critical point of this system involves the hydraulic capacity of the wastewater treatment plant (WWTP), which may be exceeded during rain events. In such cases, a portion of untreated wastewater is directly discharged into receiving surface waters, impairing the ecological quality of aquatic ecosystems (e.g., [12,13,14,15]).
Typically, a green roof consists of three layers: vegetation, a growing medium, and a drainage layer. Depending on the depth of the growing medium layer, GRs are named as extensive or intensive. Extensive roofs generally show a growing medium depth of less than 20 cm, and vegetation composed of moss, succulents (Sedum), and small herbaceous plants, while intensive roofs are characterized by thicker growing media, which can also sustain large trees [16,17].
Several studies on GR drainage capacity have been conducted on a pilot scale, generally consisting of different small-scale test beds (TBs) or similar modules [18,19], while others have been conducted on full-scale rooftops [6,20]. Indicators such as runoff volume reduction, peak flow reduction, peak flow lag-time, etc., have been used to estimate GR hydraulic effectiveness. Factors that typically influence GR water retention capacity can be grouped into two main categories [6]: weather conditions (i.e., length of the antecedent dry weather period, season/climate, and characteristics of rainfall event) and GR physical features (i.e., depth of the growing medium and its hydraulic characteristics, type of vegetation, percentage of roof covered, roof geometry, and green roof age). Therefore, designing GRs with the aim to maximize retention capacities in a specific meteorological context is rather complex. Several authors reported on these difficulties [21,22].
Although there is a general consensus on the positive effect of GRs regarding water retention, different results are reported in the literature [23,24]. The variation in the retention rates found in previous studies is explained by arguing that this phenomenon relies on the configuration of the GR (e.g., type of growing medium and its depth, vegetation cover, slope, and filter system) and on the specific climatic conditions of the study area (e.g., rainfall depth and evapotranspiration), as well as on the characteristics of rainfall events, such as the maximum intensity, duration, and antecedent dry period [25]. Furthermore, the variability in the results can also be associated with the length of the monitoring period [24,26]. Different results can therefore be found for each case study. This underlines the importance of identifying a specific GR configuration for each particular climate context to maximize the water retention capacity of these systems [11,24].
This is of particular relevance in the Metropolitan Area of Milan, the most urbanized area in Italy and one of the most anthropized in Europe, where land consumption has reached as much as 50% and the high frequency of severe and short thunderstorms often triggers flash floods [27]. Recently, local administrations have declared that increasing vegetated areas, at the expense urbanized ones, is not a feasible option. However, economic incentives are granted to citizens to build GRs [28]. Therefore, it is important to better understand the extent of the benefits in runoff quantity that GRs, and different configurations of GRs, may offer in relation to local hydrological variables [24].
In this work, we evaluated the subsurface runoff coefficient at the event-time scale, for more than one year of observations, of 68 small-scale TBs with different configurations installed in the Metropolitan Area of Milan. In this study we aimed to: (1) assess the GR characteristics (e.g., vegetation type, growing medium type and depth, and slope) influencing the hydraulic efficiency of these systems, (2) determine the delay of the peak flow rate, and (3) determine the factors controlling the hydraulic efficiency of GRs for individual precipitation events.

2. Materials and Methods

2.1. Experimental Setup

A total of 68 small-scale TBs with different configurations were used in this study. Small-scale systems have been already used to investigate the effects of different GR configurations (e.g., with different types and depths of growing media, different vegetation, or different slope) on the water quality and quantity of green roof outflows [18,19,23,29,30], as preliminary analysis to further perform experiments on full-scale systems. The advantage of small-scale studies is the potential to disentangle the benefits of single characteristics of green roofs on runoff water.
A total of 48 TBs were set up in March 2018 in the garden of the Water Research Institute of the National Research Council (IRSA-CNR) of Brugherio, north of Milan (45.56°, 9.27°, 131 m a.s.l.) (Figure 1) and 20 additional TBs were set up at the Construction Technologies Institute of the National Research Council (ITC-CNR) of San Giuliano Milanese, south of Milan (45.40°, 9.25°, 131 m a.s.l.). The 48 TBs located in the IRSA-CNR were monitored during the overall 2018–2019 period. A total of 24 precipitation events were selected, as specified in the following section. The 20 TBs located in the ITC-CNR, however, were monitored for a shorter period, mainly in 2019, with 6 precipitation events selected. Both sites are located in the Metropolitan Area of Milan; the IRSA-CNR is about 20 km north of the ITC-CNR. The two sites differentiate in mean annual cumulated precipitation, which at the IRSA-CNR is about 940 mm, while at the ITC-CNR it is about 760 mm, i.e., San Giuliano Milanese records about −20% of the mean annual precipitation recorded at Brugherio, as calculated from data collected by the meteorological stations managed by ARPA Lombardia (Regional Agency for Environmental Protection; www.arpalombardia.it, accessed on 10 November 2021). For both sites, the annual mean temperature is 13 °C. The highest precipitation amounts occur in the spring (May) and autumn (November) [14,31]. The consistent difference of the mean annual cumulated precipitation between the north and south of Milan led us to consider the two experimental sites, in order to check potential divergences in GR drainage flow rates.
Each TB consisted of a small-scale GR system with a 0.4 m2 surface area (50 × 75 cm) (Figure 1). For this monitoring campaign extensive green roofs were considered. Each TB comprised a drainage layer at the basis, covered by a geotextile filter, a growing medium layer and, at the top, a vegetation layer. A total of 24 different TB configurations were set up, with 2–4 replicates each, for a total of 25.8 m2. The GR types consisted of a different combination of the following characteristics:
  • Growing medium type: 3 different types of soils were considered, named T1, T2, and T3. All consisted of a mixture of mineral materials of volcanic origin (zeolites, lava lapilli, and pumice stones with different grain sizes) mixed with organic substances (peat and compost). The following characteristics are reported on the technical sheets of the producers (www.daku.it, www.harpogroup.it, accessed on 10 November 2021). T1 showed an infiltration rate of ≥30 mm/min (DIN standard 18035-4), a water holding capacity of ≥40% v/v at a coefficient pF of 0.7 (UNI EN 13041:2012), and an organic substance content of 5–6% dry w/w [3]. T3 showed an infiltration rate of ≥15–55 mm/min, a water holding capacity of 36–43% v/v at pF 1, and an organic substance of 4.5–4.8% dry w/w. T2 consisted of soil T3, which was enriched with organic matter to reach up to 9.5–10% dry w/w, as we measured in our lab following the Walkley–Black procedure [3].
  • Vegetation type: we tested the crassulacean Sedum spp. vs. a grass field composed of annual and perennial species (e.g., Anthemis arvensis, Centaurea cyanus, Papaver rhoeas, Bromopsis erecta, Holcus lanatus, and Silene vulgaris) (hereafter called biodiverse vegetation type) vs. no vegetation (i.e., soil only).
  • Growing medium depth: we tested 8 cm vs. 12 cm soil depth for Sedum spp. and 12 cm vs. 15 cm for the grass field.
  • Slope: we compared a slope of 1–2% vs. 10–12%.
  • Fertilization: some TBs were provided with proper fertilization (NPK fertilizer for soil application with controlled-release nitrogen, provided by green roof producers), to be compared with similar TBs which were not fertilized.
  • Our TBs were provided with a collection system for runoff water (Figure 1).

2.2. Hydrological Monitoring

Hydrological measures are described in the following section in relation to two different setups: one is related to all the TBs and the other one is applied to one single test bed (TB-48).
Meteorological data were acquired for both experiments. Precipitation and air temperature were monitored with an automatic weather station (AWS) (DQA030, accuracy ±1%), provided by Lastem (www.lsi-lastem.it, accessed on 10 November 2021), located a few meters away from the experimental setting. Data were recorded every 10 min for the entire study period.
In order to calculate the water retention capacity of GRs, after each precipitation event, we measured the volume drained from each experimental bed using graduated cylinders (precision 100 mL). We performed the measurement approximately 24 h after the end of each event to allow complete drainage of the water accumulated within the growing medium. In particular, for the 48 TBs located at the IRSA-CNR, we examined the water drainage volume after 24 events. For comparison, the same measure was carried out in the 20 TBs located at the ITC-CNR after 6 precipitation events.
To evaluate the potential of GRs to delay the runoff peak compared to the precipitation peak [32], we considered only TB-48. This TB was characterized by biodiverse vegetation, T3 growing medium with a thickness of 15 cm, and a 2° slope. It was selected because preliminary measurements showed the best water retention capacity in comparison to other GR configurations. We used two Onset HOBO U20 Water Level Data Logger pressure sensors (www.onsetcomp.com/products/data-loggers/u20-001-01, accessed on 10 November 2021); one was placed directly in the air to compensate the atmospheric pressure and the other one was placed in the closed bin collecting the runoff water of TB-48. All measurements were carried out every 10 min, i.e., with the same time-lapse used for precipitation records of the AWS.
In order to better understand the hydrological parameters determining different GR retention capacities, the same test bed (TB-48) was also equipped with soil moisture sensors (GroPoint, www.gropoint.com, accessed on 10 November 2021, accuracy ±2%), which were inserted into the growing medium, close to the surface. The surface soil moisture was then recorded every 10 min. We considered this high-resolution time-lapse appropriate since soil moisture is one of the main parameters that characterizes soil drainage, as shown by Berndtsson, 2010 [33].
The drainage flow data of all TBs and the soil moisture of TB-48 were recorded from 22 February 2018 to 12 December 2019, while continuous runoff data of TB-48 were recorded from 16 September 2019 to 13 February 2020.

2.3. Statistical Analysis

2.3.1. TB Configuration and Drainage Flow: Analysis of Variance (ANOVA)

We compared the drainage flow rate from a sub-set of TBs located at the IRSA-CNR with 20 TBs located at the ITC-CNR with the same combination of characteristics (vegetation and growing medium features). We selected six precipitation events to be compared at the two experimental sites. The ANOVA was used for comparison.
Considering the data from 24 precipitation events and from all the 48 TBs set up at the CNR-IRSA in Brugherio, we used the multiway analysis of variance (ANOVA) to test the TB characteristics (i.e., vegetation type, growing medium type and depth, and slope) as factors determining the drainage flow. We considered slope and growing medium depths as continuous parameters, while the other factors were considered as categories. Once we had individuated significant factors among the data, we then applied one-way ANOVA on selected factors [34].

2.3.2. Calculation of Peak Flow Delay

In the soil literature, field capacity is commonly considered as the threshold below which soil water flushing out of the rooting zone is negligible for deep soil profiles [35,36]. As regards the GRs, we considered field capacity to be the point at which soil capillary pressure can no longer retain water in the medium [32].
We calculated the peak time delay (minutes) as the difference between precipitation and the drainage peak of TB-48. From the statistical point of view, we looked at the mean delay through a linear regression analysis between precipitation and the peak time series.

2.3.3. Hydrological Parameters and Drainage Flow: Multiple Linear Regression Analysis

To understand the role of the hydrological parameters determining different GR retention capacities, the multiple linear regression analysis is used to assess the correlation between two or more independent variables (proxies) and a single continuous dependent variable. In this study, we chose as the dependent variable the drainage flow rate calculated by dividing, for each meteorological event, the flow drained from TB-48 and the relevant precipitation that occurred. We selected a total of 24 precipitation events. As proxies we selected the following hydrological parameters: the cumulated precipitation, precipitation duration, precipitation intensity, antecedent dry period, and soil moisture of the day before the precipitation event. A precipitation event was defined as independent from any other if it was preceded by at least two dry days.
We verified the degree of correlation among the data using the correlation coefficient (r) after checking a quantile [37] plot of the model residuals to ensure that they followed a normal distribution [38]. All tests were implemented in the software R with a significance level of p < 0.05. We tested the normality of the data using the Shapiro–Wilk test [39].
We further derived simple multiple regression models considering only additions among all proxies, i.e., quadratic terms and interactions were not considered. The modelling was conducted using stepwise simplification through the evaluation of the AIC (Akaike Information Criterion) index. The AIC index (calculated using the “stepAIC” function from the MASS library in R) is a measure of the relative quality of statistical models for a given set of data. At the end of the process, the hypothesis that the final model adds significant explanatory value over the model that considers only a single proxy was tested using an ANOVA F-test [38].
We used the R package “relaimpo” [40] to estimate the relative importance of each proxy for the final regression model (metrics were normalized to 100% of the correlation coefficient, r).

3. Results and Discussion

3.1. The Drainage Flow Rate

The mean drainage flow of the 48 TBs located at the IRSA-CNR following 24 precipitation events during the 2018–2019 period was calculated to be equal to 51%, i.e., on average, half of the water is used for evapotranspiration processes and/or retained in the growing medium layer, while the other half is released into the urban drainage system. This finding is in line with other studies [33,41]. Nevertheless, the range of the retention rate reported in the literature is highly variable and the comparison between different case studies is difficult, since several factors can influence the performance [42], such as the precipitation regime.
In this regard, by comparing the performance of TBs located north of Milan (at the IRSA-CNR) with those set up south of Milan (at the ITC-CNR), a mean of 40 ± 21 mm and 28 ± 13 mm of cumulated precipitation fell for each precipitation event in the two sites, respectively. On average, these events were characterized by a relative abundant precipitation amount, which determined high drainage flow rates: 73 ± 16% and 49 ± 24%, respectively (p < 0.05). Higher flow rates at the IRSA-CNR corresponded to a higher cumulated precipitation at this site (940 mm as annual mean) than at the ITC-CNR (760 mm as annual mean).
The implications of this observation are two-fold. First, GRs located in zones with reduced precipitation can display higher performance (smaller drainage rates) than those in zones with higher precipitation. Second, these experiments are site specific. Thus, they provide relevant information regarding the potential of the GRs for local urban planning, but to be used for inter-site comparisons, the annual regime of precipitation at each site must be measured.

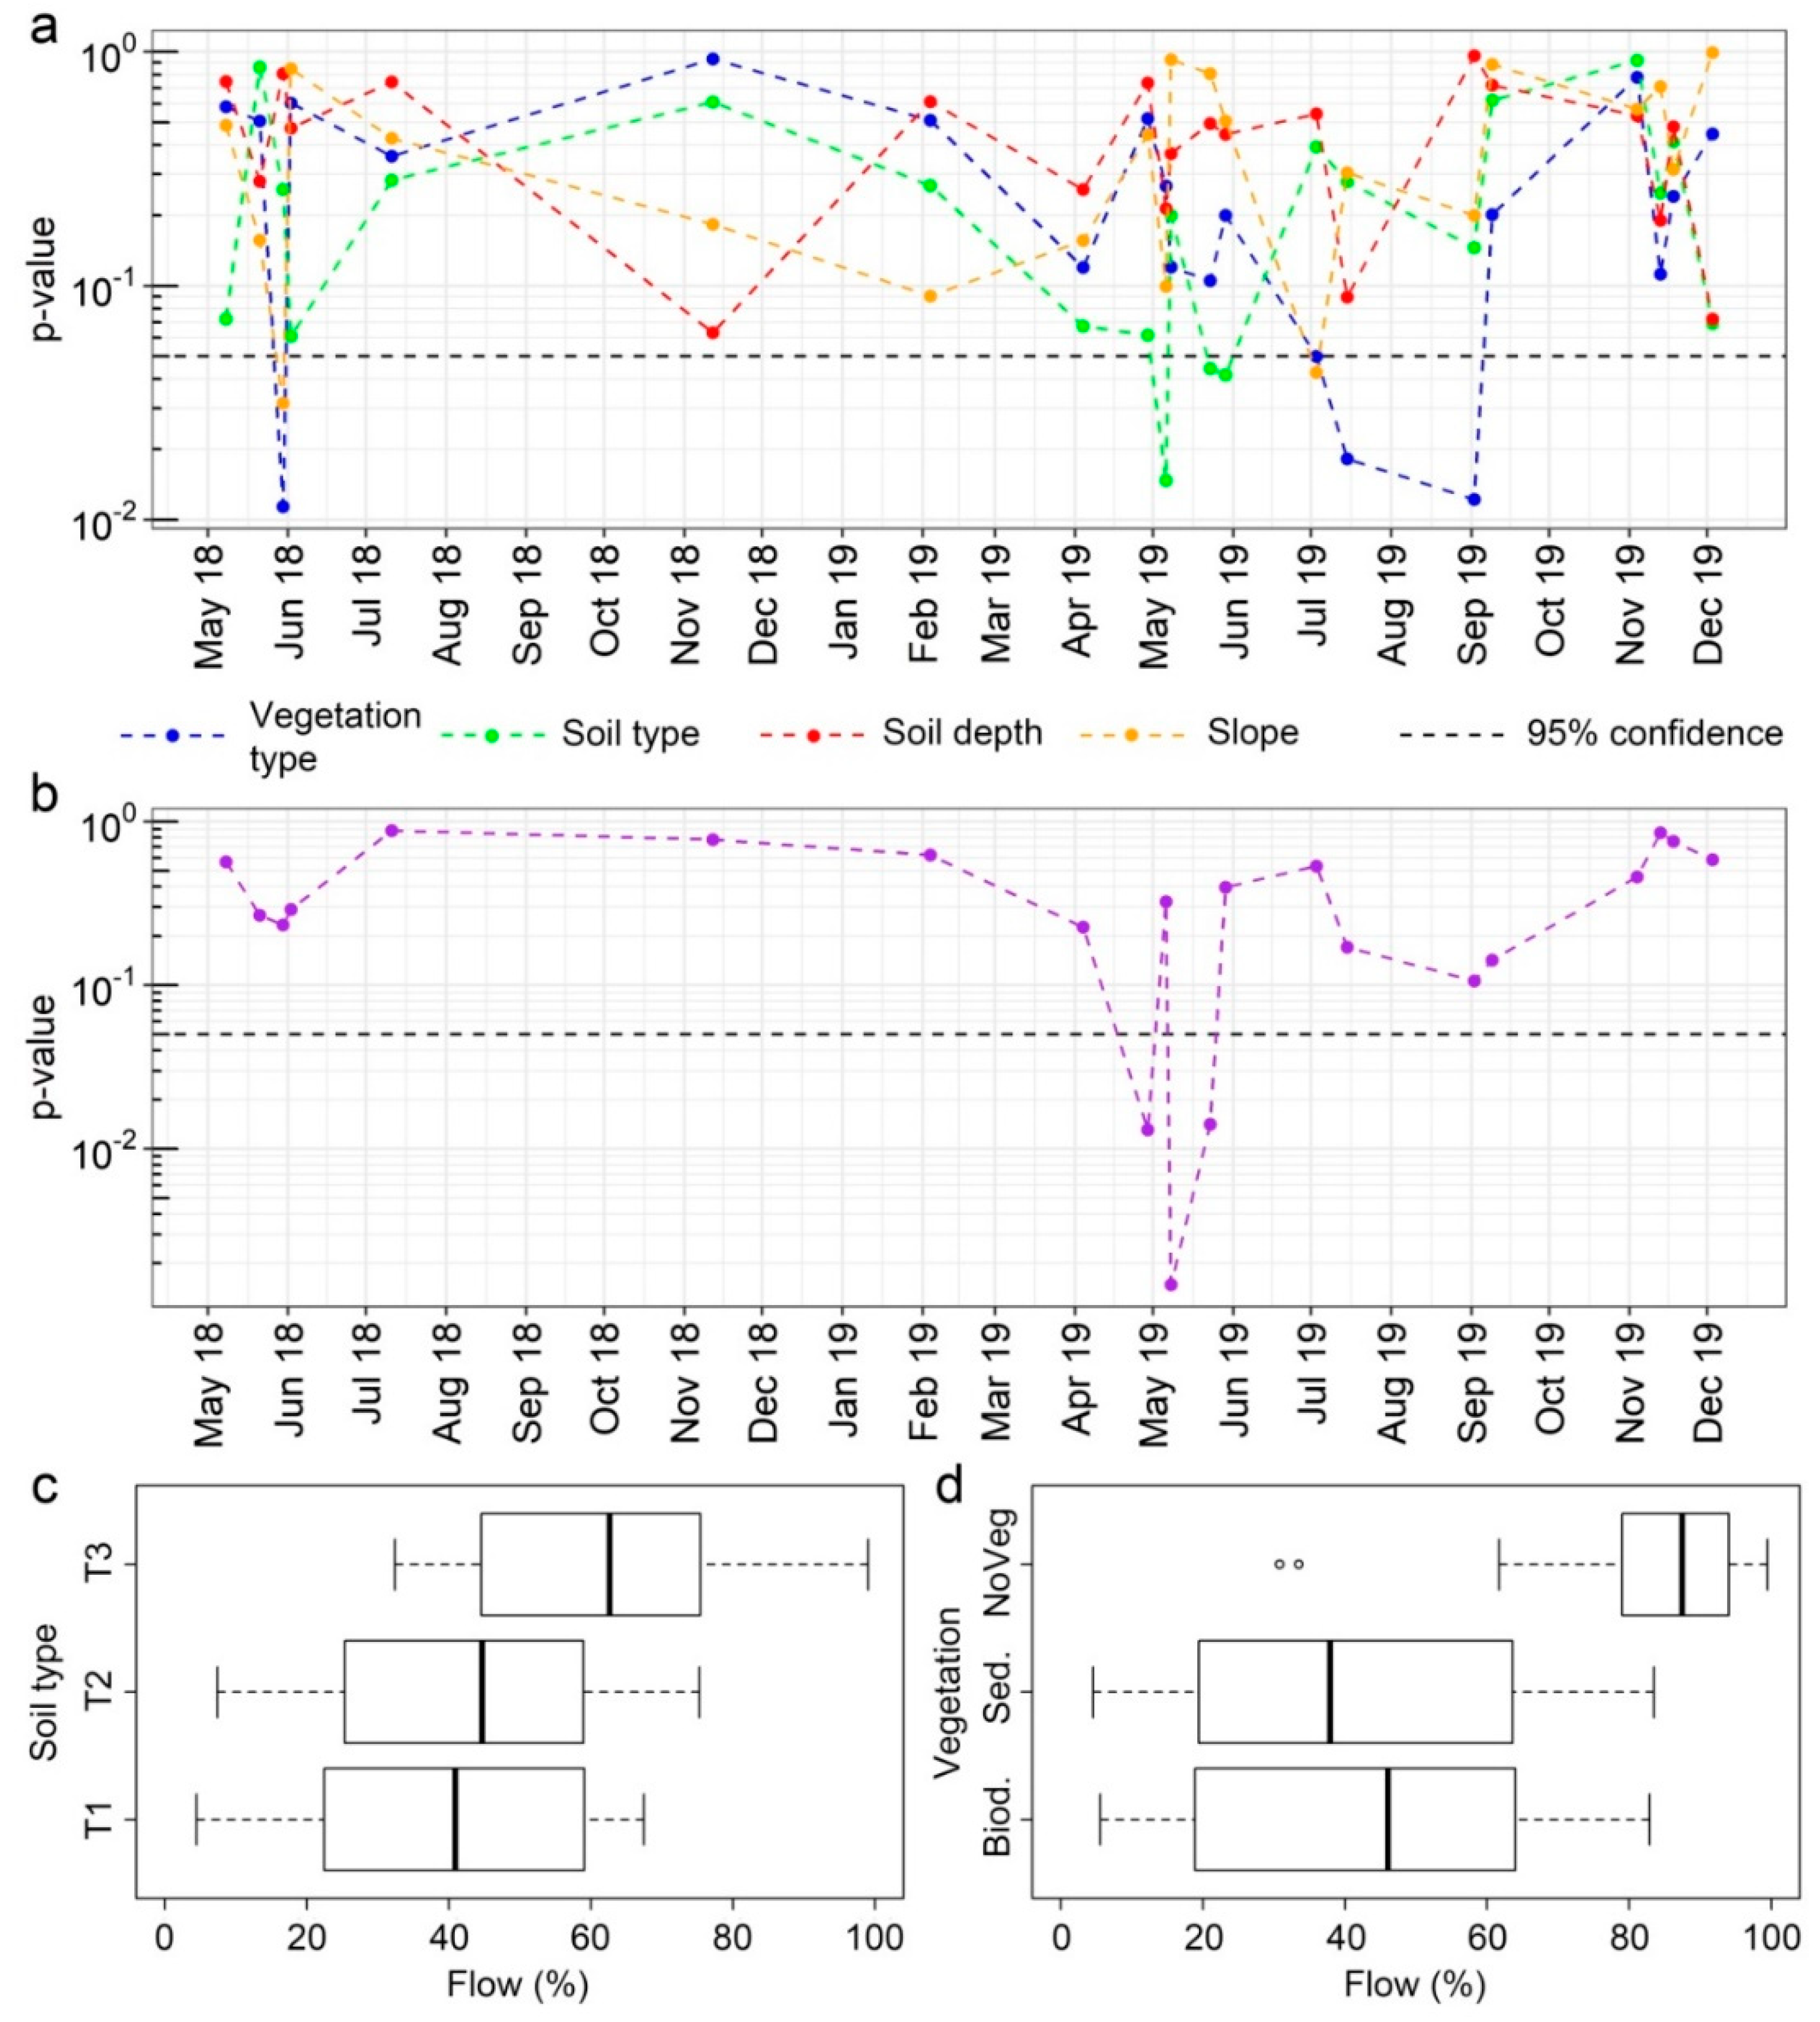
3.2. GR Characteristics Controlling the Drainage Flow

We conducted an ANOVA considering data from the 48 TBs located at the IRSA-CNR following 24 precipitation events, i.e., about 1000 drainage rates recorded during the 2018–2019 period. In this regard, we investigated some characteristics of GRs controlling the drainage flow. Particularly, we considered growing medium type and depth, vegetation type, and slope. Figure 2a shows the results. Generally, the selected factors become statistically significant only one year after the installation of the experimental site (i.e., about 9 months later). Many studies highlight that green roofs need at least a six-month period to stabilize [43].
The relevance of the growing medium material emerged during the spring of 2019. Figure 2c shows the drainage flow during this season (from April to June 2019) in relation to the soil type. We observed that soils T1 and T2 retained a higher water content than soil T3, which showed a significantly higher drainage capacity. Several authors [44] found that growing medium material is one of most important factors influencing drainage. In particular, Stovin et al., 2015 [45], assessed the relationship between porous/permeable materials and retention levels. Notably, T2 was composed of the same soil type as T3, but it was enriched with organic matter: as a result, a higher retention capacity was obtained.
Concerning the physical characteristics of the growing medium, we observed no significant benefit of the depth (from 8 to 15 cm) or slope (from 2° to 10°) on volume retention. Some authors pointed out that, although increased depths resulted in higher retention, the gain was not significantly large [29,44]. However, the effect of slope on rainfall retention is still unclear. Some studies found no significant difference in retention amounts across differently sloped roofs [44]. Other studies suggested increasing outflow with increased slope. The contradicting results may be due to varying rainfall patterns in different environments [29].
The vegetation type determined a significantly different drainage rate during the summer of 2019. Figure 2d shows the drainage flow during this season (from July to September 2019) only in relation to the vegetation type. We observed no significant difference between the type of vegetation used (grass field vs. Sedum), while the differences were significant between vegetated and non-vegetated TBs. In our case, the vegetation cover allowed for significantly less drainage, because vegetation consumed high water amounts independent of the type of vegetation used. According to Nagase et al., 2012 [46], the hydrological behavior of GRs depends on the interception, retention, and transpiration capacity of the plants. Berretta et al., 2014 [47], considered evapotranspiration as one of the key parameters for the performance of GRs. These authors found that vegetated assets are able to absorb about 25% more than the corresponding non-vegetated ones. In our case, Figure 2d shows that the retention rate in vegetated TBs was ca. 40% higher with respect to the non-vegetated ones.
Fertilization was investigated on a restricted number of test beds: six TBs were fertilized while six other TBs were left unfertilized. The fertilized TBs showed faster plant growth (i.e., higher plants) and more dense vegetation (i.e., more plants per m2 and thus a thicker cover of the growing medium) in comparison to non-fertilized ones. We observed that during the spring of 2019 the fertilized TBs drained less than the non-fertilized ones (Figure 2b). In fact, fertilization allowed the TBs to develop lush vegetation able to retain (via interception and evapotranspiration) more water. Based on our current knowledge, this is the first study showing the effect of fertilization on drainage flow.
We can summarize that during the spring, when the vegetation has not reached its maximum development (at the beginning of vegetative period), the growing medium material (due to a reduction of percolation) and fertilization (due to an increase of plant uptake) play a significant role in determining the drainage flow. At the beginning of the summer, the vegetation cover is generally able to significantly reduce the drainage flow and its benefits overcome those of the growing medium material. Other studies also underlined the role of vegetation in retaining water and pollutants, with higher retention rates in summer than in winter [47,48].

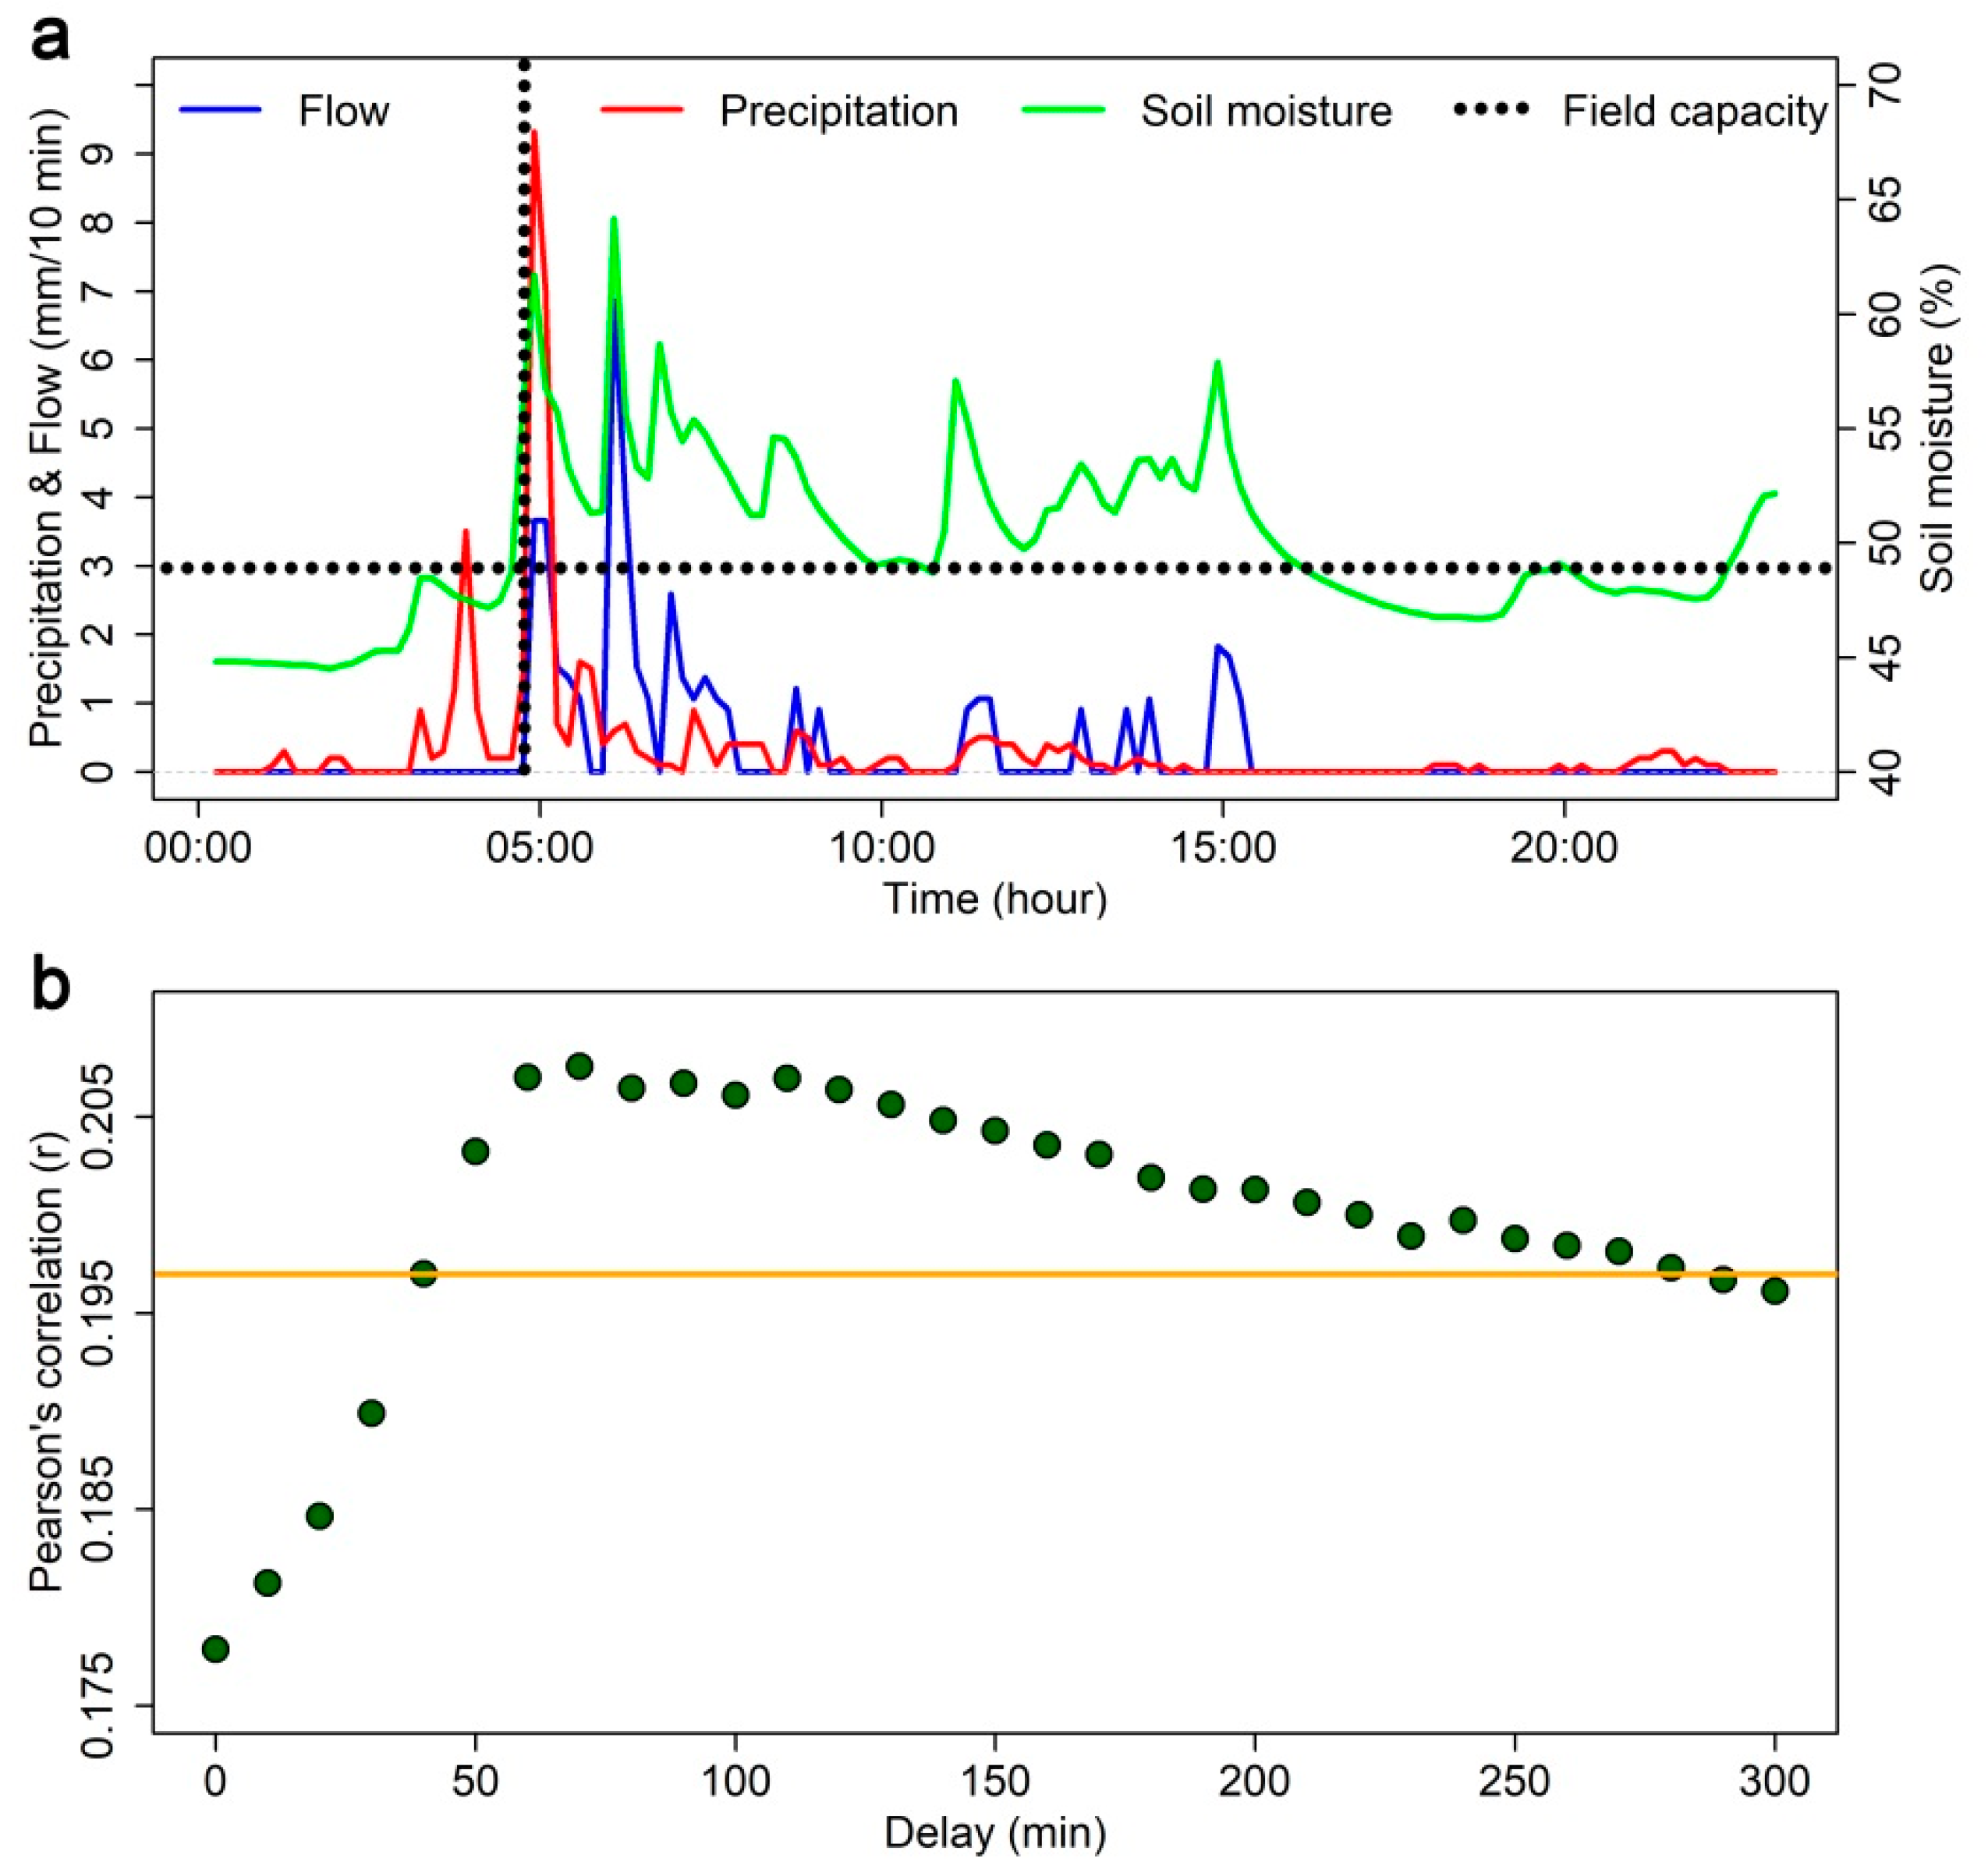
3.3. Analysis of the Peak Flow Delay

Figure 3a illustrates the drainage response of TB-48 equipped with soil moisture and flow rate sensors during a rain event, selected as representative of typical rainfall events. The field capacity is indicated in Figure 3. The intersection of the horizontal and vertical dotted lines indicates the storage capacity and time at which there is no more capillary storage available; in this case, field capacity is reached. In Figure 3a there are two clear rainfall peaks. The first precipitation peak is smaller (3 mm/10 min) than the second one (9 mm/10 min), and the soil moisture is lower than the field capacity. In this situation there is no drainage from the test bed and the soil stores water. When the second precipitation peak occurs, the soil becomes saturated, and the water starts flowing out from the test bed.
The correlogram (correlation coefficient versus lag) of Figure 3b shows the best match between the precipitation and peak time series based on the delay. We observe that between 60 and 120 min (from 1 to 2 h) the correlations are the highest, i.e., the time-lapse indicates the shift between flow peaks (delayed) and precipitation ones. The observed range amplitude of the delay likely depends on the combination of the precipitation amount and the soil moisture condition of each precipitation event. A wide window of delays has been reported in the literature: from 0 to 10 min [49], 1 min [50], 13 min [32], from 25 to 35 min [51], 54 min [52], and 2 h [53].
The combination of the TB features and the climatic regime of the Metropolitan Area of Milan allowed us to observe a rather high delay compared to the case studies described in the literature. Thus, a precipitation peak delay from 1 to 2 h would be sufficient to guarantee environmental benefits (e.g., pollution, flooding, and erosion) if GRs with the characteristics we tested here were used in the urban planning of Milan [13].

3.4. Hydrological Factors Determining GR Drainage Flow

The last objective of this study is devoted to the development of a multi-regression model, specific to the site of interest, which can be useful to determine the role of different factors in determining GR retention for individual precipitation events.
In Figure 3a we observe that the relationship between soil moisture and field capacity is crucial in determining the drainage flow. Therefore, we analyzed the relationship between climate and soil moisture in TB-48. Figure 4a,b shows a clear indirect relationship between air temperature and soil moisture, while Figure 4c,d shows a less clear link between soil moisture and precipitation. We suppose that the evapotranspiration process dominates over precipitation rates in determining the soil moisture. During the warm summer months, the soil moisture reaches minimum levels even if rain is abundant. However, during the cold winter months, the soil moisture is high even if precipitation is low. The box plots in Figure 5 show similar relationships, also adding relevant information on the variability of these parameters. The soil moisture variability is higher from June to October, when its values are the lowest. A greater variability can be observed even in precipitation series during the same months, while changes in variance are less evident for air temperature.
Berndtsson, 2010 [33], found that, although soil moisture is one of the main parameters that characterizes GR drainage, few studies have been focused on it. In this regard, our multi-regression analysis revealed that the soil moisture of the day preceding the event and the cumulated precipitation are significant hydrological factors determining the drainage flow rate (r = 0.70, p < 0.01). It is noteworthy that only these two parameters were found to be significant (p < 0.05), while no other parameters provided significantly higher performance to the model. Residuals were tested and the results were normally distributed. The analysis of the relative importance of the significant parameters revealed a similar contribution (55% for soil moisture and 45% for precipitation) in generating the drainage flow. As a consequence, as shown in Figure 5, higher drainage flow rates were recorded during the coldest months (from November to February), while the lowest ones were recorded during the summer.
The implications of this observation are noteworthy. We showed that monitoring soil moisture and precipitation data can be effective in predicting the capacity of the substratum to withhold water. At the same time, we recognize the limitation of these findings that are strictly site-specific, being influenced by the experimental setup and local climatic conditions. However, we point out that soil moisture is an easy monitoring parameter that, coupled with precipitation, can be used to evaluate and thus drive the future of applied research on the hydraulic efficiency of GRs.

4. Conclusions

Green roofs may present a solution for minimizing the impact of urbanization on the hydrologic cycle and for sustainably managing water resources in urban environments. Several studies have shown that GRs effectively control surface runoff in urban drainage systems, reducing overall stormwater volumes and peak flow rates. This is particularly important considering the effects of climate change and the projected changes of the hydrological cycle (IPCC Sixth Assessment Report). In this study we conducted an intensive field monitoring campaign for two years on 48 small-scale TBs installed in the Metropolitan Area of Milan, the most urbanized area in Italy, obtaining the following results:
  • We calculated a mean drainage flow rate of 51%. Considering the factors influencing the flow rate, we found that: (i) the growing medium material plays a significant role in determining the drainage flow in the spring, at the beginning of the vegetative period; (ii) soils T1 and T2 retain a higher water content than soil T3, which shows a significantly higher drainage capability; (iii) the vegetation cover is able to significantly reduce the drainage flow and its benefits overcome the ones of the growing medium material; (iv) the vegetation type (biodiverse and Sedum) does not play a significant role in the retention processes; (v) concerning the growing medium’s physical characteristics, we observed no significant effects of depth (8–15 cm) and slope (2°–10°) on volume retention. The effect of these parameters on rainfall retention is still unclear.
  • We found a precipitation peak delay of 1–2 h for a specific TB characterized by biodiverse vegetation, T3 growing medium with a thickness of 15 cm, and 2° slope. The combination of the TB features and the climatic regime of the Metropolitan Area of Milan allowed us to observe a noteworthy delay compared to the case studies described in the literature. This magnitude of the precipitation peak delay would be sufficient to guarantee environmental benefits (e.g., pollution, flooding, and erosion) as analyzed by Salerno et al. [40] for the same conurbation.
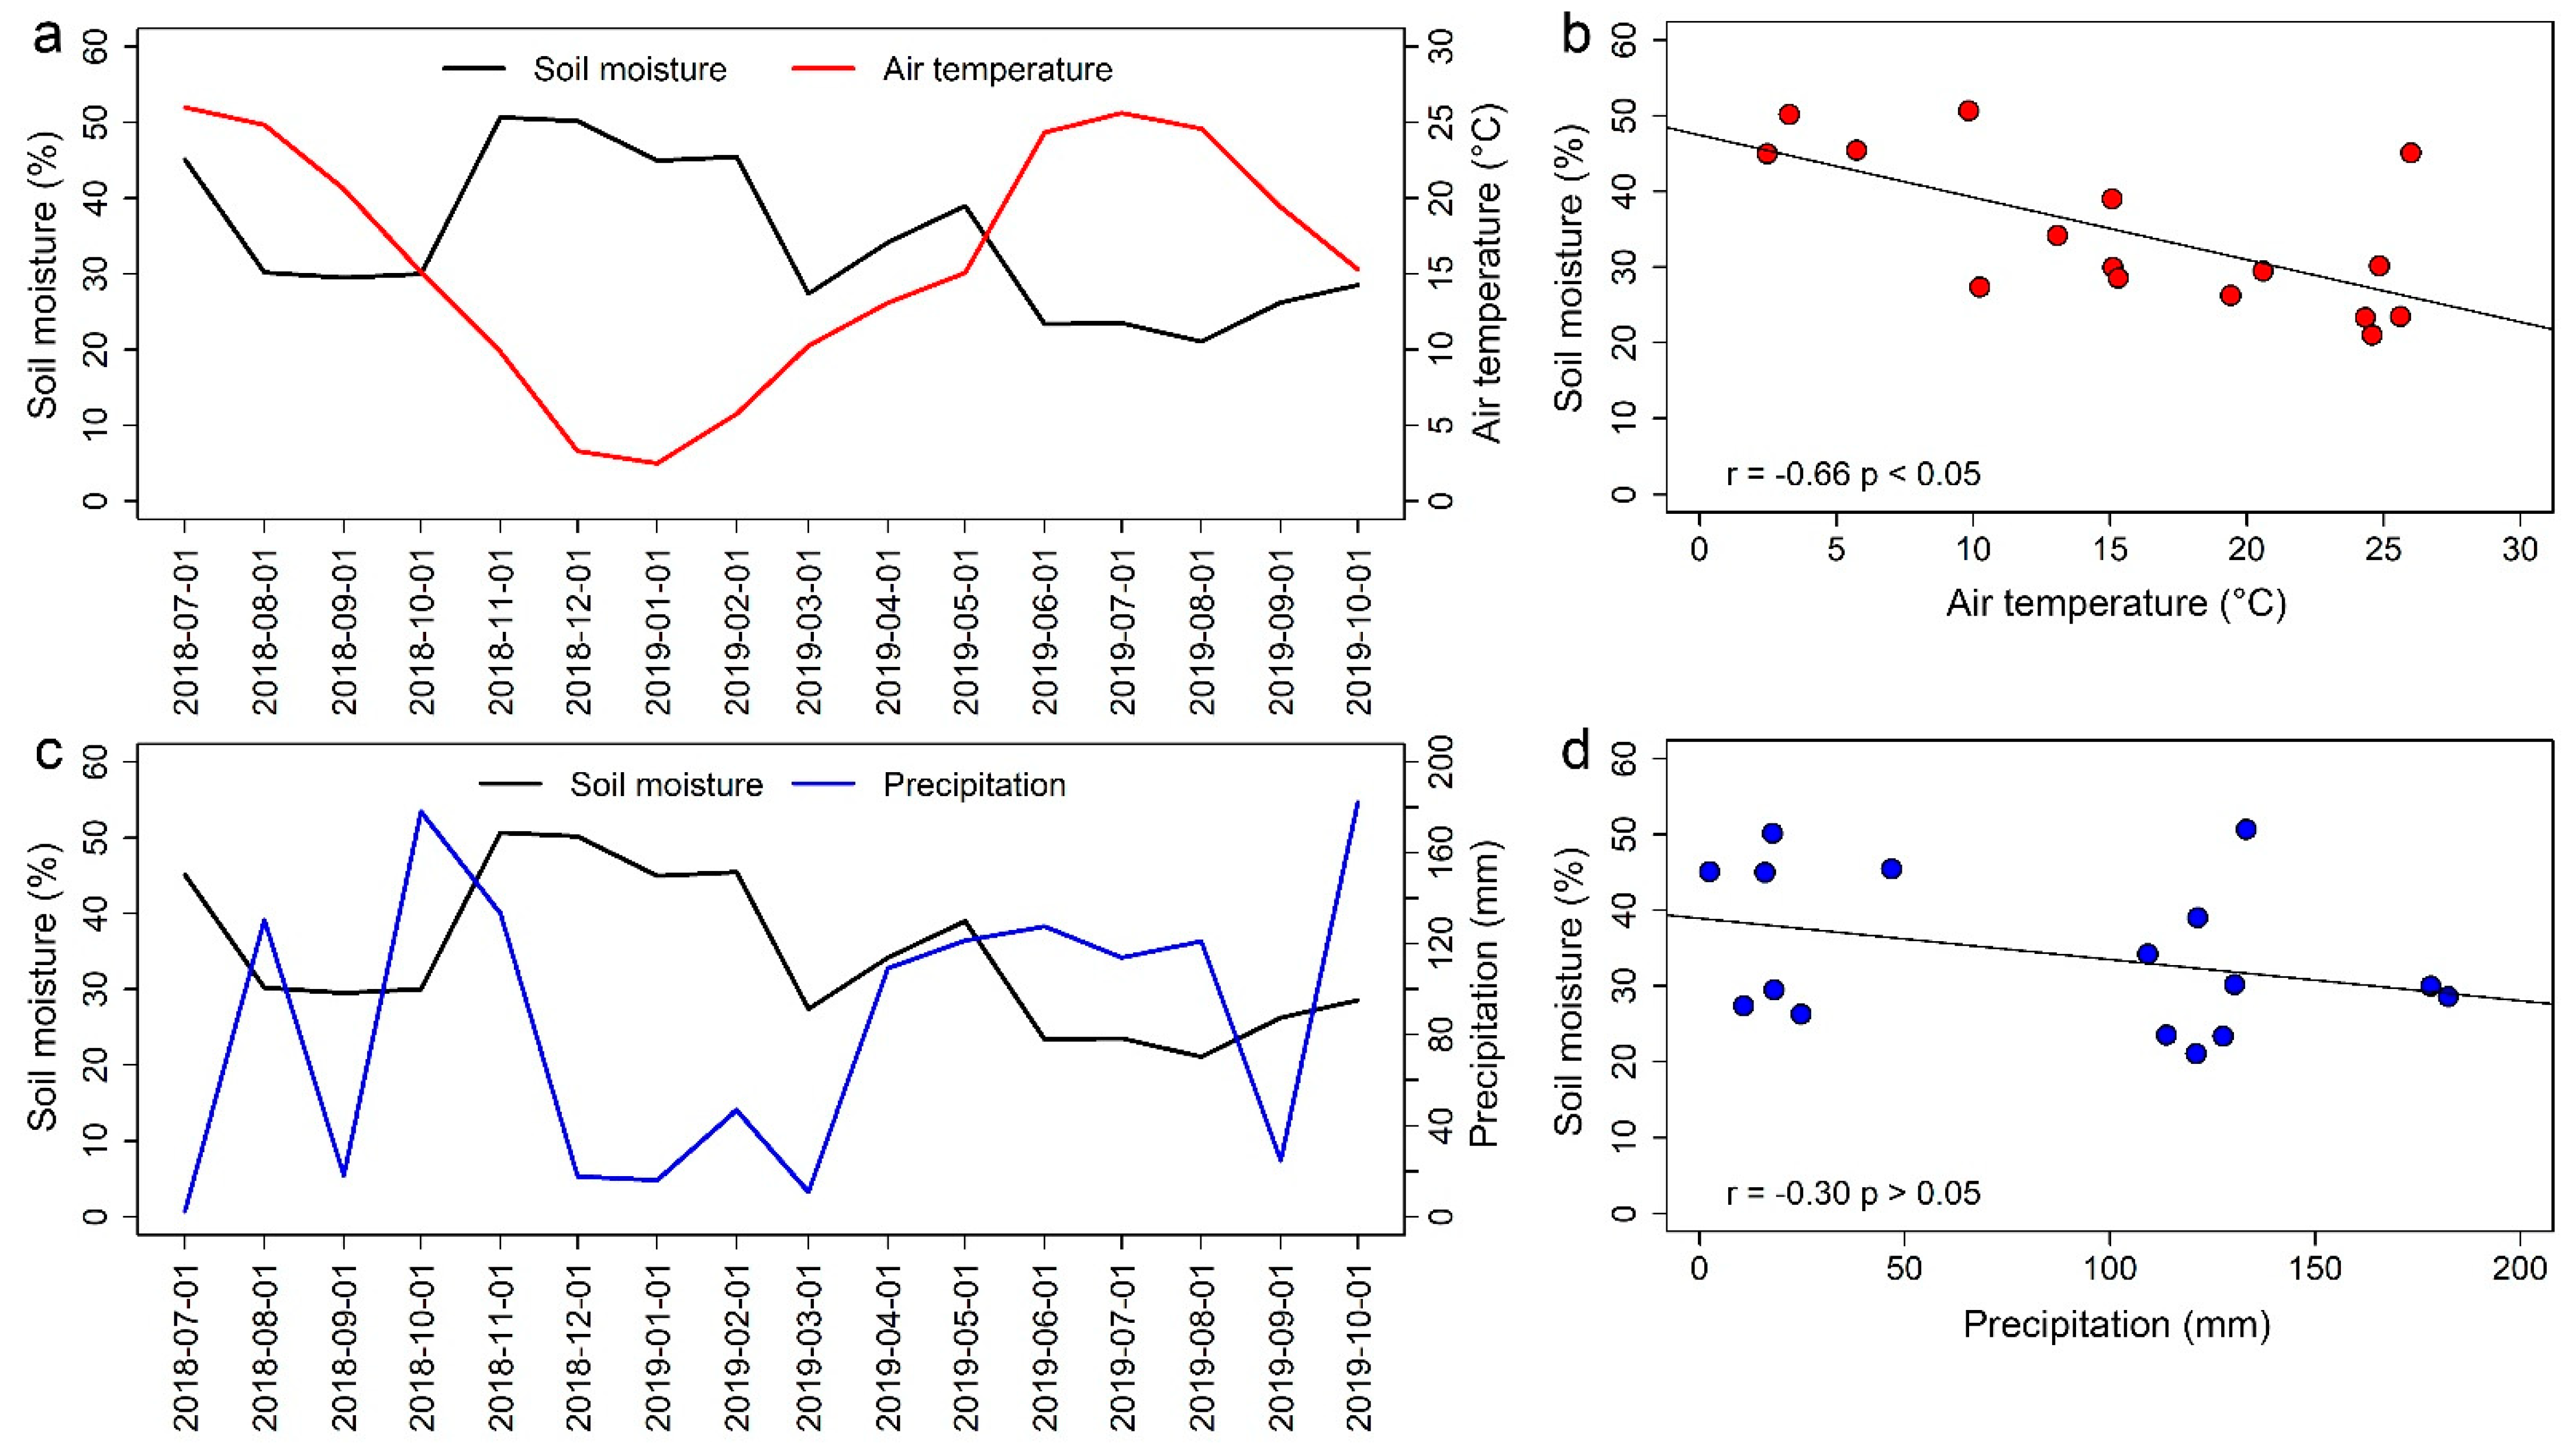
  • We found that soil moisture and cumulated precipitation are equally significant factors determining the drainage flow rate, confirming that soil moisture is one of the main parameters that characterize GR drainage capacity. Although we recognize that these parameters are strictly site-specific, we point out that using an easy monitoring parameter like soil moisture can contribute to future applied research on the hydraulic efficiency of GRs.
Future efforts should be devoted to full-scale studies in order to validate our findings in real green roofs. Some of the configurations tested in this study are widespread in Milan, as well as in other metropolitan areas. Therefore, the goal to deepen our study using different full-scale studies can be potentially achieved. In full-scale systems, further studies need to analyze the precipitation peak delay as a function of the growing medium and vegetation characteristics.

Author Contributions

Data curation, G.T.; Investigation, F.S., D.C., G.T., B.B., and L.M.; Methodology, F.S., L.V., R.M., D.C., A.B., and L.M.; Software, N.G.; Writing—original draft, F.S., N.P., and L.M.; Writing—review and editing, N.C. All authors have read and agreed to the published version of the manuscript.

Funding

This research was funded by the Lombardy Region within the Third Framework Agreement with the National Research Council (Intelligent-Zero Energy Buildings Project—I-ZEB, 2016–2019; Operational Convention n° 19366/RCC, 10/01/2017), and by BrianzAcque s.r.l. within the Agreement between BrianzAcque s.r.l., the Office of the Optimal Territorial Area of Monza and Brianza (ATO) and the National Research Council—Institute for Research on Waters (CNR-IRSA) for the development of activities relating to the theme “Green roofs: quality and quantity of water by runoff (2018–2019)”.

Institutional Review Board Statement

Not applicable.

Informed Consent Statement

Not applicable.

Data Availability Statement

The data presented in this study are available on request from the corresponding author.

Acknowledgments

Materials used to create the GRs were provided by Daku Italia s.r.l. (www.daku.it, accesses on 10 November 2021) and Harpo S.p.A. (www.harpogroup.it, accesses on 10 November 2021).

Conflicts of Interest

The authors declare no conflict of interest.

References

  1. UN (United Nations). United Nations Final Report on World Urbanization Prospects; United Nations: New York, NY, USA, 2018. [Google Scholar]
  2. Talebi, A.; Bagg, S.; Sleep, B.E.; O’Carroll, D.M. Water Retention Performance of Green Roof Technology: A Comparison of Canadian Climates. Ecol. Eng. 2019, 126, 1–15. [Google Scholar] [CrossRef]
  3. US-EPA Methods for the Determination of Total Organic Carbon (TOC) in Soils and Sediments; NCEA-C-1282, EMASC-001; US Environmental Protection Agency, Ecological Risk Assessment Support Center, Office of Research and Development: Las Vegas, NV, USA, 2002.
  4. Johannessen, B.; Muthanna, T.; Braskerud, B. Detention and Retention Behavior of Four Extensive Green Roofs in Three Nordic Climate Zones. Water 2018, 10, 671. [Google Scholar] [CrossRef] [Green Version]
  5. IPCC Land-Climate Interaction. In IPCC SRCCL; 2019; 186p, Available online: https://www.ipcc.ch/srccl/chapter/chapter-2/ (accessed on 11 November 2021).
  6. Palermo, S.A.; Turco, M.; Principato, F.; Piro, P. Hydrological Effectiveness of an Extensive Green Roof in Mediterranean Climate. Water 2019, 11, 1378. [Google Scholar] [CrossRef] [Green Version]
  7. Kabisch, N.; Korn, H.; Stadler, J.; Bonn, A. Nature-Based Solutions to Climate Change Adaptation in Urban Areas—Linkages Between Science, Policy and Practice. In Nature-Based Solutions to Climate Change Adaptation in Urban Areas: Linkages between Science, Policy and Practice; Kabisch, N., Korn, H., Stadler, J., Bonn, A., Eds.; Theory and Practice of Urban Sustainability Transitions; Springer International Publishing: Cham, Switzerland, 2017; pp. 1–11. ISBN 978-3-319-56091-5. [Google Scholar]
  8. IUCN. Guidance for Using the IUCN Global Standard for Nature-Based Solutions, 1st ed.; International Union for Conservation of Nature: Gland, Switzerland, 2020. [Google Scholar] [CrossRef]
  9. EEA Nature-Based Solutions in Europe: Policy, Knowledge and Practice for Climate Change Adaptation and Disaster Risk Reduction—European Environment Agency. Available online: https://www.eea.europa.eu/publications/nature-based-solutions-in-europe (accessed on 25 November 2021).
  10. Zheng, X.; Zou, Y.; Lounsbury, A.W.; Wang, C.; Wang, R. Green Roofs for Stormwater Runoff Retention: A Global Quantitative Synthesis of the Performance. Resour. Conserv. Recycl. 2021, 170, 105577. [Google Scholar] [CrossRef]
  11. Garofalo, G.; Palermo, S.A.; Principato, F.; Theodosiou, T.; Piro, P. The Influence of Hydrologic Parameters on the Hydraulic Efficiency of an Extensive Green Roof in Mediterranean Area. Water 2016, 8, 44. [Google Scholar] [CrossRef]
  12. Jing, R.; Hastings, A.; Guo, M. Sustainable Design of Urban Rooftop Food-Energy-Land Nexus. iScience 2020, 23, 101743. [Google Scholar] [CrossRef]
  13. Salerno, F.; Gaetano, V.; Gianni, T. Urbanization and Climate Change Impacts on Surface Water Quality: Enhancing the Resilience by Reducing Impervious Surfaces. Water Res. 2018, 144, 491–502. [Google Scholar] [CrossRef]
  14. Copetti, D.; Marziali, L.; Viviano, G.; Valsecchi, L.; Guzzella, L.; Capodaglio, A.G.; Tartari, G.; Polesello, S.; Valsecchi, S.; Mezzanotte, V.; et al. Intensive Monitoring of Conventional and Surrogate Quality Parameters in a Highly Urbanized River Affected by Multiple Combined Sewer Overflows. Water Supply 2019, 19, 953–966. [Google Scholar] [CrossRef] [Green Version]
  15. Viviano, G.; Valsecchi, S.; Polesello, S.; Capodaglio, A.; Tartari, G.; Salerno, F. Combined Use of Caffeine and Turbidity to Evaluate the Impact of CSOs on River Water Quality. Water. Air. Soil Pollut. 2017, 228, 330. [Google Scholar] [CrossRef]
  16. Raimondi, A.; Marchioni, M.; Sanfilippo, U.; Becciu, G. Vegetation Survival in Green Roofs without Irrigation. Water 2021, 13, 136. [Google Scholar] [CrossRef]
  17. Pirouz, B.; Palermo, S.A.; Turco, M. Improving the Efficiency of Green Roofs Using Atmospheric Water Harvesting Systems (An Innovative Design). Water 2021, 13, 546. [Google Scholar] [CrossRef]
  18. Krebs, G.; Kuoppamäki, K.; Kokkonen, T.; Koivusalo, H. Simulation of Green Roof Test Bed Runoff. Hydrol. Process. 2016, 30, 250–262. [Google Scholar] [CrossRef]
  19. Charalambous, K.; Bruggeman, A.; Eliades, M.; Camera, C.; Vassiliou, L. Stormwater Retention and Reuse at the Residential Plot Level—Green Roof Experiment and Water Balance Computations for Long-Term Use in Cyprus. Water 2019, 11, 1055. [Google Scholar] [CrossRef] [Green Version]
  20. Campisano, A.; Modica, C.; Gullotta, A. Long-Term Experiments for the Evaluation of the Potential for Storm Water Control of Modular Blue Roofs in Mediterranean Climate. Urban Water J. 2021, 18, 33–42. [Google Scholar] [CrossRef]
  21. Todorov, D.; Driscoll, C.T.; Todorova, S. Long-Term and Seasonal Hydrologic Performance of an Extensive Green Roof. Hydrol. Process. 2018, 32, 2471–2482. [Google Scholar] [CrossRef]
  22. Longobardi, A.; D’Ambrosio, R.; Mobilia, M. Predicting Stormwater Retention Capacity of Green Roofs: An Experimental Study of the Roles of Climate, Substrate Soil Moisture, and Drainage Layer Properties. Sustainability 2019, 11, 6956. [Google Scholar] [CrossRef] [Green Version]
  23. Beecham, S.; Razzaghmanesh, M. Water Quality and Quantity Investigation of Green Roofs in a Dry Climate. Water Res. 2015, 70, 370–384. [Google Scholar] [CrossRef] [PubMed]
  24. Ferrans, P.; Rey, C.; Pérez, G.; Rodríguez, J.; Díaz-Granados, M. Effect of Green Roof Configuration and Hydrological Variables on Runoff Water Quantity and Quality. Water 2018, 10, 960. [Google Scholar] [CrossRef] [Green Version]
  25. Hellies, M.; Deidda, R.; Viola, F. Retention Performances of Green Roofs Worldwide at Different Time Scales. Land Degrad. Dev. 2018, 29, 1940–1952. [Google Scholar] [CrossRef]
  26. Fassman-Beck, E.; Voyde, E.; Simcock, R.; Hong, Y.S. 4 Living Roofs in 3 Locations: Does Configuration Affect Runoff Mitigation? J. Hydrol. 2013, 490, 11–20. [Google Scholar] [CrossRef]
  27. ISTAT Forme, Livelli e Dinamiche dell’Urbanizzazione in Italia. 2017. Available online: www.istat.it/it/files/2017/05/urbanizzazione.pdf (accessed on 20 October 2021).
  28. Municipality of Milan. 2020. Available online: https://www.comune.milano.it/-/milano-green-week.-un-futuro-con-13-milioni-di-mq-di-tetti-verdi-in-citta (accessed on 20 October 2021).
  29. Palla, A.; Gnecco, I.; Lanza, L. Hydrologic Restoration in the Urban Environment Using Green Roofs. Water 2010, 2, 140–154. [Google Scholar] [CrossRef]
  30. Stovin, V. The Potential of Green Roofs to Manage Urban Stormwater: The Potential of Green Roofs to Manage Urban Stormwater. Water Environ. J. 2010, 24, 192–199. [Google Scholar] [CrossRef]
  31. Copetti, D.; Tartari, G.; Valsecchi, L.; Salerno, F.; Viviano, G.; Mastroianni, D.; Yin, H.; Viganò, L. Phosphorus Content in a Deep River Sediment Core as a Tracer of Long-Term (1962–2011) Anthropogenic Impacts: A Lesson from the Milan Metropolitan Area. Sci. Total Environ. 2019, 646, 37–48. [Google Scholar] [CrossRef] [PubMed]
  32. Sims, A.W.; Robinson, C.E.; Smart, C.C.; O’Carroll, D.M. Mechanisms Controlling Green Roof Peak Flow Rate Attenuation. J. Hydrol. 2019, 577, 123972. [Google Scholar] [CrossRef]
  33. Czemiel Berndtsson, J. Green Roof Performance towards Management of Runoff Water Quantity and Quality: A Review. Ecol. Eng. 2010, 36, 351–360. [Google Scholar] [CrossRef]
  34. Salerno, F.; Thakuri, S.; Guyennon, N.; Viviano, G.; Tartari, G. Glacier Melting and Precipitation Trends Detected by Surface Areachanges in Himalayan Ponds. Cryosphere 2016, 10, 1433–1448. [Google Scholar] [CrossRef] [Green Version]
  35. Twarakavi, N.K.C.; Sakai, M.; Šimůnek, J. An Objective Analysis of the Dynamic Nature of Field Capacity. Water Resour. Res. 2009, 45. [Google Scholar] [CrossRef]
  36. Assouline, S.; Or, D. The Concept of Field Capacity Revisited: Defining Intrinsic Static and Dynamic Criteria for Soil Internal Drainage Dynamics. Water Resour. Res. 2014, 50, 4787–4802. [Google Scholar] [CrossRef]
  37. Marziali, L.; Rosignoli, F.; Drago, A.; Pascariello, S.; Valsecchi, L.; Rossaro, B.; Guzzella, L. Toxicity Risk Assessment of Mercury, DDT and Arsenic Legacy Pollution in Sediments: A Triad Approach under Low Concentration Conditions. Sci. Total Environ. 2017, 593–594, 809–821. [Google Scholar] [CrossRef]
  38. Venables, W.N.; Ripley, B.D. Modern Applied Statistics with S, 4th ed.; Statistics and Computing; Springer: New York, NY, USA, 2010; ISBN 978-1-4419-3008-8. [Google Scholar]
  39. Shapiro, S.S.; Wilk, M.B. An Analysis of Variance Test for Normality (Complete Samples). Biometrika 1965, 52, 591. [Google Scholar] [CrossRef]
  40. Grömping, U. Relative Importance for Linear Regression in R: The Package Relaimpo. J. Stat. Softw. 2006, 17. [Google Scholar] [CrossRef] [Green Version]
  41. Gromaire, M.C.; Ramier, D.; Seidl, M.; Berthier, E.; Saad, M.; de Gouvello, B. Impact of Extensive Green Roofs on the Quantity and the Quality of Runoff—First Results of a Test Bench in the Paris Region; GRAIE: Lyon, France, 2013. [Google Scholar]
  42. Silva, M.d.; Najjar, M.K.; Hammad, A.W.A.; Haddad, A.; Vazquez, E. Assessing the Retention Capacity of an Experimental Green Roof Prototype. Water 2019, 12, 90. [Google Scholar] [CrossRef] [Green Version]
  43. Cirrincione, L.; La Gennusa, M.; Peri, G.; Rizzo, G.; Scaccianoce, G.; Sorrentino, G.; Aprile, S. Green Roofs as Effective Tools for Improving the Indoor Comfort Levels of Buildings—An Application to a Case Study in Sicily. Appl. Sci. 2020, 10, 893. [Google Scholar] [CrossRef] [Green Version]
  44. Liu, H.; Kong, F.; Yin, H.; Middel, A.; Zheng, X.; Huang, J.; Xu, H.; Wang, D.; Wen, Z. Impacts of Green Roofs on Water, Temperature, and Air Quality: A Bibliometric Review. Build. Environ. 2021, 196, 107794. [Google Scholar] [CrossRef]
  45. Stovin, V.; Poë, S.; De-Ville, S.; Berretta, C. The Influence of Substrate and Vegetation Configuration on Green Roof Hydrological Performance. Ecol. Eng. 2015, 85, 159–172. [Google Scholar] [CrossRef] [Green Version]
  46. Nagase, A.; Dunnett, N. Amount of Water Runoff from Different Vegetation Types on Extensive Green Roofs: Effects of Plant Species, Diversity and Plant Structure. Landsc. Urban Plan. 2012, 104, 356–363. [Google Scholar] [CrossRef]
  47. Berretta, C.; Poë, S.; Stovin, V. Reprint of “Moisture Content Behaviour in Extensive Green Roofs during Dry Periods: The Influence of Vegetation and Substrate Characteristics”. J. Hydrol. 2014, 516, 37–49. [Google Scholar] [CrossRef]
  48. Chenot, J.; Gaget, E.; Moinardeau, C.; Jaunatre, R.; Buisson, E.; Dutoit, T. Substrate Composition and Depth Affect Soil Moisture Behavior and Plant-Soil Relationship on Mediterranean Extensive Green Roofs. Water 2017, 9, 817. [Google Scholar] [CrossRef] [Green Version]
  49. Carter, T.L.; Rasmussen, T.C. Hydrologic behavior of vegetated roofs. J. Am. Water Resour. Assoc. 2006, 42, 1261–1274. [Google Scholar] [CrossRef]
  50. Villarreal, E.L. Runoff Detention Effect of a Sedum Green-Roof. Hydrol. Res. 2007, 38, 99–105. [Google Scholar] [CrossRef]
  51. Wong, G.K.L.; Jim, C.Y. Quantitative Hydrologic Performance of Extensive Green Roof under Humid-Tropical Rainfall Regime. Ecol. Eng. 2014, 70, 366–378. [Google Scholar] [CrossRef]
  52. Stovin, V.; Vesuviano, G.; Kasmin, H. The Hydrological Performance of a Green Roof Test Bed under UK Climatic Conditions. J. Hydrol. 2012, 414–415, 148–161. [Google Scholar] [CrossRef]
  53. DeNardo, J.C.; Jarrett, A.R.; Manbeck, H.; Beattie, D.J.; Berghage, R. Stormwater mitigation and surface temperature reduction by green roofs. Trans. ASAE 2005, 48, 1491–1496. [Google Scholar] [CrossRef]
Figure 1. The experimental site located in northern Italy (red marker). A total of 48 TBs were set up north of the Metropolitan Area of Milan (IRSA-CNR) and 20 additional TBs were set up south of Milan (ITC-CNR). In the middle, the picture of the 48 TBs located at IRSA-CNR, and on the right, a single TB with the drainage collection system.
Sustainability 13 13638 g001
Figure 2. (a) Results of the multiway analysis of variance (ANOVA) on the tested factors vs. the drainage flow for 48 TBs. (b) Results of the fertilization process on 12 TBs. Finally, box plots representing differences in drainage flow for (c) soil and (d) vegetation type (Sed. = Sedum; Biod. = biodiverse; NoVeg = bare soil).
Sustainability 13 13638 g002
Figure 3. (a) Selection of a typical event hydrograph for TB-48 (14 May 2019). (b) Correlogram between precipitation and drainage time series for TB-48 (from 16 September 2019 to 13 February 2020).
Sustainability 13 13638 g003
Figure 4. (a) Relationship between monthly air temperature and soil moisture. (b) Scatter plot between air temperature and soil moisture (same data as Figure 3a). (c) Relationship between monthly precipitation and soil moisture. (d) Scatter plot between precipitation and soil moisture (same data as Figure 3b). The analysis refers to TB-48, for the period 2018–2019.
Sustainability 13 13638 g004
Figure 5. Monthly box plots of soil moisture (a), air temperature (b), and precipitation (c). The analysis refers to TB-48, for the period 2018–2019.
Sustainability 13 13638 g005
Publisher’s Note: MDPI stays neutral with regard to jurisdictional claims in published maps and institutional affiliations.

