Article

Using Structural Equation Modeling to Assess Online Learning Systems’ Educational Sustainability for University Students

by
Omar A. Alismaiel
Educational Technologies Department, College of Education, King Faisal University, Alhasa 31982, Saudi Arabia
Sustainability 2021, 13(24), 13565; https://doi.org/10.3390/su132413565
Submission received: 15 November 2021 / Revised: 3 December 2021 / Accepted: 3 December 2021 / Published: 8 December 2021

Abstract

:
The purpose of this study was to investigate the factors that influence the use of e-learning among students in higher education during the Corona Virus disease, during the 2019 season (COVID-19). A poll of 395 students from the student’s university was used to conduct the research. The study’s theoretical foundation was an expanded Technology Acceptance Model (TAM), which included task-technology fit and students’ engagement, as well as external elements such as experience (EXP), technology anxiety (TEA), and facilitating conditions (FC). The suggested model was tested and evaluated using SEM-PLS. The investigation demonstrated that the suggested TAM-based scale effectively describes factors impacting students’ use of E-learning during the pandemic. According to the findings, students’ engagement (SEN), EXP, TEA, and FC have a favorable impact on task–technology fit (TTF) and perceived ease of use (PEOU), resulting in a good impact on TTF and usage of an e-learning system for educational sustainability (EA). Finally, the TTF fit and convenience of use of eLearning in education have a positive impact on the behavioral intention to use an e-learning system for educational sustainability and the adoption process. As a result, higher education institutions should use eLearning as a sustainability learning strategy.

1. Introduction

E-learning is a learning approach that is based on formalized instruction, using electronic resources. While education can take place in or out of the classroom, e-learning is primarily dependent on the use of computers and the Internet. Therefore, e-learning is a network-enabled transfer of skills and knowledge, where education is delivered to a large number of people at the same time or at various periods [1,2]. The development of internet-based educational tools, such as virtual learning environments (VLE) and the increase in information and communication technology (ICT), have improved electronic learning (e-Learning) platforms [1]. E-learning has flourished at all levels of higher education around the world [1]. Educational institutions around the world are attempting to incorporate e-learning into old sequence delivery structures and establish combined learning environments [2]. This technique has added value for students and institutions by developing the excellence of the product [3,4]. Devoted administrators, competent and motivated learners, and well-organized students are all required to achieve the goal [5,6]. Furthermore, institutional constraints and bad user perceptions are hindering e-spread learning [7,8]. Despite its numerous benefits, e-learning is not commonly used in advanced countries for a variety of reasons. In the context of the COVID-19 epidemic, however, numerous universities have moved to e-learning to keep their academic programmes running. Coronaviruses are wreaking havoc around the world right now, with outbreaks occurring in practically every country. To combat the virus’s rapid spread, most governments have instituted lockdowns or mobility restrictions, which have had a tremendous influence on all parts of our daily lives. Regardless of the economy, one of COVID-19’s biggest setbacks has been the education sector. Thus, traditional learning methods have changed. An e-learning system can assist students and institutions in creating new opportunities in the event of a pandemic [9,10]. Several studies, including Ali et al., [7], Choi and Lam, [11] and Samsudeen and Mohamed, [12], have acknowledged the importance of e-learning in high-quality educational offerings. For example, it provided various e-learning benefits such as access from anywhere and at any time, enhanced student motivation, access to more advanced or novel learning methodologies, opportunities for self-directed education and adoption, improved ICT device arrangement, and increased maternal participation [13,14]. Empirical evidence reveals that academicians in local HEIs employ E-learning to a limited extent [15,16]. According to a small quantity of literature, there is a vacuum in our understanding of the reasons why academics in local HEIs are hesitant to implement e-learning. This enables researchers to investigate the determinants that affect E-learning adoption for educational sustainability at higher education institutions where blended learning is now optional.

Problem Statement

The usage of information technology in the education sector is increasing, and students routinely use mobile devices and the Internet. The e-learning system has fast become a necessary component in institutions. Students are also enthusiastic about online-based e-learning, as seen by their acceptance and adoption. On the other hand, researchers discovered some discrepancies in their findings. Even though learning platforms at educational institutions have expanded to include mobile services, they discovered that student curiosity and e-learning are not doing as well as they should [17,18]. A variety of conditions influence a learner’s acceptance and behavioral intention (BI) to use eLearning. An extensive and diverse analysis of such aspects is critical [19,20]. Thus, the focus of this research is on the students’ intentions and their e-learning adoption for educational sustainability (EA), using an e-learning system at higher education institutions. During the COVID-19 epidemic, researchers have focused more on e-learning, as it is the only way to continue academic pursuits, according to the study. The link between external variables and behavioral intention to use e-learning system for educational sustainability learners has been contained by fear of COVID-19 [21]. A few study frameworks, on the other hand, can predict a student’s BI. Thus, the “lack of a framework to predict intention to use and eLearning adoption (EA) to use e-learning among students” led to this study. The study aims to propose a framework for determining BI and e-learning adoption for educational sustainability (EA) among students in higher education and to identify key factors influencing behavioral intention (BI) and e-learning adoption (EA) among students in higher education. Implementing and deploying instructional technology in impoverished countries has proven difficult, and it does not always result in commensurate increases in student learning outcomes. It is necessary to explore and analyze critical success aspects in order to enhance university e-learning usage for education [19,20,21]. Thus, the focus of the research is on the rapid evolution of educational technology and e-learning systems. This study investigated whether such developments can benefit universities in underdeveloped countries like Saudi Arabia. Thus, this article identifies and investigates the elements that impact university students’ use of e-learning for educational sustainability.

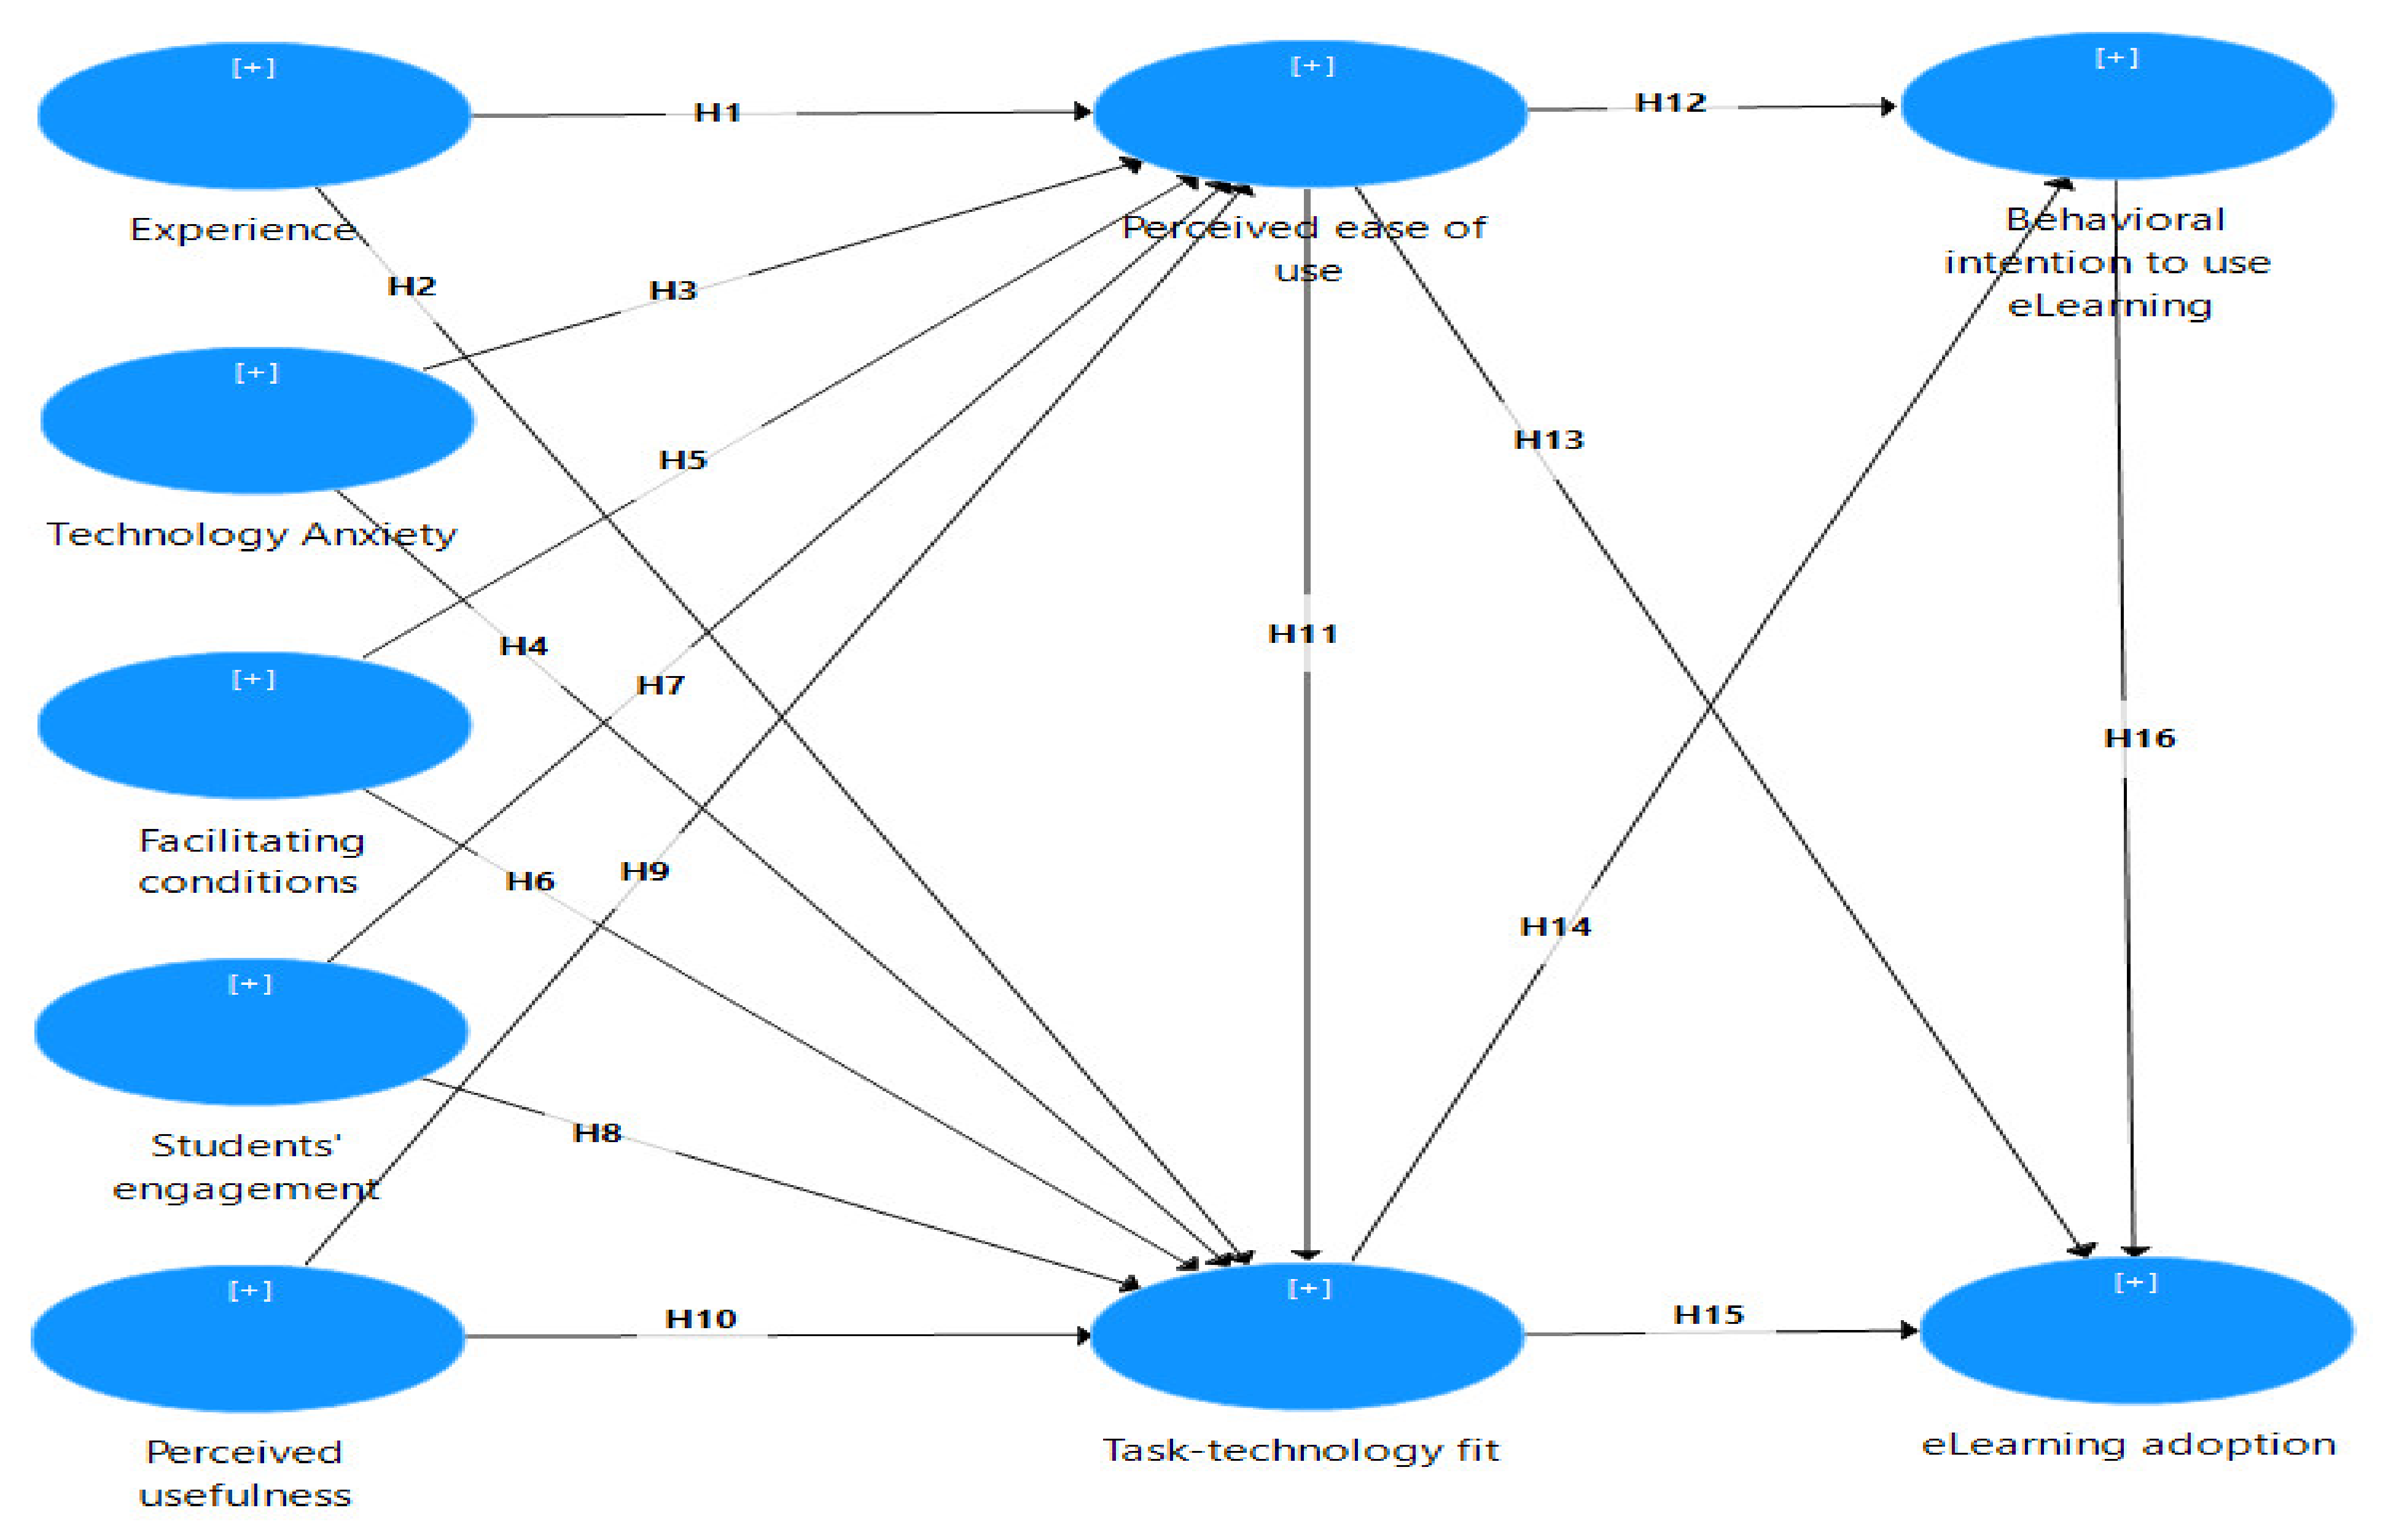
2. Research Model and Hypotheses Development

The TAM model was proposed by Davis [22] to study the association between recent uses of new technology and plans to adopt it. According to the TAM, the individual/organizational knowledge system is made up of three key constructs, which are (PEOU), (PU), and (EN). Furthermore, TTF [23] developed the TTF to emphasise the imperative of a good fit between the actual task and technology in order to achieve individual technological competence. Moreover, the UTAUT model incorporates key elements of previously established theories such as TAM, TRA, TPB, IDT, and others. Individual IS adoption is influenced by four primary variables, according to this model. In understanding intention to use (BI) and actual technology utilization behavior, these aspects are mediated by TTF and PEOU [24]. Thus, the current study evaluated eight aspects that influence TAM and TTF in accordance with the adoption and usage of an E-learning system. The aspects were analyzed as: experience (EXP), technology anxiety (TEA), students’ engagement (SEN), facilitating condition (FC), perceived usefulness (PU), perceived ease of use (PEOU), task-technology fit (TTF), behavioral intention to use (BI), and e-learning adoption for educational sustainability (EA); all are depicted in Figure 1.

2.1. Experience (EXP)

For the TAM model to predict student intention to use e-learning system for educational sustainability, EXP is a very beneficial external variable [25]. According to Abdullah and Ward [26] and Lee et al. [27], individuals with superior skills in using a computer are more likely to have positive feelings while using an online learning tool. Numerous studies on the acceptance of eLearning have demonstrated that EXP has an impact on PEOU and usefulness (PU) (Lee et al., [28]; De Smet et al., [29]). Students’ intentions to adopt a specific type of eLearning system were influenced by their computer expertise [30]. Thus, the authors propose the following two hypotheses:
Hypothesis 1 (H1).
EXP will have a positive and substantial effect on PEOU.
Hypothesis 2 (H2).
EXP will have a positive and substantial effect on TTF.

2.2. Technology Anxiety (TA)

The term “technological anxiety” has been established in earlier studies of computer anxiety [31]. According to Venkatesh et al., computer anxiety is defined in the context of accomplishment of a specific behavior as an emotional response [24,32,33]. Computer anxiety, according to Igbaria et al. [34], is an emotional response to the worry of meeting problems while using a computer. According to Alenezi [35], it is important for the adaptation of e-learning in educational institutions. Baki et al. [36] discovered that in an e-learning environment, computer anxiety has a negative impact on a learner’s PEOU, with 59 per cent of studies validating this [26]. Although Abdullah et al. [25] found no association between technological anxiety and PU, they did find two separate correlations between PEOU and PU. Thus, in this study, two hypotheses about anxiety were proposed:
Hypothesis 3 (H3).
TEA will have a positive and substantial effect on PEOU.
Hypothesis 4 (H4).
TEA will have a positive and substantial effect on TTF.

2.3. Facilitating Conditions (FC)

FC is defined as the level of access to resources to achieve a task [37]. FC is an external control element associated with the concept of resource facilitation [38]. If appropriate tools are accessible, learners can finish their tasks and have positive views regarding e-learning. From the perspective of recognizing and implementing modern-day innovation, FC has been shown as an important predictor [24,39]. According to Engelbrecht [40] and Selim [41], numerous studies have identified a lack of facilitation infrastructure as a major barrier to the implementation of online learning systems. Thus, this study proposes the following hypothesis:
Hypothesis 5 (H5).
FC will have a positive and substantial effect on PEOU.
Hypothesis 6 (H6).
FC will have a positive and substantial effect on TTF.

2.4. Students’ Engagement (SEN)

Learners benefit from the e-learning environment since it increases engagement in their academic courses and helps them perform better [42]. Academic engagement (AE) and integrated classrooms are essential in all learning situations, including face-to-face, online, and mixed classroom instruction [43]. Academic engagement in higher education studies is a strong predictor of academic development [44]. According to Hussain et al. (2018), student engagement in academia is based on a dynamic relationship between students and their institutional surroundings [45], which takes a more inclusive and comprehensive approach to the learner EXP. The study’s student engagement was primarily concerned with student EXPs in both internal and formal learning situations. To improve academic success, technology can be used to connect students, teachers, and course content [46]. In this study, AE is utilized as a mediator to motivate college students to support education by including e-learning in their syllabus. Thus, this study proposes the following hypothesis:
Hypothesis 7 (H7).
SEN will have a positive and substantial effect on PEOU.
Hypothesis 8 (H8).
SEN will have a positive and substantial effect on TTF.

2.5. Perceived Usefulness (PU)

PU and PEOU are referred to as separate concepts in the TAM model, which is currently being used to assess e-learning systems [47]. PEOU, EN, and helpfulness in completing the work quickly were found as variables used to determine PU. Several studies have been conducted [48,49]. According to previous studies, PU had the largest impact on attitude [50,51]. Furthermore, PU has a strong effect on BI when using e-learning [52,53]. Thus, this study proposes the following hypothesis:
Hypothesis 9 (H9).
PU will have a positive and substantial effect on PEOU.
Hypothesis 10 (H10).
PU will have a positive and substantial effect on TTF.

2.6. Perceived Ease of Use (PEOU)

PEOU refers to a learner’s perception of a system’s simplicity or ease of use [22,54]. The term in this analysis refers to the students’ thoughts on how to use this technology to better their learning and performance. Others have noted that this idea is stated in terms of the amount of work necessary to use a certain system [24,54]. According to earlier research [25,55,56], PEOU has a substantial impact on PU. According to earlier studies [57,58], PEOU also affects attitudes toward e-learning. Thus, this study proposes the following hypothesis:
Hypothesis 11 (H11).
PEOU will have a positive and substantial effect on TTF.
Hypothesis 12 (H12).
PEOU will have a positive and substantial effect on intention to use BI.
Hypothesis 13 (H13).
PEOU will have a positive and substantial effect on EA for educational sustainability.

2.7. Task-Technology Fit (TTF)

Individuals’ interactions with information systems are generally linked to their TTF individual adaptation behaviour [23]. TTF is grounded in the requirement for a relationship between the technology attributes and the task requirements [23]. As it is only based on the expectations of students about the technologies, the methodology is too scarce to foresee their adoption. Students are more likely to use technology if they feel it will aid them in meeting their daily objectives [23,59]. The paradigm of this theory clarifies the efficient characteristics of technology use. The model of TTF is envisaged when consumers engage with a technology based on a relationship between performance prospects and technological qualities [23,60], since concentrating only on consumers’ expectations associated with the technology is inadequate. Thus, for this study, the hypotheses are proposed that:
Hypothesis 14 (H14).
TTF will have a positive and substantial effect on BI to use e-learning.
Hypothesis 15 (H15).
TTF will have a positive and substantial effect on EA for educational sustainability.

2.8. Behavioral Intention (BI) to Use E-Learning System for Educational Sustainability

The degree to which a student intends to adopt e-learning platforms in the future is known as behavioral intention (BI) [61]. As mentioned by Ain et al. [62], many researchers have found that BI significantly influences actual system usage. “Intention to use E-learning” was proposed as a variable in this study and was explained as the probability that a person will adopt an e-learning system when it is available to him or her. The BI-to-use of individuals is important in the actual application of new technologies [22]. Students’ behavior predictions to use e-learning systems are predicted by TAM variables, as PU has an important and positive impact on users’ desire to use e-learning again, after the first time [63,64].
Hypothesis 16 (H16).
BI use will have a positive and substantial effect on e-learning adoption for educational sustainability.

3. Research Methodology

The researchers used quantitative survey methods to evaluate the hypotheses and come up with responses to the research objective. To obtain empirical data, self-administered questionnaires were distributed. The questionnaire was comprised of three sections. The first section consisted of a total of 45 items to measure student BI to use e-learning and e-learning adoption for educational sustainability, as well as extracting nine items to assess the acceptability of e-learning. The second section consisted of 45 items to measure student BI in using E-learning and their adoption, as well as extracting nine constructs. Third, the suggested conceptual model of e-learning utilization in educational institutions was experimentally assessed using structural equation modelling, as indicated by Hair et al. [65]. A Likert-scale of five-points (1 as “strongly disagree” to 5 as “strongly agree”) was applied to evaluate the items. Appropriate statistical tests were employed to evaluate the data and suggest significance in the study’s outcomes. A total of 395 students from the students’ university were randomly selected for data collection, including domestic and foreign undergraduate students, Masters and PhD students. The poll focused on respondents’ perceptions of PEOU and TTF’s effect on BI’s willingness to use e-learning and e-learning adoption for educational sustainability. The data was analyzed with SPSS and structural equation modeling (SEM-PLS) was applied.

3.1. Participants

Table 1 represents the respondents’ gender, age, institution, specialization, and social media usage.

3.2. Measurement Instruments and Analysis

The measurement items for the constructs were adopted from the widely used validated measures from previous studies and were modified for this study. Basic demographics such as respondents’ age, gender, and education as well as questionnaire items that measure the variables EXP, TA, FC, SE, PU, PEOU, TTF, BI, and EAB were adapted from the sample questionnaire. TA was adapted from survey items [26,63]; FC was adapted from survey items [62,66], PEOU was adapted from survey items [51,63], TTF was adapted from survey items (Kim et al., 2010; Behavioral intention to use eLearning was adapted from items from a survey [63,67], and e-learning adoption for educational sustainability was adapted from items from a survey [68,69]. For data analysis, PLSSEM techniques were implemented using Smart-PLS3. In addition, Smart-PLS 3.3 software was utilized for assessing measurements and structural models. The data validity and reliability were measured during their computation in the measurement model. The authors reported convergent and discriminant validity for the data validity through average variance extraction (AVE); the values should be 0.500. Discriminant validity was addressed based on the computation processes of Fornell–Larcker criterion, cross loading, and discriminant validity. Meanwhile, to report the reliability of the data, an internal consistency and reliability process was carried out. Cronbach’s alpha coefficient (CA) and composite reliability (CR) were two approaches for determining reliability; both values should be greater than 0.700. For the as assessment model, we reported the significance of the relationship through the path coefficient, t-value, and p value.

4. Results

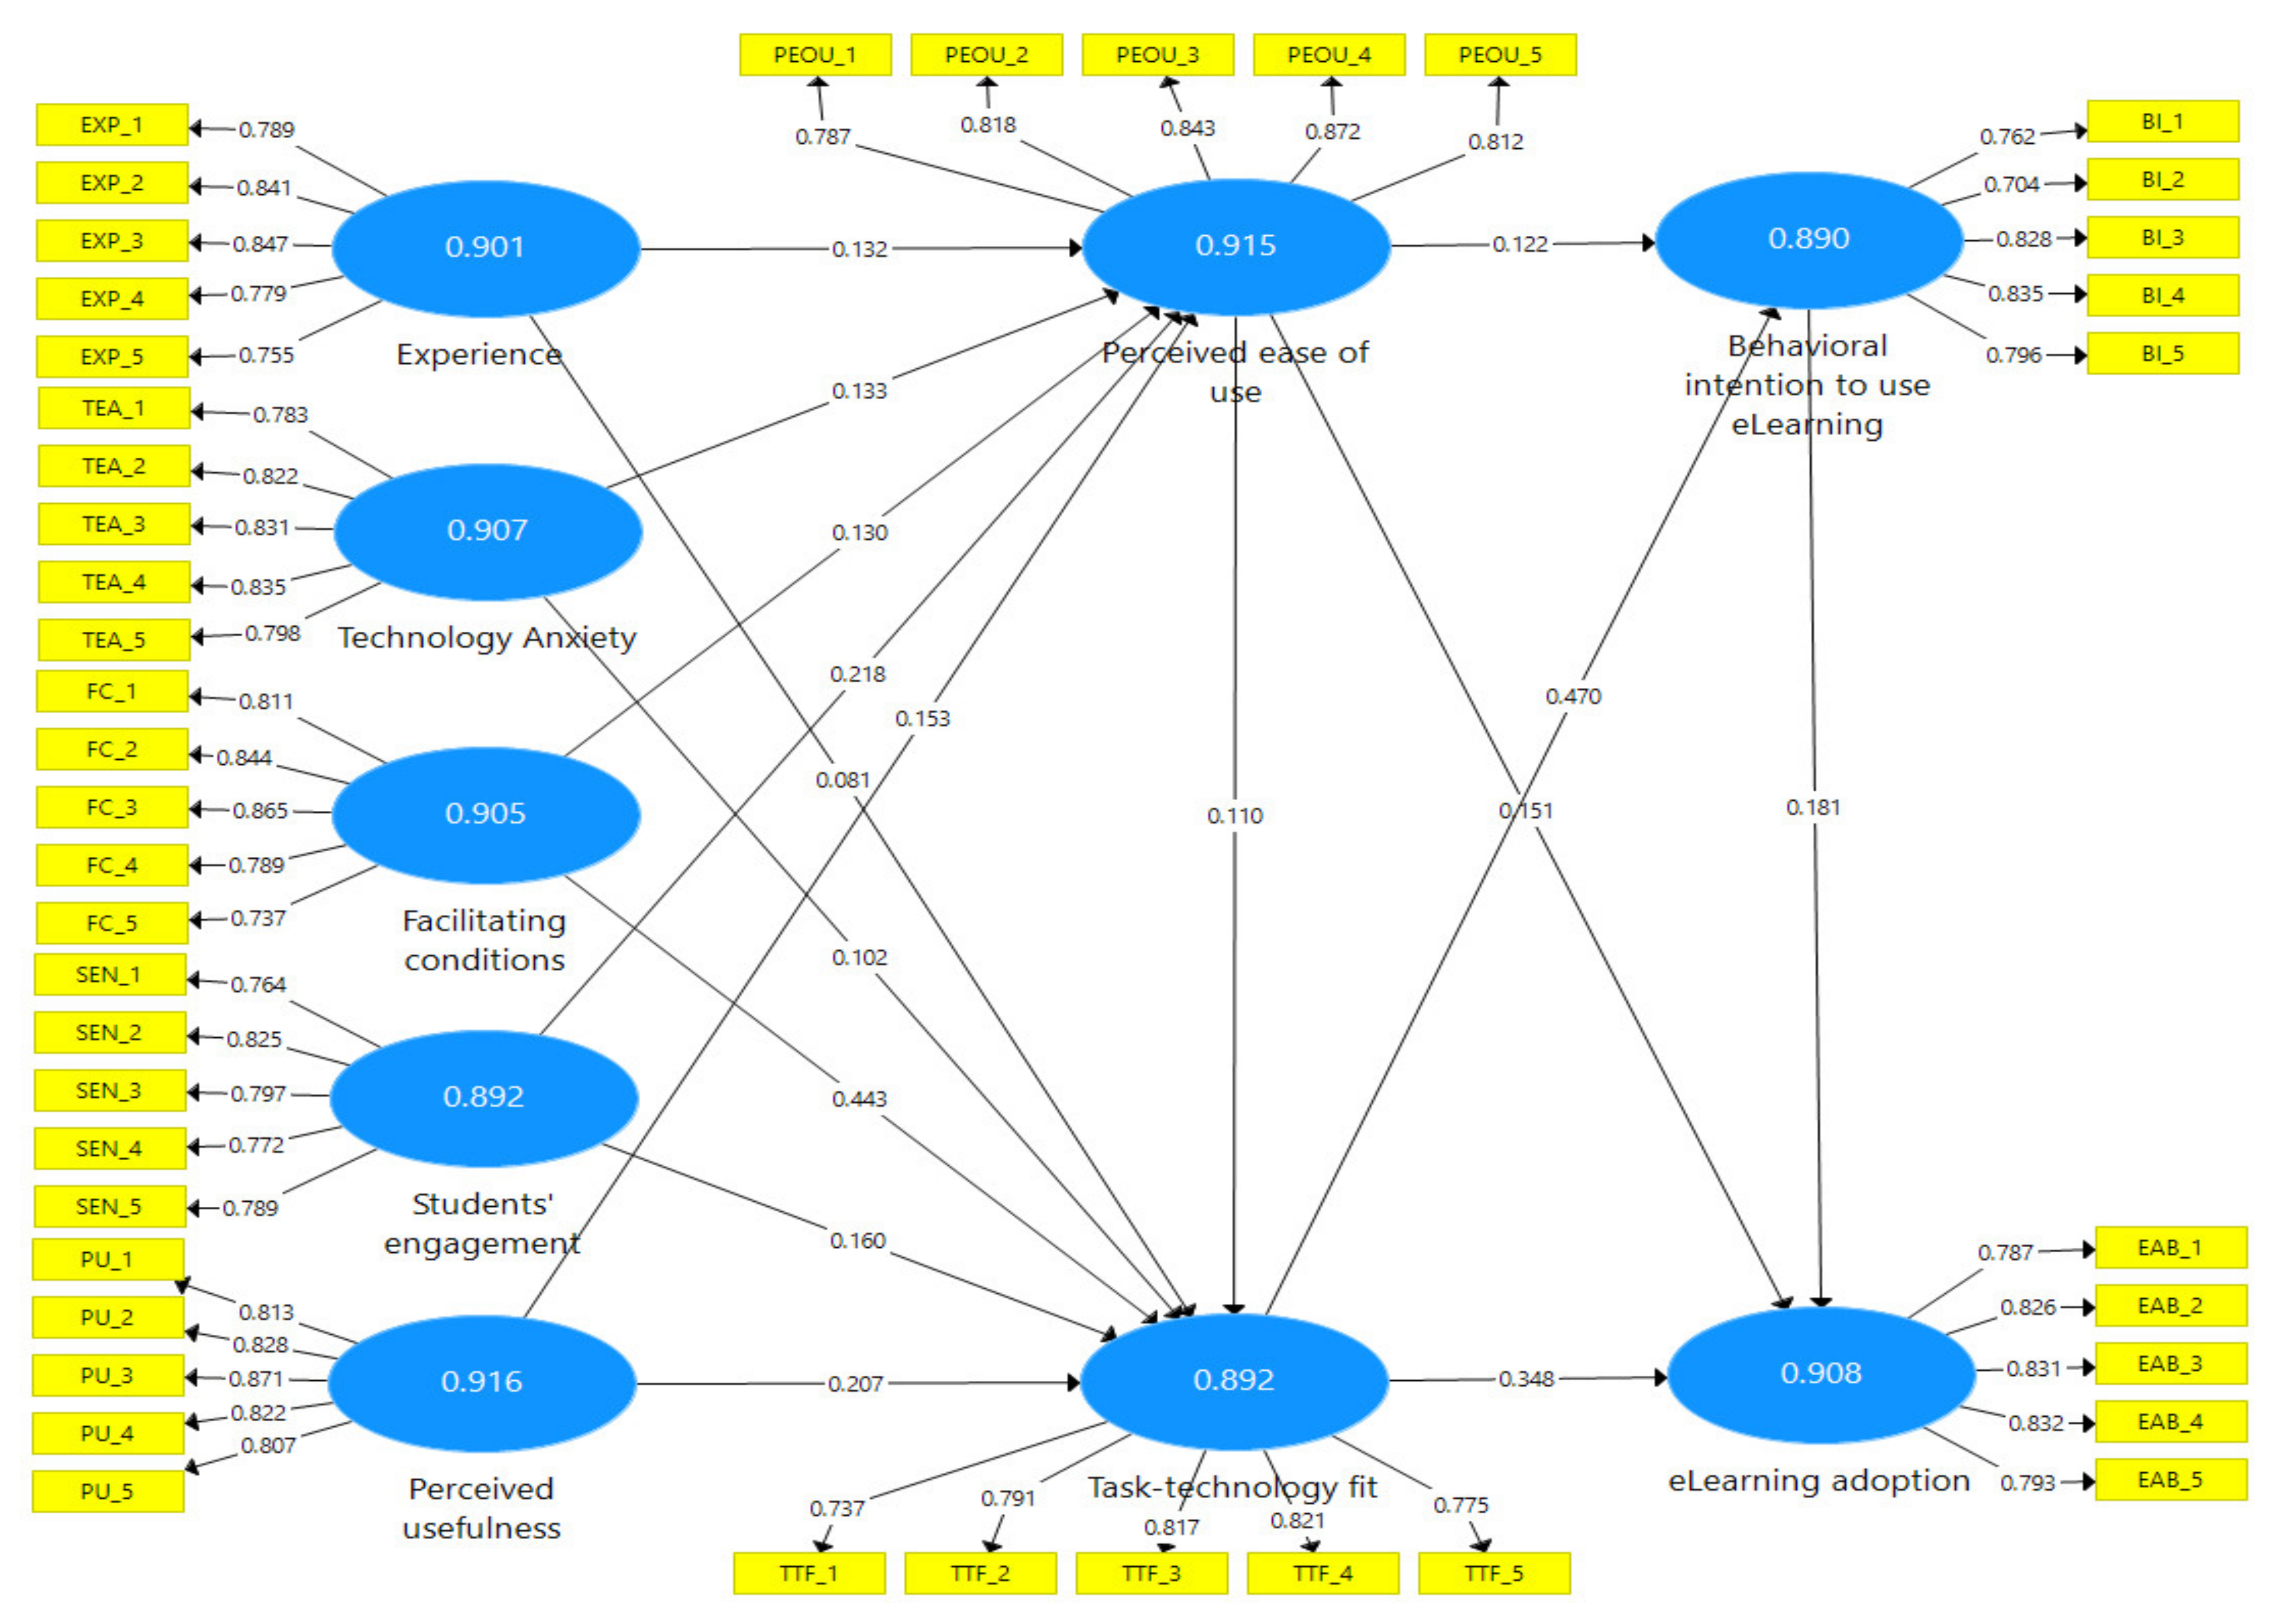
4.1. Measurement Model

Hair et al. [65] encouraged four assessments of measurement models for PLS-SEM that included assessment of indicators’ loadings, convergent validity, reliability of internal consistency, and discriminant validity.

4.2. Reflective Indicator Loadings

Reflective indicators’ loadings achieved in SEM should be greater than 0.700 (Hair et al. [65]. From the computation, all loadings were higher than 0.700. The highest loading was achieved by PEOU, PEOU_4 (0.872), while the lowest loading referred to behavioral intention to use eLearning, BI_2 (0.704). Forty-five indicators were included for the next data analysis process (Table 2).

4.3. Internal Consistency Reliability (ICR)

ICR was implemented to evaluate the consistency of results across indicators. In the current approach, Cronbach’s alpha coefficient (CA) and composite reliability (CR) values were reported. The values for ICR should be from 0 to 1. Cronbach’s alpha coefficient (CA) and composite reliability (CR) values ought to be greater than 0.7 [65]. Table 2 presents the results of the Cronbach’s alpha coefficient (CA) and composite reliability (CR). The Cronbach’s alpha coefficient (CA) and composite reliability (CR) values for all the constructs are sufficient, exceeding the recommended amount: a CR of 0.907 for TEA, while the EXP factor had a CA of 0.862 and a CR of 0.901.

4.4. Convergent Validity

Convergent validity is described as a topic that is related to the validity of the construct; tests with the same or similar construct should be greatly correlated (Hair et al. [65]. In this study, the convergent validity was assessed and reported through the average variance extracted (AVE). Smart-PLS3 was used to calculate the AVE (Hair et al. [65]). Through the algorithm, AVE values should be a value of 0.500 or greater, explaining 50% or higher of the variance (Table 2). From the computation, all constructs obtained indicate AVE values of higher than 0.500 or explained more than 50% of the variance. Behavioral intention to use eLearning’s AVE value was 0.619; e-learning adoption for educational sustainability’s AVE was 0.663, (See Table 2).

4.5. Discriminant Validity

Discriminant validity refers to the degree to which one concept differs statistically from another. The Fornell–Larcker criteria, cross loadings, and discriminant validity were all utilized in this study to determine discriminant validity. A construct’s shared variance should be less than its counterparts’ AVE, according to [70]. Table 3 illustrates that the values of each construct’s shared variances are smaller than the construct itself. For example, the value of the FC factor (0.811) is greater than all of its shared variances: the EXP factor (0.334) and the BI to use e-learning (0.423). Based on the Fornell-Larcker criterion, the discriminative validity is proven. In addition, if the index load is greater than its cross load, discriminative validity will emerge [65]. Table 4 performs all the indicators’ loadings and their cross loadings. The outer loadings for every structure were greater than the other structures’ loadings. For example, the indicator PEOU_4 within the construct of PEOU obtained the highest loading of 0.872, when being compared to its other constructs’ loadings (e.g., FC = 0.344, EXP = 0.287, e-learning adoption for educational sustainability = 0.357, behavioral intention to use e-learning = 0.284, PU = 0.320, SEN = 0.370, TEA = 0.359, and TTF fit = 0.429). All crossloading computations are reported in detail in Table 4. Discriminant validity will also be achieved when is greater than 0.900. A discriminant validity above 0.900 refers to a lack of discriminant validity [65]. As performed in Table 5, all discriminant validity are below 0.900, significantly different from 1; therefore, discriminant validity evaluation supports the discriminant validity. The lowest discriminant validity value emerges on the path between FC and EXP (0.388), while the highest discriminant validity value exists between TTF fit and FC (0.803). The other discriminant validity values that resulted from the computation are eLearning adoption and SEN (0.500). More detailed elaboration on the discriminant validity values is presented in Table 5.

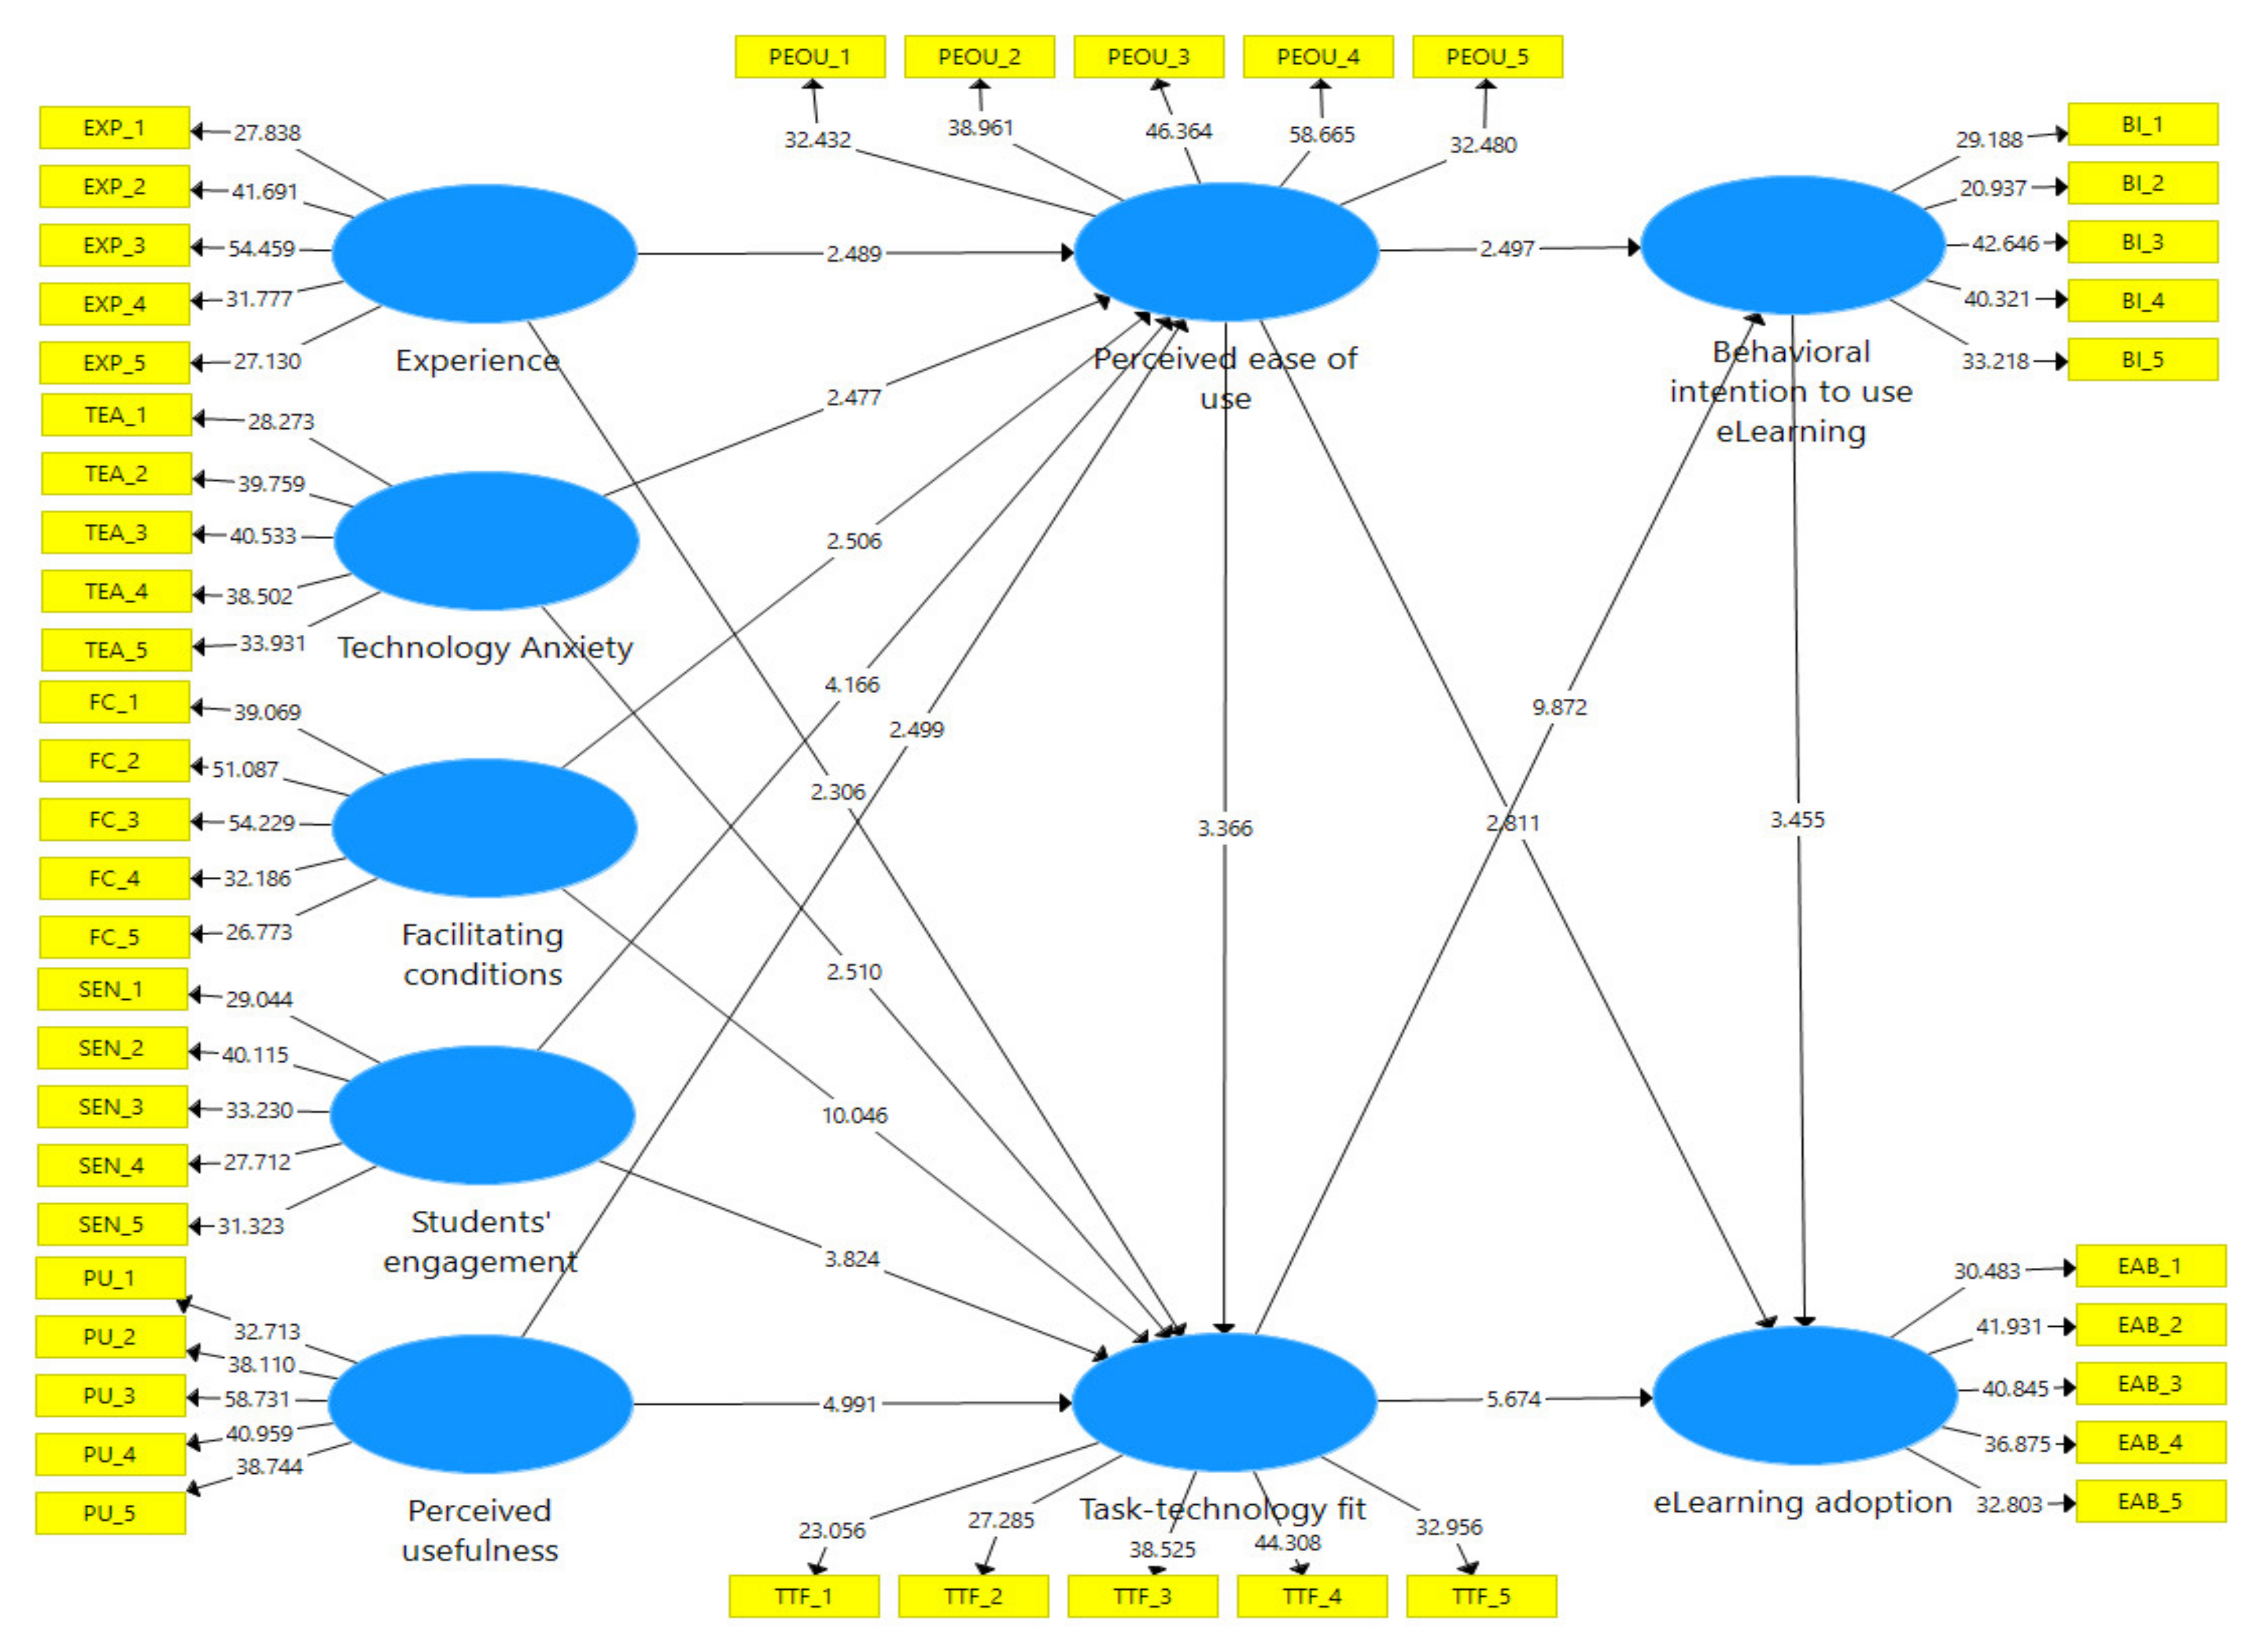
4.6. Structural Model and Collinearity

Examining the model’s predictive powers is part of the structural model’s calculation. However, before reporting the structural model, the collinearity value should be noted by reporting the variance inflation factor (VIF) values. Notably, the collinearity of the predictor sets was examined (Hair et al. [65]), PEOU as a predictor of BI to use eLearning, TTF, and eLearning adoption. In EXP processes, FC, PU, SE, and TA are the predictors of PEOU and TTF (Table 6). VIF values should be lower than three; values exceeding three are often regarded as having multicollinearity problems. From the results of the data analysis, all VIFs are lower than three. For instance, BI using e-learning as a predictor of the PEOU and TTF obtained a VIF value of 1.357; see Table 6. FC is a predictor of PEOU (1.473) and TTF (1.498).
Moreover, Figure 2, Figure 3 and Table 7 presents the path coefficient and loading value of the path lines within the PLS algorithm procedure. The highest t-value was obtained by the path between FC → TTF (t = 10.466), while the lowest value was the relationship between EXP→ TTF (t = 2.237). All hypotheses proposed in this research were supported. In detail, as proposed for the relationships between EXP → PEOU (H1, H2), (β = 0.502, t = 1.659, p < 0.001), and TTF (β= 0.081; t = 2.237, p < 0.001), the hypotheses are accepted. For the relationship between TA → PEOU (H3) (β = 0.133; t = 2.444, p < 0.001), the hypothesis is supported. H4 is also supported where TA is significantly predicted by TTF (β = 0.102; t = 2.505; p < 0.001). Moreover, the significant role of FC → PEOU (H5) is also reported (β = 0.130; t = 2.279; p < 0.001) and the hypothesis is accepted. In the same way, the results for FC and TTF (H6) (β = 0.443, t = 10.466; p < 0.001) indicate support. For the relationship between SE → PEOU and TTF (H7, H8), (β = 0.218 t = 3.861, p < 0.001) and (β = 0.160, t = 3.886, p < 0.001) are accepted. For the hypotheses H9 and H10, the direct effect of PU on PEOU and TTF (β = 0.153, t = 2.535; p < 0.001) and (β = 0.207, t = 4.937; p < 0.001), the hypotheses are accepted. Furthermore, results for PEOU to TTF and intention to use e-learning (H11, H12), (β = 0.110, t = 3.228, p < 0.001) and (β = 0.122, t = 2.503, p < 0.001) indicate support for the hypotheses. Similarly, the result for PEOU on EA for educational sustainability (H13) is also reported (β = 0.151, t = 2.503, p < 0.001), and the hypothesis is supported. Moreover, the findings also support hypotheses H14 and H15; positive relationships also emerged between TTF on BI to use e-learning and e-learning adoption for educational sustainability: (β = 0.470; t = 9.501; p < 0.001) and (β = 0.348; t = 5.589; p < 0.001). The hypotheses are supported. Finally, BI to use e-learning is also informed to be a significant predictor for EA for educational sustainability (β = 0.181, t = 3.368; p < 0.001); the hypothesis is supported.

5. Discussion and Implications

This is one of the first studies to utilize the TAM model to investigate e-learning use for educational sustainability in Saudi Arabia. Experience, facilitating conditions, students’ engagement, technology anxiety, and perceived usefulness all have a substantial influence on task-technology fit, and perceived ease of use (see Figure 2). Behavioral intention to use e-learning and e-learning adoption for educational sustainability were impacted for task-technology fit and perceived ease of use. Thus, the findings supported the hypotheses that had been stated and the study methodology constructed. According to the findings, PEU affected TTF, with both behavioral intention to use e-learning and e-learning adoption for educational sustainability. To put it another way, e-learning adoption for educational sustainability must demonstrate ease of use and usefulness to university students. E-learning adoption should be easy to use and provide detailed instructions.
The findings also demonstrated how important it is for professors to describe how students should use e-learning adoption to study course content, because students’ behavioral intention to use e-learning has an influence on their e-learning adoption for educational sustainability. The adoption practice of e-learning during COVID-19 as regarded by students in higher education from students’ university was effectively explained using a form of extended TAM with TTF incorporated in this study, to investigate determinants predicting the use of an e-learning system for educational sustainability. In the research model, SE, EXP, TA, FC, PU, PEOU, BI to use e-Learning, and e-learning adoption for educational sustainability are all determinant TAM elements with TTF. Thus, when employing e-learning systems as an educational tool, the study model finds TAM variables and TTF have the biggest impact on intention to use e-learning and e-learning adoption for educational sustainability. Thus, the findings significantly endorse the EXP factor, verifying hypotheses H1 and H2, implying that EXP has a beneficial effect on e-learning use in education as PEOU and TTF. In other words, the e-learning system is useful and suitable, and the highly EXPd factor contributes to increased use of TTF in education and ease of use (PEOU). Many academics have studied the benefits of e-learning and significant EXP with it. Thus, the findings of this study corroborate prior findings [26,71,72].
Furthermore, the study’s findings substantially support the TA component, verifying hypotheses H3 and H4, implying that TA influences PEOU and TTF positively. However, a higher TA factor helps with an increased usage of PEOU and, thus, TTF, in educational institutions where e-learning is desirable and suitable. The importance of e-learning in the field of TA has been studied by several researchers. Thus, the findings of this study support previous findings of varying relationships [26,73]. Both (H5 and H6) were favorably connected to the FC, with PEOU and TTF having stronger impacts. When an e-learning system has a positive impact on FC and is adopted, the PEOU and TTF increase proportionally to the FC. A number of researchers have investigated the importance of FC in the e-learning field. Thus, this study’s findings corroborate prior findings [73,74].
Furthermore, the findings clearly support the student engagement component, validating hypotheses (H7 and H8) and demonstrating that student participation in educational institutions has a beneficial impact on TTF and PEOU. Hypotheses seven and eight, on the other hand, demonstrate that TTF and PEOU have a relationship in terms of using the e-learning system. The theory is validated by the findings, which reveal a positive and significant relationship. Thus, the findings of this study back up previous findings of varying relationships [75,76,77]. The study’s findings significantly support the TAM variables PU and PEOU, confirming hypotheses H9, H10, H12, and H13. PEOU has a positive effect on TTF, and PEOU has a positive effect on TTF, BI e-learning, and e-learning adoption for educational sustainability. In other words, higher PU contributes to increased use of PEOU, TTF, and BI to use e-learning and e-learning adoption for educational sustainability in educational institutions, when an e-learning system is advantageous and suitable.
Many scholars have investigated the significance of PU and PEOU in the e-learning background. Thus, the findings of this study corroborate previous research on the relationship between these factors [78,79].
Furthermore, the findings substantially support the TTF variable, confirming hypotheses (H14, H15), implying that TTF has a favorable influence on BI’s adoption of e-learning and e-learning adoption for educational sustainability in educational institutions. Hypothesis (H14, H15) demonstrates that there is a relationship between TTF and BI, to use e-learning as well as e-learning systems. The findings revealed a positive and significant correlation, indicating that the hypotheses were correct.
Finally, the findings of the study significantly support the BI’s decision to use the e-learning component, confirming hypothesis sixteen (H16), which states that the BI’s decision to use e-learning has a favorable impact on e-learning adoption for educational sustainability in higher education. The outcomes of the study significantly support the BI’s decision to use the e-learning component, confirming hypothesis sixteen (H16), which states that the BI’s decision to use e-learning has a favorable effect on e-learning adoption for educational sustainability in higher education. This is consistent with previous studies by [80,81], who found that both perceived ease of use and perceived usefulness affect students’ students’ behavioral intention to use e-learning have an influence on their e-learning adoption for educational sustainability. Therefore, in the following methods, this study varies from previous re-search. The first implication concerns the value of agreed-upon structures. In the PEOU and TTF, the favorable relationship between SE, EXP, TA, FC, and PU is especially essential. Second, colleges may demonstrate how to utilize technology by giving instructional tools to assist students in understanding how to use it, given that e-learning should be perceived as straightforward and useful. Third, students should be informed about the multiple advantages of using technology, such as supplying course materials or achieving other long-term learning objectives, which will improve behavioral intent to use e-learning and adoption for educational sustainability.
Although this study demonstrates statistical evidence, it does have certain limitations. Future research will need to include more people from a variety of backgrounds, as the respondents in this study came from only one public university. A qualitative method to e-learning research, such as interviews or focus groups, is another possibility for future study. It is also a good idea to perform research using comparative approaches.

6. Conclusions and Future Work

This research developed a new model on behavioral intention to use e-learning to influence te-learning adoption for educational sustainability in Saudi Arabia higher education. The TAM model was verified in terms of educational sustainability. Also, the theoretical and practical implications of the research were examined. SEN, EXP, TA, FC, and PU are all major variables impacting the PEOU and TTF, according to the data. Furthermore, the use of an e-learning system by BI for educational sustainability has been found to influence e-learning adoption for educational sustainability. The study’s findings may encourage e-learning system makers to better understand the factors that influence users’ willingness to utilize and adoption of e-learning. Furthermore, this research can assist students in developing their BI in order to use e-learning effectively.
E-learning is being employed in countries all around the world, according to several studies. Many scholars, however, have reviewed the use of e-learning during pandemics like COVID-19. In this study, TTF and TAM were validated in an educational setting, offering additional insight into students’ future perceptions of e-learning as a learning resource. The hypotheses of the suggested model of employing e-learning to study at educational institutions were tested in this study. The study observed that combining TTF and TAM enhances e-learning acceptability in instructional instructions, as well as the role of TTF. Thus, this research contributes to the academic literature by clarifying the situation of distance learning during university closures due to pandemics, as well as providing useful data for future research; making the most of educational institutions’ e-learning expenditures is crucial. During epidemics like COVID-19, many contexts and settings should be investigated for characteristics impacting the use of e-learning.

Funding

This research received no external funding.

Institutional Review Board Statement

Not applicable.

Informed Consent Statement

Not applicable.

Data Availability Statement

Not applicable.

Conflicts of Interest

The author declares no conflict of interest.

References

  1. Palvia, S.; Aeron, P.; Gupta, P.; Mahapatra, D.; Parida, R.; Rosner, R.; Sindhi, S. Online Education: Worldwide Status, Challenges, Trends, and Implications. J. Glob. Inf. Technol. Manag. 2018, 21, 233–241. [Google Scholar] [CrossRef] [Green Version]
  2. Uğur, N.G.; Turan, A.H. E-Learning adoption of academicians: A proposal for an extended model. Behav. Inf. Technol. 2018, 37, 393–405. [Google Scholar] [CrossRef]
  3. Villesseche, J.; Le Bohec, O.; Quaireau, C.; Nogues, J.; Besnard, A.L.; Oriez, S.; De La Haye, F.; Noel, Y.; Lavandier, K. Enhancing reading skills through adaptive e-learning. Interact. Technol. Smart Educ. 2019, 16, 2–17. [Google Scholar] [CrossRef]
  4. Zhang, J.H.; Zou, L.C.; Miao, J.J.; Zhang, Y.X.; Hwang, G.J.; Zhu, Y. An individualized intervention approach to improving university students’ learning performance and interactive behaviors in a blended learning environment. Interact. Learn. Environ. 2020, 28, 231–245. [Google Scholar] [CrossRef]
  5. Agrawal, V.; Agrawal, A.; Agarwal, S. Assessment of factors for e-learning: An empirical investigation. Ind. Commer. Train. 2016, 48, 409–415. [Google Scholar] [CrossRef]
  6. Purbojo, R. Role of the university lecturer in an online learning environment: An analysis of Moodle features utilized in a blended learning strategy. In Educational Technology to Improve Quality and Access on a Global Scale; Springer International Publishing: Cham, Switzerland, 2018; pp. 227–244. [Google Scholar]
  7. Ali, S.; Uppal, M.A.; Gulliver, S.R. A conceptual framework highlighting e-learning implementation barriers. Inf. Technol. People 2018, 31, 156–180. [Google Scholar] [CrossRef]
  8. Fischer, H.; Heise, L.; Heinz, M.; Moebius, K.; Koehler, T. How to identify e-learning trends in academic teaching: Methodological approaches and the analysis of scientific discourses. Interact. Technol. Smart Educ. 2015, 12, 31–43. [Google Scholar] [CrossRef]
  9. Wang, X.Y.; Li, G.; Malik, S.; Anwar, A. Impact of COVID-19 on achieving the goal of sustainable development: E-Learning and educational productivity. Econ. Res.-Ekon. Istraz. 2021, 1–17. [Google Scholar] [CrossRef]
  10. Al-Rahmi, A.M.; Shamsuddin, A.; Alturki, U.; Aldraiweesh, A.; Yusof, F.M.; Al-Rahmi, W.M.; Aljeraiwi, A.A. The influence of information system success and technology acceptance model on social media factors in education. Sustainability 2021, 13, 7770. [Google Scholar] [CrossRef]
  11. Choi, P.M.S.; Lam, S.S. A hierarchical model for developing e-textbook to transform teaching and learning. Interact. Technol. Smart Educ. 2018, 15, 92–103. [Google Scholar] [CrossRef]
  12. Samsudeen, S.N.; Mohamed, R. University students’ intention to use e-learning systems: A study of higher educational institutions in Sri Lanka. Interact. Technol. Smart Educ. 2019, 16, 219–238. [Google Scholar] [CrossRef]
  13. Rausch, W.A.; Levi, P. Asynchronous and synchronous cooperation. In Distributed Autonomous Robotic Systems 2; Springer: Tokyo, Japan, 1996; pp. 245–256. [Google Scholar]
  14. Al-Rahmi, A.M. Constructivism Theory: The Factors Affecting Students’ Academic Performance in Higher Education. Preprints 2020, 2020120072. [Google Scholar] [CrossRef]
  15. Alamri, M.M.; Al-Rahmi, W.M.; Yahaya, N.; Al-Rahmi, A.M.; Abualrejal, H.; Zeki, A.M.; Al-Maatouk, Q. Towards adaptive e-learning among university students: By applying technology acceptance model (TAM). Int. J. Eng. Adv. Technol. 2019, 8, 270–276. [Google Scholar] [CrossRef]
  16. Gamage, D.; Fernando, S. Engaging Interactivity in eLearning: Review of Practices and Challenges in Sri Lanka; University of Moratuwa: Moratuwa, Sri Lanka, 2012. [Google Scholar]
  17. Kim, H.J.; Lee, J.M.; Rha, J.Y. Understanding the role of user resistance on mobile learning usage among university students. Comput. Educ. 2017, 113, 108–118. [Google Scholar] [CrossRef]
  18. Hamidi, H.; Chavoshi, A. Analysis of the essential factors for the adoption of mobile learning in higher education: A case study of students of the University of Technology. Telemat. Inform. 2018, 35, 1053–1070. [Google Scholar] [CrossRef]
  19. Nikou, S.A.; Economides, A.A. Mobile-based assessment: Investigating the factors that influence behavioral intention to use. Comput. Educ. 2017, 109, 56–73. [Google Scholar] [CrossRef]
  20. Briz-Ponce, L.; Pereira, A.; Carvalho, L.; Juanes-Méndez, J.A.; García-Peñalvo, F.J. Learning with mobile technologies—Students’ behavior. Comput. Hum. Behav. 2017, 72, 612–620. [Google Scholar] [CrossRef]
  21. Qiao, P.; Zhu, X.; Guo, Y.; Sun, Y.; Qin, C. The Development and Adoption of Online Learning in Pre- and Post-COVID-19: Combination of Technological System Evolution Theory and Unified Theory of Acceptance and Use of Technology. J. Risk Financ. Manag. 2021, 14, 162. [Google Scholar] [CrossRef]
  22. Davis, F.D. Perceived usefulness, perceived ease of use, and user acceptance of information technology. MIS Q. 1989, 13, 319–340. [Google Scholar] [CrossRef] [Green Version]
  23. Goodhue, D.L.; Thompson, R.L. Task-Technology fit and individual performance. MIS Q. 1995, 19, 213–233. [Google Scholar] [CrossRef]
  24. Venkatesh, V.; Morris, M.G.; Davis, G.B.; Davis, F.D. User acceptance of information technology: Toward a unified view. MIS Q. 2003, 27, 425–478. [Google Scholar] [CrossRef] [Green Version]
  25. Abdullah, F.; Ward, R.; Ahmed, E. Investigating the influence of the most commonly used external variables of TAM on students’ Perceived Ease of Use (PEOU) and Perceived Usefulness (PU) of e-portfolios. Comput. Hum. Behav. 2016, 63, 75–90. [Google Scholar] [CrossRef]
  26. Abdullah, F.; Ward, R. Developing a General Extended Technology Acceptance Model for E-Learning (GETAMEL) by analysing commonly used external factors. Comput. Hum. Behav. 2016, 56, 238–256. [Google Scholar] [CrossRef]
  27. Lee, Y.H.; Hsieh, Y.C.; Chen, Y.H. An investigation of employees’ use of e-learning systems: Applying the technology acceptance model. Behav. Inf. Technol. 2013, 32, 173–189. [Google Scholar] [CrossRef]
  28. Lee, Y.H.; Hsieh, Y.C.; Ma, C.Y. A model of organizational employees’ e-learning systems acceptance. Knowl.-Based Syst. 2011, 24, 355–366. [Google Scholar] [CrossRef]
  29. De Smet, C.; Bourgonjon, J.; De Wever, B.; Schellens, T.; Valcke, M. Researching instructional use and the technology acceptation of learning management systems by secondary school teachers. Comput. Educ. 2012, 58, 688–696. [Google Scholar] [CrossRef]
  30. Williams, M.; Williams, J. Evaluating a model of business school students’ acceptance of web-based course management systems. Int. J. Manag. Educ. 2010, 8, 59–70. [Google Scholar] [CrossRef]
  31. Heinssen, R.K.; Glass, C.R.; Knight, L.A. Assessing computer anxiety: Development and validation of the Computer Anxiety Rating Scale. Comput. Hum. Behav. 1987, 3, 49–59. [Google Scholar] [CrossRef]
  32. Keikhosrokiani, P.; Mustaffa, N.; Zakaria, N.; Abdullah, R. Assessment of a medical information system: The mediating role of use and user satisfaction on the success of human interaction with the mobile healthcare system (iHeart). Cogn. Technol. Work 2020, 22, 281–305. [Google Scholar] [CrossRef]
  33. Keikhosrokiani, P. The role of m-commerce literacy on the attitude towards using e-torch in Penang, Malaysia. In E-Business in the 21st Century: Essential Topics and Studies, 2nd ed.; World Scientific Publishing Co.: Singapore, 2021; pp. 309–333. ISBN 9789811231841. [Google Scholar]
  34. Igbaria, M.; Parasuraman, S. A Path Analytic Study of Individual Characteristics, Computer Anxiety and Attitudes toward Microcomputers. J. Manag. 1989, 15, 373–388. [Google Scholar] [CrossRef]
  35. Alenezi, A.R. E-Learning acceptance: Technological key factors for successful students’ engagement in e-learning system. In Proceedings of the 2012 International Conference on e-Learning, e-Business, Enterprise Information Systems and e-Government, Las Vegas, Nevada, USA, 16–19 July 2012. [Google Scholar]
  36. Baki, R.; Birgoren, B.; Aktepe, A. A meta analysis of factors affecting perceived usefulness and perceived ease of use in the adoption of E-Learning systems. Turk. Online J. Distance Educ. 2018, 19, 4–42. [Google Scholar] [CrossRef]
  37. Tarhini, A.; Masa’deh, R.; Al-Busaidi, K.A.; Mohammed, A.B.; Maqableh, M. Factors influencing students’ adoption of e-learning: A structural equation modeling approach. J. Int. Educ. Bus. 2017, 10, 164–182. [Google Scholar] [CrossRef]
  38. Taylor, S.; Todd, P.A. Understanding information technology usage: A test of competing models. Inf. Syst. Res. 1995, 6, 144–176. [Google Scholar] [CrossRef]
  39. Baptista, G.; Oliveira, T. Understanding mobile banking: The unified theory of acceptance and use of technology combined with cultural moderators. Comput. Hum. Behav. 2015, 50, 418–430. [Google Scholar] [CrossRef]
  40. Engelbrecht, E. Adapting to changing expectations: Post-graduate students’ experience of an e-learning tax program. Comput. Educ. 2005, 45, 217–229. [Google Scholar] [CrossRef]
  41. Selim, H.M. Critical success factors for e-learning acceptance: Confirmatory factor models. Comput. Educ. 2007, 49, 396–413. [Google Scholar] [CrossRef]
  42. Islam, A.K.M.N. E-Learning system use and its outcomes: Moderating role of perceived compatibility. Telemat. Inform. 2016, 33, 48–55. [Google Scholar] [CrossRef]
  43. Henrie, C.R.; Halverson, L.R.; Graham, C.R. Measuring student engagement in technology-mediated learning: A review. Comput. Educ. 2015, 90, 36–53. [Google Scholar] [CrossRef]
  44. Carini, R.M.; Kuh, G.D.; Klein, S.P. Student engagement and student learning: Testing the linkages. Res. High. Educ. 2006, 47, 1–32. [Google Scholar] [CrossRef]
  45. Hussain, M.; Zhu, W.; Zhang, W.; Abidi, S.M.R. Student Engagement Predictions in an e-Learning System and Their Impact on Student Course Assessment Scores. Comput. Intell. Neurosci. 2018, 2018, 6347186. [Google Scholar] [CrossRef] [Green Version]
  46. Mehdinezhad, V. First Year Students’ Engagement at the University Introduction and Theoretical Framework. Int. Online J. Educ. Sci. 2011, 3, 47–66. [Google Scholar]
  47. Davis, F.D.; Venkatesh, V. A critical assessment of potential measurement biases in the technology acceptance model: Three experiments. Int. J. Hum. Comput. Stud. 1996, 45, 19–45. [Google Scholar] [CrossRef] [Green Version]
  48. Alenazy, W.M.; Mugahed Al-Rahmi, W.; Khan, M.S. Validation of TAM Model on Social Media Use for Collaborative Learning to Enhance Collaborative Authoring. IEEE Access 2019, 7, 71550–71562. [Google Scholar] [CrossRef]
  49. Al-Rahmi, A.M.; Shamsuddin, A.; Alismaiel, O.A. Task-Technology Fit Model: The Factors Affecting Students’ Academic Performance in Higher Education. Univers. J. Educ. Res. 2020, 8, 6831–6843. [Google Scholar] [CrossRef]
  50. Martinho, D.; Santos, E.; Miguel, M.I.; Cordeiro, D. Factors that influence the adoption of postgraduate online courses. Int. J. Emerg. Technol. Learn. 2018, 13, 123–141. [Google Scholar] [CrossRef] [Green Version]
  51. Mailizar, M.; Burg, D.; Maulina, S. Examining university students’ behavioural intention to use e-learning during the COVID-19 pandemic: An extended TAM model. Educ. Inf. Technol. 2021, 26, 7057–7077. [Google Scholar] [CrossRef] [PubMed]
  52. Weerathunga, P.R.; Samarathunga, W.H.M.S.; Rathnayake, H.N.; Agampodi, S.B.; Nurunnabi, M.; Madhunimasha, M.M.S.C. The COVID-19 Pandemic and the Acceptance of E-Learning among University Students: The Role of Precipitating Events. Educ. Sci. 2021, 11, 436. [Google Scholar] [CrossRef]
  53. Al-Rahmi, A.M.; Al-Rahmi, W.M.; Alturki, U.; Aldraiweesh, A.; Almutairy, S.; Al-Adwan, A.S. Exploring the Factors Affecting Mobile Learning for Sustainability in Higher Education. Sustainability 2021, 13, 7893. [Google Scholar] [CrossRef]
  54. Rogers, E.M. Diffusion of preventive innovations. Addict. Behav. 2002, 27, 989–993. [Google Scholar] [CrossRef]
  55. Binyamin, S.S.; Rutter, M.J.; Smith, S. Extending the technology acceptance model to understand students’ use of learning management systems in Saudi higher education. Int. J. Emerg. Technol. Learn. 2019, 14, 4–21. [Google Scholar] [CrossRef]
  56. Al-Rahmi, W.M.; Yahaya, N.; Alamri, M.M.; Alyoussef, I.Y.; Al-Rahmi, A.M.; Kamin, Y. Bin Integrating innovation diffusion theory with technology acceptance model: Supporting students’ attitude towards using a massive open online courses (MOOCs) systems. Interact. Learn. Environ. 2019, 1–13. [Google Scholar] [CrossRef]
  57. Fokides, E. Greek Pre-service Teachers’ Intentions to Use Computers as In-service Teachers. Contemp. Educ. Technol. 2020, 8, 56–75. [Google Scholar] [CrossRef]
  58. Zogheib, B.; Rabaa’i, A.; Zogheib, S.; Elsaheli, A. University student perceptions of technology use in mathematics learning. J. Inf. Technol. Educ. Res. 2015, 14, 417–438. [Google Scholar] [CrossRef] [Green Version]
  59. Goodhue, D.L. Understanding User Evaluations of Information Systems. Manag. Sci. 1995, 41, 1827–1844. [Google Scholar] [CrossRef]
  60. Alyoussef, I.Y. E-Learning acceptance: The role of task–technology fit as sustainability in higher education. Sustainability 2021, 13, 6450. [Google Scholar] [CrossRef]
  61. Wrzosek, N.; Zimmermann, A.; Balwicki, Ł. Doctors’ perceptions of e-prescribing upon its mandatory adoption in poland, using the unified theory of acceptance and use of technology method. Healthcare 2020, 8, 563. [Google Scholar] [CrossRef] [PubMed]
  62. Ain, N.U.; Kaur, K.; Waheed, M. The influence of learning value on learning management system use: An extension of UTAUT2. Inf. Dev. 2016, 32, 1306–1321. [Google Scholar] [CrossRef]
  63. Ching-Ter, C.; Hajiyev, J.; Su, C.R. Examining the students’ behavioral intention to use e-learning in Azerbaijan? The General Extended Technology Acceptance Model for E-Learning approach. Comput. Educ. 2017, 111, 128–143. [Google Scholar] [CrossRef]
  64. Alalwan, N.; Al-Rahmi, W.M.; Alfarraj, O.; Alzahrani, A.; Yahaya, N.; Al-Rahmi, A.M. Integrated three theories to develop a model of factors affecting students’ academic performance in higher education. IEEE Access 2019, 7, 98725–98742. [Google Scholar] [CrossRef]
  65. Hair, J.F.; Risher, J.J.; Sarstedt, M.; Ringle, C.M. When to use and how to report the results of PLS-SEM. Eur. Bus. Rev. 2019, 31, 2–24. [Google Scholar] [CrossRef]
  66. Prasetyo, Y.T.; Roque, R.A.C.; Chuenyindee, T.; Young, M.N.; Diaz, J.F.T.; Persada, S.F.; Miraja, B.A.; Perwira Redi, A.A.N. Determining Factors Affecting the Acceptance of Medical Education eLearning Platforms during the COVID-19 Pandemic in the Philippines: UTAUT2 Approach. Healthcare 2021, 9, 780. [Google Scholar] [CrossRef] [PubMed]
  67. Ocampo, L.; Abarca, C.; Abarca, C.; Godes, N.; Pelola, E.; Pensona, M.; Niñofranco, M.; Itallo, C.A.; Paler, C.; Himang, C.; et al. Utilizing DEMATEL for Value-Embedded e-Learning during the COVID-19 Pandemic. Educ. Res. Int. 2021, 2021, 9575076. [Google Scholar] [CrossRef]
  68. Kim, H.J.; Hong, A.J.; Song, H.D. The roles of academic engagement and digital readiness in students’ achievements in university e-learning environments. Int. J. Educ. Technol. High. Educ. 2019, 16, 21. [Google Scholar] [CrossRef]
  69. Chu, T.H.; Chen, Y.Y. With Good We Become Good: Understanding e-learning adoption by theory of planned behavior and group influences. Comput. Educ. 2016, 92–93, 37–52. [Google Scholar] [CrossRef]
  70. Fornell, C.; Larcker, D.F. Evaluating Structural Equation Models with Unobservable Variables and Measurement Error. J. Mark. Res. 1981, 18, 39–50. [Google Scholar] [CrossRef]
  71. Lee, Y.H.; Hsiao, C.; Purnomo, S.H. An empirical examination of individual and system characteristics on enhancing e-learning acceptance. Australas. J. Educ. Technol. 2014, 30, 562–579. [Google Scholar] [CrossRef]
  72. Salloum, S.A.; Qasim Mohammad Alhamad, A.; Al-Emran, M.; Abdel Monem, A.; Shaalan, K. Exploring students’ acceptance of e-learning through the development of a comprehensive technology acceptance model. IEEE Access 2019, 7, 128445–128462. [Google Scholar] [CrossRef]
  73. Humida, T.; Al Mamun, M.H.; Keikhosrokiani, P. Predicting behavioral intention to use e-learning system: A case-study in Begum Rokeya University, Rangpur, Bangladesh. Educ. Inf. Technol. 2021, 1–25. [Google Scholar] [CrossRef]
  74. Safsouf, Y.; Mansouri, K.; Poirier, F. Smart learning environment, measure online student satisfaction: A case study in the context of higher education in Morocco. In Proceedings of the 2020 International Conference on Electrical and Information Technologies (ICEIT), Rabat, Morocco, 4–7 March 2020; pp. 1–5. [Google Scholar]
  75. Panigrahi, R.; Srivastava, P.R.; Panigrahi, P.K. Effectiveness of e-learning: The mediating role of student engagement on perceived learning effectiveness. Inf. Technol. People 2020, 34, 1840–1862. [Google Scholar] [CrossRef]
  76. Al-Nimer, M.; Alsheikh, G. Unleashing the role of e-learning in student engagement practices and accounting professional competencies. J. Appl. Res. High. Educ. 2021. ahead-of-print. [Google Scholar] [CrossRef]
  77. Rajabalee, Y.B.; Santally, M.I. Learner satisfaction, engagement and performances in an online module: Implications for institutional e-learning policy. Educ. Inf. Technol. 2021, 26, 2623–2656. [Google Scholar] [CrossRef] [PubMed]
  78. Sukendro, S.; Habibi, A.; Khaeruddin, K.; Indrayana, B.; Syahruddin, S.; Makadada, F.A.; Hakim, H. Using an extended Technology Acceptance Model to understand students’ use of e-learning during COVID-19: Indonesian sport science education context. Heliyon 2020, 6, e05410. [Google Scholar] [CrossRef] [PubMed]
  79. Kimathi, F.A.; Zhang, Y. Exploring the General Extended Technology Acceptance Model for e-Learning Approach on Student’s Usage Intention on e-Learning System in University of Dar es Salaam. Creat. Educ. 2019, 10, 208–223. [Google Scholar] [CrossRef] [Green Version]
  80. Girish, V.G.; Kim, M.Y.; Sharma, I.; Lee, C.K. Examining the structural relationships among e-learning interactivity, uncertainty avoidance, and perceived risks of COVID-19: Applying extended technology acceptance model. Int. J. Hum.-Comput. Interact. 2021, 7, 1–11. [Google Scholar] [CrossRef]
  81. Jameel, A.S.; Abdalla, S.N.; Karem, M.A.; Ahmad, A.R. Behavioural Intention to Use E-Learning from student’s perspective during COVID-19 Pandemic. In Proceedings of the 2020 2nd Annual International Conference on Information and Sciences (AiCIS), Fallujah, Iraq, 24–25 November 2020; pp. 165–171. [Google Scholar]
Figure 1. Research model and hypotheses.
Sustainability 13 13565 g001
Figure 2. Path coefficient findings.
Sustainability 13 13565 g002
Figure 3. Path T-Values findings.
Sustainability 13 13565 g003
Table 1. Demographic profile.
ItemsDescriptionN%Cumulative %
GanderMale27369.1100.0
Female12230.930.9
Age18–20276.86.8
21–246416.223.0
25–2913834.958.0
30–348120.578.5
35–405714.492.9
41–45174.397.2
46–Above112.8100.0
EducationSocial Science379.49.4
Science &Technology13834.944.4
Engineering8521.566.0
Management9624.390.4
Others389.6100.0
Table 2. Constructs, Items, IL, CR, CA, and AVE.
ConstructItemsILCACRAVE
Experience
(EXP)
EXP 10.7890.8620.9010.645
EXP20.841
EXP30.847
EXP40.779
EXP 50.755
Technology Anxiety
(TEA)
TEA 10.7830.8730.9070.662
TEA 20.822
TEA 30.831
TEA 40.835
TEA 50.798
Facilitating conditions
(FC)
FC 10.8110.8680.9050.657
FC20.844
FC30.865
FC40.789
FC 50.737
Students’ engagement
(SEN)
SEN 10.7640.8490.8920.624
SEN 20.825
SEN 30.797
SEN 40.772
SEN 50.789
Perceived usefulness
(PU)
PU 10.8130.8850.9160.686
PU 20.828
PU30.871
PU40.822
PU50.807
Perceived ease of use
(PEOU)
PEOU 10.7870.8840.9150.684
PEOU 20.818
PEOU 30.843
PEOU 40.872
PEOU 50.812
Task-technology fit
(TTF)
TTF10.7370.8490.8920.622
TTF 20.791
TTF 30.817
TTF 40.821
TTF50.775
Behavioral intention to use eLearning (BI)BI 10.7620.8450.8900.619
BI 20.704
BI 30.828
BI 40.835
BI 50.796
eLearning adoption (EA)EA10.7870.8730.9080.663
EA20.826
EA30.831
EA40.832
EA50.793
Source: Author.
Table 3. Discriminant Validity.
BIEXPFCPEOUPUSENTTFTEAEA
Behavioral intention to use e-Learning0.787
Experience0.3610.803
Facilitating conditions0.4230.3340.811
Perceived ease of use0.3630.3580.3930.827
Perceived usefulness0.4220.3710.4800.4220.828
Students’ engagement0.4380.3450.4030.4460.4690.790
Task-technology fit0.5320.4400.7220.5130.6130.5570.789
Technology Anxiety0.4210.3770.4320.3960.4090.4330.5220.814
E-learning adoption for educational sustainability0.4210.3770.4310.3950.4100.4330.5221.0000.814
Source: Author.
Table 4. Loading and cross-loading of measures.
BIEAEXPFCPEOUPUSENTEATTF
BI_10.7620.3400.2650.4670.3250.4310.4740.3400.549
BI_20.7040.2570.3380.3550.2920.3840.4070.2570.422
BI_30.8280.3510.2730.2900.2570.2910.2850.3520.369
BI_40.8350.3210.2980.2670.2730.2730.2730.3210.375
BI_50.7960.3760.2490.2430.2660.2520.2460.3770.338
EA_10.3610.7870.2900.3130.2860.3620.3810.7830.420
EA_20.3110.8260.3020.3360.2450.3650.3080.8220.400
EA_30.3040.8310.3360.3530.2940.3710.3230.8310.404
EA_40.3910.8320.2950.3940.3860.3120.4080.8350.455
EA_50.3350.7930.3120.3520.3760.2690.3320.7980.436
EXP_10.2600.3350.7890.3030.2640.2570.2750.3350.319
EXP_20.2540.3030.8410.2700.2920.3310.2560.3030.327
EXP_30.3210.3140.8470.2560.3070.3190.2960.3150.374
EXP_40.2670.2660.7790.1980.3010.2540.2340.2670.357
EXP_50.3400.2960.7550.3190.2680.3240.3210.2960.380
FC_10.3310.3550.2950.8110.3400.3960.3170.3560.580
FC_20.3490.3620.2570.8440.3490.3820.3420.3630.601
FC_30.3210.3510.2850.8650.2930.3910.3180.3520.574
FC_40.3270.3270.2680.7890.2870.3470.2800.3270.553
FC_50.3790.3480.2490.7370.3180.4210.3680.3470.609
PEOU_10.3310.2470.3260.2930.7870.4670.4010.2480.431
PEOU_20.2800.3580.2800.3490.8180.3580.3900.3590.489
PEOU_30.2720.3630.2890.3170.8430.2960.3430.3640.360
PEOU_40.2840.3570.2870.3440.8720.3200.3700.3590.429
PEOU_50.3350.3050.2970.3190.8120.2970.3320.3050.401
PU_10.3440.3400.2730.3750.3380.8130.3920.3400.523
PU_20.3950.3280.3110.3410.3690.8280.3550.3270.504
PU_30.3490.3310.3030.4250.3610.8710.3990.3300.494
PU_40.3270.3610.3230.4100.3520.8220.3880.3600.502
PU_50.3320.3380.3270.4380.3250.8070.4070.3370.517
SEN_10.4160.3330.2790.3070.3510.3240.7640.3330.434
SEN_20.3920.3330.2830.3570.4080.3940.8250.3330.500
SEN_30.3730.3580.2880.2630.3550.3980.7970.3580.436
SEN_40.2760.3200.2110.3170.2670.3720.7720.3190.415
SEN_50.2570.3690.2950.3430.3630.3620.7890.3690.404
TEA_10.3610.7870.2900.3130.2860.3620.3810.7830.420
TEA_20.3110.8260.3020.3360.2450.3650.3080.8220.400
TEA_30.3040.8310.3360.3530.2940.3710.3230.8310.404
TEA_40.3910.8320.2950.3940.3860.3120.4080.8350.455
TEA_50.3350.7930.3120.3520.3760.2690.3320.7980.436
TTF_10.4250.4330.3500.9400.4210.4860.4250.4340.737
TTF_20.4880.4870.3990.4790.4520.4580.4840.4870.791
TTF_30.4070.3930.3580.4460.3640.4890.4340.3940.817
TTF_40.4020.3880.3050.4220.3810.4740.4120.3880.821
TTF_50.3510.3210.3020.4410.3820.5070.4300.3210.775
Source: Author.
Table 5. Discriminant validity (< 0.900).
FactorsBIEXPFCPEOUPUSENTTFTEAEAB
Behavioral intention to use e-learning
Experience0.422
Facilitating conditions0.4810.388
Perceived ease of use0.4160.4090.447
Perceived usefulness0.4790.4240.5460.475
Students’ engagement0.5010.4010.4660.5080.540
Task-technology fit0.6080.5050.8030.5820.7050.648
Technology Anxiety0.4840.4360.4920.4430.4690.5000.593
E-learning adoption for educational sustainability0.4840.4360.4920.4430.4690.5000.5930.645
Table 6. Variance inflation factor (VIF < 3).
BIEXPFCPEOUPUSENTTFTEAEA
Behavioral intention to use eLearning 1.417
Experience 1.287 1.312
Facilitating conditions 1.473 1.498
Perceived ease of use1.357 1.456 1.378
Perceived usefulness 1.553 1.587
Students’ engagement 1.465 1.534
Task-technology fit1.357 1.67
Technology Anxiety 1.454 1.48
E-Learning use for educational sustainability
Source: Author.
Table 7. Path, t-value, and p-value Source: Author.
FactorsNumber HypothesisPath (β)T-Valuesp-ValuesResults
EXP → PEOUH10.1322.3320.020Accepted
EXP → TTFH20.0812.2370.026Accepted
TEA → PEOUH30.1332.4440.015Accepted
TEA → TTFH40.1022.5050.013Accepted
FC → PEOUH50.1302.2790.023Accepted
FC → TTFH60.44310.4660.000Accepted
SEN → PEOUH70.2183.8610.000Accepted
SEN → TTFH80.1603.8860.000Accepted
PU → PEOUH90.1532.5350.012Accepted
PU → TTFH100.2074.9370.000Accepted
PEOU → TTFH110.1103.2280.001Accepted
PEOU → BIH120.1222.5030.013Accepted
PEOU → EAH130.1512.7740.006Accepted
TTF → BIH140.4709.5010.000Accepted
TTF → EAH150.3485.5890.000Accepted
BI → EAH160.1813.3680.001Accepted
Publisher’s Note: MDPI stays neutral with regard to jurisdictional claims in published maps and institutional affiliations.

