
Heterogeneity Study of the Visual Features Based on Geographically Weighted Principal Components Analysis Applied to an Urban Community

Abstract
:1. Introduction
2. Literature Review
3. Methods
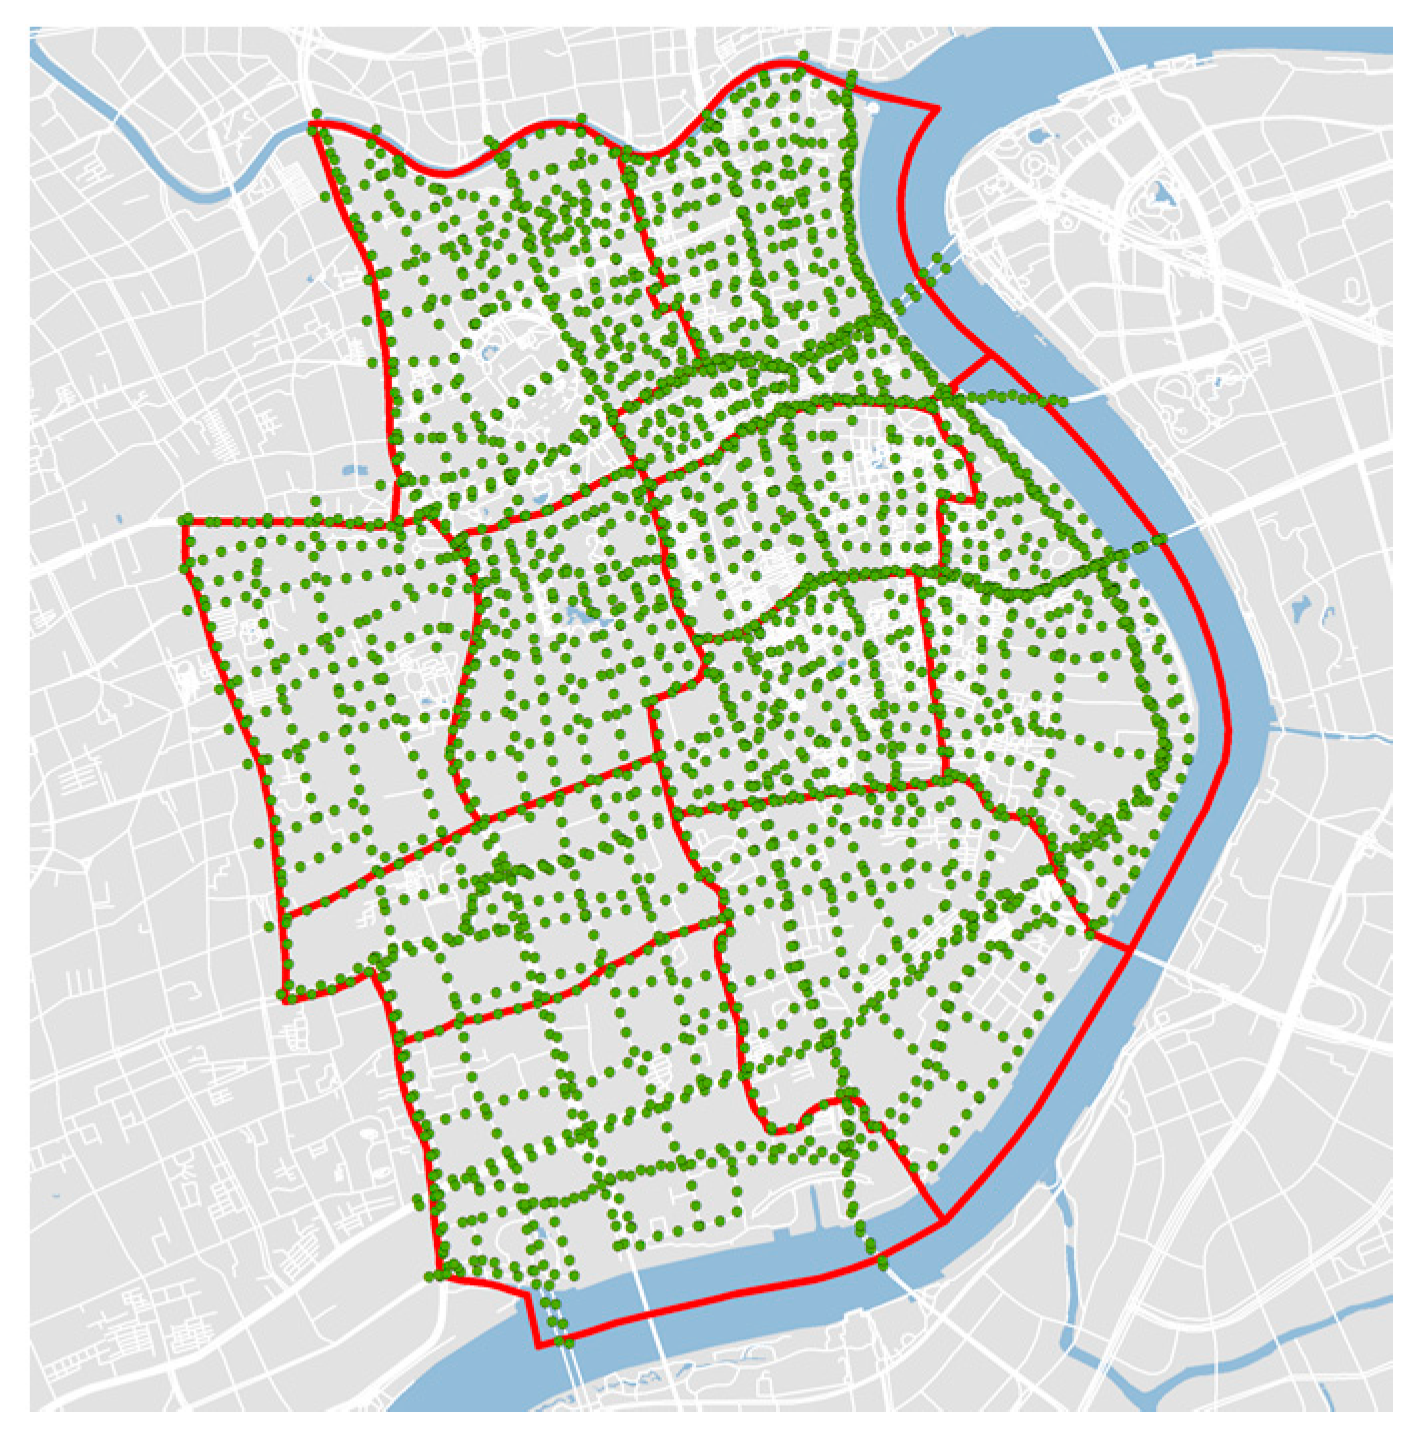
3.1. Study Area
3.2. Data Sources
3.3. Research Methods
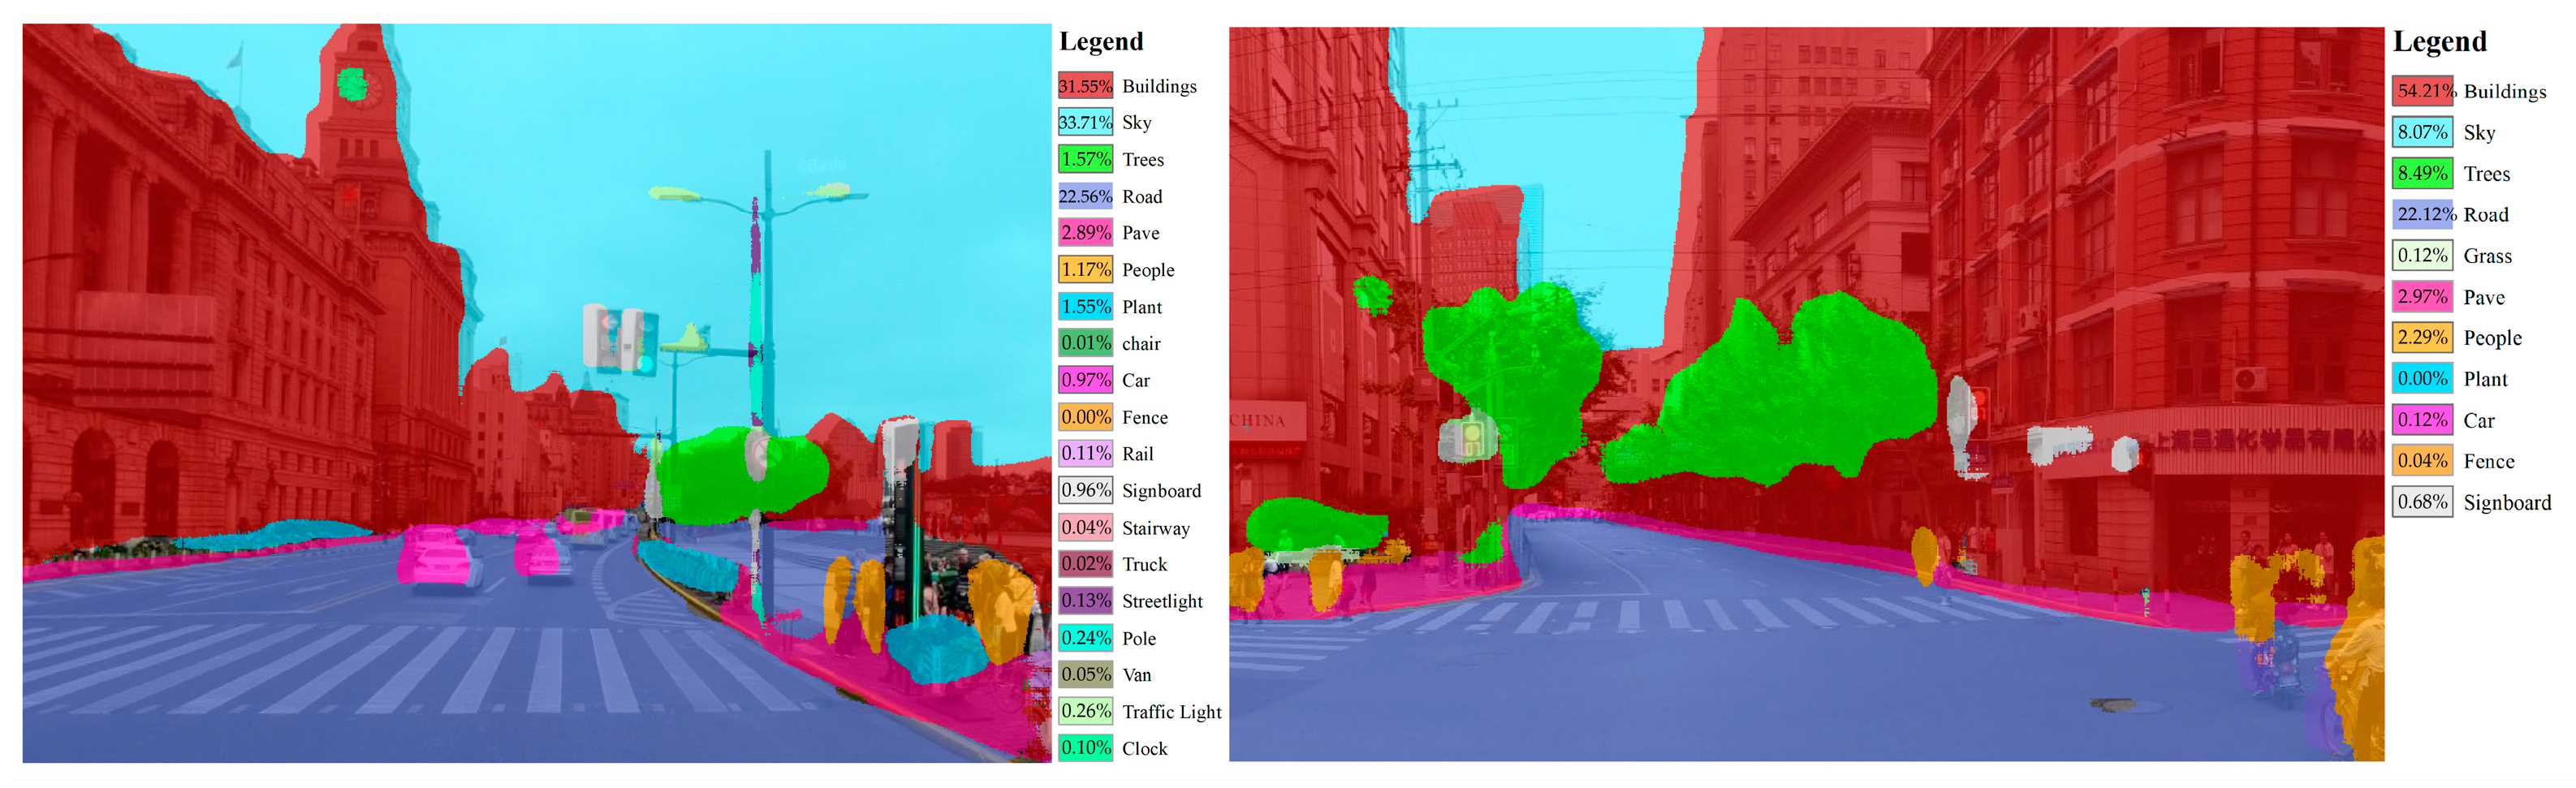
3.3.1. Semantic Segmentation Based on Full Convolution Neural Network (FCN)
3.3.2. Geographic Weighted Principal Components Analysis (GWPCA)
4. Results and Discussion
4.1. Results
4.1.1. Data Processing
4.1.2. Overall Features Based on Traditional Principal Components Analysis
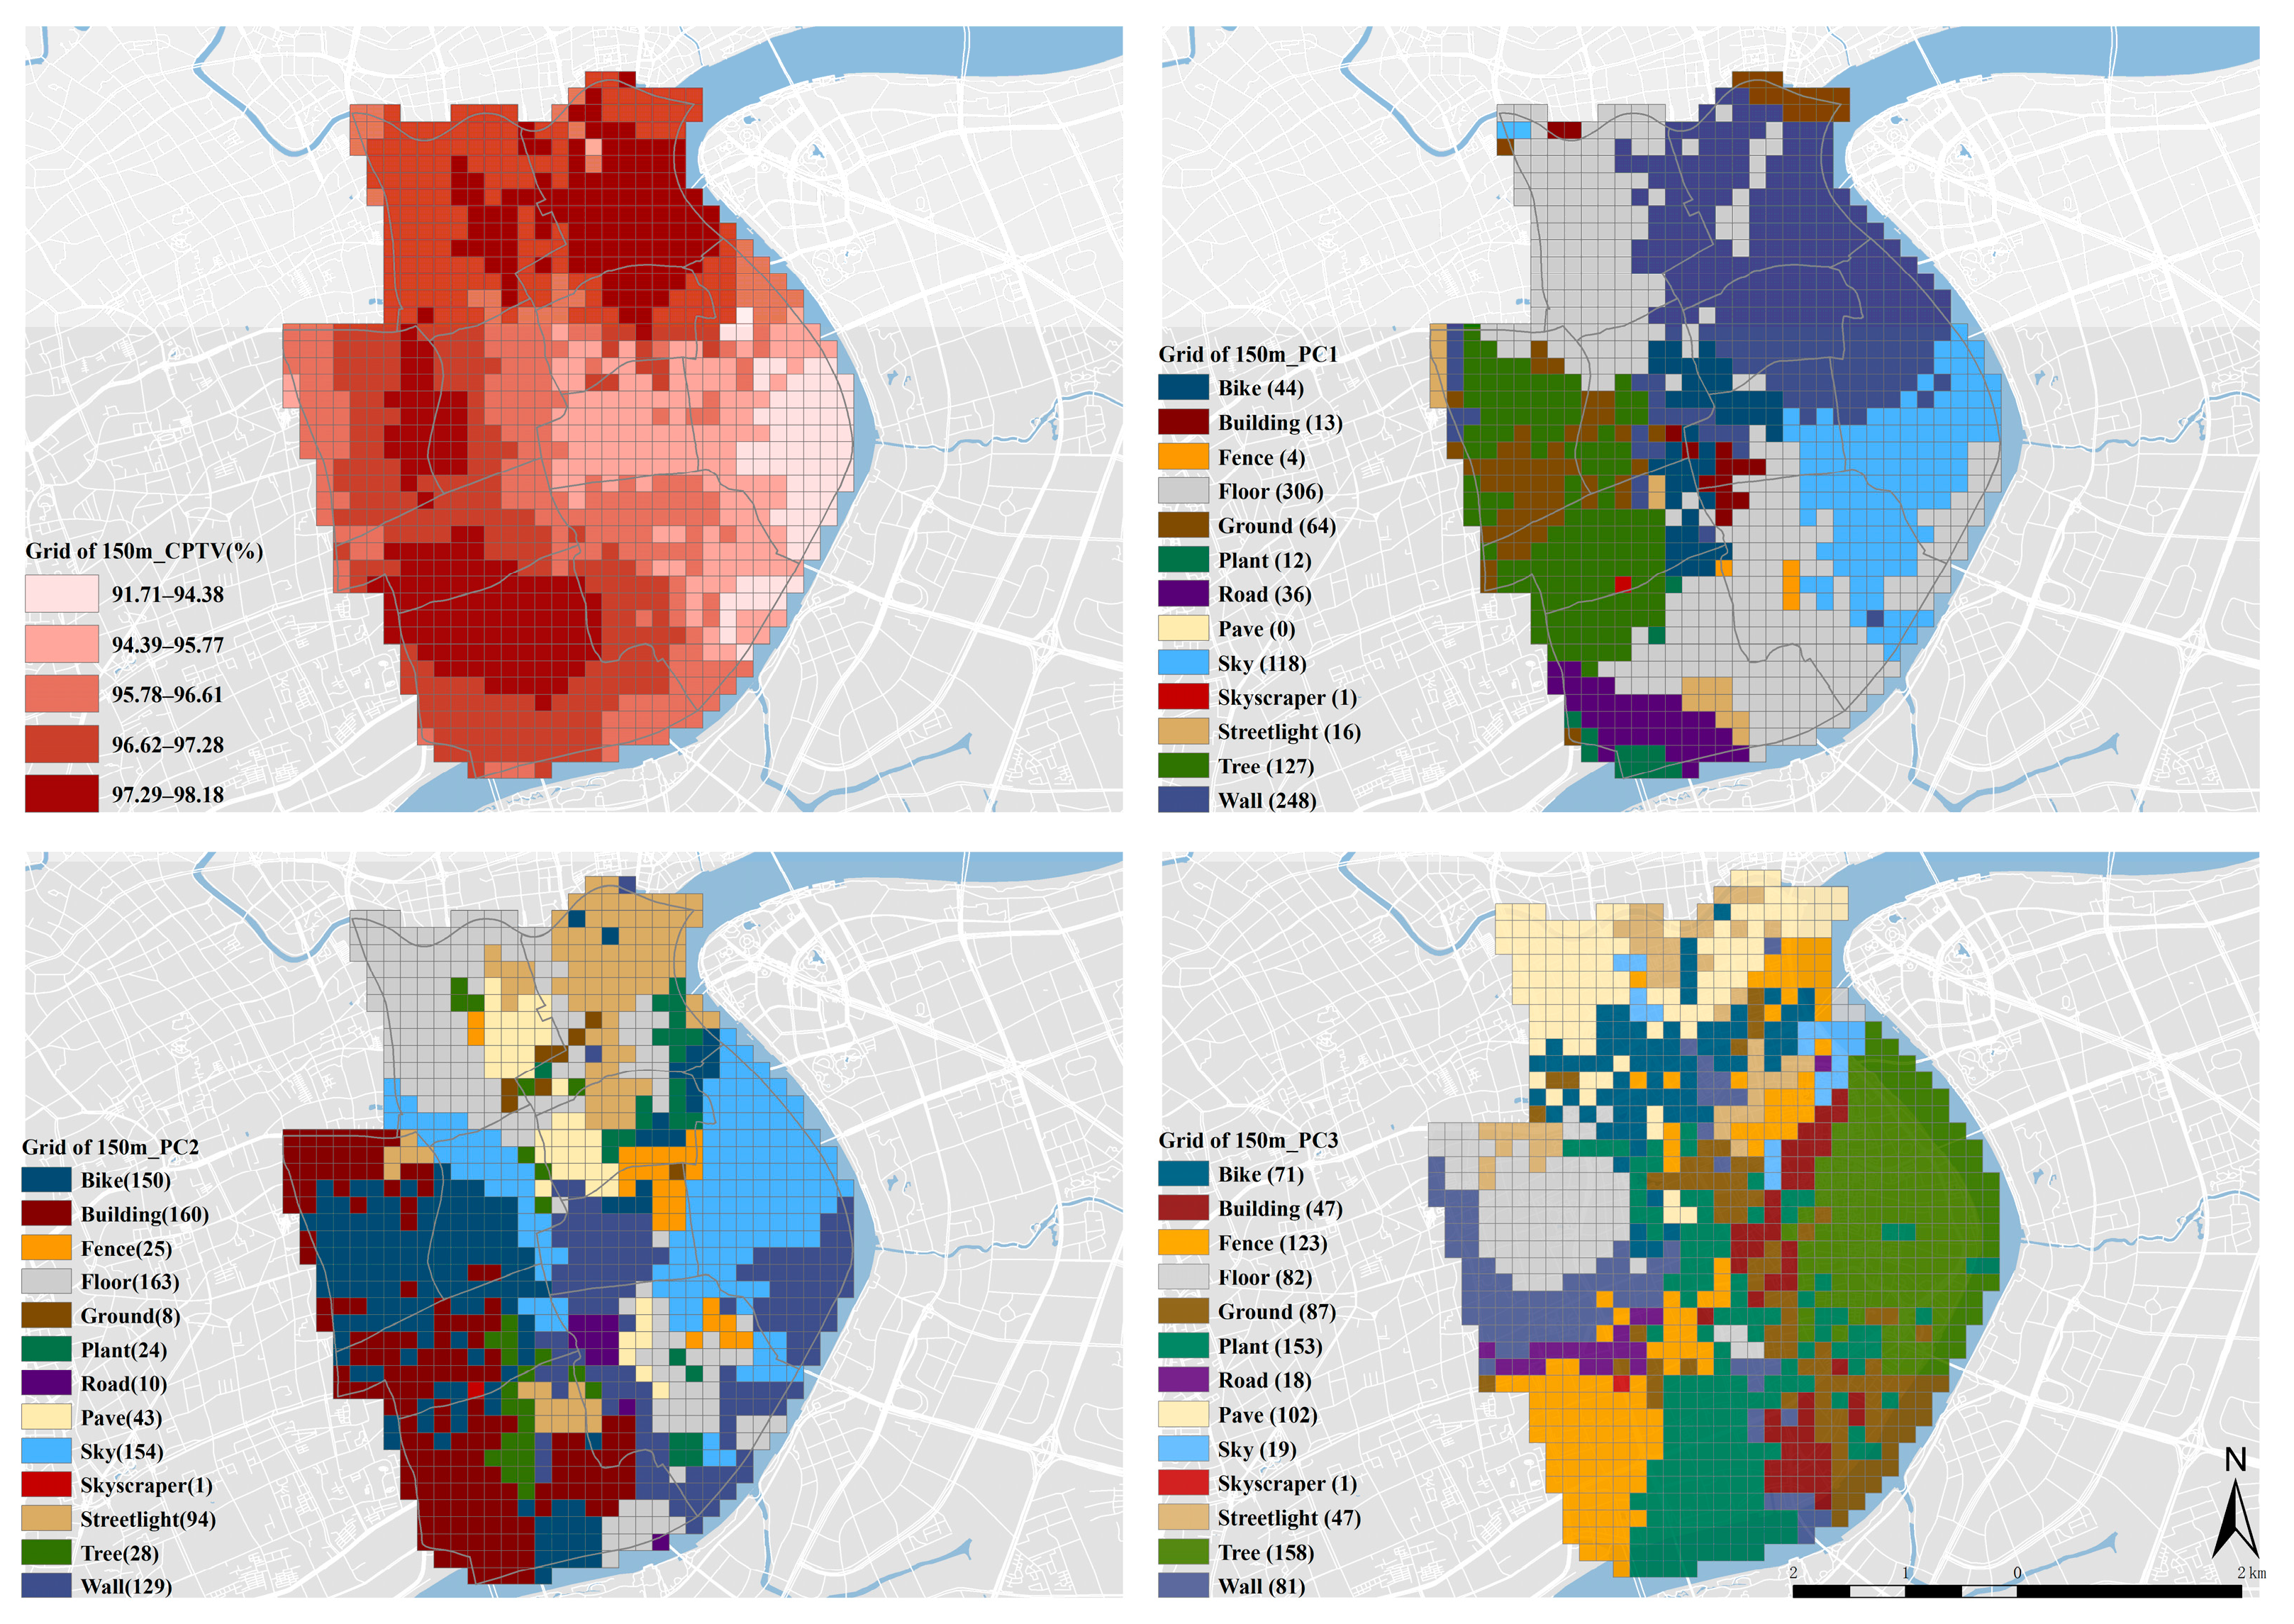
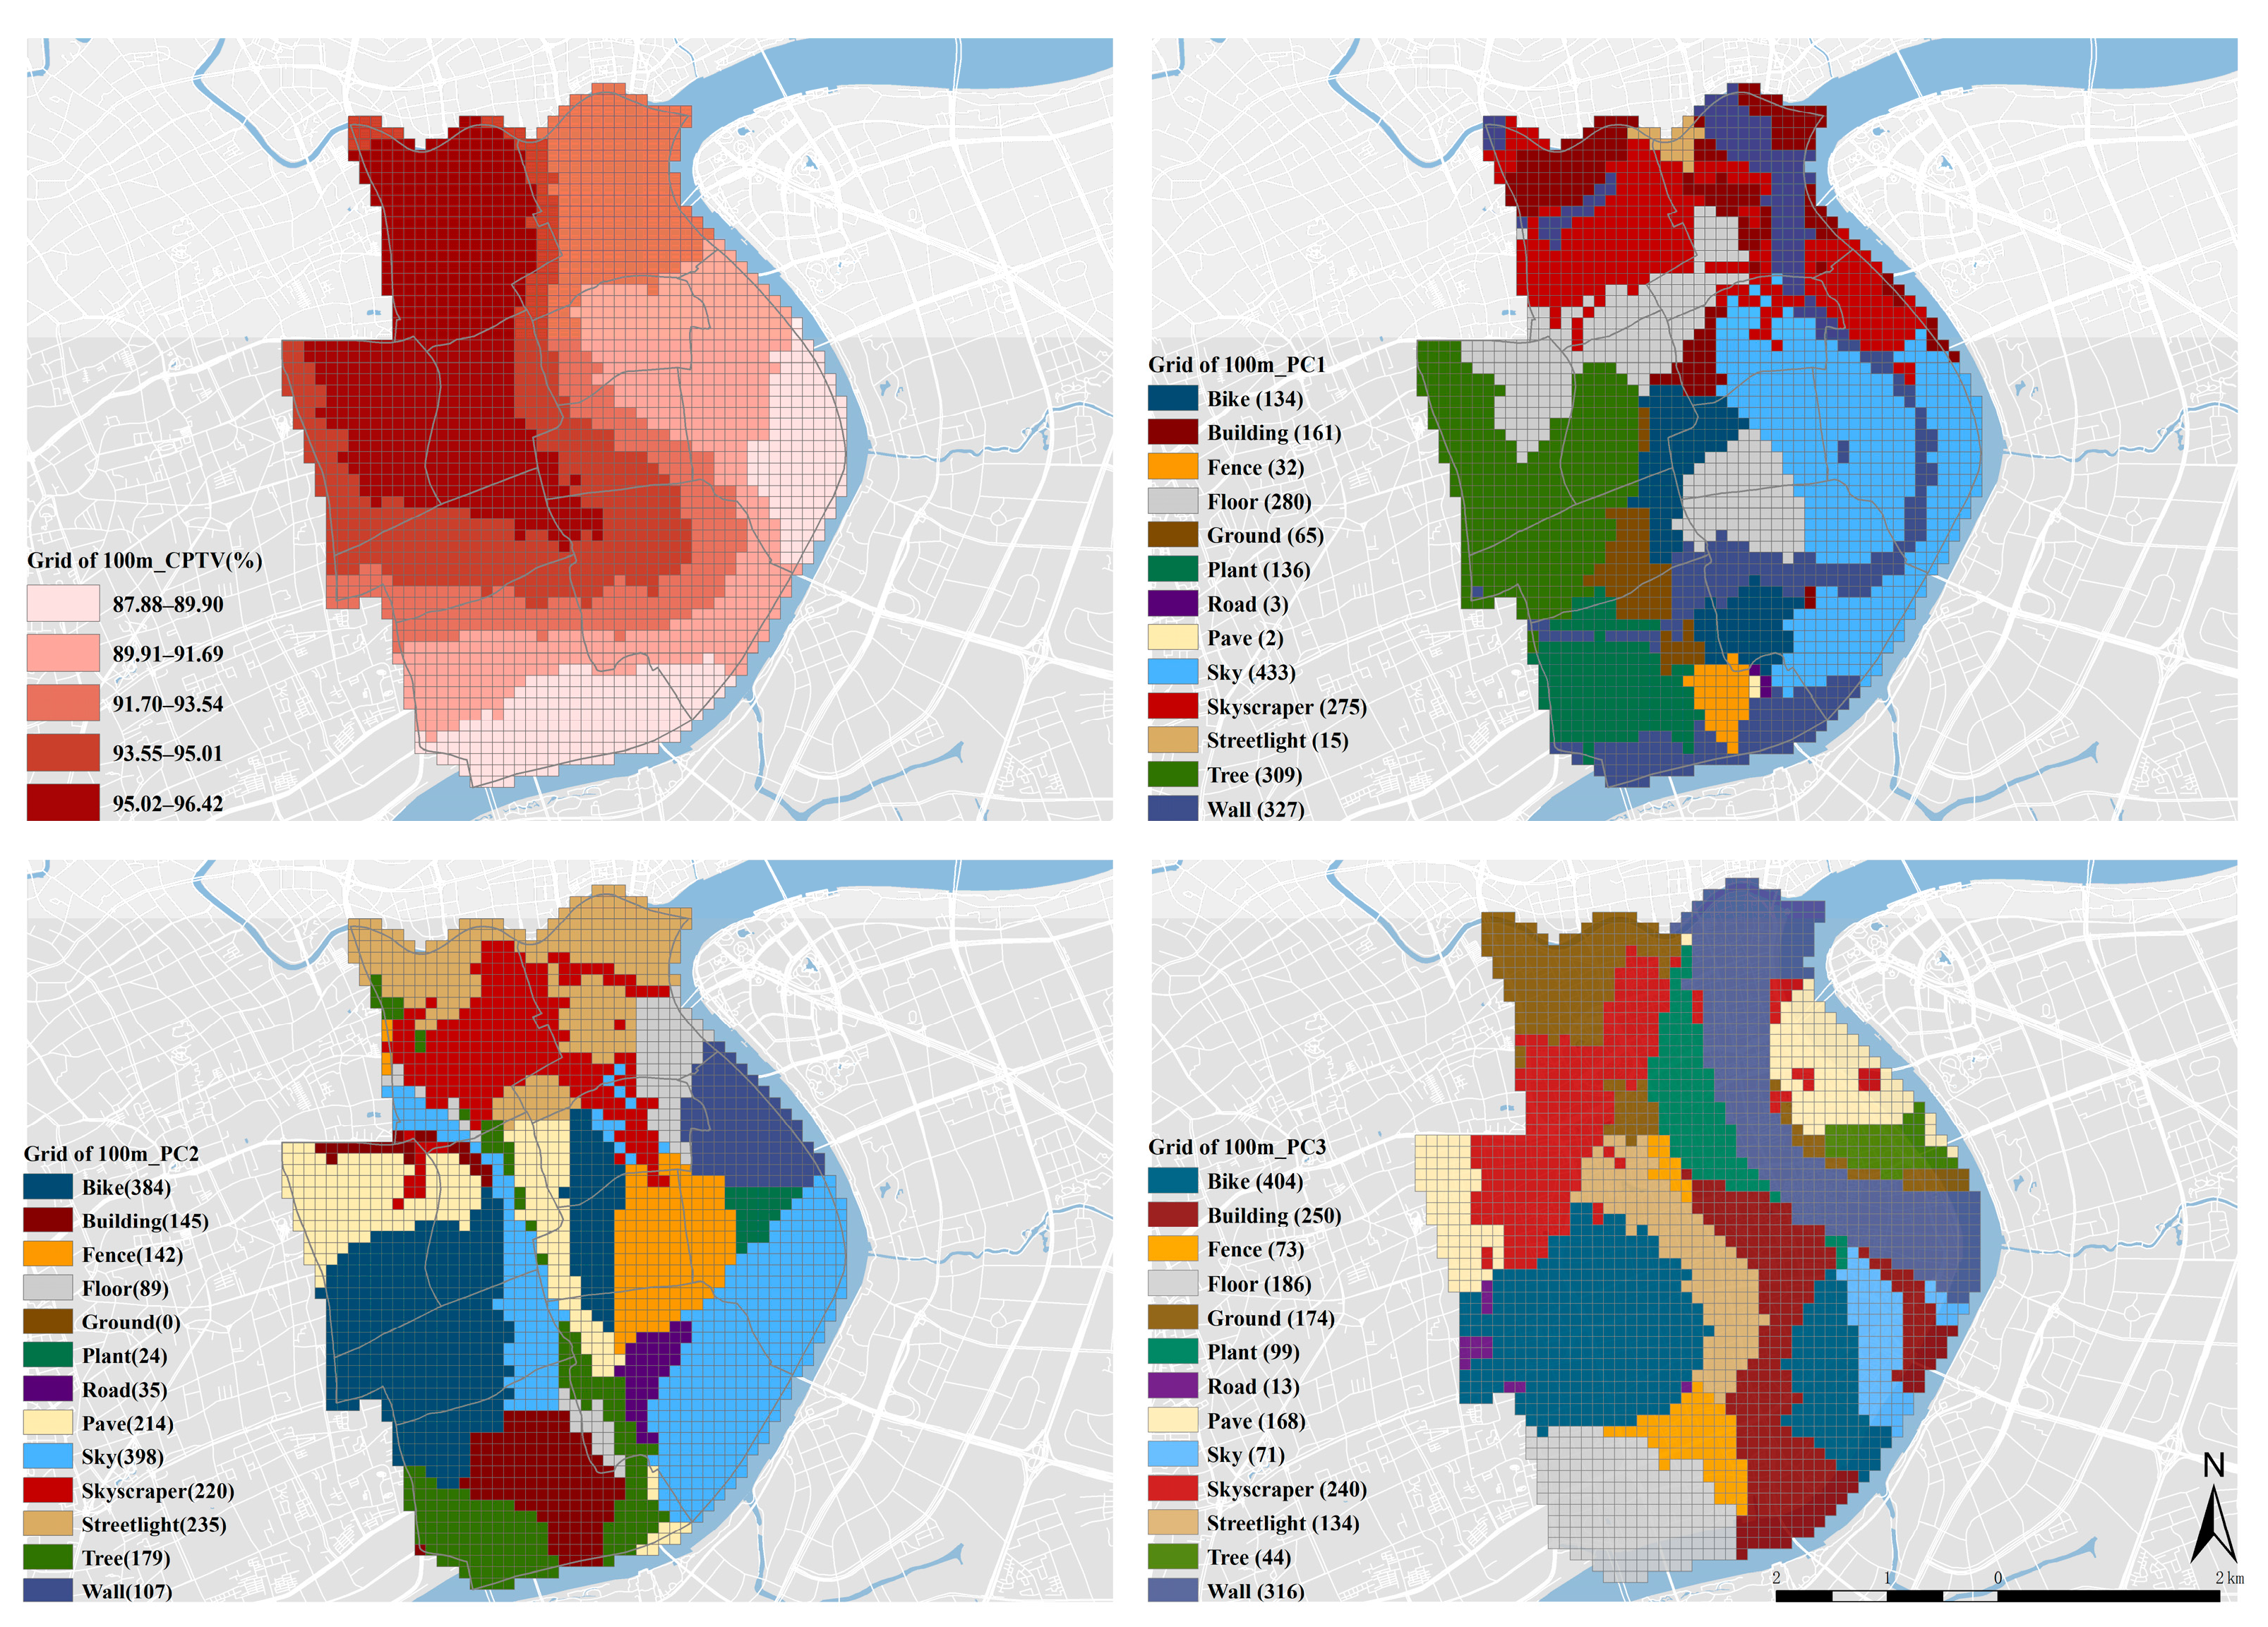
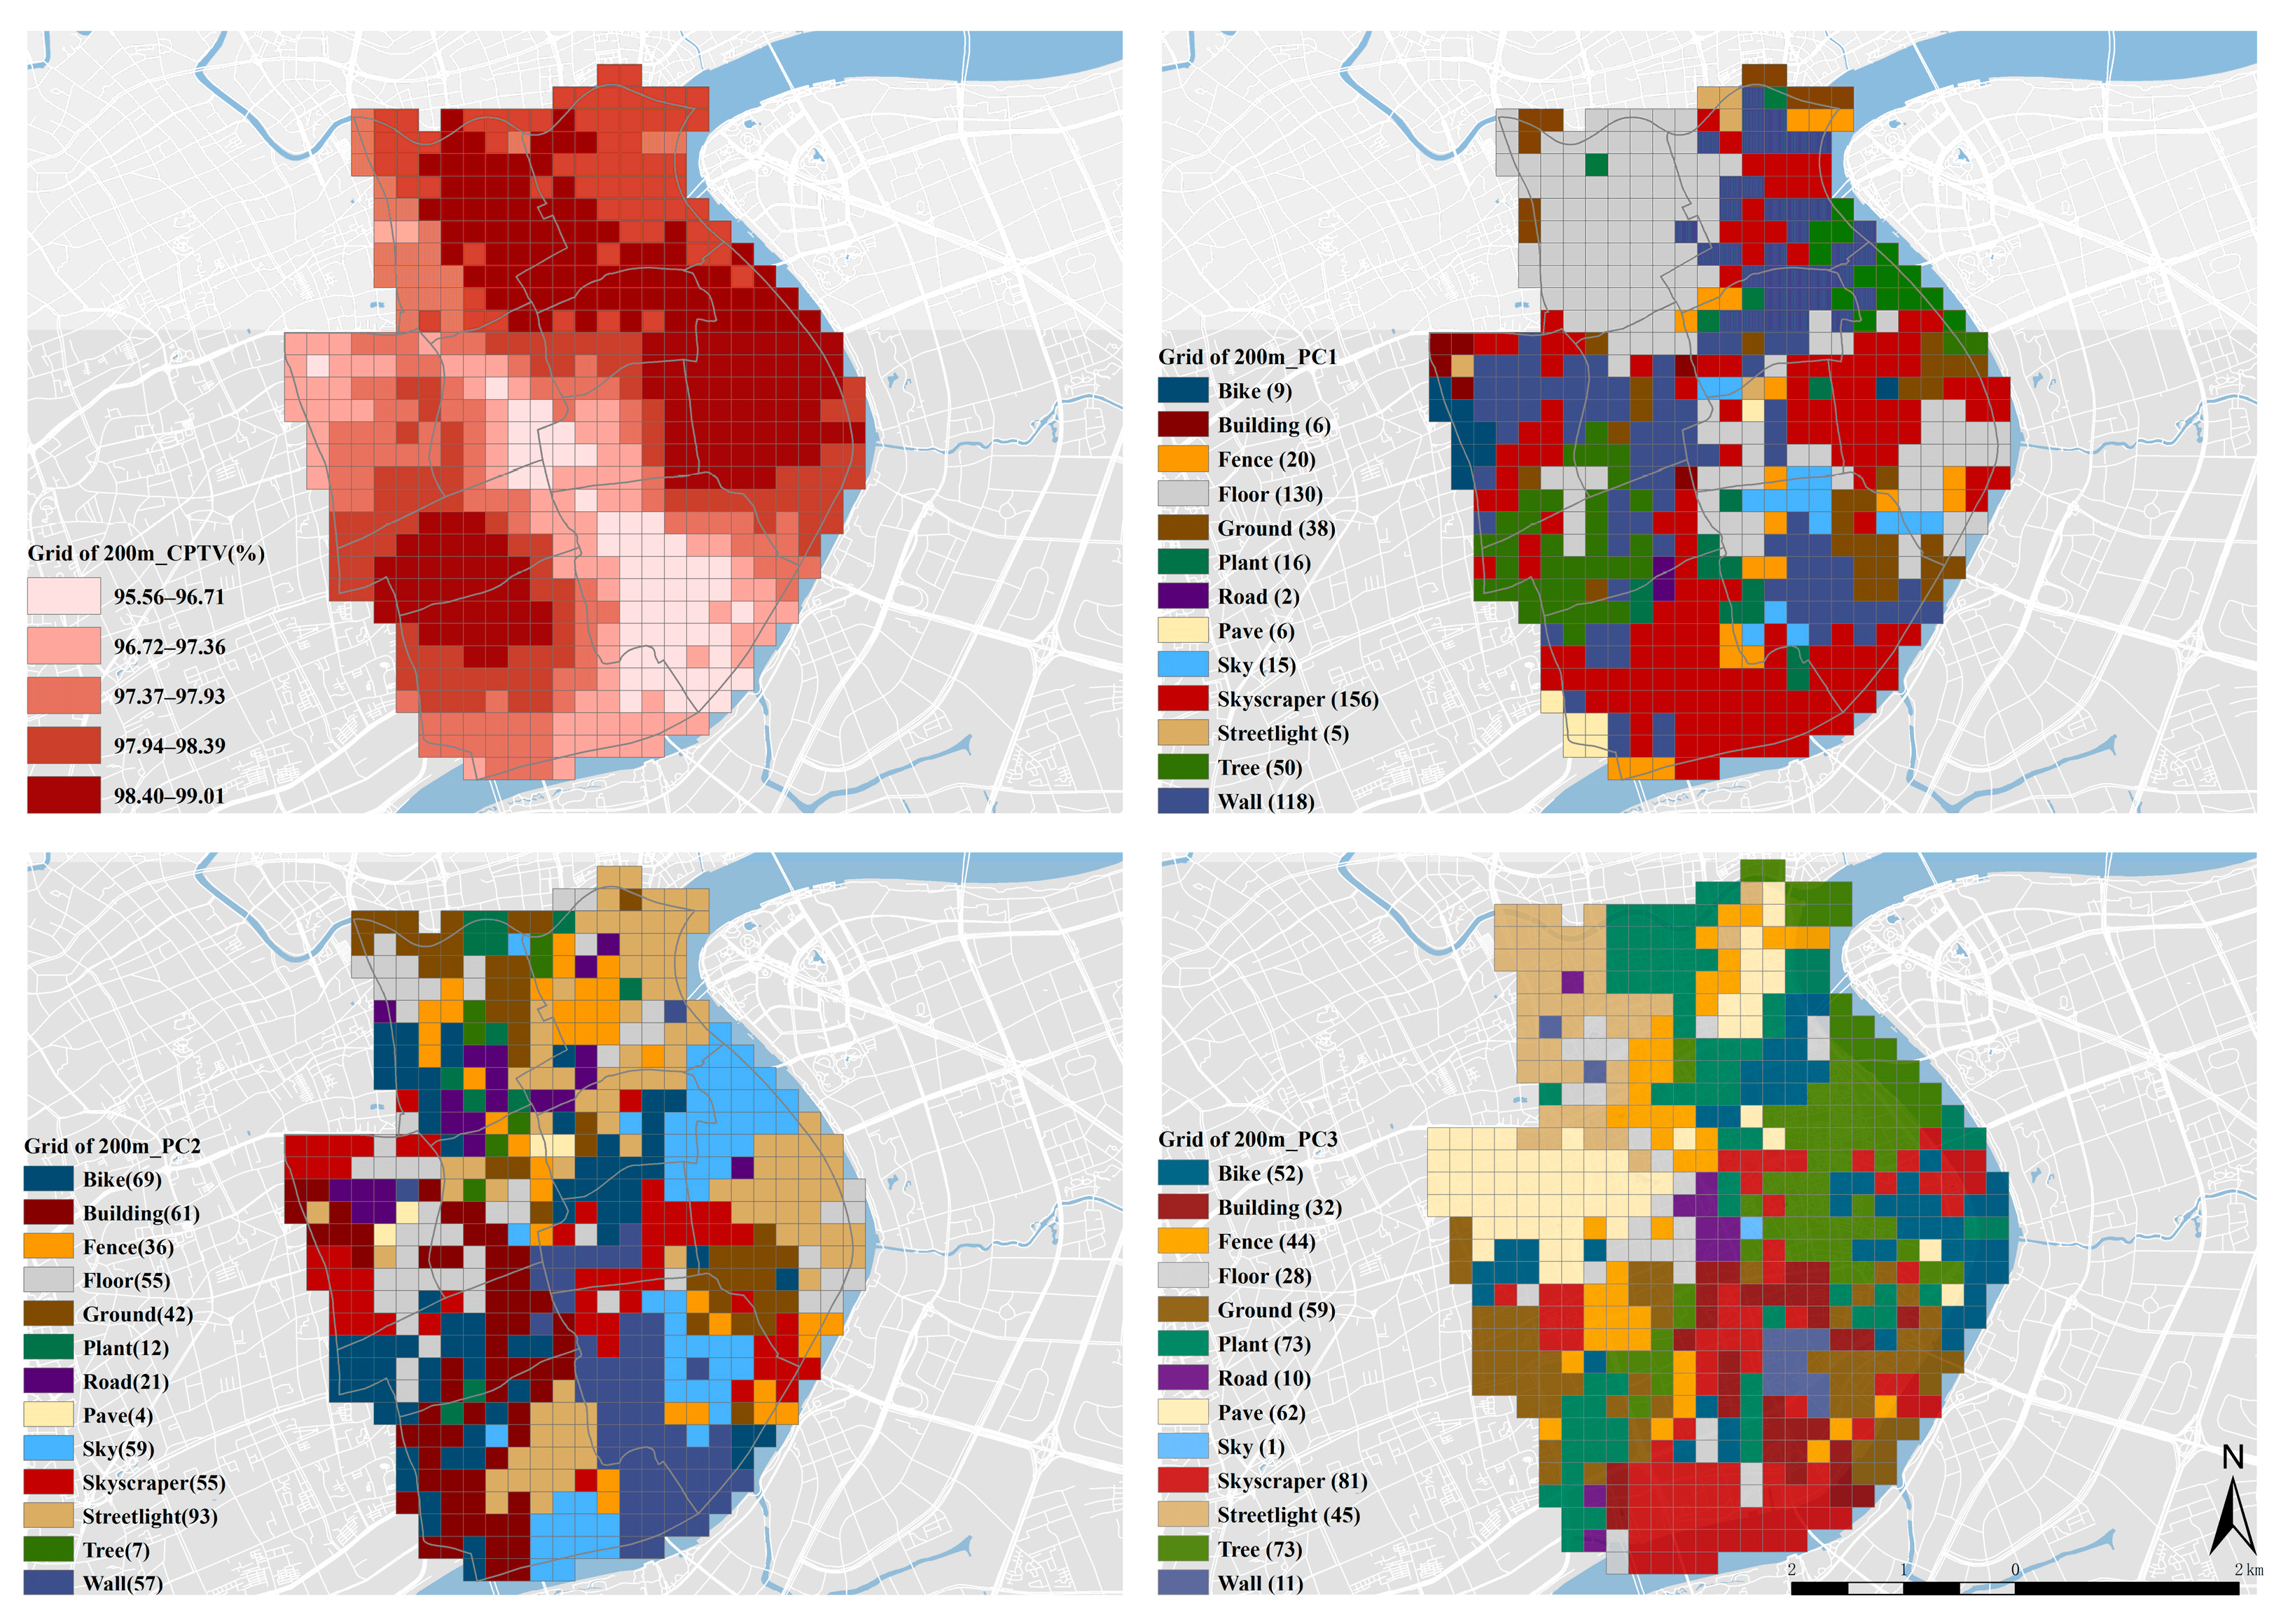
4.1.3. Local Features Based on Geographically Weighted Principal Components Analysis
4.2. Discussion
5. Conclusions
Author Contributions
Funding
Institutional Review Board Statement
Informed Consent Statement
Data Availability Statement
Conflicts of Interest
References
- Youngan, K.; John, R.H. Street Egohood: An Alternative Perspective of Measuring Neighborhood and Spatial Patterns of Crime. J. Quant. Criminol. 2020, 36, 29–66. [Google Scholar]
- Friedmann, J. Place and Place-Making in Cities: A Global Perspective. Plan. Theory Pract. 2010, 11, 149–165. [Google Scholar] [CrossRef]
- Liu, H.; Xu, Y.; Tang, J.; Deng, M.; Huang, J.; Yang, W.; Wu, F. Recognizing urban functional zones by a hierarchical fusion method considering landscape features and human activities. Trans. GIS 2020, 24, 1359–1381. [Google Scholar] [CrossRef]
- Huang, Y.; Shao, S.; Lei, Y.; Tian, J. Identification of Urban Functional Zones Using Network Kernel Density Estimation and Kriging Interpolation. J. Geomat. 2019, 44, 14–18. [Google Scholar]
- Zhang, X.; Du, S.; Wang, Q. Hierarchical Semantic Cognition for Urban Functional Zones with Vhr Satellite Images and Poi Data. Isprs J. Photogramm. Remote Sens. 2017, 132, 170–184. [Google Scholar] [CrossRef]
- Yao, Y.; Li, X.; Liu, X.; Liu, P.; Liang, Z.; Zhang, J.; Mai, K. Sensing Spatial Distribution of Urban Land Use by Integrating Points-of-interest and Google Word2vec Model. Int. J. Geogr. Inf. Sci. 2016, 31, 825–848. [Google Scholar] [CrossRef]
- Wei, L.; Luo, Y.; Wang, M.; Cai, Y.; Su, S.; Li, B.; Ji, H. Multiscale Identification of Urban Functional Polycentricity for Planning Implications: An Inte-grated Approach Using Geo-big Transport Data and Complex Network Modeling. Habitat Int. 2020, 97, 102134. [Google Scholar] [CrossRef]
- Zhang, L.; Pei, T.; Chen, Y.; Song, C.; Liu, X. A Review of Urban Environmental Assessment Based on Street View Images. J. Geo-Inf. Sci. 2019, 21, 46–58. [Google Scholar]
- Long, Y.; Tang, J. Large-scale Quantitative Measurement of the Quality of Urban Street Space: The Research Progress. City Plan. Rev. 2019, 43, 107–114. [Google Scholar]
- Liu, L.; Wang, H. Application of Computer Vision in Urban Studies: Review and Prospect. City Plan. Rev. 2019, 43, 117–124. [Google Scholar]
- Chester, H.; Lisa, A. Measuring Urban Streetscapes for Livability: A Review of Approaches. Prof. Geogr. 2016, 68, 149–158. [Google Scholar]
- Zhang, L.; Ye, Y.; Zeng, W.; Chiaradia, A. Human-scale Quality on Streets: A Large-scale and Efficient Analytical Approach Based on Street View Images and New Urban Analytical Tools. Urban Plan. Int. 2019, 34, 18–27. [Google Scholar]
- Dai, Z.; Hua, C. The Improvement of Street Space Quality Measurement Method Based on Streetscape. Planners 2019, 35, 57–63. [Google Scholar]
- Naik, N.; Philipoom, J.; Raskar, R.; Hidalgo, C. Streetscore—Predicting the perceived safety of one million streetscapes. In Proceedings of the IEEE Conference on Computer Vision and pattern Recognition Workshops, Las Vegas, NV, USA, 27 June 2014; pp. 779–785. [Google Scholar]
- Robinson, M.O. Measuring Urban Design: Metrics for Livable Places, By Reid Ewing and Otto Clemente. J. Am. Plan. Assoc. 2015, 81, 80–81. [Google Scholar] [CrossRef]
- Long, Y.; Ye, Y. Human-scale Urban Form:measurements, performances, and Urban Planning & Design Interventions. South Archit. 2016, 36, 41–47. [Google Scholar]
- Chen, Y.; Zhao, X. Research on Ground-floor Interfaces along Streets from the Perspective of Pedestrians: A Case Study of Huaihai Road in Shanghai. City Plan. Rev. 2014, 38, 24–31. [Google Scholar]
- Xiong, W.; Yan, W.; Liu, X.; Ma, R. The Improvement of Spatial Quality on Beijing Historical Streets Based on People-oriented Observation. Urban. Archit. 2018, 06, 57–61. [Google Scholar]
- Ewing, R.; Handy, S.L.; Brownson, R.C.; Clemente, O.; Winston, E. Identifying and Measuring Urban Design Qualities Related to Walkability. J. Phys. Act. Health 2006, 3, S223–S240. [Google Scholar] [CrossRef] [PubMed]
- Brownson, R.C.; Hoehner, C.M.; Day, K.; Forsyth, A.; Sallis, J.F. Measuring the Built Environment for Physical Activity: State of the Science. Am. J. Prev. Med. 2009, 36, S99–S123. [Google Scholar] [CrossRef] [Green Version]
- Michael, S. Learning to Make Liveable Cities. J. Urban Des. 2016, 21, 570–573. [Google Scholar]
- Kang, Y.; Zhang, F.; Gao, S.; Lin, H.; Liu, Y. A Review of Urban Physical Environment Sensing Using Street View Imagery in Public Health Studies. Annals Gis. 2020, 26, 261–275. [Google Scholar] [CrossRef]
- James, S.; Kevin, T.; Megan, F. Understanding Visual Engagement with Urban Street Edges Along Non-pedestrianised and Pedestrianised Streets Using Mobile Eye-tracking. Sustainability 2019, 11, 4251. [Google Scholar]
- Philip, S.; Katja, S.; César, A.H. The Collaborative Image of the City: Mapping the Inequality of Urban Perception. PLoS ONE 2013, 8, e68400. [Google Scholar]
- Li, H.; Antonio, P.; Desheng, L. Built Environment and Violent Crime: An Environmental Audit Approach Using Google Street View. Comput. Environ. Urban Syst. 2017, 66, 83–95. [Google Scholar]
- Wu, C.; Peng, N.; Ma, X.; Li, S.; Rao, J. Assessing Multiscale Visual Appearance Characteristics of Neighbourhoods Using Geographically Weighted Principal Component Analysis in Shenzhen, China. Comput. Environ. Urban Syst. 2020, 84, 101547. [Google Scholar] [CrossRef]
- Yao, Y.; Liang, Z.; Yuan, Z.; Liu, P.; Bie, Y.; Zhang, J.; Wang, R.; Wang, J.; Guan, Q. A human-machine adversarial scoring framework for urban perception assessment using street-view images. Int. J. Geogr. Inf. Sci. 2019, 33, 2363–2384. [Google Scholar] [CrossRef]
- Fotheringham, A.S.; Brunsdon, C.; Charlton, M. Geographically Weighted Regression: The Analysis of Spatially Varying Relationship; John Wiley & Sons: Hoboken, NJ, USA, 2002. [Google Scholar]
- Lu, B.; Harris, P.; Charlton, M.; Brunsdon, C. The Gwmodel R Package: Further Topics for Exploring Spatial Heterogeneity Using Geo-graphically Weighted Models. Geo-Spat. Inf. Sci. 2014, 17, 85–101. [Google Scholar] [CrossRef]


| Grid of 100 m | Grid of 150 m | Grid of 200 m | ||
|---|---|---|---|---|
| Kaiser-Meyer-Olkin | 0.44 | 0.47 | 0.49 | |
| Bartlett | x2 | 47,698.00 | 27,384.63 | 17,986.37 |
| df | 12 | 12 | 12 | |
| Sig. | 0.000 | 0.000 | 0.000 |
| Grid of 100 m | Grid of 150 m | Grid of 200 m | |||||||
|---|---|---|---|---|---|---|---|---|---|
| Comp.1 | Comp.2 | Comp.3 | Comp.1 | Comp.2 | Comp.3 | Comp.1 | Comp.2 | Comp.3 | |
| Standard deviation (STD) | 1.684 | 1.552 | 1.353 | 1.605 | 1.389 | 1.261 | 1.575 | 1.417 | 1.290 |
| Proportion of variance (PPTV) | 0.185 | 0.157 | 0.119 | 0.223 | 0.167 | 0.138 | 0.221 | 0.179 | 0.149 |
| Cumulative proportion (CPTV) | 0.185 | 0.342 | 0.462 | 0.223 | 0.390 | 0.528 | 0.221 | 0.401 | 0.549 |
| Grid of 100 m | Grid of 150 m | Grid of 200 m | |||||||
|---|---|---|---|---|---|---|---|---|---|
| Comp.1 | Comp.2 | Comp.3 | Comp.1 | Comp.2 | Comp.3 | Comp.1 | Comp.2 | Comp.3 | |
| x1, Wall | 0.006 | 0.107 | 0.183 | 0.123 | 0.173 | 0.322 | 0.187 | ||
| x2, Building | −0.619 | −0.348 | 0.593 | −0.389 | 0.604 | −0.119 | −0.222 | ||
| x3, Sky | −0.202 | 0.544 | −0.595 | 0.264 | 0.652 | ||||
| x4, Floor | 0.450 | 0.130 | 0.141 | 0.233 | 0.103 | 0.267 | |||
| x5, Tree | −0.296 | 0.563 | −0.136 | −0.649 | 0.262 | −0.112 | −0.630 | −0.337 | |
| x6, Road | −0.360 | 0.492 | −0.255 | −0.616 | −0.317 | 0.491 | −0.297 | ||
| x7, Pave | −0.377 | −0.239 | −0.256 | −0.643 | −0.177 | −0.284 | −0.585 | ||
| x8, Ground | 0.116 | 0.276 | −0.186 | −0.120 | 0.136 | 0.125 | |||
| x9, Plant | 0.319 | −0.373 | −0.197 | 0.276 | 0.180 | −0.232 | −0.223 | 0.372 | |
| x10, Fence | −0.132 | 0.260 | −0.106 | −0.144 | 0.166 | 0.186 | |||
| x11, Skyscraper | |||||||||
| x12, Streetlight | −0.175 | −0.208 | 0.172 | −0.247 | |||||
| x13, Bike | −0.168 | −0.162 | −0.157 | −0.377 | −0.120 | −0.399 | |||
| Grid of 100 m | Grid of 150 m | Grid of 200 m | |||||||
|---|---|---|---|---|---|---|---|---|---|
| Comp.1 | Comp.2 | Comp.3 | Comp.1 | Comp.2 | Comp.3 | Comp.1 | Comp.2 | Comp.3 | |
| Standard deviation (STD) | 1.480 | 1.344 | 1.265 | 1.510 | 1.357 | 1.296 | 1.615 | 1.347 | 1.317 |
| Proportion of variance (PPTV) | 0.169 | 0.139 | 0.123 | 0.175 | 0.142 | 0.129 | 0.201 | 0.140 | 0.133 |
| Cumulative proportion (CPTV) | 0.169 | 0.308 | 0.431 | 0.175 | 0.317 | 0.446 | 0.201 | 0.340 | 0.474 |
| loadings | |||||||||
| x1, Wall | 0.531 | - | 0.170 | 0.532 | - | 0.105 | 0.522 | - | - |
| x2, Building | - | −0.593 | −0.336 | - | 0.398 | −0.555 | −0.187 | −0.583 | 0.169 |
| x3, Sky | −0.249 | - | 0.577 | −0.193 | 0.343 | 0.490 | −0.175 | 0.298 | 0.490 |
| x4, Floor | 0.474 | - | 0.140 | 0.476 | - | - | 0.494 | - | - |
| x5, Tree | −0.232 | 0.593 | −0.190 | −0.230 | −0.614 | - | −0.212 | 0.281 | −0.570 |
| x6, Road | −0.407 | - | 0.384 | −0.390 | 0.182 | 0.351 | −0.361 | 0.265 | 0.226 |
| x7, Pave | −0.335 | - | −0.336 | −0.355 | −0.254 | −0.244 | −0.349 | −0.138 | −0.292 |
| x8, Ground | 0.140 | 0.272 | - | 0.185 | −0.284 | 0.171 | 0.183 | 0.213 | −0.159 |
| x9, Plant | - | 0.344 | −0.211 | - | −0.326 | - | - | 0.231 | −0.361 |
| x10, Fence | −0.127 | 0.262 | 0.145 | −0.112 | - | 0.258 | −0.142 | 0.346 | - |
| x11, Skyscraper | - | - | 0.296 | - | 0.217 | 0.266 | - | 0.244 | 0.239 |
| x12, Streetlight | −0.184 | - | - | −0.192 | - | - | −0.195 | - | 0.198 |
| x13, Bike | −0.151 | −0.124 | −0.218 | −0.159 | - | −0.259 | −0.160 | −0.346 | - |
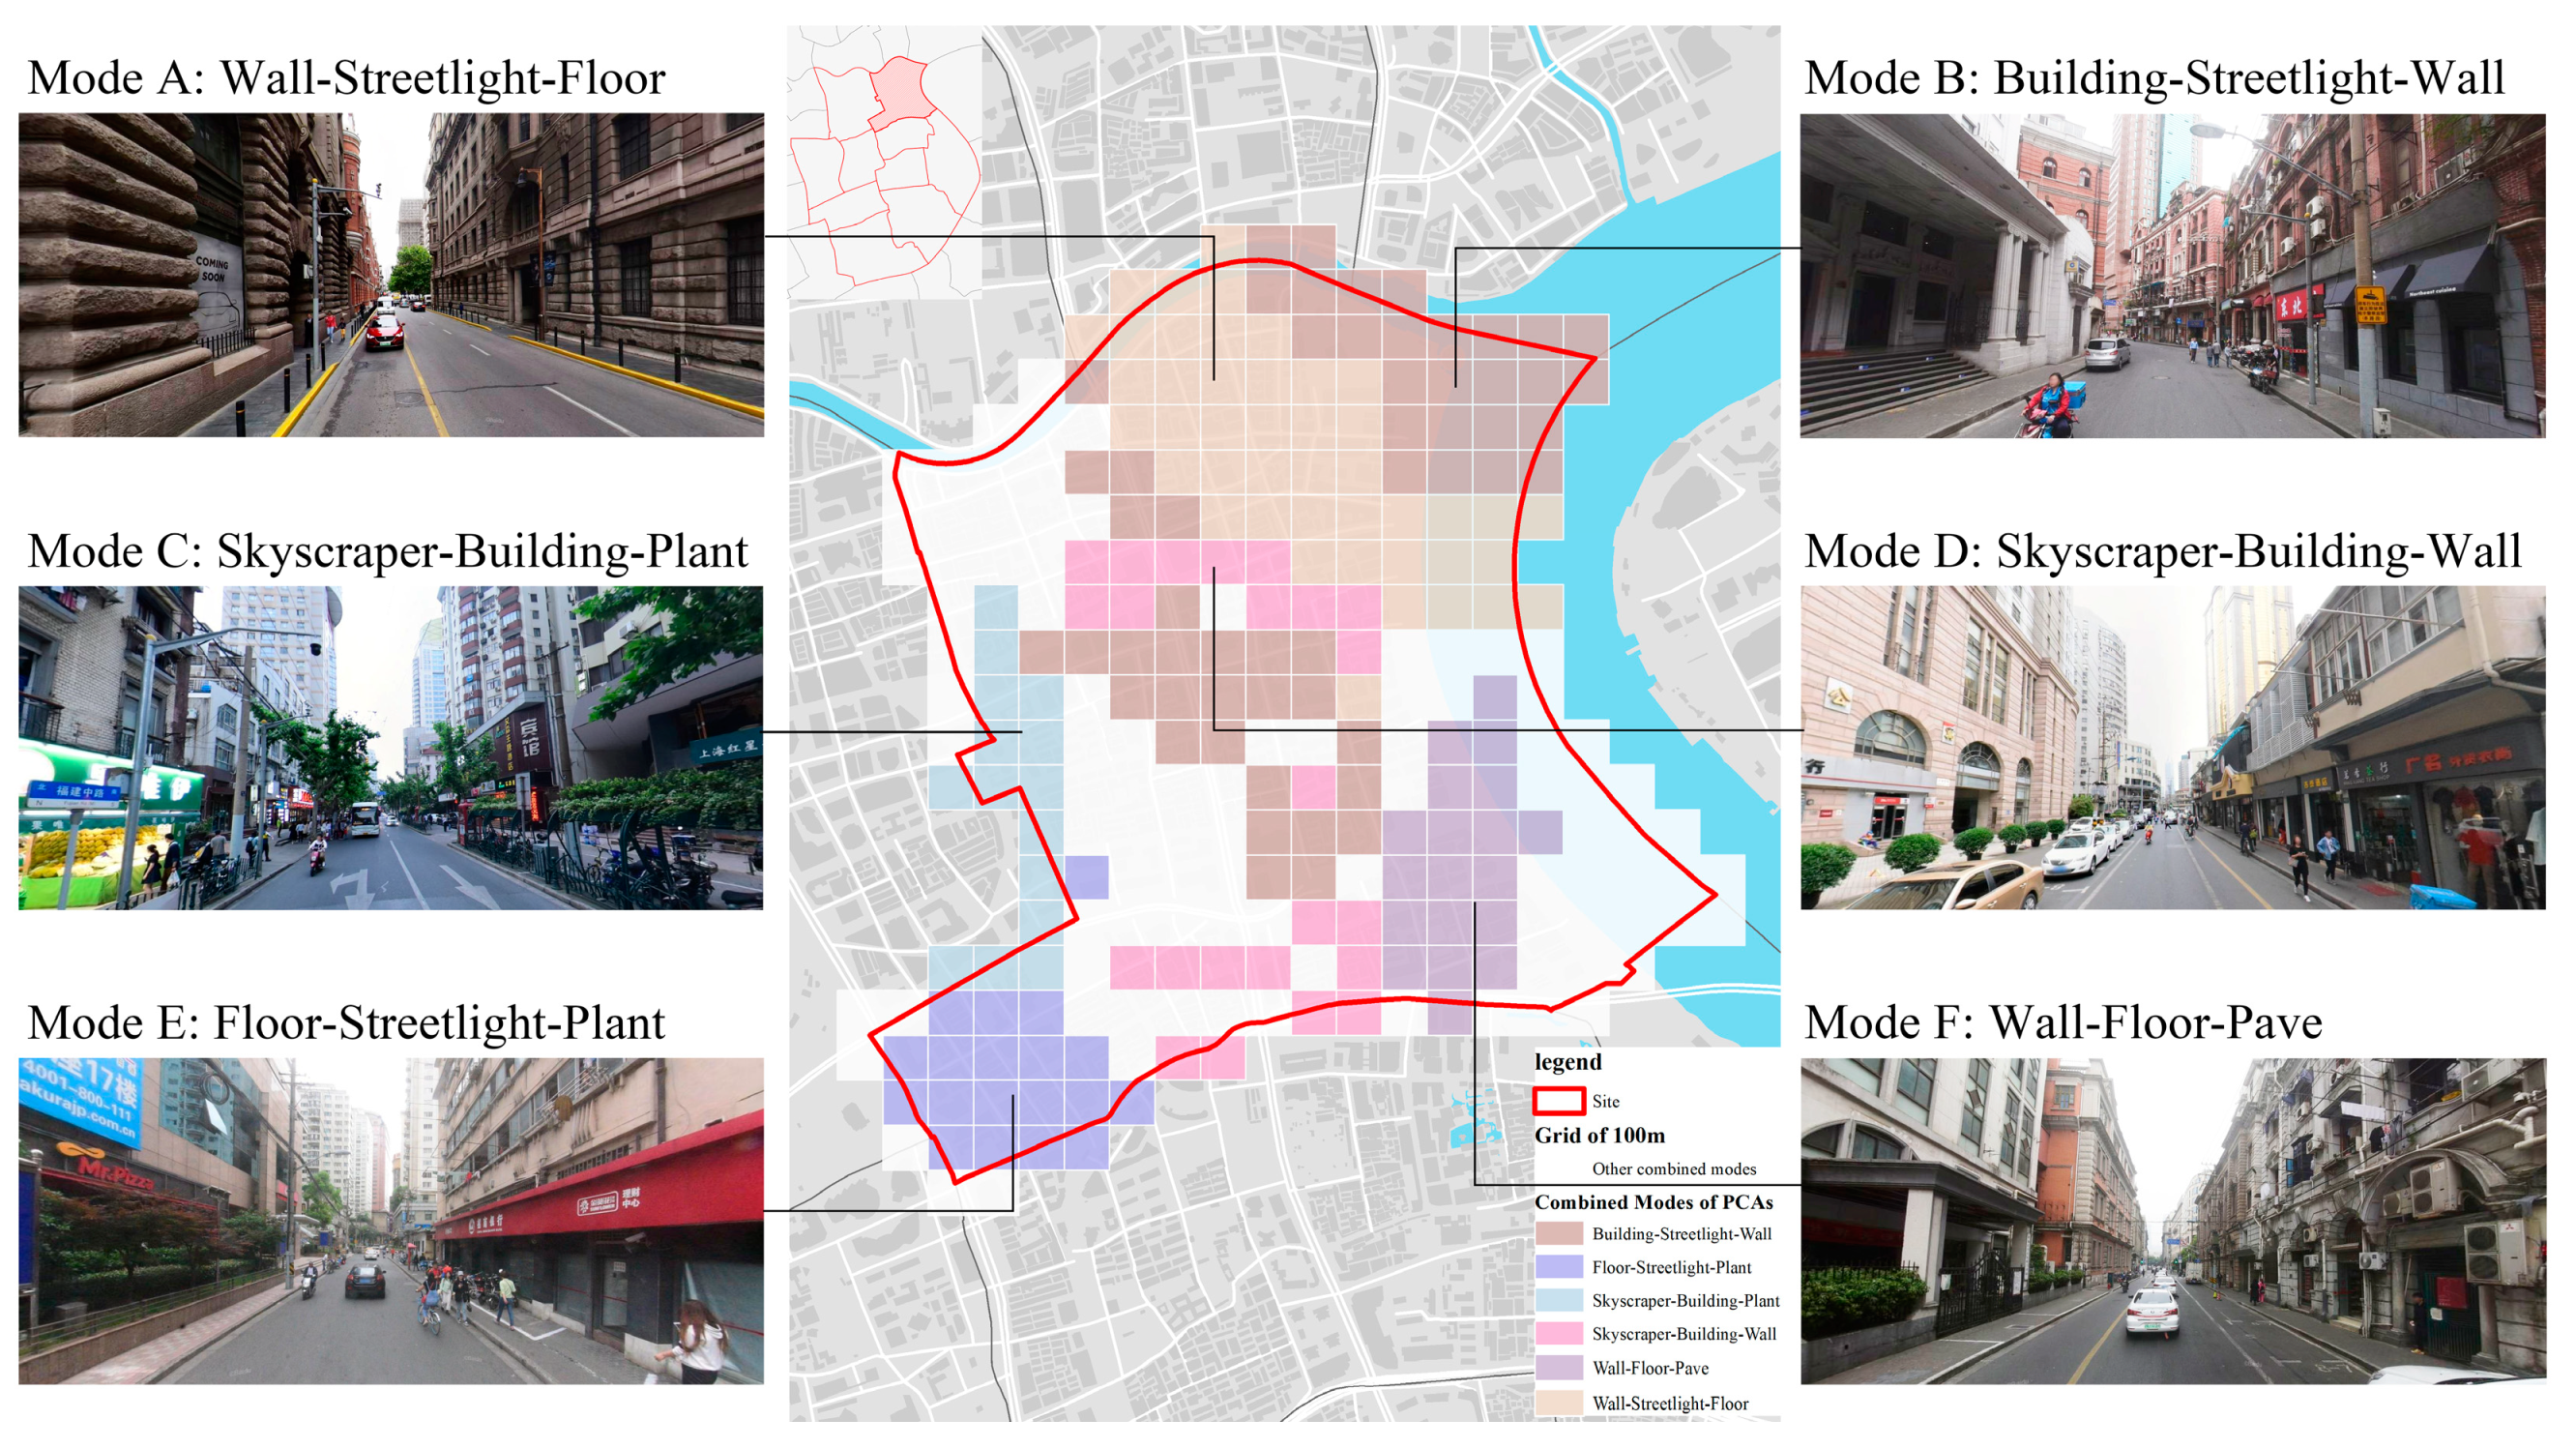
| Combination Modes of PCAs | % | |||
|---|---|---|---|---|
| 1 | Building | Streetlight | Wall | 20.22% |
| 2 | Wall | Streetlight | Floor | 16.48% |
| 3 | Skyscraper | Building | Wall | 8.61% |
| 4 | Floor | Streetlight | Plant | 7.12% |
| 5 | Wall | Floor | Pave | 7.12% |
| 6 | Skyscraper | Building | Plant | 5.62% |
Publisher’s Note: MDPI stays neutral with regard to jurisdictional claims in published maps and institutional affiliations. |
© 2021 by the authors. Licensee MDPI, Basel, Switzerland. This article is an open access article distributed under the terms and conditions of the Creative Commons Attribution (CC BY) license (https://creativecommons.org/licenses/by/4.0/).
Share and Cite
Liu, Y.; Yang, S.; Wang, S. Heterogeneity Study of the Visual Features Based on Geographically Weighted Principal Components Analysis Applied to an Urban Community. Sustainability 2021, 13, 13488. https://doi.org/10.3390/su132313488
Liu Y, Yang S, Wang S. Heterogeneity Study of the Visual Features Based on Geographically Weighted Principal Components Analysis Applied to an Urban Community. Sustainability. 2021; 13(23):13488. https://doi.org/10.3390/su132313488
Chicago/Turabian StyleLiu, Yong, Shutong Yang, and Shijun Wang. 2021. "Heterogeneity Study of the Visual Features Based on Geographically Weighted Principal Components Analysis Applied to an Urban Community" Sustainability 13, no. 23: 13488. https://doi.org/10.3390/su132313488
APA StyleLiu, Y., Yang, S., & Wang, S. (2021). Heterogeneity Study of the Visual Features Based on Geographically Weighted Principal Components Analysis Applied to an Urban Community. Sustainability, 13(23), 13488. https://doi.org/10.3390/su132313488