1. Introduction
In the past decade, a rapid development of vehicle automation has been achieved, which represents a new era of the automotive industry. Although it is still far from fully automated vehicles, vehicles equipped with the SAE Level 3 automation systems (also known as the Conditional Automation System) have been manufactured. The SAE Level 3 automation allows drivers to delegate the longitudinal as well as lateral control and direct their attention away from the supervision of the road ahead to engage in non-driving related tasks (NDRTs) [
1]. Compared with Level 2 automation systems, the greatest progress that the Level 3 automation system has made is that human drivers are not forced to supervise the traffic environment all the time. In addition, the vehicle could implement lane-changes and overtaking by its own judgement. However, due to some technological, ethical and legal factors, drivers have to resume manual control in conditions not yet supported by the automation, which are called system boundaries. The resumption of control from the automation system to the driver is defined as a “takeover” [
2,
3], and the instruction that the system issued to ask for drivers’ resume of control is defined as “TOR” (i.e., takeover request).
Takeovers can be classified into critical takeovers and noncritical takeovers [
4]. Till recently, much of the research on the takeover process has focused on takeovers in critical situations, such as an obstacle on the road ahead [
2,
3,
5] or encountering a sharp curve [
6]. Results have shown that compared to manual driving, drivers’ performance is impaired during the urgent transition of control [
2,
7]. However, less is known about non-critical takeovers, which can be more common than urgent takeovers [
8]. The highway exit is a typical scenario of the non-critical takeover [
9,
10]. Due to the discontinuity of the edgeline road markings and a misunderstanding of the road geometry, the automation system is no longer able to function normally [
11,
12]. Some researchers have conducted field experiments to test the reaction of an automation system towards different edgeline road markings in existing exits ramps, entrance ramps and lane merging areas, etc. [
13]. It has been observed that nearly 25% of existing highway exits will cause the failure of the automation system. As a result of the incompatibility between the remarkable advances of automation and existing highway infrastructure, there is high possibility that drivers must take over the vehicle before they diverge into the ramp of the highway.
While there have been some research setting the deceleration lane prior to the ramp as the takeover scenario, their interests laid on the human-machine interaction’s effect on the takeover performance rather than drivers’ adaption to the current deceleration lane geometric design in the process of takeover. The design criteria of the deceleration lane were based on studies about 50 years ago [
14,
15,
16], in which geometric requirements were calculated by kinematic equations, but they were not able to take the driver behavior during transitions of control from automation to manual driving into account. Due to the reduction or even absence of situation awareness during automated driving, drivers will stay in a “out-of-the-loop” state which can last for a considerable period after takeover. Whether the driver behavior during the “out-of-the-loop” (OOTL) state is in line with the current deceleration lane design remains unknown. Therefore, this paper described a driving simulator study which considered two questions:
Whether drivers’ gaze behavior and driving performance differ between traditional manual driving and automatic driving takeover when diverging into the deceleration lane?
How does different deceleration lane geometric characteristics affect drivers’ gaze behavior and takeover performance?
The following sections outline the current research on the effects of deceleration lane geometric design on traffic safety (
Section 1.1), takeover time budget (
Section 1.2) as well as gaze behavior in automated driving (
Section 1.3). Finally, questions the current study seeks to solve are presented (
Section 1.4).
1.1. Effects of Deceleration Lane Geometric Design on Traffic Safety
The vicinity of the highway deceleration lane is a traditional high–risk area. Considerable studies have identified the interchanges as the highest collision-rate area of the highway [
17,
18]. Specially, most accidents at interchanges have been observed in the deceleration lanes [
19]. To improve traffic safety in deceleration lane, many researchers have endeavored to explore the optimum geometric design of the deceleration lane, particularly on the impact of deceleration lane lengths on safety. Previous research mainly used approaches which included statistical analysis, simulated driving, mathematical modeling as well as field operational test to shed light on the impact of deceleration lane lengths on traffic safety. It was long believed that increasing the length of the deceleration lane would decrease crash rate. Based on accident data, Lundy [
19] found the accident rate would be lower if the deceleration lane was greater than 750–800 ft, thus a longer deceleration lane was recommended. Similarly, Cirillo [
20] concluded that deceleration lane greater than 900 ft would decrease traffic friction effectively. Bared et al. [
21] examined the impact of the deceleration lane by using a negative binomial regression model and found a longer deceleration lane would be more advantageous for traffic safety. However, in the last 20 years, it has been found that a too long deceleration lane could impair the overall safety of the exit. Some studies [
22,
23] showed that an excessively long deceleration lane was likely to lead drivers to accelerate again after decelerating in the initial area of the deceleration lane. Besides, a too long deceleration could be regarded as a potential overtaking lane by aggressive drivers thus cause more weaving maneuvers. Chen et al. [
24] also pointed out that when the length of the deceleration lane exceeded 700 ft, the crash frequency increased with the increment of the deceleration lane. Due to the high crash rate, the optimum length of deceleration lane for traditional driving has attached a large amount of research attention. However, no published research has ever studied whether the deceleration lane length which suits traditional manual driving well is also compatible with the takeover process. Therefore, it’s necessary to study the effects of deceleration lane length on the driver behavior and takeover performance during the relinquishment process from automation.
1.2. Takeover Time Budget
Due to delegating physical control of the vehicle and supervision of the roadway environment to the automation system, the situation awareness of the driver is reduced, and the driver is “out of the loop” [
7]. In such context, after receiving the takeover indication, drivers not only need to look at the roadway environment to gather enough information from the environment and develop sufficient situation awareness [
25], but also correct the perpetual-motor coordination [
26] and plan their maneuver strategy for the future actions [
27], which require time. The time budget of the takeover is defined as the time between the onset of the takeover request (TOR) and the moment when the vehicle would have reached the system boundary assuming no driver response [
4]. Currently, most of the research on the takeover time budget’s effect was based on critical situations. In initial efforts to determine how long the time budget should be, a longer time budget was found to be beneficial to the takeover performance. Damböck et al. [
28] compared drivers’ takeover performance with 4s, 6s and 8s time budgets and found that time budgets longer than 8s may not lead to greater performance. Gold et al. [
2] also found that with a relative short time budget (5 s), drivers’ reaction was faster, but their takeover performance was worse compared with a longer time budget (7 s). Likewise, Mok et al. [
29] reported that few people were able to negotiate the critical situation with 2s time budget, while most drivers in 5 s or 8 s conditions could handle the situation properly. However, few studies examined the effect of the time budget in non-critical takeovers. Eriksson and Stanton [
8] measured drivers’ reaction time in non-critical situations and found it was longer than reaction time had been reported in previous studies. Nonetheless, as a common takeover scenario, the optimal takeover time budget before reaching the highway exit has not been researched yet. Thus, more research is needed to gain a clear understanding of how long the takeover indications should be issued in advance before diverging into a deceleration lane.
1.3. Drivers’ Gaze Behavior
As the emergency of the wearable eye-tracker, gaze related measures have been widely used to measure drivers’ attention allocation [
30], hazard perception [
31,
32] and situation awareness [
25,
33]. Lots of studies have examined the influence of non-driving related tasks (NDRT), automation level as well as the environment on drivers’ gaze behavior in automation. It was reported that the gaze dispersion of drivers would be significantly greater when the driver was not in control of the vehicle compared with manual driving, which was mainly caused by distributing more attention to the area away from the center of the road [
34,
35,
36]. Such diversion of visual attention could affect the gaze-steer, coordination and impair the perceptual-motor control loop, which would increase the risk of takeover. Louw et al. [
37] demonstrated that during automation, drivers would pay more visual attention to the bottom region rather than the road center area, which meant drivers would attach more importance to the dashboard and the automation HMI when they were not in control of the vehicle. Louw and Merat [
36] studied drivers’ gaze dispersion during automation under different fog densities. They found that drivers’ vertical gaze dispersion was significantly greater in the heavy fog scenario but decreased when a visual NDRT existed. However, it’s important to note that the above research only studied drivers’ gaze behavior when the vehicle is in automation, and there was almost no comparison between drivers’ gaze behavior in takeover process and manual driving. Besides, no existing research studied the influence of road geometry on drivers’ gaze behavior in takeover. Thus, this study tends to examine the effect of deceleration lane length and driving modes (takeover and manual driving) on drivers’ gaze behavior.
1.4. Contribution and Innovation of This Study
As mentioned above, the previous research has paid an enormous effort to study how the length of the deceleration lane affect traditional traffic safety and how the takeover time budget affect drivers’ takeover performance. However, little is known about drivers’ takeover behavior under the interaction of different infrastructure geometric design and human-machine interactions. In the context that highway deceleration lane could be a high-frequency area of the takeover, to decrease the latent accidents caused by the incompatibility among the infrastructure, vehicles and humans, drivers’ adaptability to existing geometric design of the deceleration lane under takeover situations must be shed light on. Thus, the main objective of the current study was to examine drivers’ driving performance and gaze behavior under different deceleration lane geometric design and driving conditions. The effects of various deceleration lane lengths and driving conditions (takeover with different time budgets and manual driving) on the takeover time, gaze dispersion, deceleration and trajectory of diverging drivers were investigated. Based on the previous research, two hypotheses were raised:
Hypothesis 1 (H1). It was hypothesized that in the diverging process, takeover of the vehicle would result in worse deceleration maneuvers and trajectory control as well as greater gaze dispersion compared with manual driving. Takeover under longer time budget would increase the reaction time as well as mitigating the negative effect on vehicle control compared with under shorter takeover time.
Hypothesis 2 (H2). It was hypothesized that a relatively longer deceleration lane would be more compatible with the takeover process, which embodies in better longitudinal deceleration strategies and trajectory control.
The aim of the current study was to provide better knowledge of drivers’ adaption to the current deceleration lane geometric design during takeover process. Findings of the current study could help automatic vehicle manufacturers to design specialized takeover strategies for deceleration lanes with different lengths, which can enhance the safety and comfortability of the takeover process.
2. Method
2.1. Participants
Thirty-one participants (22 males, 9 females) took part in this laboratory session. One male driver withdrew halfway because of dizziness. Therefore, results were based on the remaining 30 participants (21 males, 9 females). All participants had at least 2 years’ driving experience (M = 7.17, SD = 4.26) and varied in age between 20 and 48 years (M = 32.03, SD = 8.90). Only three drivers had an experience in automatic driving, but all were limited to Level 1 automation (Adaptive Cruise Control or Lane Keeping Assist). All of them had normal or corrected-to-normal vision and valid driver licenses. Participants were compensated with ¥100/h.
2.2. Apparatus, Automation System and the Non-Driving Related Task (NDRT)
A fixed-based driving simulator of the Department of Transportation Engineering at Tongji University was used for the experiment, as shown in
Figure 1. The hardware includes an adjustable seat, Logitech G27 Driving Force GT steering wheel with force feedback, a throttle pedal as well as a brake pedal. The driving scenario was presented via three 50-inch TVs (1920 × 1080 pixels each). The software used to design scenarios and run experiments was
SCANeRTM studio. The automation system of the vehicle in the virtual scenario was programmed to simulate SAE Level 3 automation, which could provide longitudinal and lateral control as well as performing lane changes and overtaking slower vehicles. Users could set the maximal speed, the time headway and the itinerary of the autonomous vehicle. The overtaking behavior was determined by another coefficient, which could decide the threshold of the speed gap between the ego vehicle and the preceding vehicle which triggered overtaking. Participants could press one button on the steering wheel to activate the automation system and press another to deactivate the system. When the automation system was activated, the maximal speed of the vehicle was set to 100 km/h. During this process, drivers could totally delegate the control of the vehicle and the supervision of the traffic environment to the system, and the vehicle would operate automatically following the preset itinerary. Once the vehicle reached the preset point of the takeover instruction, TOR in the form of a piece of auditory cue would be sent out through the loudspeaker of the TVs. The auditory messages started with a beep, then “please take over” in the form of a digitized human voice would follow. The TOR lasted about 3s. Its loudness and speed had been tested before the formal experiment to ensure it could be heard and understood by normal people.
To ensure the participants totally engaged in the NDRT until the takeover request, a console game- ‘doodle jump’, which required the player to concentrate balancing the game character, was set as the NDRT. An Apple iPhone device was used to present the NDRT. In order to encourage participants to devote more attention to the game, an incentive mechanism was utilized. Participants were told once their highest score ranked in the top five among all, they would get paid another ¥50. However, they were also instructed to take over the vehicle and be responsible for the safe driving as soon as the take-over request occurred. The Tobii Pro Glasses 2 eye-tracker (manufactured by Tobii Ltd., Stockholm, Sweden) was utilized to record the participants’ eye movements during the experiment process. The sampling rate of the eye-tracking system was 50 Hz. The corresponding software, Tobii Pro Lab, was used to collect and analyze eye-tracking data.
2.3. Scenarios and Experimental Design
The current experiment used a two-factor experiment design with the deceleration lane length and takeover time budget as independent variables. In order to eliminate the effect of other factors, a within-subjects design was chosen. For all scenarios, the geometric design of the mainline was identical. The design speed of the highway mainline was 100 km/h. There was no curve in the mainline and the vertical slope of the mainline is equal to 0. The cross-section of the mainline had a divided carriageway with a greenery lane of 2.5 m. Each carriageway had two lanes (3.75 m wide) and a paved shoulder (3 m wide).
The ego vehicle would keep staying in the right lane, and surrounding traffic containing six cars was arranged in the left lane. The traffic in current study aimed to promote the fidelity of the scenarios, so it would keep operating on the left lane and its trajectory wouldn’t have any conflict with the ego vehicle. The speed of the surrounding traffic was 100km/h, which was equal to the automated vehicle, and the density was five vehicles per kilometer. The ego vehicle was exactly at the center between two surrounding vehicles when it was at the autonomous mode, which meant the distance between the ego vehicle and the nearest surrounding vehicle was about 100 m. Considering the latent disturbance towards drivers if the surrounding traffic also diverged into the deceleration lane, the surrounding traffic would pass the exit instead of diverging with the ego vehicle. The traffic conditions were all the same across scenarios in the current study.
Three geometries of the highway deceleration lane with different lengths were designed. The deceleration lanes were single-lane. According to Chinese policy [
38], the deceleration lane consists of the taper zone and the deceleration zone. The taper zone measures from the starting point of the dotted line to the point where the width of the taper is exactly equal to a normal lane, while the deceleration zone measures from the ending point of the taper zone to the point of the painted nose, as shown in
Figure 2. To ensure the range of the deceleration lane length in this study covered the majority of the existing deceleration lanes, the limit length of the 100 km/h design speed was defined as the lower limit of the range, and the upper limit of the range was set through a geo-based survey. The survey aimed to obtain the distribution range of existing deceleration lane lengths, so that a proximate upper limit of existing deceleration lane length could be known. This survey was conducted via Google Earth, the lengths of existing highway deceleration lanes could be obtained by the distance measurement of the software. Considering that the geometric characteristics of the highway varies with the terrain, to make the result of the survey as comprehensive as possible, deceleration lanes in various terrains need to be included in the survey. While the terrain of Zhejiang Province varies from north to south, which is plain in the north and mountainous in the south. Hence, three north-south-going highways in Zhejiang Province, i.e., G15, G92 and G60, were selected as the objects of the survey. A total of 109 single-lane deceleration lanes with tapered design in three highways above were surveyed, and the Cumulative Distribution Function of the deceleration lane length was obtained, as shown in
Figure 3. It demonstrated that the 95th percentile of the distribution was approximate 335 m (92.7% of deceleration lanes samples were under 305 m, while 97.2% of the samples were under 335 m). The 95th percentile of the distribution, which could represent the majority of the samples, was defined as the upper limit of the deceleration lane length range. Thus, three deceleration lane lengths were selected, which were 215 m (taper zone 90 m+ deceleration zone 125 m), 275 m (taper zone 115 m+ deceleration zone 160 m), 335 m (taper zone 140 m+ deceleration zone 195 m) respectively. Each deceleration lane had a single lane (3.5 m wide). A loop ramp was set after the deceleration lane, and the curve radius was 70 m. A 40 km/h speed limit sign was erected at the end of the deceleration lane to notice drivers the speed limit on the ramp.
For this study, two different takeover time budgets were selected: 5 s (a relatively shorter time budget) and 8 s (a relatively longer time budget) [
1]. It meant that since the onset of the TOR, the vehicle would arrive at the starting point of the taper zone in 5s or 8s if it maintained its initial speed. In another word, the onset point of TOR was respectively about 139 m under 5 s time budget condition and 222 m under 8 s time budget condition to the starting point of the taper zone. Besides, a baseline-group was defined as a reference group without automated system. Participants went through identical tracks but had to drive manually all the time. Consequently, each participant experienced nine scenarios (three deceleration lane lengths × three driving conditions) scenarios. To alleviate the order effect, the sequence of the scenarios was counterbalanced across participants via the randperm function of Matlab to avoid bias.
2.4. The Experiment Procedure
At the start of the participants’ visit, they were asked to sign a consent form and complete a demographic questionnaire which gathered information regarding age, gender and driving experience. Next, participants were briefed regarding the experiment, instructed how to operate the driving simulator and how to turn ON and turn OFF the automation system. They were told that they could utterly concentrate on the NDRT and take their feet away from pedals when the automation system was activated. However, once the takeover instruction was issued, they were required to relinquish the NDRT immediately, ensure the status of the vehicle and press the takeover button on the steering wheel to take over the control. After that, participants were asked to wear the eye-tracker and then the eye-tracker was calibrated. Subsequently, participants were required to complete a 7 min practice drive. The autonomous driving and manual driving were alternate in the practice drive and the driver experienced three takeovers in total. During the automation, participants were asked to get familiar with the NDRT. After the practice drive, the eye-tracking data and the driving simulator data were checked to ensure the devices function normally. Then, participants took the test drive which contained nine scenarios. For takeover-groups, the simulation initiated with a 4 min drive with the automation system on. Once the takeover instruction was sent out, participants needed to take over as soon as possible, then they would manipulate the vehicle to exit the highway via the deceleration lane. For baseline-groups, participants completed the whole drive without the support of automation system.
2.5. Dependent Variables
To assess the mental load and driving performance of the drivers, indicators including takeover time, SD of gaze pitch, SD of gaze yaw, maximum longitudinal deceleration and diverging location were utilized. The transition of control contained two different phases—motor readiness and mental readiness. Motor readiness reflected the physical reaction of the driver, while mental readiness reflected the recovery of situation awareness and the ability to make decisions [
3,
39]. Takeover time was a direct measurement to represent the motor readiness of drivers [
40], which was defined as the gap between the onset of the takeover instruction and the moment when the participant resumed the manual control via the steering wheel or the brake pedal. The threshold values of the maneuver were 2°steering wheel change or 10% brake pedal application [
2,
5]. SD of gaze pitch and SD of gaze yaw were used to evaluate the mental readiness [
36,
41]. The window of the gaze data began at the moment when the driver’s gaze point returned to the road ahead for the first time after the takeover instruction and ended at the moment when the vehicle exited the deceleration lane.
To quantify drivers’ manipulation ability, the vehicle’s maximum longitudinal deceleration and diverging location were used in the current study for longitudinal and lateral maneuver assessment. Here, four sites were defined, as shown in
Figure 4. Site A was the location where the driver resumed manual control, site B was the location where the vehicle was just totally within the deceleration lane, site C was the end point of the dotted line and site D was the end of the deceleration lane. Maximum longitudinal deceleration between site A and site B (
), site B and site D (
) were analyzed, respectively. The variable used to represent the diverging location was the distance margin, which was the distance between site B and site C [
23,
42,
43].
2.6. Dataset and Statistical Analysis
Each participant experienced nine scenarios. Although some participants managed to completely diverge into the deceleration lane until they had exceeded the end point of the taper zone, they were still regarded to take over the vehicle successfully for the current research. A total of 270 (9 × 30) scenarios were recorded via the driving simulation software. However, the eye-tracking data of two participants was not integrated due to the failure of the eye-tracking system. To avoid bias, the eye-tracking data of these two participants were excluded. A total of 252 (9 × 28) pieces of eye-tracking data were recorded. All eye-tracking data was transformed by averaging every five adjacent samples to change the sampling rate from original 50 Hz to 10 Hz.
The data were treated by MatlabR2018a and analyzed by IBM SPSS Statistics 23. The result of the analysis was represented by Origin2017. Considering the prerequisite of conducting Analysis of Variance (ANOVA) analysis, Kolmogorov-Smirnov tests were implemented to examine the normality of the data. The results showed that and weren’t normally distributed and presented a positive skew. Logarithmic transformations were conducted on these data to ensure the application of ANOVA. The descriptive statistics and figures in the Results section were based on the original data, while the ANOVA tests were conducted based on the transformed data. For all independent variables except takeover time, a 3×3 repeated-measures ANOVA was conducted to compare measurements in three conditions (TOR-time = 5 s, TOR-time = 8 s, manual driving) and three deceleration lane lengths (215 m, 275 m, 335 m). Takeover time was compared via a 2 × 3 repeated measures ANOVA. The α-value for the statistical significance was 0.05, and the partial-eta squared was utilized as the effect size statistic. If the sphericity was proved to be violated via the Mauchly’s test, degrees of freedom were corrected (Greenhouse-Geisser). Post-hoc pairwise comparisons were corrected via Bonferroni.
4. Discussion
Although there has been a great quantity of research on the human-vehicle interaction in automation takeover process, little is known about the drivers’ adaptability to existing road geometric design when they reacquire control of the vehicle. Based on the deceleration lane scenario, the current study examined the differences of drivers’ gaze behavior and driving performance between takeover conditions with various take over time budget and manual driving condition, and how the deceleration lane length affects drivers’ gaze behavior and driving performance.
The analysis of the takeover time showed that it took drivers approximately one more second to resume control in 5 s TOR condition compared with in 8 s TOR condition. This result was highly in accord with the model proposed by Gold et al. [
44], which attributed 0.33 s increase in takeover time per 1 s increase in time budget to time budgets between 5 and 7.8 s. Nonetheless it has been evident that increasing the TOR-time would lead to a longer takeover time, however, almost all of them are based on urgent takeovers [
2,
6]. The only study based on non-urgent takeover condition considered two uncommon time budgets (2 s and 30 s), and it put its emphasis on drivers’ trust on the automation system instead of the effect of the time budget. The results of the current study indicate that even in a non-critical diverging scenario, drivers also take over faster when given a shorter time budget compared a longer time budget. A longer takeover time can be regarded as an indication of better takeover performance, because the driver takes more time to regain situation awareness before maneuver [
45].
It was found that drivers had lower SD of gaze yaw and SD of gaze pitch in manual driving compared with both takeover conditions. Although some previous studies have reported that lower horizontal gaze dispersion is an indication of high cognitive demand [
45,
46,
47], this doesn’t mean the result of the current research has discrepancy with them. These previous studies measured drivers’ gaze dispersion when the automation system was activated, drivers were required to supervise the environment while executing the NDRT at the same time. While the current study analyzed drivers’ gaze behavior data in the next few seconds after drivers’ regaining control. The significant higher gaze fluctuation of takeover conditions was probably due to the recovery of situation awareness. When drivers were taking the NDRT, their eyes, hands and feet were all off the driving task and they were completely in an “out-of-the-loop” state [
36,
37]. Once drivers regained control, they must try their best to gather visual information in the environment and extract the most important information while removing distracting information [
48]. The search process which helps to rebuild situation awareness causes the phenomenon that drivers’ gaze fluctuation is higher compared with manual driving. Notably, a high gaze fluctuation may correlate with higher number of collisions [
49]. According to this result, it’s essential to support a guidance for drivers’ visual search in the takeover process. For example, audio cues about the traffic conditions around may contribute a lot to decrease drivers’ visual load. In addition, some superior auxiliary techniques which can help drivers fix at more important information, such as augmented reality, may be advantageous for the rebuilding of situation awareness [
50].
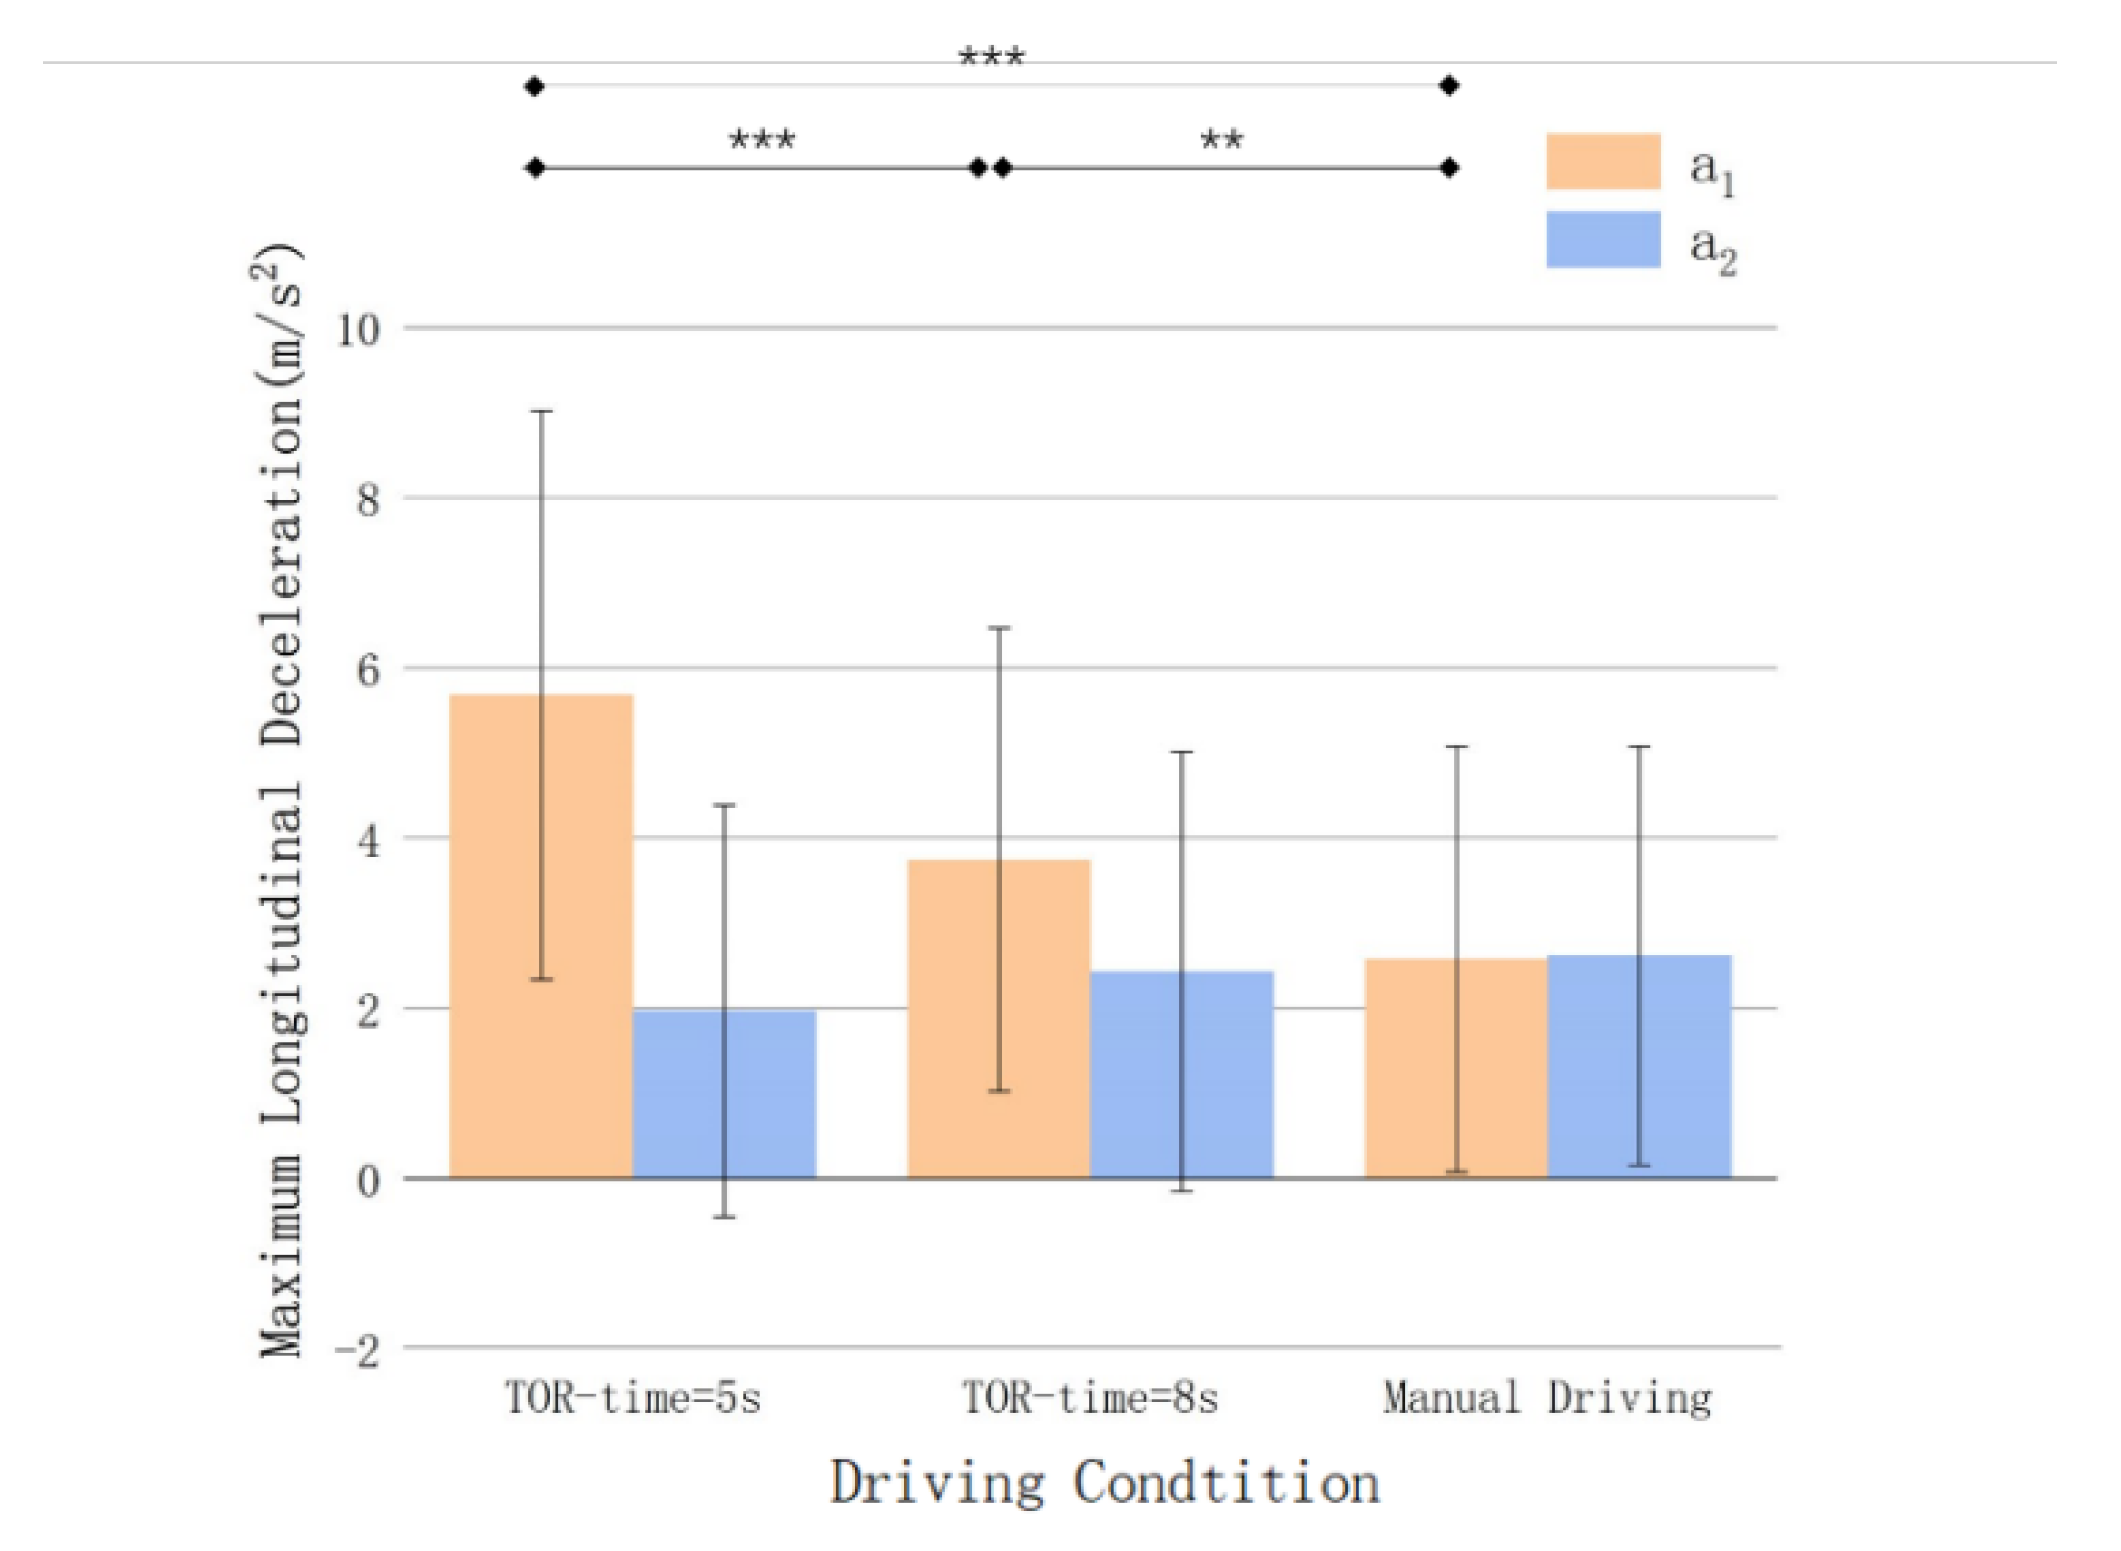
With regards to the maximum longitudinal deceleration, results varied depending on road segments. Post-hoc Bonferroni tests showed that
under three Driving Conditions were significantly different with each other, i.e.,
, while no significant main effect of Driving Condition was found on
. Some previous studies reported that hard braking is an indication of the lack of situation awareness, which is always adopted by out-of-loop drivers to acquire longer time for themselves to restore situation awareness [
2,
3,
40]. However, in the mainline near the deceleration lane, braking hard could be a high-risk maneuver which may lead to serious rear-end collisions [
42]. Even facing no critical event in the current study, drivers still tended to brake harder under shorter time budget condition, such a phenomenon demonstrates that longer time budget is needed to ensure the stability of the takeover process in highway exit. However, excessive time budget is possible to arouse drivers’ distrust [
51,
52] in automation system and intervene surrounding traffic. Hence, future studies should be done to determine the optimal takeover time budget in highway exit. Besides, it’s also worth considering the solution to this problem from the aspect of the systematic optimization. A set of systematic pre-maneuvers in the process of approaching the deceleration lane before drivers’ takeover, such as a decline of the speed in a gentle gradient, which ensures a lower initial speed at the moment of takeover, can be utilized by vehicle manufacturers to reduce a passive excessive deceleration by drivers in the mainline.
It was found that 215 m deceleration lane caused a significantly higher
compared with 335 m deceleration lane, while 275 m deceleration lane caused a significantly higher
compared with 335 m deceleration lane. The result is in line with some previous studies about manual driving behavior in the deceleration lane, which indicated that short deceleration lanes are likely to lead to rapid speed changes on the mainline [
53,
54]. The early deceleration increases the differential speeds between diverging vehicles and through traffic, which could lead to dangerous interactions [
24,
55]. Thus, a longer deceleration is beneficial to maintain the speed coordination between diverging vehicles and through traffic. However, it’s conspicuously impossible to reconstruct all the existing short deceleration lanes to meet the requirement of the takeover process. A feasible way is to formulate dedicated takeover schemes for deceleration lanes with different lengths. For example, according to the results of the current study, a longer takeover time budget could counterbalance the negative effect of a short deceleration lane on
, then the time budget should be prolonged accordingly when facing a short deceleration lane compared with a long one. It’s not hard to explain why a 275 m deceleration lane caused a significantly higher
compared with a 335 m deceleration lane, because, with the decrease of the deceleration lane length, drivers must adopt fiercer braking maneuver to ensure the vehicle can enter the ramp at a safe speed. Such tendency is not consistent for 215 m deceleration lane, although not statistically significant,
under 215 m deceleration lane is obviously lower than 275 m deceleration lane. This interesting result can be explained by the excessive deceleration on the mainline in 215 m deceleration lane condition. It has been well-established that vehicles finish the deceleration process in two stages: one is in the mainline before the taper, the other is in the deceleration lane [
14,
56,
57]. With regard to the 215 m deceleration lane condition, due to the excessive deceleration in the first stage, less deceleration was needed in the second stage. Thus,
was determined by the deceleration lane length and the deceleration adopted in the first stage synthetically.
Some previous studies found late transferring into the deceleration lane had a negative effect on the control of the vehicle [
23,
42,
58]. Although drivers’ reaction was faster under 5 s TOR-time condition compared with 8 s TOR-time condition according to
Section 3.1, it still couldn’t compensate and caused a smaller distance margin. As for the effect of Deceleration Lane Length, significantly smaller distance margin was found in 215 m deceleration lane length condition compared with the other two conditions, while the distributions of the distance margin in 275 m and 335 m deceleration length condition were alike. It suggested that there is probably a ceiling effect of Deceleration Lane Length on the lateral control of the vehicle. As the increase of the deceleration lane length, the marginal effect it has on the distance margin could reduce. This result indicates that for the future highway geometric design, increasing the deceleration lane length blindly can be a low cost-effective solution to increase drivers’ takeover performance. Only the promotion of the infrastructure be followed by corresponding optimization of human-machine interfaces, can the effect achieve the maximum.
As with all studies, there are some limitations which must be acknowledged. Firstly, to study the effect of the deceleration lane length on takeover performance, other factors may interfere with the result were excluded, e.g., ego-lane traffic. Additional research is needed to understand how these factors affect the takeover performance synthetically. In addition, due to the limitations of the device, among all psychophysiological measures, only drivers’ gaze behavior was taken into consideration in the current study. However, drivers’ mental states correlate with multiple psychophysiological measures. Some advanced techniques which can reflect drivers’ subtle inner changes, such as GSR [
47], EEG [
59] and fNIRS [
60], can be considered in future studies to get a better knowledge of drivers’ comprehensive psychophysiological state in takeover process at the highway exit.
5. Conclusions
The current study was based on highway exit scenarios, and systematically investigated the effects of driving conditions (different takeover time budgets and manual driving) and deceleration lane geometric designs on drivers’ gaze behavior as well as vehicle control characteristics. The results indicated that in diverging process, compared with manual driving, drivers’ horizontal and vertical gaze fluctuation increased, vehicle’s maximum longitudinal deceleration in the mainline increased, distance margin reduced under takeover condition. With a longer time budget, drivers’ takeover time tended to be longer and the vehicle’s maximum longitudinal deceleration in the mainline decreased, while the distance margin was larger. However, the deceleration lane length seemed to only influence vehicle control. With longer deceleration lane length, vehicle’s maximum longitudinal deceleration in the mainline tended to decrease, while there was no conspicuous trend of the maximum longitudinal deceleration in the deceleration lane. Meanwhile, distance margin under 215 m deceleration lane condition was smaller than under 275 m and 335 m condition. These results suggested compared with manual driving, drivers’ situation awareness and driving performance were impaired under takeover condition in diverging process, while a longer time budget could alleviate the impairment. Longer deceleration lane could benefit vehicle control, however, its marginal effect reduced as the increase of deceleration lane length.
While human-machine interactions have continuously gotten optimized to enhance the takeover safety, the compatibility between the takeover process and existing road geometric designs is another question worth considering. Findings of the current study could give inspirations to automated vehicle manufacturers on designing dedicated takeover schemes when facing different deceleration lane lengths.


