Article

An Approach towards IoT-Based Predictive Service for Early Detection of Diseases in Poultry Chickens

by
Ghufran Ahmed
1,†,
Rauf Ahmed Shams Malick
1,†,
Adnan Akhunzada
2,†,
Sumaiyah Zahid
1,†,
Muhammad Rabeet Sagri
1,† and
Abdullah Gani
2,*,†
1
School of Computing, National University of Computer and Emerging Sciences, Karachi 75030, Pakistan
2
Faculty of Computing and Informatics, University Malaysia Sabah, Kota Kinabalu 88400, Malaysia
*
Author to whom correspondence should be addressed.
These authors contributed equally to this work.
Sustainability 2021, 13(23), 13396; https://doi.org/10.3390/su132313396
Submission received: 18 September 2021 / Revised: 4 November 2021 / Accepted: 16 November 2021 / Published: 3 December 2021
(This article belongs to the Special Issue Industrial Internet of Things (IIoTs) and Industry 4.0)

Abstract

:
The poultry industry contributes majorly to the food industry. The demand for poultry chickens raises across the world quality concerns of the poultry chickens. The quality measures in the poultry industry contribute towards the production and supply of their eggs and their meat. With the increasing demand for poultry meat, the precautionary measures towards the well-being of the chickens raises the concerns of the industry stakeholders. The modern technological advancements help the poultry industry in monitoring and tracking the health of poultry chicken. These advancements include the identification of the chickens’ sickness and well-being using video surveillance, voice observations, ans feces examinations by using IoT-based wearable sensing devices such as accelerometers and gyro devices. These motion-sensing devices are placed over a chicken and transmit the chicken’s movement data to the cloud for further analysis. Analyzing such data and providing more accurate predictions about chicken health is a challenging issue. In this paper, an IoT based predictive service framework for the early detection of diseases in poultry chicken is proposed. The proposed study contributes by extending the dataset through generating the synthetic data using Generative Adversarial Networks (GAN). The experimental results classify the sick and healthy chicken in a poultry farms using machine learning classification modeling on the synthetic data and the real dataset. Theoretical analysis and experimental results show that the proposed system has achieved an accuracy of 97%. Moreover, the accuracy of the different classification models are compared in the proposed study to provide more accurate and best performing classification technique. The proposed study is mainly focused on proposing an Industrial IoT-based predictive service framework that can classify poultry chickens more accurately in real time.

1. Introduction

Poultry chickens are a major contributor towards the fulfillment of the demand for high-protein and low-fat food around the world. The poultry industry has been fulfilling the demands of the chickens’ meat and their eggs for the last hundreds of decades [1]. The increase in the demand for chicken poultry has also raised the health quality of the chicken as an important concern of the consumer market. The welfare of the animal is highly concerned towards the quality of the poultry products as well as the consumer’s health. Good animal welfare always improves the health of the poultry products by reducing the disease rate within the poultry chickens and, hence, in the poultry products. The chickens have a tendency to spread illness within their respective flocks and even to entire poultry farms, resulting in mass losses of the poultry industry [2]. The losses and spread of a disease in poultry chickens can be reduced by the early detection of sick chickens through labeling or classifying individuals based on their behaviors.
The use of the modern advancements provide the possibilities to track, monitor, and detect and predict a chicken’s sickness and well-being early by observing and sensing behaviors in a poultry farms. The latest technologies provide a continuous and automated monitoring of the poultry chickens. These poultry monitoring techniques include sound analysis [3], which can automatically monitor the chicken’s behavior without direct interaction with the chicken’s body. The wearable sensing devices [4] help in the autonomous identification and tracking of the chicken’s location and the movement of individuals in the real time with radio-frequency identification devices. The surveillance of poultry farms through image processing [5] is another technological advancement to identify the activity behaviors and early detection of the disease. All the technological advancements may track and monitor the groups of poultry chickens or individuals.
The recent advancement in wearable sensing devices for poultry farms collects the chicken’s activity data [6] using accelerometers. Figure 1 provides the graphical representation of monitoring and tracking the poultry chickens by collecting their movement data. The activities observed include the dustbathing, pecking, and preening behaviors of the chicken within poultry farms. Ectoparasites reside on the surface of the chicken’s body and can cause stress and affect the productivity of laying eggs and health of the chickens [7]. The effect of ectoparasites on poultry chicken can infest the flocks. Ectoparasites are imposed by researchers to observe and analyze the activity behavior of the poultry chickens. The behavioral activity of sick and healthy chickens provide significant evidence of the difference between the behavior of chickens without ectoparasites and with ectoparasites. The study [6] provides the labeled dataset and validation technique of the collected dataset.
Generative Adversarial Networks (GANs) provides the generative modeling technique using deep learning. A GAN is an unsupervised learning in machine learning that discovers and automatically learns the regularities or patterns of the provided dataset such that the model can generate the new data records that may be dropped or drawn from the provided dataset. The GAN frames the problem as a supervised learning problem with further divisions: the training of the generator model to generate new data records and the discriminator model to classify as original data records or as synthetic (generated) data records. The training of these models continues until the discriminator model incorrectly classifies more than 50% of its prediction. The deep generative models are used to provide the probability distribution of the dataset. It is a challenging problem to generate the probability distribution from a tabular dataset. Conditional Tabular Generative Adversarial Networks (CTGAN) [8] have been implemented in the study to provide the deep generative model to extrapolate the labeled dataset [6]. This tabular probability distributed dataset will help in our study to predict the sick or healthy chicken using machine learning classification techniques.
The recent computational advancements in sensing technologies provides the possibility to classify and predict the healthiness or sickness of the individual. Machine learning models are diversified with the tendency to learn whether the data are statistical, probabilistic, continuous, or discrete in nature. The machine learning supervised algorithms [9] and deep learning models such as TabNet [10] are used to build predictive models with a capability to predict the resulting output more accurately. The classification techniques are capable of predicting a diversified range of applications such as anomaly detection [11], fraud detection [12], customer buying behavior [13], as well as disease modeling [14]. Most of the applications of the machine learning classification models adopt the supervised learning techniques rather than the unsupervised. In supervised learning, the input data provided to the classification model are already labeled, and the model needs to predict the unlabeled dataset based on the similarities of the classification class [15]. The machine learning classification techniques are used to provide predictive models that can provide the labeling of the dataset in a more accurate way. The IoT-based predictive classification services help in identifying the behavior of the receiving data such as the poultry chickens’ sickness or well-being. The supervised learning algorithms such as Nearest Neighbour, Decision Tree, Random Forest, Naive Bayes, and Support Vector Machine are applied in this study to classify the poultry chicken using an IoT-based predictive service.
Our contributions are more focused on modeling an IoT-based predictive service that helps the poultry industry in early detection of sick chickens more accurately in a real-time manner. The proposed study achieves the following:
Implements the CTGAN [8] deep generative model to overcome the class imbalance problem. Moreover, the dataset available by [6] is not enough to train machine learning and deep learning models to classify sick and healthy poultry chickens;
Implements the supervised machine learning algorithms such as Nearest Neighbour, Decision Tree, Random Forest, Naive Bayes, Support Vector Machine, and deep learning techniques such as TabNet [10] on the chickens’ synthetic movement data generated using CTGAN [8] to classify the poultry chicken with better accuracy;
Provides a performance comparison of some machine learning and deep learning models to classify the poultry chickens;
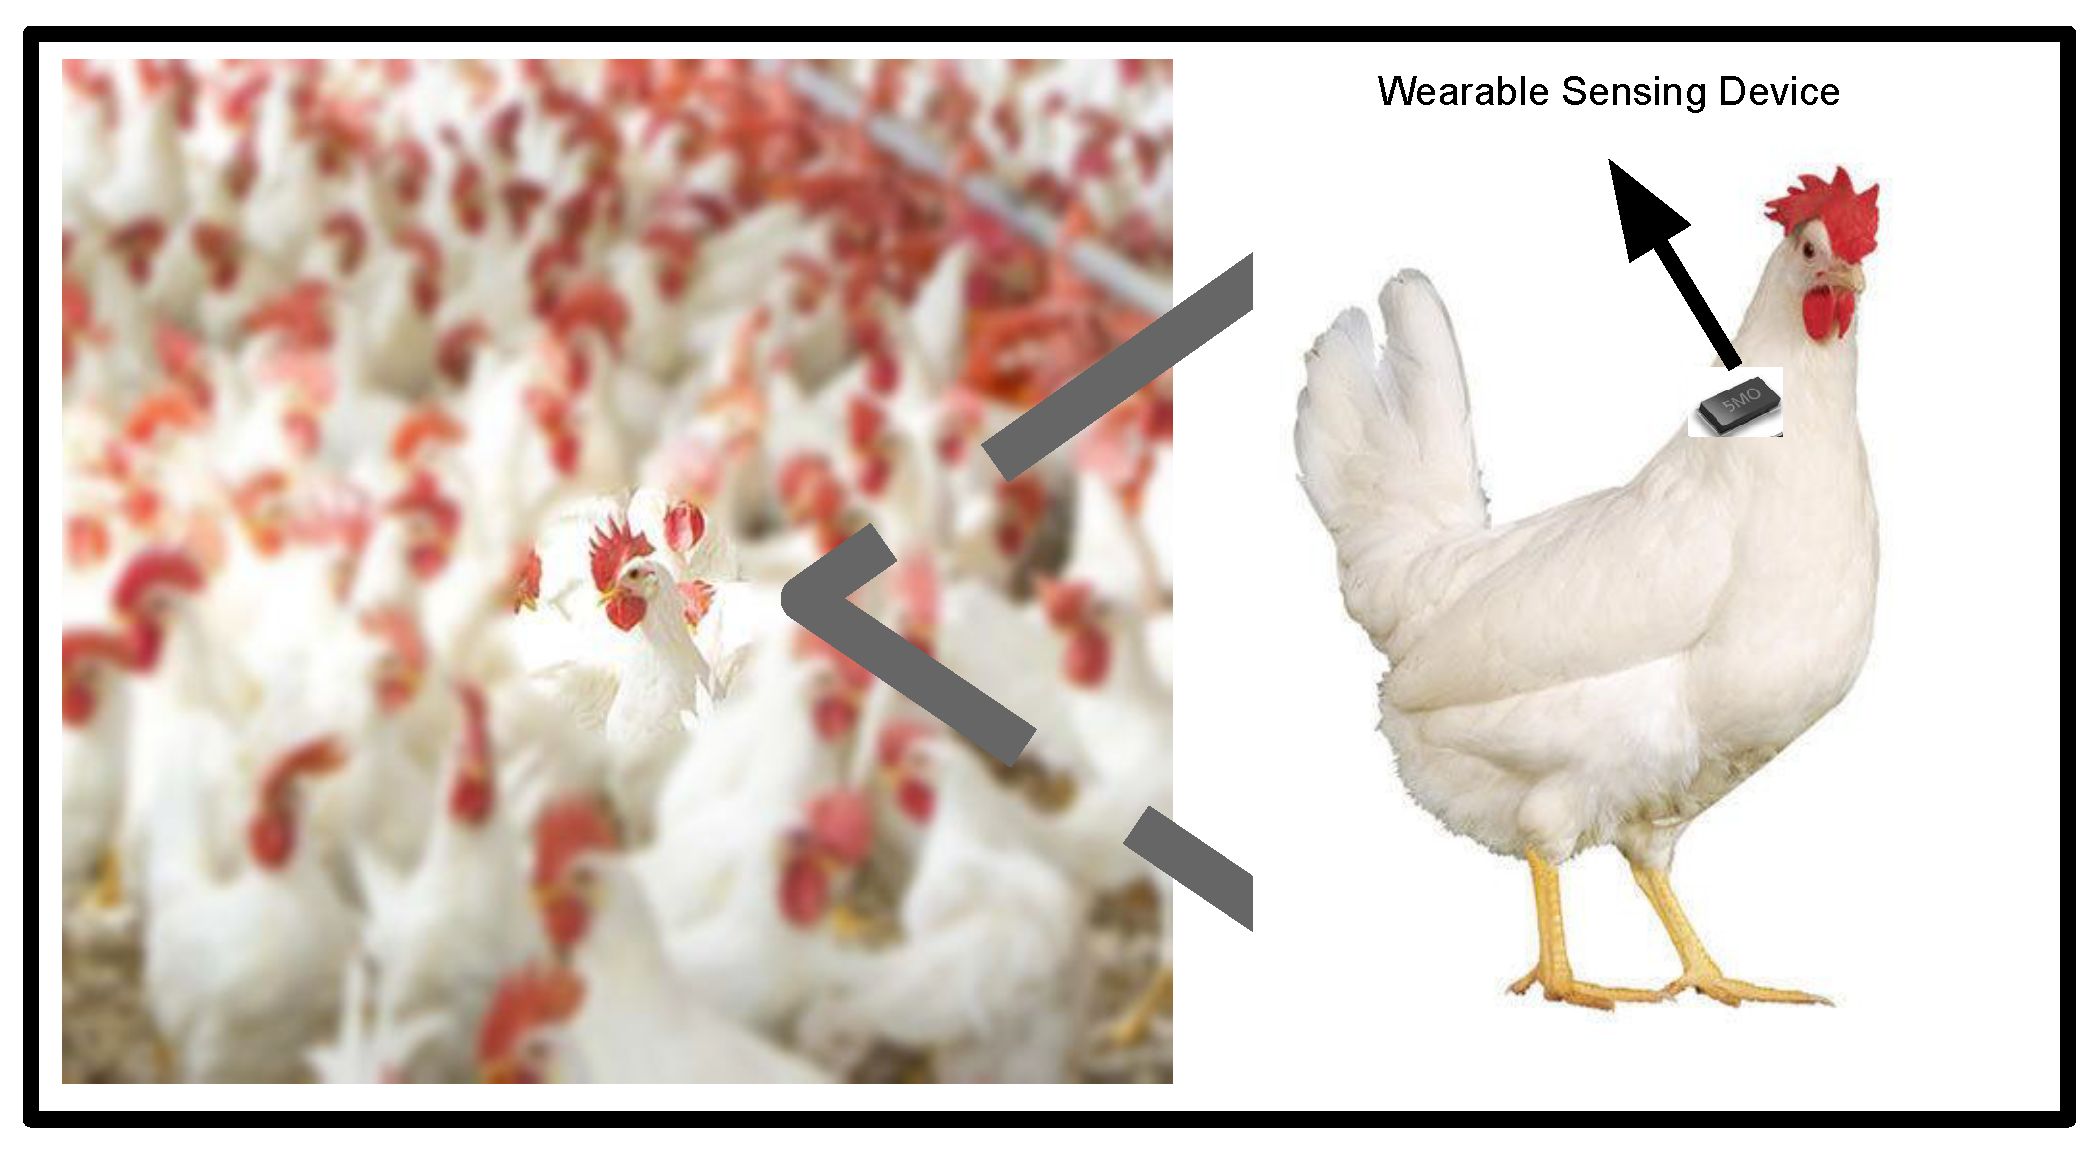
Provides an IoT-based predictive service framework to develop a precision livestock farming system which has the capability to track, monitor, detect, and predict the disease in poultry chicken at an early stage. It can accomplished by using wearable sensor devices.
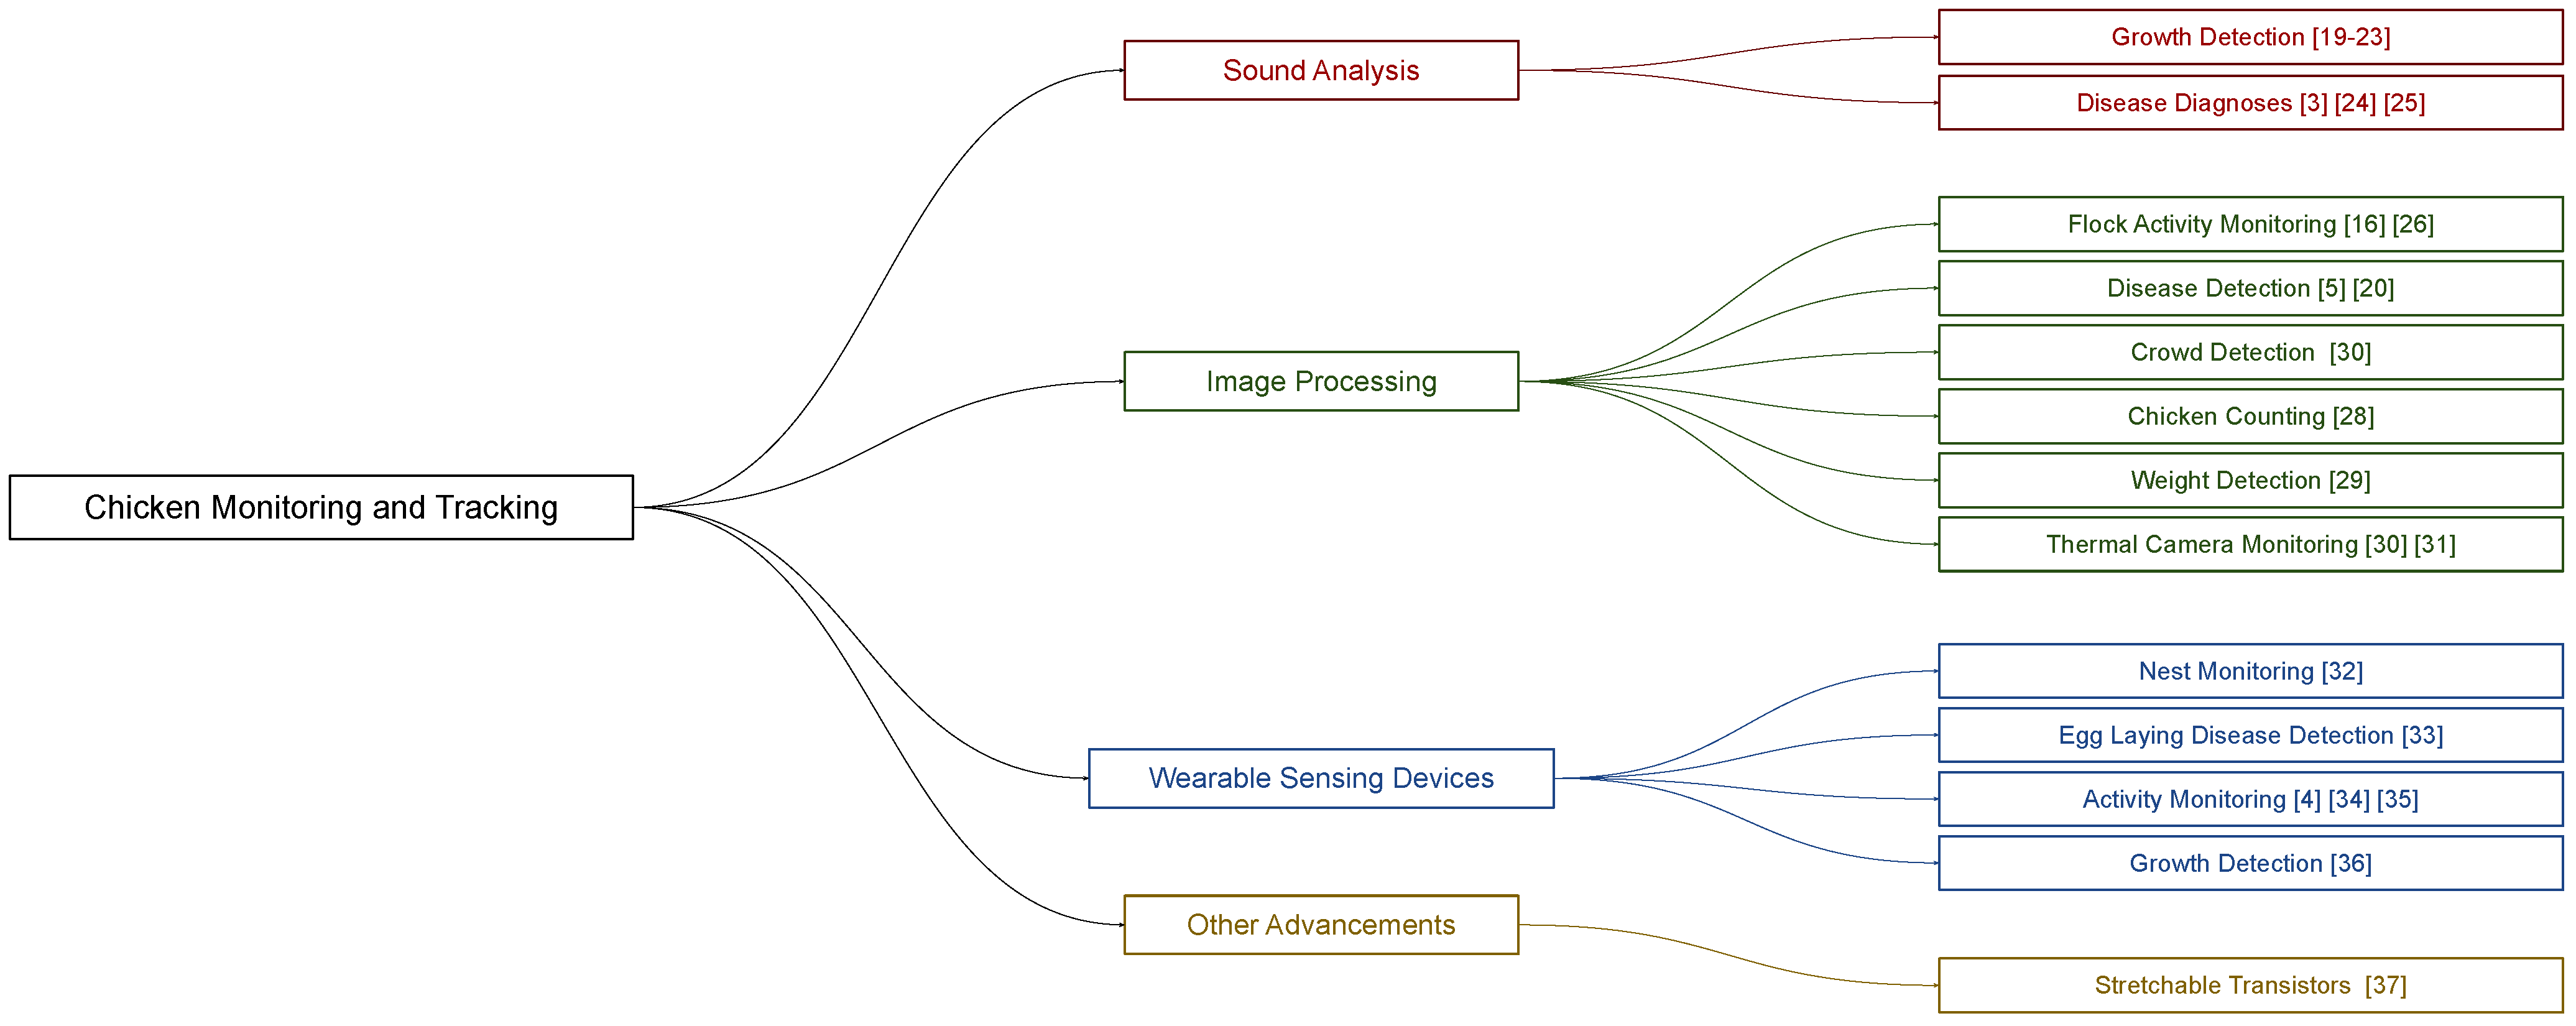
The study further discusses the related advancements in Section 2 that provides the monitoring and predictive methods to determine the health of the poultry chickens. Section 3 explains the dataset generation technique and the experimental setup that are conducted in the study. Section 4 discusses the results obtained, followed by the conclusion.

2. Related Work

The demand for poultry products raises the need for the implementation of the poultry’s welfare. Healthy poultry products heavily depend on the good poultry conditions. Several criteria for the comprehensive assessment of the poultry welfare contradict each other and hence make the evaluation difficult as well as time consuming. The technological advancements help poultry farmers to implement good poultry welfare by implementing one of the monitoring and tracking systems to observe the sickness or well-being of the poultry chickens. The location of feeders and drinkers can be examined and changed with the presence of clusters or groups of the poultry chickens [16]. The activity such as moving, perching, eating, and drinking may help in understanding the health of the poultry chicken [17,18]. The key essence of the monitoring and tracking system is the early detection of the individual animals in livestock farming. The detection of chicken movement activities using wearable sensing devices can classify the chicken as sick, normal, or active in the poultry farm [4]. The proposed study includes the recent advancements carried out to monitor and track poultry chickens. Figure 2 provides the classification of the related studies with respect to the proposed techniques and Table 1 provides the limitation of different approaches in the studies.

2.1. Sound Analysis

The social interactions of the poultry chickens can be observed with the sound analysis of the poultry chickens. The sound analysis techniques such as energy distribution, frequency, amplitude, and frequency distributions can help in estimating the health of the chicken. The growth rate is important in analyzing the healthy and sick growth behaviors. The behavior of pecking is highly related with the eating behavior of the poultry chickens. Moreover, 90% of the feed intake was accurately detected through pecking sounds [19]. Another experiment detected the feed intake of poultry chickens by 86% through pecking sounds [20] while the feeding behavior of the poultry chickens were detected with an accuracy of 95% using pecking sounds [21].
The growth of the poultry chickens is also analyzed by observing the peak frequencies made by the chicken. The peak frequency decreased with the increase in the growth of the poultry chicken [22,23] and hence provides the detection of the growth rate of the poultry chicken. Disease diagnoses can also be analyzed through sound analysis. The healthy and sick chickens in the poultry farms have different sounds based on their health. The analysis and classification of healthy and unhealthy chickens has been made with 100% accuracy using a supervised learning neural network [24].
Another experiment was conducted to diagnose whether the poultry chicken was infected with Newcastle, bronchitis virus, or avian influenza or not using sound analysis [25]. The sound (noise) analysis has been carried out to detect avian influenza in poultry chickens [3]. The extracted sound data are trained for the binary classification model using Support Vector Machine.

2.2. Image Processing

Image processing provides an inexpensive and cost-effective autonomous analysis of the poultry behavior that includes the detection of health conditions, weight prediction, and tracking and monitoring. The chickens’ activities in the flock can also be recorded and analyzed later for identifying different patterns and behaviors. Image processing provides an inexpensive and cost-effective autonomous analysis of the poultry behavior that includes the detection of health conditions, weight prediction, and tracking and monitoring. The chickens’ activities in the flock can also be recorded and analyzed later for identifying different patterns and behaviors. The monitoring of flock activity can be achieved by comparing the adjacent set of different pixels [16,26]. The detection of abnormal feeding activity within the flock can be treated as an early health warning of the poultry chickens [16]. The monitoring of the poultry chicken behavior and the early detection of infection can be accomplished by analyzing the feces of the poultry chickens [17]. The image processing techniques were applied to clean the dataset to perform the data analysis. The study proposed that its monitoring and classification mechanism to identify the Campylobacter-free chicken flocks is much better than conventional on-farm microbiological methods. The study claims to provide the monitoring results within 7 to 10 days. The implementation of a convolutional neural network (CNN) is proposed on a computer vision system for the crowd monitoring of poultry chickens around feeders with an accuracy of 99.17% [27].
The crowd observed around the feeder is categorized as not crowded, low crowded, and fairly crowded. The number of poultry chickens has been calculated using an IR camera in a controlled lighting environment [28]. The image colors were cropped and converted into grey-scale and then further converted into binary images. The number of poultry chickens were counted as white pixels with an accuracy of 71.23%. The disease prediction and classification is achieved with posture features modeling through an SVM Model with an accuracy of 99.47% [5].
The weight of the poultry chicken is predicted using the computer vision techniques through an Artificial Neural Network (ANN) [29]. The maximum error of the weight predicted was less than 50 g when weighed individually. The thermal camera is proposed to manage the heat stress within the poultry chickens [30]. The prediction of the chickens’ health was performed by applying the Support Vector Machine classification model over the temperature dataset collected. The temperature dataset of the chickens was collected by using thermal cameras within the control environment in the poultry farms. The study claims that climate changes, including temperature and humidity, play an important role in the reduced feed intake, growth, weight, semen, and fertility of the chickens.
The thermal camera is also used for the video surveillance to label the data and depth camera to model the chicken’s health [31]. The mobility features (walk speed) were extracted and statistical analysis was carried out for the feature investigations. The study claims that the earliest infection detection time possible by the authors is on the forth day based on the elongation and variance of the circle.

2.3. Wearable Sensing Devices

Wearable sensing devices such as RFID microchips and accelerometers are used to track and monitor the location. An RFID microchip produces a signal to the RFID reader when found in the magnetic field. Through the RFID mechanism, the location of the poultry chickens can be obtained, and hence, the entire movement of the poultry chicken within the flock can be observed. The integration of the Internet of Things design along with the wearable sensing devices help in observing the poultry chickens’ movement in a real time. An RFID reader is placed in a poultry nest, and the RFID tags were placed over the poultry chickens in order to observe the frequency of the chickens going in or out of the nest [33]. The solution is also enhanced by adding the egg detection sensor to observe the egg laying behavior and can find the abnormalities as early warnings.
The behavior of the poultry chickens laying eggs can also provide an analysis of the relationship between keel bone fractures and laying eggs [34]. The tracking movement of the poultry chickens were observed using an RFID mechanism with an accuracy of 62.6% [32]. The weighing sensors along with the RFID devices can help in understanding the behavior of the poultry chickens such as the speed of the movement, food acquisition, and resting time within the flock [4]. The study also classified the poultry chickens as active, normal, or sick using the K-means clustering method. The feeding and nesting behavior can also be observed using the RFID microchips [35]. The poultry chickens’ health, cleanliness, and growth were diagnosed with a tag worn by tracking the location in a field [36].

2.4. Other Advancements

The study [37] used the stretchable transistors to provide the health monitoring of the chicken. The electronic skin concept was proposed named as ‘eskin’ by the authors predicted the health of the poultry chickens through transistors pasted over the skin of the poultry chickens and that transmit continuous data.

2.5. Machine Learning and IoT Systems

The recent advancements depend on machine learning models in developing real-world IoT systems. The IoT-based decision and support systems rely on machine learning models due to the limited computational and processing resources within IoT peripheral systems. Real-world IoT systems also help the machine learning models with new data to train models for best performances. Transferring all the information over the cloud and processing it opens new challenges for researchers. This helps them in addressing the transmission and processing issues of big data over the cloud. The IoT–Fog–Cloud ecosystem [38] is discussed that provides the implementation of a distributed fog layer for data processing. The study [38] also discussed the big data and heterogeneity challenges in order to design automatic components for fog resiliency.
The prediction of museum visitor’s attendance is carried out using a learning model [39]. The study [39] investigated the impact of weather conditions on the museum visitors and observed that some factors such as time of the day, day of the week, and vacations also have significant impact while predicting the number of museum visitors. A microservice framework is proposed to develop IoT-based, context-aware decision systems with automatic functions [40]. The study [40] proposed the microservice framework to address the latency issue along with big data, device heterogeneity, and fog resiliency challenges. Machine learning helps to provide a simulated learning environment for the new developers or workers to have robust, effective, and realistic learning platforms [41]. The proposed simulated learning [41] provides the technological advancements for learners to combine and relate real and virtual learning environments with a sense of presence.
The study [6] collected a dataset of the poultry chickens by deploying wearable accelerometer over individual chickens. The device stores the three-axis data of chickens, which represents the actions performed by poultry chickens such as dustbathing, preening, and pecking. The dataset of these activities was formed for the healthy chicken, as well as for sick chickens. The researchers deliberately embossed the Ectoparasites residing over the skin of the chickens, causing stress. Moreover, such chickens are responsible for spreading the Ectoparasites among other poultry chickens. Hence, it impacts the poultry farms that cause the infection of the overall chicken flock [42].
The dataset provided in the study [6] has been extrapolated by using a deep generative modeling technique. The problem is to perform deep generation from a tabular dataset to adopt the probability distribution. Through CTGAN [8], the synthetic dataset has been generated in the proposed study to solve the class imbalance problem of the dataset distribution. The generation of the synthetic dataset has been used to evaluate the upper limit performance of machine learning models [43]. Another study generated the synthetic dataset to maintain the reliability of the data privacy in healthcare [44].

2.6. Limitations with Sound and Image Analysis

Sound analysis can be implemented for the early detection of the poultry chicken behaviors by identifying the frequencies of the chickens’ noise (sound) vibrations. Through these observations, the growth and well-being of the poultry chickens can be predicted. The tracking of thousands of poultry chickens in commercial farms through sound analysis faces real-world challenges. It is impossible to identify the exact poultry chicken that made the sound vibration due to sound isolation. The sound detection of each individual chicken in commercial farms is still in the experimental stage. Another complicated challenge in adopting the tracking of poultry chickens using sound analysis is the environmental noise. The environmental noise disturbances make it difficult to track chickens using sound analysis in commercial farms. The cancellation of the environmental noise using voice recognition through Artificial Intelligence (AI) is still an open area for advancement.
Image and video monitoring and tracking for poultry chickens help in diagnosing disease, crowds, weight, and predicting the flock’s activities and behaviors. However, the commercial aspects for the adoption of image analysis is challenging due to the accuracy of identifying thousands of poultry chickens in commercial farms.
In the proposed study, the available dataset [6] was generated deeply while proposing the classification of sick and healthy poultry chickens. This classification is based on chicken movement data. Supervised machine learning and deep learning classification models are used with better accuracy. The proposed study contributes to the scientific community by presenting the performance comparison of different machine learning and deep learning models.

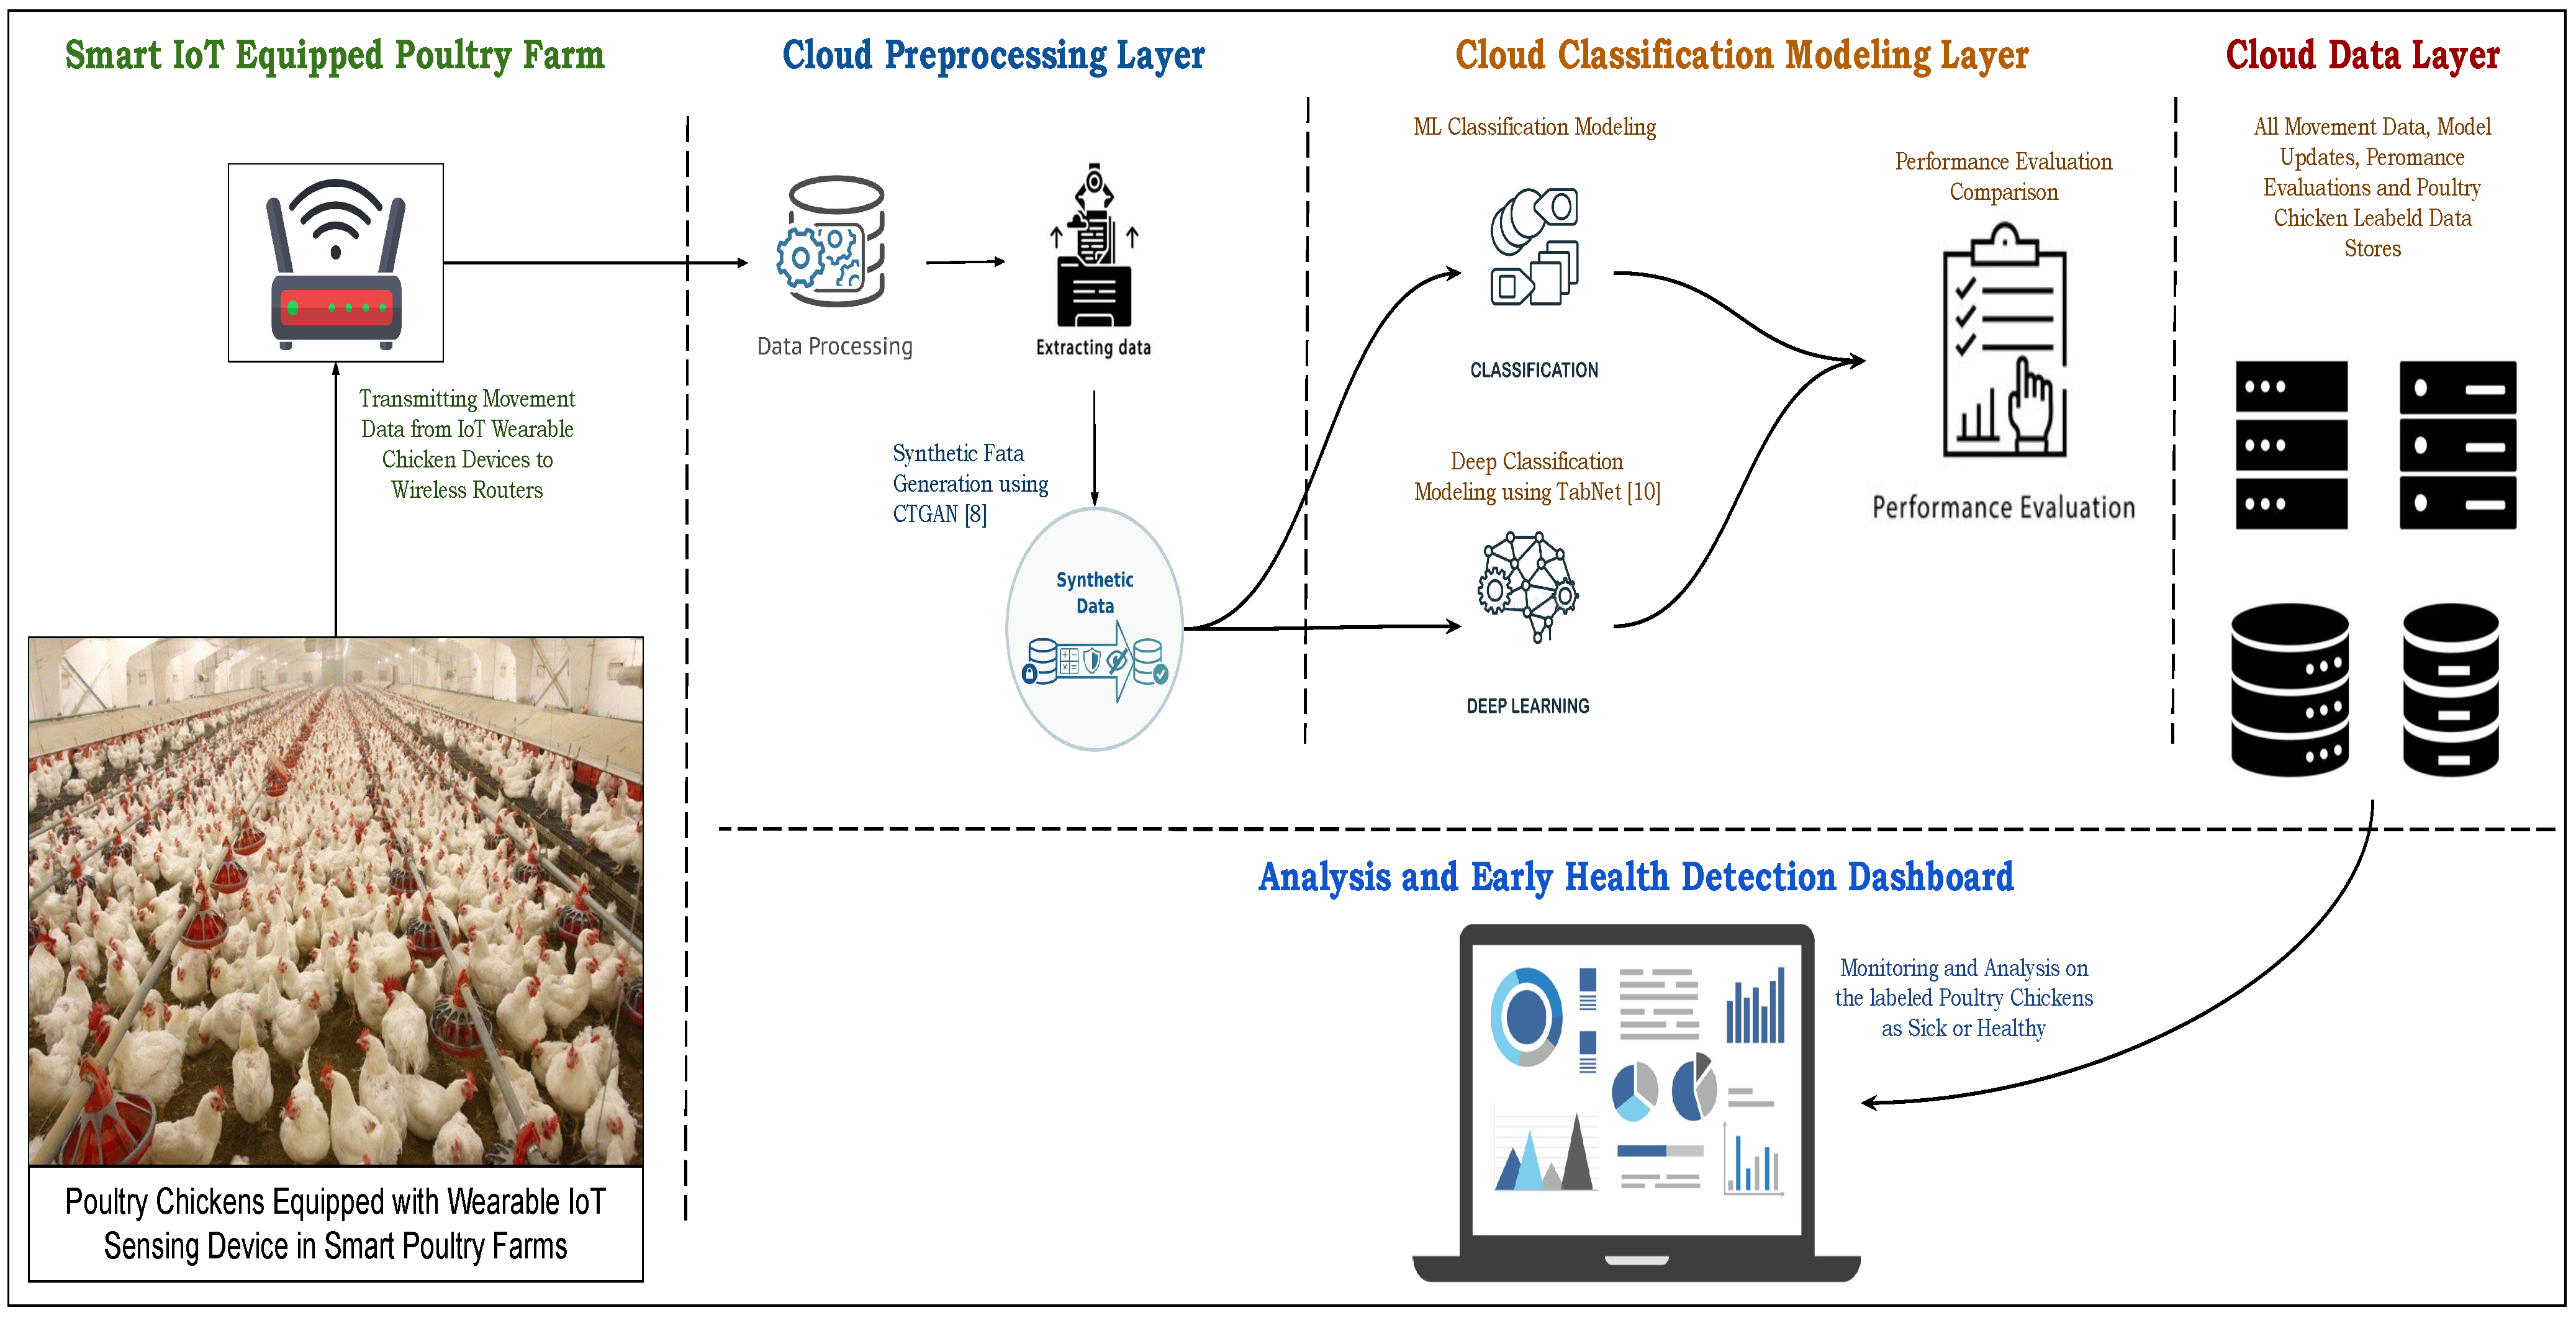
3. Proposed Methodology

The wearable sensing devices help increase the observations of individual chickens with accuracy [45]. The sensing devices track and monitor the individual chickens over a given time period. The recent advancements in the sensing devices make these devices affordable to track and collect the monitoring observations for sensor-driven data analysis. The recent studies contributed in data collection techniques of livestock and poultry using wearable sensing devices [45,46,47,48].

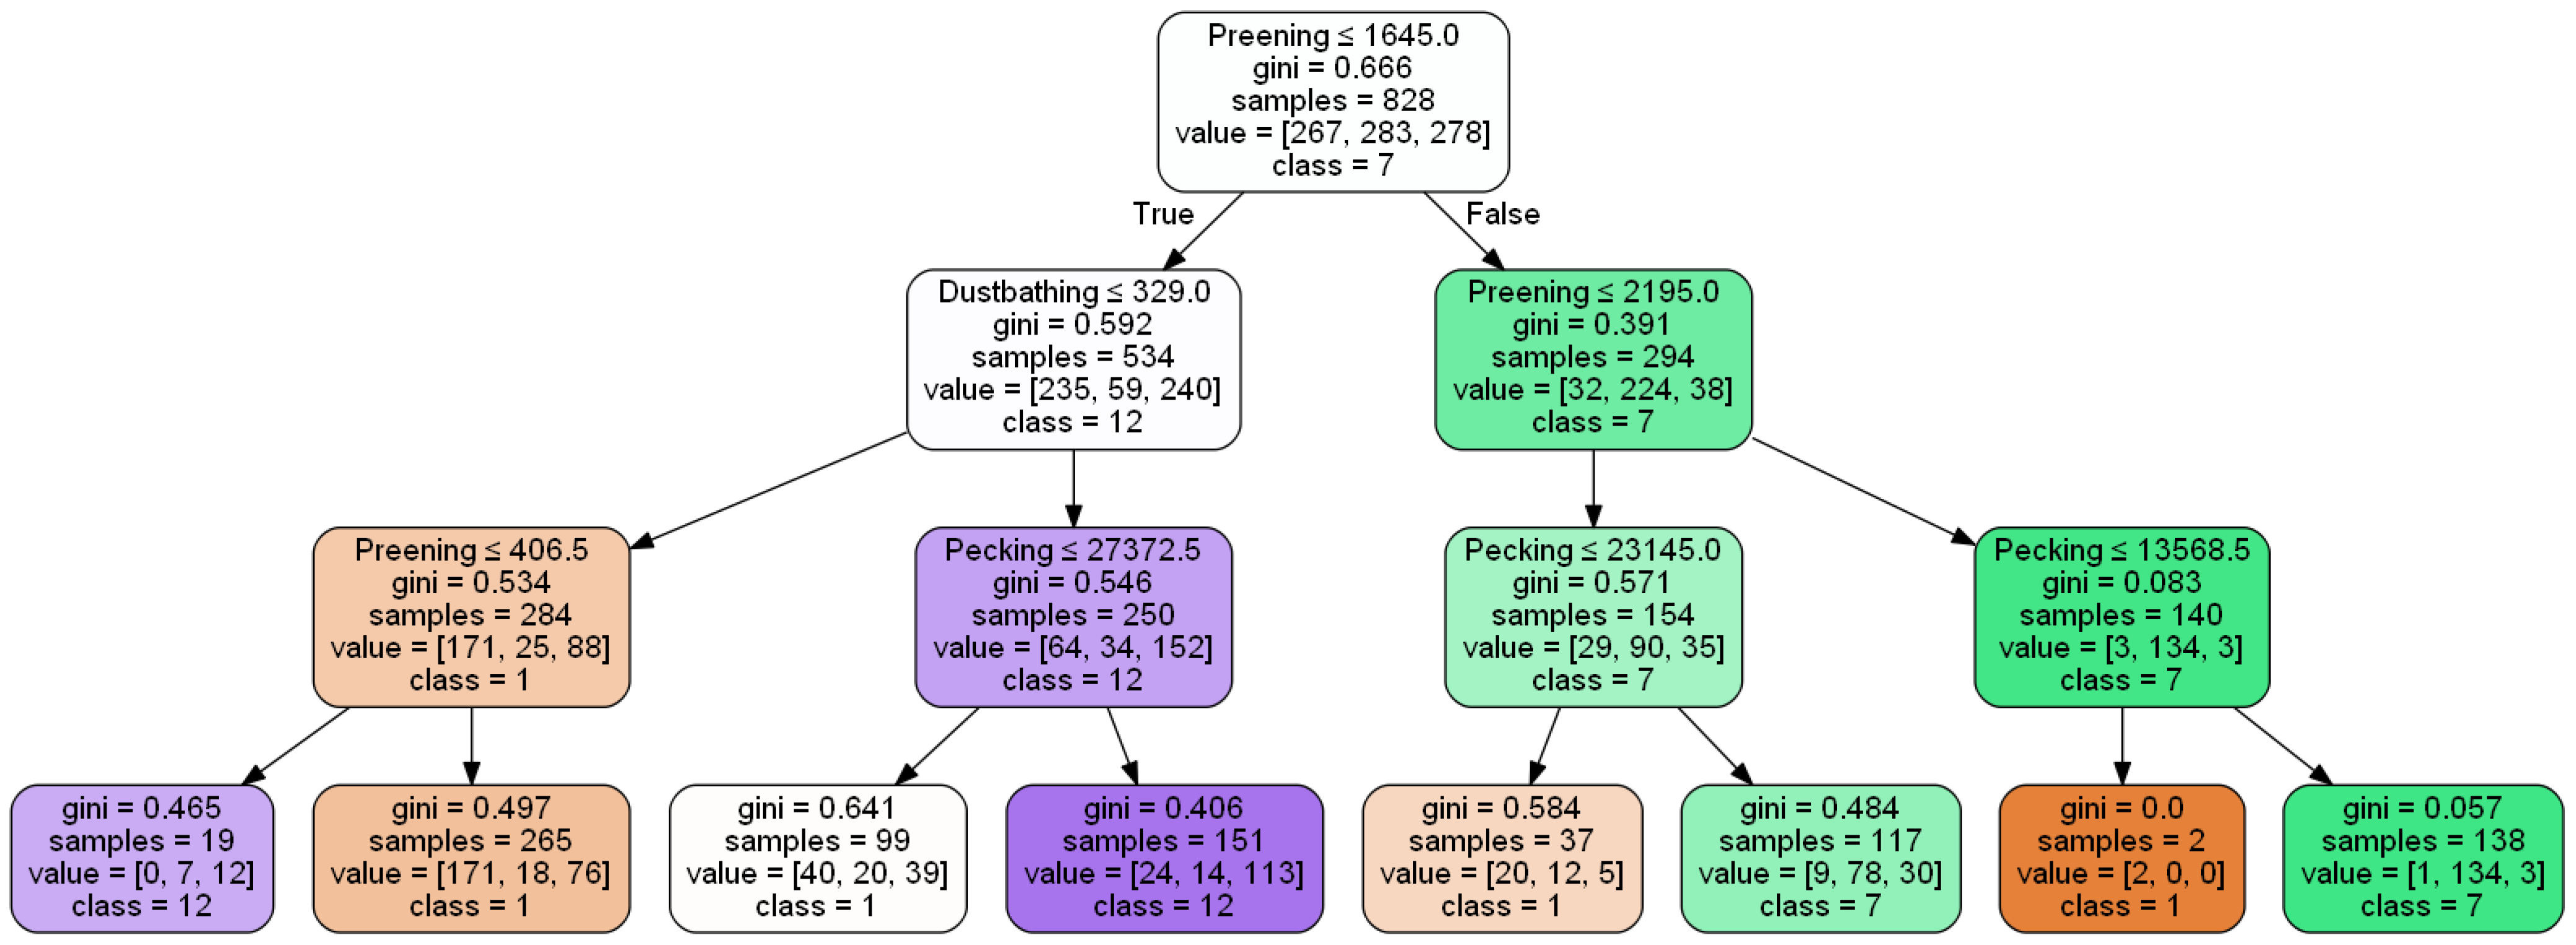
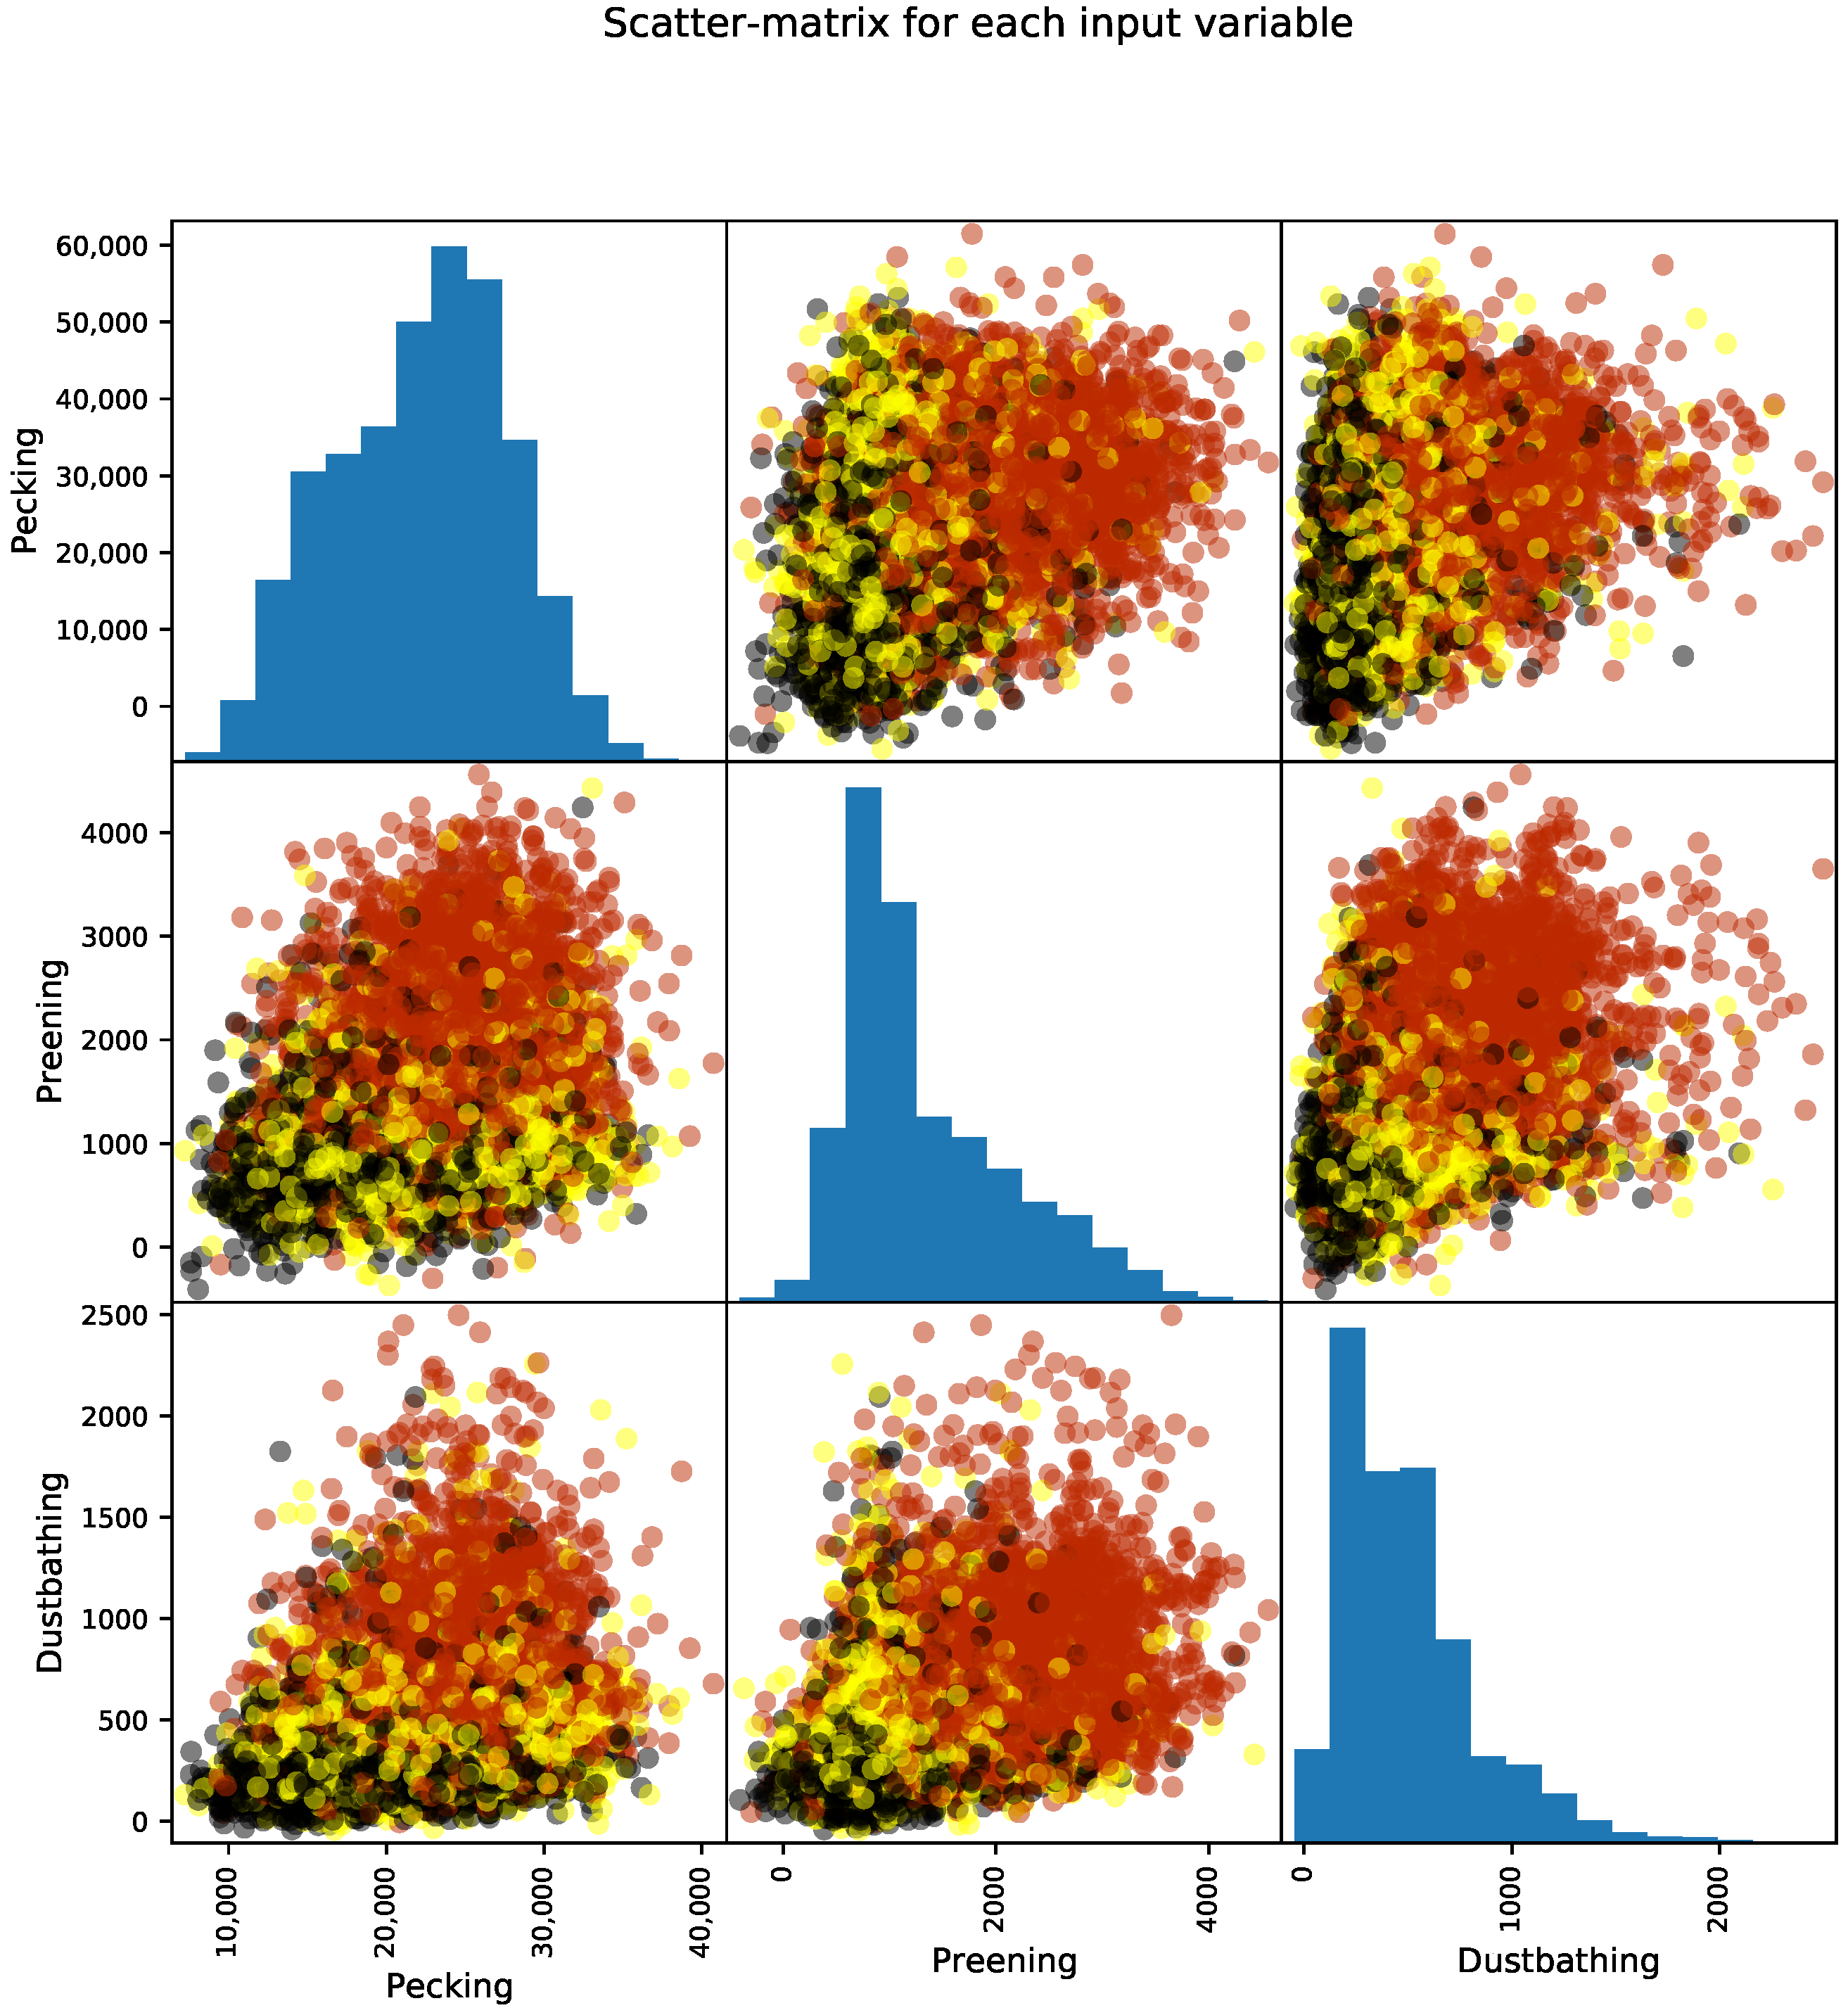
3.1. Data Definitions

The 20-weeks dataset collected by the study [6] consists of the 24 unique poultry chickens placed in four different flocks. The data provides the number of (a) dustbathing, (b) pecking, and (c) preening of each chicken per day located in six different flocks. Table 2 provides the data attributes available and Figure 3 illustrates the pairwise distribution of the available dataset [6].
The studies [49,50,51] track and analyze the following activities in the poultry chicken. The activities including pecking, preening, and dustbathing shows the correlation with each other. Feeding/pecking is an activity observed in the poultry chicken that strikes the beak at the ground and is commonly observed behavior within poultry chickens. Preening is observed in the poultry chickens where the feathers are groomed or nibbled using the beak [52]. Through preening, the poultry chickens clean their feathers and is considered as an important regular activity. This observation is made by observing the beak movement of the chicken. Dustbathing involves chickens sitting or lying down with up raised feathers [52]. In this act, the poultry chicken tends remove the possible parasites from its feathers by moving over the sand or dust. Dustbathing is rare common behavior performed by the poultry chickens.
The ectoparasites (arthropods) reside on the skin surface of the chicken’s body and are responsible for the stress of the poultry chickens. These ectoparasites spread from chicken to chicken within the poultry flock and hence spread the disease [7]. Most of the ectoparasites’ effects observed for sickness include the health and productivity of the laying eggs chickens. The spread of arthropods can infect the complete flock and can affect the health of respective poultry chickens within the flock. The study [6] induced the ectoparasites to collect the movement observations of sick and healthy poultry chickens.

3.2. Synthetic Data Generation

Generative Adversarial Networks (GANs) use deep learning supervised modeling to learn data patterns of the supplied dataset in order to regenerate the missing or eliminated data records from the original dataset. Conditional Tabular Generative Adversarial Networks (CTGAN) [8] provides the implementation to deeply generate the tabular dataset.
The 10,000 records of the synthetic dataset have been generated using CTGAN [8] with 1000 epochs. The synthetic data capture the probability distribution of the actual dataset and hence address the challenges of class imbalance in the dataset. Figure 4 shows the comparison of the actual data with the synthetic data generated. The generated synthetic data are used for the supervised machine learning and deep learning techniques to classify the sick and healthy poultry chickens.

3.3. Machine Learning and Deep Learning Classification Techniques

The machine learning classification algorithms provide the precise labeling technique over the input data that helps in predicting the most similar data to the classified label. These classification models tend to learn and provide more accurate classification results over the period of time. The classification algorithms provide the discrete resulting value to label the data. The input labeled data is divided into the training data and testing data. The model training has been carried out by feeding the labeled training dataset that is later used to validate the labeled testing data. The descriptive and predictive modeling can also be achieved by the classification models. The generalized working of the classification model where ‘x’ is the input data that is supplied to the classification model for the training and provides the class label ‘y’ to the input data ‘x’.
The machine learning classification models have been trained using the actual and synthetic dataset. The supervised learning algorithms such as Nearest Neighbor, Decision Tree, Random Forest, Naive Bayes, and Support Vector Machine are applied as the experiments in this study to classify the poultry chicken using an IoT-based predictive service. Figure 5 shows the training and evaluation of the Decision Tree classifier to predict the health of the poultry chicken by the proposed IoT based predictive service framework as presented in Figure 6.
Deep learning extends the machine learning modeling using multiple layers to extract the data attributes from a supplied dataset. Deep learning models contribute towards the cast range of emerging domain areas such as natural language processing, speech recognition, computer vision, bioinformatics, video surveillance, and many more. Earlier, gradient boosting models such as XGBoost [53] provided better performance for tabular datasets. In 2019, Google’s TabNet [10] outperformed the leading tree based models. One of the important quality that the feature preprocessing is not required in TabNet. The implementation is easy and only requires hyper-parameter tuning. TabNet implements the instance-wise feature selection at each decision step. The implementation allows the single row feature visualization, known as local interpretability, and feature visualization for a complete dataset, known as global interpretability.

3.4. Performance Evaluators

The trained classification models have been evaluated using the standard performance indicators used to calculate the accuracy of the proposed IoT-based classification service. The performance indicator includes Precision (1), Recall (2), F1-Score (3), and Accuracy (4) as follows:
P r e c i s i o n = T P T P + F P
R e c a l l = T P T P + F N
F 1 - S c o r e = 2 × P r e c i s i o n × R e c a l l P r e c i s i o n + R e c a l l = 2 × T P 2 × T P + F P + F N
A c c u r a c y = T P + T N T P + T N + F P + F N

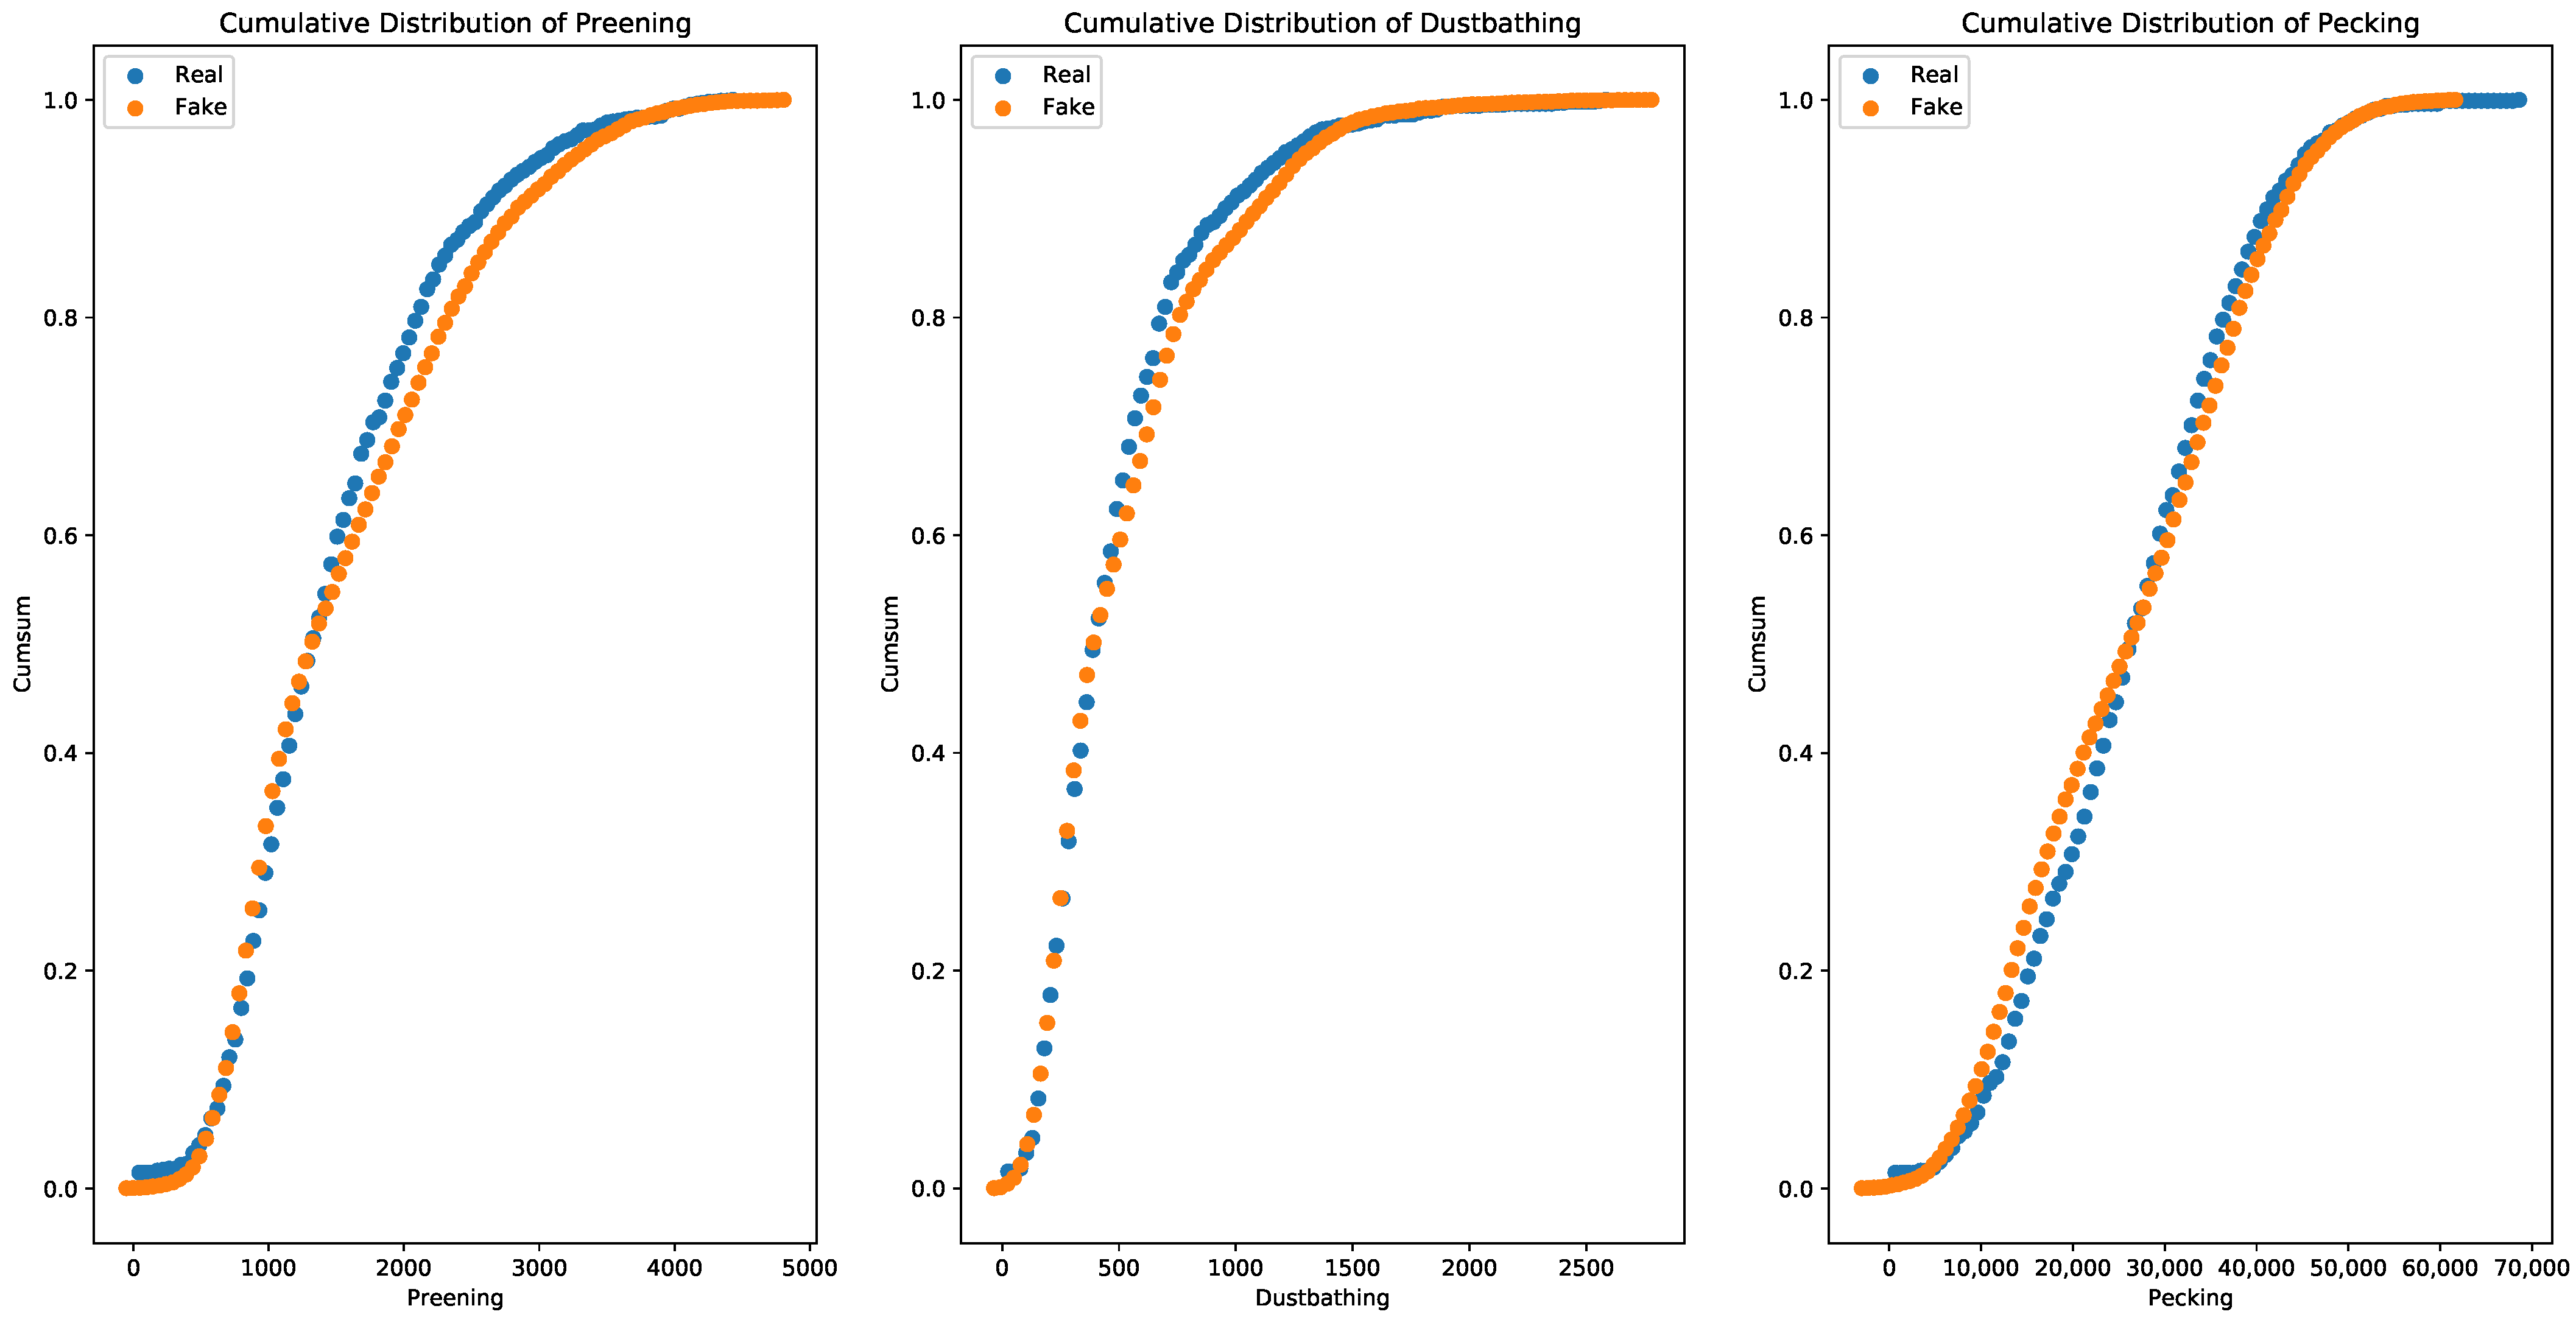
4. Results and Discussion

The experiments conducted in the study are performed over the actual and synthetic dataset. The synthetic dataset of 10,000 records is created by configuring 1000 epochs for deep generative CTGAN [8]. For sick and healthy poultry chicken classification, the generative models employed to augment the poultry chicken movement data are an important contribution of the proposed study. The generated synthetic dataset provides the sparsity in the original dataset [6] because of the lack of or limited data. The experiment trained the machine learning and deep learning classification models for an approach to propose an IoT-based predictive service framework for poultry farms for real-time detection of the chickens’ degradation.
The performance of each of the supervised machine learning and deep learning classification models is calculated using the performance evaluation indicators such as Precision (1), Recall (2), F1-Score (3), and Accuracy (4). The ensemble learning was applied for each of the classification model along with 10 k-cross-validations.
Table 3 summarizes the performance of the selected classification models with their sensitivity error percentage. TabNet [10] outperforms the other machine learning classification models. Decision Tree and Random Forest performed well since these classification models provide the best predictive modeling for binary class modeling.
The TabNet model classifies the sick and healthy poultry chicken with the best performing accuracy of 97% of the proposed study. The Decision Tree and Random Forest machine learning classifiers performed well on the actual and synthetic dataset and obtained more accurate results with an accuracy of 81%. The K-Nearest Neighbor where K = 2 provides a 77% accuracy to predict the healthy and sick poultry chicken. Gaussian Naive Bayes classification performed slightly better than Nearest Neighbor with an accuracy of 80%. The Support Vector Machine classification model performed the least amongst all of the classification techniques with an accuracy of 70%. The Logistic Regression classification also predicted the health of the poultry chicken with 78% accuracy.
The proposed study contributes in providing the performance comparison among machine learning and deep learning classification models. The study discusses the viability of the wearable IoT sensing device towards adoption in the poultry industry.

IoT Sensing Devices and Industrial 4.0 Viability

The wearable sensing devices such as the accelerometer and RFID microchips are considered as a viable solution in tracking and monitoring each of the poultry chickens in the commercial farms. These sensing devices can easily observe the activities and locations of each individual chicken within the flock. The tracking and monitoring using sensing devices can help in observing the nesting, perching, feeding, and drinking behaviors of the poultry chickens. In addition, the anomaly detection of the location and movements of the poultry chickens can also be observed and adopted as an early detection system for chickens’ well-being.

5. Conclusions

The demand of the real-time adaptive systems in the poultry industry provides the motivation to propose a systematic approach to create an IoT-based predictive service framework that observes the poultry chickens’ movement data and more accurately predicts the health of the chickens in real-time. The study implements deep generative models to extrapolate the IoT-based sensing data of poultry chickens to address the class imbalance problem. The study predicted the health of poultry chicken by modeling different machine learning and deep learning classification techniques as an IoT service. It has been observed that the deep learning tabular data classification model TabNet outperforms with hte best classifying accuracy. The Decision Tree and Random Forest machine learning classifiers provided more accurate predictions of the poultry chickens. Moreover, the proposed study discussed other advancements and their limitations in the adoption by the poultry industry. The study opens different approaches that can be used for the implementation or an extension of the proposed framework to develop an IoT-based predictive service. It will help animal welfare specifically towards the development of a precision livestock farming system for the poultry industry.
The study will be extended to propose a real-time predictive IoT service to classify the diseases of poultry chicken with the help of Bayesian Network modeling. The hybrid approach aggregating the machine learning classification models along with the Bayesian Network modeling will provide more accurate prediction for diseases in poultry chickens.

Author Contributions

Conceptualization, G.A. and R.A.S.M.; methodology, R.A.S.M.; software, M.R.S. and A.G.; validation, S.Z., R.A.S.M., A.A. and A.G.; formal analysis, R.A.S.M.; investigation, M.R.S.; resources, G.A.; data curation, S.Z.; writing—original draft preparation, M.R.S.; writing—review and editing, A.A. and A.G.; visualization, S.Z.; supervision, G.A.; project administration, M.R.S.; funding acquisition, G.A. All authors have read and agreed to the published version of the manuscript.

Institutional Review Board Statement

The study proposed the IoT based predictive service framework for early detection of diseases in poultry chickens based on the chicken’s movement dataset provided by the study [6]. Therefore, the study does not require Ethical Committee approval.

Informed Consent Statement

Not applicable.

Data Availability Statement

The data used in this study is openly available as [7] of the original study and extended by the authors of the study [6].

Acknowledgments

The authors of the study acknowledge the support provided by the FAST - National University of Computer and Emerging Sciences, Pakistan to carryout this study under Project No. 11-71/NU-R/20.

Conflicts of Interest

The authors declare no conflict of interest.

Abbreviations

The following abbreviations are used in this manuscript:
IOTInternet of Things
GANGenerative Adversarial Networks
CTGANConditional Tabular Generative Adversarial Networks
MLMachine Learning
AIArtificial Intelligence

References

  1. Tixier-Boichard, M.; Bed’hom, B.; Rognon, X. Chicken domestication: From archeology to genomics. Comptes Rendus Biol. 2011, 334, 197–204. [Google Scholar] [CrossRef]
  2. Ben Sassi, N.; Averós, X.; Estevez, I. Technology and poultry welfare. Animals 2016, 6, 62. [Google Scholar] [CrossRef] [Green Version]
  3. Huang, J.; Wang, W.; Zhang, T. Method for detecting avian influenza disease of chickens based on sound analysis. Biosyst. Eng. 2019, 180, 16–24. [Google Scholar] [CrossRef]
  4. Feiyang, Z.; Yueming, H.; Liancheng, C.; Lihong, G.; Wenjie, D.; Lu, W. Monitoring behavior of poultry based on RFID radio frequency network. Int. J. Agric. Biol. Eng. 2016, 9, 139–147. [Google Scholar]
  5. Zhuang, X.; Bi, M.; Guo, J.; Wu, S.; Zhang, T. Development of an early warning algorithm to detect sick broilers. Comput. Electron. Agric. 2018, 144, 102–113. [Google Scholar] [CrossRef]
  6. Abdoli, A.; Murillo, A.C.; Yeh, C.C.M.; Gerry, A.C.; Keogh, E.J. Time series classification to improve poultry welfare. In Proceedings of the 2018 17th IEEE International Conference on Machine Learning and Applications (ICMLA), Orlando, FL, USA, 17–20 December 2018; pp. 635–642. [Google Scholar]
  7. Murillo, A.C.; Abdoli, A.; Blatchford, R.A.; Keogh, E.J.; Gerry, A.C. Parasitic mites alter chicken behaviour and negatively impact animal welfare. Sci. Rep. 2020, 10, 8236. [Google Scholar] [CrossRef] [PubMed]
  8. Xu, L. Synthesizing Tabular Data Using Conditional GAN. Ph.D. Thesis, Massachusetts Institute of Technology, Cambridge, MA, USA, 2020. [Google Scholar]
  9. Narayanan, U.; Unnikrishnan, A.; Paul, V.; Joseph, S. A survey on various supervised classification algorithms. In Proceedings of the 2017 International Conference on Energy, Communication, Data Analytics and Soft Computing (ICECDS), Chennai, India, 1–2 August 2017; pp. 2118–2124. [Google Scholar]
  10. Arık, S.O.; Pfister, T. Tabnet: Attentive interpretable tabular learning. AAAI 2021, 35, 6679–6687. [Google Scholar]
  11. Sinclair, C.; Pierce, L.; Matzner, S. An application of machine learning to network intrusion detection. In Proceedings of the 15th Annual Computer Security Applications Conference (ACSAC’99), Phoenix, Arizona, 6–10 December 1999; pp. 371–377. [Google Scholar]
  12. Aleskerov, E.; Freisleben, B.; Rao, B. Cardwatch: A neural network based database mining system for credit card fraud detection. In Proceedings of the IEEE/IAFE 1997 Computational Intelligence for Financial Engineering (CIFEr), New York, NY, USA, 24–25 March 1997; pp. 220–226. [Google Scholar]
  13. Kim, E.; Kim, W.; Lee, Y. Combination of multiple classifiers for the customer’s purchase behavior prediction. Decis. Support Syst. 2003, 34, 167–175. [Google Scholar] [CrossRef]
  14. Yao, D.; Yang, J.; Zhan, X. A Novel Method for Disease Prediction: Hybrid of Random Forest and Multivariate Adaptive Regression Splines. J. Comput. 2013, 8, 170–177. [Google Scholar] [CrossRef]
  15. Mitchell, R.; Michalski, J.; Carbonell, T. Machine Learning: An Artificial Intelligence Approach October 2013; Springer: New York, NY, USA, 2013. [Google Scholar]
  16. Fraess, G.A.; Bench, C.J.; Tierney, K.B. Automated behavioural response assessment to a feeding event in two heritage chicken breeds. Appl. Anim. Behav. Sci. 2016, 179, 74–81. [Google Scholar] [CrossRef]
  17. Colles, F.M.; Cain, R.J.; Nickson, T.; Smith, A.L.; Roberts, S.J.; Maiden, M.C.; Lunn, D.; Dawkins, M.S. Monitoring chicken flock behaviour provides early warning of infection by human pathogen Campylobacter. Proc. R. Soc. B Biol. Sci. 2016, 283, 20152323. [Google Scholar] [CrossRef] [PubMed] [Green Version]
  18. Dawkins, M.; Roberts, S.; Cain, R.; Nickson, T.; Donnelly, C. Early warning of footpad dermatitis and hockburn in broiler chicken flocks using optical flow, bodyweight and water consumption. Vet. Rec. 2017, 180, 499. [Google Scholar] [CrossRef] [Green Version]
  19. Aydin, A.; Bahr, C.; Viazzi, S.; Exadaktylos, V.; Buyse, J.; Berckmans, D. A novel method to automatically measure the feed intake of broiler chickens by sound technology. Comput. Electron. Agric. 2014, 101, 17–23. [Google Scholar] [CrossRef]
  20. Aydin, A.; Bahr, C.; Berckmans, D. A real-time monitoring tool to automatically measure the feed intakes of multiple broiler chickens by sound analysis. Comput. Electron. Agric. 2015, 114, 1–6. [Google Scholar] [CrossRef]
  21. Aydin, A.; Berckmans, D. Using sound technology to automatically detect the short-term feeding behaviours of broiler chickens. Comput. Electron. Agric. 2016, 121, 25–31. [Google Scholar] [CrossRef]
  22. Fontana, I.; Tullo, E.; Butterworth, A.; Guarino, M. An innovative approach to predict the growth in intensive poultry farming. Comput. Electron. Agric. 2015, 119, 178–183. [Google Scholar] [CrossRef] [Green Version]
  23. Fontana, I.; Tullo, E.; Scrase, A.; Butterworth, A. Vocalisation sound pattern identification in young broiler chickens. Animal 2016, 10, 1567–1574. [Google Scholar] [CrossRef] [PubMed] [Green Version]
  24. Sadeghi, M.; Banakar, A.; Khazaee, M.; Soleimani, M. An intelligent procedure for the detection and classification of chickens infected by clostridium perfringens based on their vocalization. Braz. J. Poult. Sci. 2015, 17, 537–544. [Google Scholar] [CrossRef] [Green Version]
  25. Banakar, A.; Sadeghi, M.; Shushtari, A. An intelligent device for diagnosing avian diseases: Newcastle, infectious bronchitis, avian influenza. Comput. Electron. Agric. 2016, 127, 744–753. [Google Scholar] [CrossRef]
  26. Youssef, A.; Exadaktylos, V.; Berckmans, D.A. Towards real-time control of chicken activity in a ventilated chamber. Biosyst. Eng. 2015, 135, 31–43. [Google Scholar] [CrossRef]
  27. Pu, H.; Lian, J.; Fan, M. Automatic recognition of flock behavior of chickens with convolutional neural network and kinect sensor. Int. J. Pattern Recognit. Artif. Intell. 2018, 32, 1850023. [Google Scholar] [CrossRef]
  28. Li, G.; Li, B.; Shi, Z.; Zhao, Y.; Ma, H. Design and evaluation of a lighting preference test system for laying hens. Comput. Electron. Agric. 2018, 147, 118–125. [Google Scholar] [CrossRef]
  29. Amraei, S.; Abdanan Mehdizadeh, S.; Salari, S. Broiler weight estimation based on machine vision and artificial neural network. Br. Poult. Sci. 2017, 58, 200–205. [Google Scholar] [CrossRef] [PubMed]
  30. Nawab, A.; Ibtisham, F.; Li, G.; Kieser, B.; Wu, J.; Liu, W.; Zhao, Y.; Nawab, Y.; Li, K.; Xiao, M.; et al. Heat stress in poultry production: Mitigation strategies to overcome the future challenges facing the global poultry industry. J. Therm. Biol. 2018, 78, 131–139. [Google Scholar] [CrossRef]
  31. Okinda, C.; Lu, M.; Liu, L.; Nyalala, I.; Muneri, C.; Wang, J.; Zhang, H.; Shen, M. A machine vision system for early detection and prediction of sick birds: A broiler chicken model. Biosyst. Eng. 2019, 188, 229–242. [Google Scholar] [CrossRef]
  32. Sales, G.; Green, A.; Gates, R.S.; Brown-Brandl, T.M.; Eigenberg, R. Quantifying detection performance of a passive low-frequency RFID system in an environmental preference chamber for laying hens. Comput. Electron. Agric. 2015, 114, 261–268. [Google Scholar] [CrossRef]
  33. Chien, Y.R.; Chen, Y.X. An RFID-based smart nest box: An experimental study of laying performance and behavior of individual hens. Sensors 2018, 18, 859. [Google Scholar] [CrossRef] [Green Version]
  34. Gebhardt-Henrich, S.G.; Fröhlich, E.K. Early onset of laying and bumblefoot favor keel bone fractures. Animals 2015, 5, 1192–1206. [Google Scholar] [CrossRef] [Green Version]
  35. Li, L.; Zhao, Y.; Oliveira, J.; Verhoijsen, W.; Liu, K.; Xin, H. A UHF RFID system for studying individual feeding and nesting behaviors of group-housed laying hens. Trans. ASABE 2017, 60, 1337–1347. [Google Scholar] [CrossRef] [Green Version]
  36. Stadig, L.M.; Rodenburg, T.B.; Ampe, B.; Reubens, B.; Tuyttens, F.A. An automated positioning system for monitoring chickens’ location: Effects of wearing a backpack on behaviour, leg health and production. Appl. Anim. Behav. Sci. 2018, 198, 83–88. [Google Scholar] [CrossRef]
  37. Yang, J.C.; Mun, J.; Kwon, S.Y.; Park, S.; Bao, Z.; Park, S. Electronic skin: Recent progress and future prospects for skin-attachable devices for health monitoring, robotics, and prosthetics. Adv. Mater. 2019, 31, 1904765. [Google Scholar] [CrossRef] [PubMed] [Green Version]
  38. Chegini, H.; Naha, R.K.; Mahanti, A.; Thulasiraman, P. Process Automation in an IoT–Fog–Cloud Ecosystem: A Survey and Taxonomy. IoT 2021, 2, 92–118. [Google Scholar] [CrossRef]
  39. Yap, N.; Gong, M.; Naha, R.K.; Mahanti, A. Machine learning-based modelling for museum visitations prediction. In Proceedings of the 2020 International Symposium on Networks, Computers and Communications (ISNCC), Montreal, QC, Canada, 16–18 June 2020; pp. 1–7. [Google Scholar]
  40. Chegini, H.; Mahanti, A. A framework of automation on context-aware Internet of Things (IoT) systems. In Proceedings of the 12th IEEE/ACM International Conference on Utility and Cloud Computing Companion, Auckland, New Zealand, 2–5 December 2019; pp. 157–162. [Google Scholar]
  41. Seo, J.; Gong, M.; Naha, R.K.; Mahanti, A. A realistic and efficient real-time plant environment simulator. In Proceedings of the 2020 International Symposium on Networks, Computers and Communications (ISNCC), Montreal, QC, Canada, 20–22 October 2020; pp. 1–6. [Google Scholar]
  42. Blatchford, R. Animal behavior and well-being symposium: Poultry welfare assessments: Current use and limitations. J. Anim. Sci. 2017, 95, 1382–1387. [Google Scholar] [CrossRef] [PubMed]
  43. Kuchin, Y.I.; Mukhamediev, R.I.; Yakunin, K.O. One method of generating synthetic data to assess the upper limit of machine learning algorithms performance. Cogent Eng. 2020, 7, 1718821. [Google Scholar] [CrossRef]
  44. Rankin, D.; Black, M.; Bond, R.; Wallace, J.; Mulvenna, M.; Epelde, G. Reliability of supervised machine learning using synthetic data in health care: Model to preserve privacy for data sharing. JMIR Med. Inform. 2020, 8, e18910. [Google Scholar] [CrossRef]
  45. Siegford, J.M.; Berezowski, J.; Biswas, S.K.; Daigle, C.L.; Gebhardt-Henrich, S.G.; Hernandez, C.E.; Thurner, S.; Toscano, M.J. Assessing activity and location of individual laying hens in large groups using modern technology. Animals 2016, 6, 10. [Google Scholar] [CrossRef] [PubMed]
  46. Smythe, B.G.; Pitzer, J.B.; Wise, M.E.; Cibils, A.F.; Vanleeuwen, D.; Byford, R.L. Behavioral responses of cattle to naturally occurring seasonal populations of horn flies (Diptera: Muscidae) under rangeland conditions. J. Econ. Entomol. 2015, 108, 2831–2836. [Google Scholar] [CrossRef]
  47. Okada, H.; Suzuki, K.; Kenji, T.; Itoh, T. Avian influenza surveillance system in poultry farms using wireless sensor network. In Proceedings of the 2010 Symposium on Design Test Integration and Packaging of MEMS/MOEMS (DTIP), Seville, Spain, 5–7 May 2010; pp. 253–258. [Google Scholar]
  48. Barwick, J.; Lamb, D.W.; Dobos, R.; Welch, M.; Trotter, M. Categorising sheep activity using a tri-axial accelerometer. Comput. Electron. Agric. 2018, 145, 289–297. [Google Scholar] [CrossRef]
  49. Brown, N.S. The effect of louse infestation, wet feathers, and relative humidity on the grooming behavior of the domestic chicken. Poult. Sci. 1974, 53, 1717–1719. [Google Scholar] [CrossRef]
  50. Banerjee, D.; Biswas, S.; Daigle, C.; Siegford, J.M. Remote activity classification of hens using wireless body mounted sensors. In Proceedings of the 2012 Ninth International Conference on Wearable and Implantable Body Sensor Networks, London, UK, 9–12 May 2012; pp. 107–112. [Google Scholar]
  51. Daigle, C.; Banerjee, D.; Biswas, S.; Siegford, J. Noncaged laying hens remain unflappable while wearing body-mounted sensors: Levels of agonistic behaviors remain unchanged and resource use is not reduced after habituation. Poult. Sci. 2012, 91, 2415–2423. [Google Scholar] [CrossRef]
  52. Daigle, C.L.; Banerjee, D.; Montgomery, R.A.; Biswas, S.; Siegford, J.M. Moving GIS research indoors: Spatiotemporal analysis of agricultural animals. PLoS ONE 2014, 9, e104002. [Google Scholar] [CrossRef] [PubMed]
  53. Chen, T.; Guestrin, C. Xgboost: A scalable tree boosting system. In Proceedings of the 22nd Acm Sigkdd International Conference on Knowledge Discovery and Data Mining, San Francisco, CA, USA, 13–17 August 2016; pp. 785–794. [Google Scholar]
Figure 1. A poultry chicken with the wearable sensing device for tracking and monitoring of its health.
Sustainability 13 13396 g001
Figure 2. The distribution of the advancements to observe the poultry chicken behavior by addressing different approaches.
Sustainability 13 13396 g002
Figure 3. The pairplot of the actual data set with respect to pairwise relation between dustbathing, preening, and pecking.
Sustainability 13 13396 g003
Figure 4. The actual data comparison with the synthetic data generated using CTGAN [8].
Sustainability 13 13396 g004
Figure 5. The training and evaluation of the Decision Tree classifier to predict health of the poultry chicken.
Sustainability 13 13396 g005
Figure 6. The proposed IoT based Predictive Service to predict the health of the poultry chickens in real time.
Sustainability 13 13396 g006
Table 1. A summary of the advancements in Poultry Industry for observing chicken behavior by using different approaches.
ReferenceAnalysisMethodologyObjectiveLimitation
[3]SoundSound VibrationsAvian Influenza DiagnosisOverlapping of sound vibrations made it impossible to diagnose Avian Influenza within poultry chickens in large poultry farms
[19,20,21]SoundPecking Sound AnalysisFeed Intake and Growth DetectionDoes not provide the chicken healthiness and is not viable for poultry industry.
[22,23]SoundPeak FrequenciesGrowth DetectionSince humming sound vibrations overlapped, it is therefore not viable for poultry industry.
[24]SoundVocal Sound AnalysisDisease DetectionDifficult to deploy in large poultry farms since the vocals analysis is difficult as the overlapping of vocal vibrations occur between hundreds of chickens.
[25]SoundSound VibrationsNewcastle, Bronchitis virus, Avian Influenza DiagnosisDifficult to observe the sound of each poultry chicken in large poultry farms. Hence, it is difficult to deploy over large poultry farms.
[5]ImagePosture Feature ModelingDisease DetectionDisease Detection and Classification techniques required high computations as the proposed technique implements the SVM Model for classification.
[16]ImagePixels AnalysisAbnormal Feeding MonitoringThe adjacent pixels conflict with each other when large numbers of poultry chickens are observed on a larger scale.
[17]ImageFeces ObservationsEarly Detection of Infection and Abnormal Feeding MonitoringLight controlling needs to be made stable to analyze abnormal feeding behavior with a small number of poultry chickens
[26]ImagePixels AnalysisFlock Activity MonitoringUnable to observe the large number of poultry chickens in large poultry farms
[27]ImageObject DetectionCrowd MonitoringDoes not provide the the healthiness and is unable to scale for a large number of poultry chickens
[28]ImageIR Camera ImagesFeeder Crowd MonitoringChallenging to maintain light-controlled environment for observing IR Camera Images
[29]ImageComputer Vision (ANN)Weight PredictionWeight prediction is not viable for large poultry farms.
[30]ImageThermal Camera AnalysisTemperature DetectionProvides a naive approach to diagnosing disease within poultry farms based on temperature.
[31]ImageVideo Surveillance through Image ProcessingWalk Speed AnalysisChallenging to track and observe the individual chickens’ moving speed in large poultry farms.
[4,32]Wearable IoTRFID Sensing DevicesFlock Activity MonitoringOnly provides the tracking and monitoring and does not provide better accuracy to classify healthiness of the poultry chickens.
[33]Wearable IoTRFID Sensing DevicesNest Activity MonitoringOnly provides the tracking and monitoring of the poultry chickens inside and outside of the nest.
[34]Wearable IoTRFID Sensing DevicesKeel Bone Fractures and Egg Laying BehaviorDoes not provide the technique to classify between sick and healthy chickens in the poultry farms.
[35]Wearable IoTRFID Sensing DevicesFeeding and Nesting BehaviorOnly provides the tracking and monitoring technique.
[36]Wearable IoTRFID Sensing DevicesLocation TrackingOnly provides the tracking and monitoring technique.
[37]Wearable IoTStretchable TransistorsReal Time MonitoringProvides the real-time monitoring and tracking of the poultry chicken by transmitting continuous data.
Table 2. The poultry chicken movement data attributes from the available dataset [6].
AttributeTypeDescription
WeekINTEGERWeek number on which the observation is taken.
DateDATEDate on which the observation is taken.
FlockINTEGERPoultry chicken belonging to the specific flock.
BirdINTEGERUnique observation of a particular poultry chicken.
PeckingLONGNumber of Pecking (frequency) observed of a particular poultry chicken per day.
PreeningLONGNumber of Preening (frequency) observed of a particular poultry chicken per day.
DustbathingLONGNumber of Dustbathing (frequency) observed of a particular poultry chicken per day.
Table 3. The performance evaluation of machine learning and deep learning models to classify the poultry chicken through IoT Service.
Classification ModelAccuracyPrecisionRecallF1-Score
Decision Tree0.807 (+/− 0.077)0.804 (+/− 0.076)0.805 (+/− 0.078)0.804 (+/− 0.077)
Logistic Regression0.785 (+/− 0.153)0.787 (+/− 0.135)0.788 (+/− 0.149)0.783 (+/− 0.150)
K Nearest Neighbour0.778 (+/− 0.061)0.778 (+/− 0.045)0.779 (+/− 0.049)0.775 (+/− 0.053)
Gaussian Naive Bayes0.806 (+/− 0.081)0.811 (+/− 0.082)0.807 (+/− 0.085)0.803 (+/− 0.079)
Random Forest0.819 (+/− 0.074)0.812 (+/− 0.080)0.822 (+/− 0.092)0.819 (+/− 0.061)
Support Vector Machine0.699 (+/− 0.234)0.725 (+/− 0.246)0.715 (+/− 0.220)0.698 (+/− 0.233)
TabNet (Deep Learning)0.956 (+/− 0.107)0.979 (+/− 0.047)0.964 (+/− 0.134)0.953 (+/− 0.082)
Publisher’s Note: MDPI stays neutral with regard to jurisdictional claims in published maps and institutional affiliations.

