Article

Carbon Dioxide Separation by Polyethylene Glycol and Glutamic Acid/Polyvinyl Alcohol Composite Membrane

1
Graduate Institute of Organic and Polymeric Materials, National Taipei University of Technology, Taipei 106, Taiwan
2
Beijing Key Laboratory for Green Catalysis and Separation, Department of Environmental and Chemical Engineering, Beijing University of Technology, Beijing 100124, China
3
Department of Molecular Science and Engineering, Research and Development Center for Smart Textile Technology, National Taipei University of Technology, Taipei 106, Taiwan
4
LI-COR Biosciences, Cambridge CB4 0WS, UK
*
Author to whom correspondence should be addressed.
Denotes equal contribution.
Sustainability 2021, 13(23), 13367; https://doi.org/10.3390/su132313367
Submission received: 6 October 2021 / Revised: 29 November 2021 / Accepted: 30 November 2021 / Published: 2 December 2021

Abstract

:
In this study, Polyvinyl alcohol (PVA) blended with Polyethylene glycol (PEG), Monosodium glutamate (MSG) and Glutamic acid (GA) was cast on a reverse osmosis membrane to form a composite membrane. It is expected that the ether group can increase the CO2 affinity of the membrane. Sodium tetraborate (Borax) as a crosslinker can increase membrane basicity and glutamic acid (salt) can provide an enhanced transport mechanism, thereby improving the permeability and selectivity of carbon dioxide. FTIR spectra show that the thickness of coating is sufficiently low, while SEM results show that PVA-PEG series have a dense surface, and particles are observed on the surface of MSG/GA series. The gas permeance and separation performance of the composite membrane was tested using a single gas. Results showed that CO2 had higher permeance (GPU) at lower pressure differential. PEG with an ether group had the greatest effect on improving CO2 permeance and selectivity. However, MSG and GA with amine groups could not effectively improve CO2 selectivity due to solubility. The best coating solution was provided by PVA-PEG-1.2. The CO2 selectivity of the composite membrane was 10.05 with a pressure differential of 1.00 bar in a humid environment and no obvious deterioration was observed over a 10-day period. Borax can improve selectivity, water absorption, and thermal stability while avoiding the need for high temperature and long crosslinking time of aldehydes, which makes it possible to be used in a PVA carbon dioxide separation membrane.

1. Introduction

The increasing demand for energy and an associated need to improve efficiency of energy consuming processes has led to a growing global willingness to use membrane materials as a potential long-term solution to reduce greenhouse gas emissions and prevent global warming. With global energy consumption expected to double by 2050, current fossil fuel reserves are under increasing environmental and economic pressure. The energy sector must unequivocally overcome the many technological barriers between membrane production, utilization, and potential applications. Polymer substrate membranes are one of the most popular separation materials in the industry, but their low temperature and chemical stability greatly limit their application. Despite these limitations, demand for inorganic gas permeable membranes is increasing in many cases. Carbon membranes are particularly useful in gas separation through adsorption and molecular screening mechanisms, even between gases of very similar molecular size [1,2,3,4]. However, in industrial applications, they suffer from low penetration and poor mechanical strength. To date, the utilization of polymer membranes in pilot plants and at industrial scales has been limited due to higher manufacturing costs. Therefore, to compensate for the high cost, manufacturers have explored ways to improve the separation performance of membrane materials for various gases [5,6].
Each membrane material has its advantages and challenges in terms of material cost, separation performance, and service life. The development of advanced membrane materials to increase cost-effectiveness is critical to reducing CO2 capture costs. Each membrane material has its own separation characteristics, thermochemical stability, and mechanical strength [7]. In general, most polymer membrane have good separation properties and relatively low costs, but the low stability of the membrane is a negative performance factor when exposed to acidic gases and harsh conditions (high temperature and high pressure), typical in many industrial processes.
Existing gas separation membranes must further improve permeability and selectivity to expand their market share and compete with traditional separation technologies. Since gas permeability is inversely proportional to the thickness of the dense layer, a high multi-layered material must be selected, or the thickness of the dense selective layer reduced to prepare a more efficient membrane. However, highly permeable materials typically exhibit low selectivity due to the trade-off between the permeability and selectivity of polymer materials [8,9]. Porous membranes may consist of a thin film composite (TFC) consisting of one or more layers of a porous substrate to maximize selectivity, permeability, and mechanical crosslinking, or a more traditional asymmetric film construction where a fine porous skin layer is applied to a thick microporous underlying layer. TFC construction offers a low skin advantage: (1) only a small amount of selective layer material, less than 2 g/m2, is required to coat the surface of a porous substrate, compared to approximately 50 g/m2 required to manufacture the overall skinning of an asymmetric film—therefore, the cost of materials is reduced when applying TFC construction; (2) depending on the product requirements, each layer of the membrane layer can be tuned for optimal separation; (3) as long as the main body of the membrane can form or deposit on the surface of the substrate thin layer, its mechanical properties and machinability restrictions are less. However, the manufacture of high-performance, defect-free TFC materials is challenging: (1) there are some challenges in the influence of substrate resistance; (2) performance is compromised if the thickness of the ultra-thin selective layer is inconsistent; (3) material intrusion sub-strategy; (4) ultra-thin selective layers accelerate aging and plasticization, and these harmful problems may degrade the performance of TFC [10,11,12,13].
Compared with the membrane after the solution diffusion mechanism, the promotion of the transmission mechanism contributes to high CO2 separation and CO2/N2 selectivity. In convenient transport, the CO2 separation capacity of a mobile carrier is higher than that of a fixed carrier, but lacks carrier stability [14]. Polyallylamine (PAA) is one of the fixed carriers used for CO2 separation and is mixed with other polymers, either without change or in the form of bit resistance [15,16,17,18,19,20,21]. PAA is primarily amine-based, which is very fragile and cannot form a membrane under dry conditions. The polyvinyl alcohol (PVA), in combination with PAA, is widely used as a fixed position in CO2 substrates and mixing bases [18]. Temperature and humidity influence the transport mechanism. PVA is soluble in water and at higher humidity a decrease in CO2 emission performance may be observed at temperatures lower than 70 °C [15].
Polyethylene oxide (PEO) membranes are considered attractive materials for CO2 separation because the polymer chain has polar ether-oxygen bonds and therefore it has a strong CO2 affinity [22]. Great efforts have been made in the design and synthesis of polymers containing PEO. Hirayama et al. [23] synthesized films containing PEO and crosslinking polymers with a CO2/N2 selectivity of 69 and a CO2 penetration rate of 62 Barrer. Potreck et al. [24] argue that PEO-based block congregations provide an attractive way to integrate CO2 separation using thin-film technology because of the high interaction between CO2 and its polar ether connections.
In this study, polyvinyl alcohol was chosen to make the main polymer. It is a convenient polymer to use, being non-toxic and water soluble. Polyglycol was selected to increase the solubility coefficient and CO2 affinity. To avoid high molecular weight leading to crystallization and reduction in the permeability of CO2, liquid PEG200 was used in the preparation of the membrane. In addition, consideration was given to the pH value of the membrane and reduction of cross-link reaction time and temperature. To this end, polyvinyl alcohol was chosen, as cross-linking occurs at room temperature. In addition, tetraborate (Borax) was employed as a crosslinking agent. Once prepared, the composite membrane was tested to determine carbon dioxide permeability and selectivity in both dry and humid environments. Monosodium glutamate (MSG), which is expected to promote transport mechanisms and therefore increase CO2 permeability and selectivity of the composite membrane was also tested, while glutamic acid (GA) was also used in experiments to compare the effects of glutamic acid (salt).

2. Materials and Methods

2.1. Chemicals and Equipment

Polyvinyl alcohol (PVA) (Mw = 31,000–55,000 g/mol, 98.0~98.8% hydrolyzed), polyethylene glycol (PEG) (Mw = 200 g/mol), sodium tetraborate (Borax), monosodium glutamate (MSG), and glutamic acid (GA) were purchased from Acros Organics, Geel, Belgium. All chemicals were used as received without treatment and deionized water was used as the solvent during preparation. The reverse osmosis membrane was purchased from Film Tec Corp. Minneapolis, MN, USA. N2 and CO2 applied in the experiments were purchased from Chin-Fung Ltd., Taipei, Taiwan.

2.2. Structure of Composite Membrane

Reverse osmosis membrane was used as a substrate and coated with a polymer-mixed solution to make a composite membrane. The uppermost layer of this composite membrane was dominated by polyvinyl alcohol (PVA), mixed with polyethylene glycol (PEG). Monosodium glutamate (MSG) or glutamic acid (GA) was an optional layer to contact the air, interacting with CO2 via its quadrupole moment. Gas penetration and separation were achieved via a dissolve diffusion mechanism. The reverse osmosis membrane was a polyamide layer about 200 nanometers thick and had approximately a 15 nanometers aperture from top to bottom, followed by a porous polysulfone (PSU) layer approximately 40 microns thick, with polyester at the bottom as a support layer approximately 120 microns thick.

2.3. Preparation of Polymer-Mixed Solution

In this experiment, a fixed PVA intake was configured in different proportions by adjusting the amount of PEG, MSG, GA, Borax, and deionized water. The polymer-mixed solution was divided into four preparation methods: (a) only used PVA and Borax (b) added PEGs and adjusted the combination of proportions (c) added MSGs and adjusted the combination of proportions and (d) added GA and adjusted the combination of proportions.

2.4. Preparation of Self-Supporting Membrane

A polymer-mixed solution was prepared with a micro straw of 10 mL, transferred to a petri dish and left in a drying chamber for 48 h, then placed in a vacuum oven (−700 mmHg) to dry for 24 h at 35 °C. The membrane was removed and baked in a hot air oven for 1 h at a temperature of 105 °C to remove the remaining moisture. This completed the preparation of the self-supporting membrane.

2.5. Preparation of Composite Membrane

A substrate reverse osmosis membrane (about 15 × 20 cm) was fixed to the glass plate, and then the prepared polymer-mixed solution was applied to this membrane with a plastic form coated rod. The modified substrate was placed in a drying oven for 24 h before being transferred to a vacuum oven (-00 mmHg) at 35 °C where it was further dried for 24 h. This process resulted in a polymer membrane formed on the substrate surface. After making a polymer membrane, Fourier-Transform Infrared Spectroscopy-Attenuated Total Reflection (FTIR-ATR, using SHIMADZU IRSpirit with QATR-S module), Thermogravimetric Analysis (TGA, using NETZSCH TG 209 F3), and Scanning Electron Microscopy (SEM, using HITACHI TM4000Plus) were used to confirm surface modification on the reverse osmosis membrane.

2.6. CO2 Permeation Test

The gas membrane permeation system device is shown in Figure 1. Pure N2 or pure CO2 gas enters the line via a float flow control valve. The inlet pressure into the system is controlled by means of a precision pressure control valve, with pressure measured by a pressure meter. The pipeline is divided into two paths. One path is through a deionized water humidifier. The humidifier consists of a water vessel immersed in a thermostatic tank set at 35 °C. Gas is passed through the water to achieve a relative humidity (RH) of approximately 80%. After the humidifier, the gas and moisture enter the gas penetration device which contains the membrane to be tested. The gas penetration device is placed in the hot air oven and this is set to a fixed temperature. This temperature is maintained for the duration of the experiment to reduce any changes in membrane performance that may arise from temperature fluctuations. The lower end of the gas penetration device is connected with a three-way valve and the mass flow meter (Brooks Instrument, Hatfield, PA, USA) of the two gases is attached at each end, allowing evaluation of the performance of the membrane under test. During operation, the test gas can be humidified or dry, depending on the selected flow path as shown in Figure 2.
When a gas passes through a dense membrane, transport is mostly explained by the solution-diffusion model. A formula describing the passing properties of the gas, called permeability of the gas, is derived from Fick’s first law of diffusion theorem.

2.7. Principle

When a gas passes through a dense membrane, its behavior is mostly explained by the solution-diffusion model, and the membrane material itself has a formula for the passing properties of the gas, called the permeability of the gas, which is derived from Fick’s first law of diffusion theorem:
J = D c x
where J is the gas flux (cm−2 s−1), D is the gas diffusion coefficient in the membrane (cm2 s−1), and c x is the concentration gradient (cm−4).
The boundary condition is
x = 0, C = C1
x = L, C = C2
where x is length scale of the system (m), and L is the thickness of the membrane (cm). The concentration distribution of gas molecules in the membrane (mol m−3) can be solved by boundary conditions as shown in the following equation:
C C 1 C 2 C 1 = x L
Equation (4) is substituted into Equation (3) to obtain the gas flux (J).
J = D C 1 C 2 L
The physical significance of the gas flux is the area per unit, the number of gas molecules passed in a unit time:
J = 1 A n t
Combine Equations (5) and (6) to obtain:
1 A n t = D C 2 C 1 L
Assuming that the dissolution and evaporation of the gas is balanced, the concentration at the membrane interface is related to the dispensing of the components in the gas and it must comply with Henry’s Law:
C = S p
where C is the solubility of a gas at a fixed temperature (mL gas L−1), S is the solubility coefficient of the gas for the membrane (mL gas L−1), and p is the partial pressure of the gas (atm).
At constant temperature, S1 = S2 = S, Equation (8) substituted into (7) obtains:
1 A n t = D S 2 p 2 S 1 p 1 L = D S p 1 p 2 L
The defined permeability coefficient is:
P = D S
Equation (10) substituted into (9) obtains:
1 A n t = P p 1 p 2 L
The gas permeability coefficient P is arranged as:
P = L p 1 p 2 A n t
Measurements are usually made in Barrer units:
1 Barrer = 10 10 cm 3 ( STP ) cm cm 2 sec cm Hg
In addition to permeability, the overall permeability of the membrane is often expressed as a gas permeability (Permeance), which is the gas penetration coefficient divided by the membrane thickness L as follows:
Permeance = Permeability L = 1 p 1 p 2 A n t
Its physical significance is described as:
Permeance = Gas   amount Pressure   difference × Surface   Area
From Equation (15), permeance units can be expressed as cm 3 ( STP ) cm cm 2 sec cmHg . Because this number is small, it is usually expressed in gas Permeance Units (GPUs).
1 GPU = 10 6 cm 3 ( STP ) cm cm 2 sec cmHg
In addition, the film can be obtained by dividing the gas permeability or gas permeability coefficient of the two gases to obtain membrane selectivity:
Selectivity = Permeance ( Gas 1 ) Permeance ( Gas   2 ) = Permeability ( Gas 1 ) Permeability ( Gas   2 )

3. Results and Discussion

3.1. FTIR Analysis

3.1.1. Infrared Spectrum of Polyvinyl Alcohol Cross-Linked Borax

Polyvinyl alcohol membrane stretch vibrations of O-H and C-O are found at 3100–3600 and 1730 cm−1, respectively. At 2850–2950 cm−1 two C-H symmetrical and asymmetric stretch vibrations are observed, which may result from the undehydrated ethylene acetate group on polyvinyl alcohol. It can be seen that there is a C-H bending vibration at 1350 cm−1, and C-O stretch vibration feature peaks at 1140 and 1090 cm−1. Cross-linked membranes that have added Borax display similar absorption features, and are shown in Figure 3 and Table 1.
Since Borax in PVA-B-2 is only 2 percent of its weight relative to polyvinyl alcohol, to further determine the effects of Borax, a self-supporting membrane of PVA-B-8 sample with Borax content of 8 percent is formulated and adjusted. The instrument scanning parameters were measured at a resolution of 0.9 cm−1 and absorption peaks could be seen at 1286 cm−1 and 663 cm−1, while the PVA-B-2 membrane had a slight decrease in penetration in both locations. The two absorption peaks correspond to B-O-C and O-B-O stretching vibrations, representing boric acid from borax dissolved in water, acting as a cross-linker between polyvinyl alcohols in the process of forming a membrane. This was also observed and reported in previous studies [25,26,27] as shown in Figure 3 and Table 1.

3.1.2. Experimental Coating and Infrared Spectrum

Because the gas permeability is related to the thickness of the separation membrane under the condition that the gas permeability is constant, the thicker the separation membrane, the lower the gas permeability, and vice versa. FTIR, using a half-attenuation full-reflection device, was used as a means to make a preliminary confirmation that the membrane selection layer was thin enough. A polyvinyl alcohol self-supporting membrane, a reverse osmosis membrane and the experimental method of polyvinyl alcohol as a selection layer, coated as a support layer on the reverse osmosis membrane prepared composite membrane were analyzed.
The reverse osmosis membrane is itself a composite membrane of polyamide and polysulfone. From the spectrum in Figure 4 and Table 2, the reverse osmosis membrane prior to modification is seen to have stretching vibrations of O-H, C-H with alkane, N-H, C=C, and C-O at 3500–3200, 2966 and 1236, 1560, 1500, and 1050 cm−1, respectively. Characterized absorption that may come from a polycyclic group is: stretching vibration of C=C, C-O-C, O-S-O, C-H, and C-S-C at 1585 cm−1 and 1487, 1236, 1149, 1014, and 831 cm−1, respectively [26,28].
It is found that the absorption peaks of the reverse osmosis membrane prior to modification is concentrated below 1800 cm−1, although there are absorption peaks above 2700 cm−1, but not strong, while polyvinyl alcohol at 3600–3000 cm−1 displays a strong absorption peak of O-H stretching vibration, and there is an absorption peak resulting from the C-H stretching vibration near 2950 cm−1. Therefore, if coated with polyvinyl alcohol, the prepared composite membrane should display absorption features at 3000 cm−1 associated with O-H and at 2950 cm−1 resulting from C-H groups. The visible composite film results in features in the infrared spectrum, while at the same time peaks associated with the polyvinyl alcohol selection layer and reverse osmosis membrane support layer are also present. Since infrared spectral measurements are carried out by half-attenuation full reflection, the depth range of infrared light entering the sample is approximately 0.5 to 3 μm (related to the crystal refractive index, sample refractive index, incident angle and number of incident light waves used in the device). From this it can be inferred that the thickness of the coated polyvinyl alcohol selection layer should be less than 3 μm, as shown in Figure 4 and Table 2.

3.1.3. Infrared Spectrum of Polyvinyl Alcohol-Polyethylene Glycol

A fixed amount of polyvinyl alcohol was mixed with different volumes of polyethylene glycol and applied to a self-supporting membrane. The resulting materials were analyzed using ATR-FTIR; results are shown in Figure 5. The main absorption peaks of polyethylene glycol are C-H and C-O stretching vibrations at 2800–2900, and 1350 and 1090 cm−1, respectively. From the spectrum, it is observed that increasing the polyglycol addition results in strengthening of the absorption features associated with polyethylene glycol. This is especially evident for C-H and C-O stretching vibrations at 2800–2900 and 1090 cm−1, respectively.
A mixed solution of polyvinyl alcohol and polyethylene glycol was coated on the reverse osmosis membrane to prepare a composite membrane. ATR-FTIR was used to analyze the resulting materials; results are shown in Figure 6. The characteristic absorption features of the reverse osmosis membrane are observed, confirming that the coating is thin enough to allow infrared light to penetrate the selection layer to the reverse osmosis membrane. The strength of the absorption line at 1090 cm−1 is dependent on the amount of polyglycol in the sample.

3.1.4. Infrared Spectrum of Polyvinyl Alcohol–Sodium Glutamate

A fixed amount of polyvinyl alcohol was mixed with different weights of monosodium glutamate and prepared into a self-supporting membrane, which was analyzed by ATR-FTIR; results are shown in Figure 7. The presence of MSG is evident from the peaks at 1602 and 1395 cm−1 from the absorption of C-O stretching vibrations. It can be found that as the amount of added MSG increases, so the strength of the characteristic absorption feature associated with monosodium glutamate increases, resulting from the self-supporting membrane of PVA-MSG.
Polyvinyl alcohol is mixed with monosodium glutamate and coated in a reverse osmosis membrane to form a composite membrane; its infrared spectra are shown as Figure 8. Compared with the original reverse osmosis membrane, the composite membrane spectrum displays polyvinyl alcohol absorption lines, and the sodium glutamate C-O stretching vibration of 1602 cm−1. Penetration also decreased with an increase in the content of sodium glutamate, and from another C-O stretching vibration at 1395 cm−1, it can be seen that the absorption peak becomes more obvious, representing an increase in the MSG content in the selection layer.

3.1.5. Infrared Spectrum of Polyvinyl Alcohol–Glutamic Acid

Since a layer of crystallization is observed on the surface of the membrane when it is prepared for self-supporting membranes, only composite membrane spectra are shown in Figure 9 and Table 3. The glutamic acid itself is visible from absorption lines at 2950–3050 cm−1 from C-H, N-H or COOH, symmetrical N-H, and symmetrical COOH stretching vibration at 1635, 1500, and 1400 cm−1, respectively [29]. However, the absorptions resulting from these groups are not strong. The glutamate acid addition is low and thus an increase in strength of absorption features associated with this compound are not observed as the added amount is increased. There is also no change in penetration related to the added amount.

3.2. Thermogravimetric Analysis

To avoid a weight increase associated with increased thickness of the support material, the polyester support layer in the composite membrane is torn off, leaving only three layers of mixed polymer, polyamide and polyurethane. The thermal stability of the composite membrane is tested under an argon atmosphere with a temperature ramp increasing to 900 °C. Polyvinyl alcohol (PVA)-polyglycol (PEG) composite membrane thermal stability experimental results are shown in Figure 10 and Table 4. It is observed that the reverse osmosis membrane as a substrate has a significant weight loss only at 500–550 °C, which should be associated with the polysulfone that acts as a support layer. The composite membrane coated with PVA-PEG shows three stages of weight change. The first stage weight change at 150–250 °C comes from the loss of composite membrane moisture and PEG cracking, the second stage at 275–350 °C comes from PVA cracking, and the third stage at 500–550 °C is the same as the reverse osmosis membrane which is caused by PSU lysis. The experimental results of the polyvinyl alcohol-glutamic acid (salt) composite membrane thermal analysis are shown in Figure 11. In addition to PSU cracking, a weight change can be seen at 275–375 °C. From Figure 12, the maximum cleavage rate temperatures of glutamic acid (salt) and PVA are approximately 300–400 °C, so this temperature change should be as a result of the degradation of glutamate acid and PVA.

3.3. SEM Analysis

SEM was used to observe the membrane surface pattern and showed that the polyamide layer distribution as a substrate had many holes, as shown in Figure 13A. When the composite membrane surface is coated with a polyvinyl alcohol solution (PVA-B-2), the original rough surface is covered by PVA and converted to a dense surface as shown in Figure 13B.
In the PVA-PEG series of polyvinyl alcohols with different proportions of polyglycol, the surface of the coated composite membrane remains dense, no different from the PVA-B-2 condition of the original polyethylene glycol addition as shown in Figure 14.
A PVA-MSG series of samples of polyvinyl alcohol with added sodium glutamate, whose surfaces remain dense when MSG is less than 9 wt% (PVA-MSG-0.4) as shown in Figure 15A–C. From Figure 15D–F, as the MSG addition increases, particles are observed on the membrane surface, and as the amount added increases further, so the particle size becomes larger and more widely distributed. The particles are crystalized MSG distributed on the membrane surface.
The coating solution is changed to polyvinyl alcohol to add glutamate acid PVA-GA series samples. The GA addition amount is less than 9 wt% (PVA-GA-0.4). Its surface also appears to be in a dense state as shown in Figure 16A–D. From Figure 16E,F, as the GA addition continues to be increased above 13 wt% (PVA-GA-0.6), granular fluctuations are found on the surface, while at 17 wt%, GA will have larger particles, which result from GA aggregation.

3.4. Effect of Moisture on the Separation Efficiency of Polyvinyl Alcohol-Polyglycol Composite Membrane

The experimental results are shown in Figure 17 and Table 5 and Table 6. In wet environments, CO2 permeability is improved compared to dry environments, while N2 permeability decreases slightly compared to dry environments, resulting in a significant improvement in CO2/N2 selectivity in wet environments compared with dry environments. This can be attributed to the ambient humidity increasing moisture content in the hydrophilic polyvinyl alcohol membrane, so that CO2 can react with the water to produce bicarbonate, accelerating the transmission of CO2 in the membrane. CO2 permeability increases, compared with N2, since water solubility for the latter is small [30,31], making CO2/N2 more selective in humid environments than in dry environments.
PVA-PEG-1.2 has the best gas selectivity. This composite film was tested under different pressure difference conditions, with results shown in Figure 18 and Table 7. It is observed that the nitrogen permeability of the composite film does not change appreciably, while CO2 permeability and gas selectivity increase slightly with decreasing pressure difference. This decrease in pressure differential and increase in gas permeability are usually caused by the promotion of transmission mechanisms [30,32]. This occurs when the gas is passed through the membrane by the dissolve-diffusion mechanism, since its driving force comes from different pressures at both ends of the membrane, resulting in a gas concentration gradient. Calculation of permeability requires division of the pressure difference at both ends, with permeability in the simple solubility-diffusion mechanism assuming no gradient. For a small pressure difference, the proportion of promoting transmission mechanism is larger, and when the pressure difference gradually increases, the carrier molecules with CO2 gradually reach saturation. At this point, the system is converted from the dissolved-diffusion mechanism to account for a larger proportion. CO2 permeability will gradually tend to stabilize the constant [32]. There is a negative correlation between CO2 permeability and the pressure difference.
The experimental results show that there should be a transmission mechanism in the polyvinyl alcohol-polyethylene glycol membrane, which may be derived from moisture in the membrane. This is because polyvinyl alcohol is cross-linked, and the relative humidity of the dry environment set by the experiment is still approximately 40%. Whether in a dry environment or humid environment, the membrane still retains moisture to promote the transmission mechanism, so that in the case of reduced CO2 pressure, CO2 permeability can increase slightly.

3.5. Effect of Additional Sodium Glutamate and Glutamic Acid on Gas Separation Efficiency

Results from testing additional sodium glutamate in the PVA-MSG membrane are shown in Figure 19 and Table 8. It is observed that with increased MSG content, CO2 and N2 permeability also increase. Gas selectivity did not increase appreciably, especially when the MSG content is 23 wt%. N2 permeability is greatly increased, with gas selectivity falling close to 1. SEM analysis of the composite membrane shows the presence of crystalline MSG on the membrane surface. This results in gaps between PVA and MSG, making it easier for gas to pass through the membrane, thus reducing selectivity [18].
Results from testing additional glutamate acid in the PVA-GA membrane are shown in Figure 20 and Table 9. Similar to the addition of MSG, CO2 and N2 permeability increase with the additional content, but gas selectivity does not increase appreciably. Gas selectivity falls to approximately 1, the reason assumed to be the same as for the PVA-MSG membrane.

3.6. Separation Efficiency of CO2

Separation efficiency tests for PVA-PEG-1.2, PVA-MSG-0.8, and PVA-GA-0.4 composite membranes were completed. Experimental results are shown in Figure 21 and Table 10. Experiments show that the polyvinyl alcohol-polyethylene glycol as a selection layer coated on the reverse osmosis membrane can improve the concentration of CO2 passing through this composite membrane. PVA-PEG-1.2 can increase the concentration of CO2 to approximately 32.6 ppm (composite membrane concentration difference-reverse osmosis membrane concentration difference). The PVA-MSG-0.8 composite membrane and PVA-GA-0.4 composite membranes increased CO2 concentration by approximately 8.6 ppm and 5.0 ppm, respectively. These results show that the addition of glut amine or glutamate is not a viable option to affect a significant increase in CO2 concentration.

3.7. Water Absorption of the Membrane

The experimental results of water absorption measurement of the self-supporting membrane are shown in Table 11. The results show that compared with pure polyvinyl alcohol PVA membrane, water absorption of the PVA-B-2 membrane with Borax was increased from 52.3% to 60.7%, while the PVA-PEG-1.2 membrane with polyethylene glycol resulted in a higher increase to 72.1%. In contrast, water absorption of PVA-MSG-0.8 membrane with sodium glutamate decreased.
There are two reasons for the decrease in water absorption associated with the addition of sodium glutamate. Firstly, because the water absorptivity of sodium glutamate is less than that of polyvinyl alcohol, the addition of sodium glutamate results in an overall decrease in water absorptivity. Secondly, as observed via SEM analysis, sodium glutamate forms particles on the surface of the membrane, thus reducing the contact area between the membrane and moisture in the space. This results in a decrease in water absorption of the PVA-MSG-0.8 membrane over the same period.
The addition of sodium tetraborate increases water absorption. Sodium tetraborate dissolves in water to form a mixed solution of boric acid and hydrogen and oxygen root ions, increasing the overall pH In previous studies [30,31] researchers also found that when the PVA membrane is partially alkaline, water absorption of the membrane increased. Polyethylene glycol and polyvinyl alcohol are hydrophilic, while also reducing the crystallization of polyvinyl alcohol [33]. Therefore, water absorption of the PVA-PEG-1.2 membrane is higher than that of the PVA-B-2 membrane.

3.8. The Deterioration Measurement of the Selectivity of CO2 Membrane

In this experiment, the highest CO2 selectivity sample of each group, namely PVA-PEG-1.2, PVA-MSG-0.8 and PVA-GA-0.4 composite membrane, were teste. CO2 selectivity for each material was tested after 48, 96, 144, 192, and 240 h to determine whether the composite membrane has deteriorated over the 10-day period. Experimental results are shown in Figure 22 and Table 12.
Polyvinyl alcohol-polyethylene glycol is measured using PVA-PEG-1.2 composite membrane. The results showed that the selectivity of the gas composite membrane is approximately 9.5. There was no upward or downward trend, and no significant change occurred in 10 days.
Polyvinyl alcohol-sodium glutamate is measured using PVA-MSG-0.8 composite membrane. The results showed that the selectivity of the gas composite membrane is approximately 2.0. There was no upward or downward trend, and no significant change occurred in 10 days.
Polyvinyl alcohol-glutamic acid is measured using PVA-GA-0.4 composite membrane. The results showed that the selectivity of the gas composite membrane is approximately 1.9–2.0. There was no upward or downward trend, and no significant change occurred in 10 days.

3.9. Add Sodium Tetraborate (Borax) Crosslinking Effect

The best gas selectivity PVA-PEG-1.2 was selected as the control group. The material was also formulated using the same polyvinyl alcohol, polyethylene glycol ratio. The sample without Borax, PVA-PEG-1.2-NB, was prepared but with 15 mL Borax solution replaced by deionized water. Its formulation ratio is shown in Table 13. Gas permeability, gas selectivity and moisture adsorption measurement results are shown in Table 14. The experimental results showed that PVA-PEG-1.2 samples with Borax were higher in PVA-PEG-1.2-NB without Borax, but the gas selectivity was lower and moisture absorption was reduced.
The PVA-PEG-1.2 composite membrane with Borax added may have better CO2/N2 separation than PVA-PEG-1.2-NB without Borax: (1) It can be seen that the power radius of CO2 is 3.30, and the power radius of nitrogen is 3.64, so crosslinking may cause the membrane aperture and quantity to decrease. The result is that the gas dynamic radius of N2 is more affected, and permeability decreases more than for CO2, resulting in a selective increase in CO2/N2, as shown in Table 15. (2) It can be seen from the water adsorption experiment that PVA-PEG-1.2 is slightly higher than that of PVA-PEG-1.2-NB, which means it is easier to dissolve into the membrane because of the high solubility of CO2 in water, resulting in a selectivity increase in CO2/N2.
Simulation results of a linear addition of thermal weight changes in each component are shown in Figure 23. It can be seen that PVA-PEG produced significant weight changes in three stages. These occurred at approximately 125 °C, 200–350 °C and 375–450 °C, corresponding to moisture loss, lysis of polyglycol and polyvinyl alcohol branch chains, and cracking of polyvinyl alcohol main chains, respectively [25,34,35,36].
Comparing the simulated thermal weight loss with the actual experimental results, it is found that with polyethylene glycol mixed into polyvinyl alcohol, the original lysis of polyethylene glycol occurs at a reduced temperature of approximately 200 °C. Secondly, comparing PVA-PEG-1.2 with sodium tetraborate and PVA-PEG-1.2-NB without sodium tetraborate, it can be found that the residual weight of PVA-PEG-1.2 is slightly higher than PVA-PEG-1.2-NB. In addition, the residual weight of PVA-PEG-1.2 is higher before and after 400 °C, which is approximately 10% higher than the simulated thermal weight loss. The B-O-C bond is produced by the crosslinking of boric acid and hydroxyl, so that the polyvinyl alcohol branch chain is less, which could be cracked in this temperature range, resulting in a higher residual weight. Therefore, the use of Borax as a polyvinyl alcohol crosslinking agent can improve the thermal stability of the membrane.
From the experimental results, it can be seen that the use of Borax as a polyvinyl alcohol crosslinking agent, results in a slight decrease in carbon dioxide permeability, and an improvement in CO2/N2 selectivity, moisture adsorption and thermal stability. Polyvinyl alcohol is an improvement over other crosslinkers since, unlike formaldehyde, dialdehyde and other commonly used compounds, it can function at room temperature. Therefore, Borax and polyvinyl alcohol can be recommended for the purpose of manufacturing composite membranes suitable for CO2 separation.

4. Conclusions

In this study, the use of polyethylene glycol, glutamic acid, monosodium glutamate, water as a solvent and polyvinyl alcohol formulated a polymer mixing solution, coated to the surface of the dry reverse osmosis membrane, thereby improving carbon dioxide permeability and CO2/N2 selectivity. The addition of polyethylene glycol and glutamic acid (salt) to polyvinyl alcohol films can increase CO2 permeability. In a humid environment, because moisture promotes the composite membrane transmission mechanism, CO2 permeability and gas selectivity are higher than in a dry environment. PVA-PEG-1.2 composite membrane is the best selection for CO2 separation under the condition of a pressure difference of 1.00 bar and a humid environment, the selectivity reaching to 10.05. As PEG content continues to increase, nitrogen permeability increases by more than CO2 permeability, which leads to a decrease in selectivity. Glutamic acid (salt) may crystallize due to low solubility. The solubility of the amine-based acid itself should be considered when using amine-based acids in polyvinyl alcohol membrane preparation. During the 10-day test, the CO2/N2 selectivity of polyvinyl alcohol complex membranes, whether added to polyethylene glycol, sodium glutamate or glutamic acid, remained stable without degradation. Borax can be cross-linked at room temperature and can improve CO2/N2 selectivity, water absorption and thermal stability, which can be used by polyvinyl alcohol as the main CO2 separation membrane.

Author Contributions

Conceptualization, S.-M.C.; data curation, M.-H.T.; formal analysis and investigation, A.S. and M.-H.T.; project administration, S.-M.C. and M.-J.Y.; supervision, S.-M.C. and M.-J.Y.; writing—original draft, M.-H.T. and A.S.; writing—review and editing, S.-M.C. and G.L. All authors have read and agreed to the published version of the manuscript.

Funding

This research was funded by the Ministry of Science and Technology of Taiwan (MOST-107-2221-E-027-027) and the National Taipei University of Technology - Beijing University of Technology Joint Research Program (NTUT-BJUT-110-03; BJUT-NTUT-110-03).

Institutional Review Board Statement

Not applicable.

Informed Consent Statement

Not applicable.

Conflicts of Interest

The authors declare no conflict of interest.

References

  1. Lu, J.G.; Cheng, M.; Ji, Y.; Hui, Z. Membrane-based CO2 absorption into blended amine solutions. J. Fuel Chem. Technol. 2009, 37, 740–746. [Google Scholar] [CrossRef]
  2. Bernardo, P.; Drioli, E.; Golemme, G. Membrane Gas Separation: A Review/State of the Art. Ind. Eng. Chem. Res. 2009, 48, 4638–4663. [Google Scholar] [CrossRef]
  3. Metz, B.; Davidson, O.; De Coninck, H.C.; Loos, M.; Meyer, L. IPCC Special Report on Carbon Dioxide Capture and Storage, Intergovernmental Panel on Climate Change (IPCC); Cambridge University Press: Cambridge, UK, 2005; p. 442. [Google Scholar]
  4. Suleman, M.S.; Lau, K.K.; Yeong, Y.F. Plasticization and Swelling in Polymeric Membranes in CO2 Removal from Natural Gas. Chem. Eng. Technol. 2016, 39, 1604–1616. [Google Scholar] [CrossRef]
  5. Lin, H.; Freeman, B.D. Materials selection guidelines for membranes that remove CO2 from gas mixtures. J. Mol. Struct. 2005, 739, 57–74. [Google Scholar] [CrossRef]
  6. Klaassen, R.; Feron, P.H.M.; Jansen, A.E. Membrane Contactors in Industrial Applications. Chem. Eng. Res. Des. 2005, 83, 234–246. [Google Scholar] [CrossRef]
  7. He, X.; Yu, Q.; Hägg, M.B. CO2 Capture. In Encyclopedia of Membrane Science and Technology; Hoek, E.M.V., Tarabara, V.V., Eds.; Wiley: Hoboken, NJ, USA, 2013. [Google Scholar]
  8. Freeman, B.D. Basis of permeability/selectivity tradeoff relations in polymeric gas separation membranes. Macromolecules 1999, 32, 375–380. [Google Scholar] [CrossRef]
  9. Robeson, L.M. The upper bound revisited. J. Membr. Sci. 2008, 320, 390–400. [Google Scholar] [CrossRef]
  10. Baker, R.W.; Low, B.T. Gas separation membrane materials: A perspective. Macromolecules 2014, 47, 6999–7013. [Google Scholar] [CrossRef]
  11. Chung, T.S. A review of microporous composite polymeric membrane technology for air-separation. Polym. Polym. Compos 1996, 4, 269–283. [Google Scholar]
  12. Dai, Z.; Ansaloni, L.; Deng, L. Recent advances in multi-layer composite polymeric membranes for CO2 separation: A review. Green Energy Environ. 2016, 1, 102–128. [Google Scholar] [CrossRef] [Green Version]
  13. Li, P.; Chen, H.Z.; Chung, T.S. The effects of substrate characteristics andpre-wetting agents on PAN-PDMS composite hollow fiber membranes for CO2/N2 and O2/N2 separation. J. Membr. Sci. 2013, 434, 18–25. [Google Scholar] [CrossRef]
  14. Xie, K.; Fu, Q.; Qiao, G.G.; Webley, P.A. Recent progress on fabrication methods of polymeric thin film gas separation membranes for CO2 capture. J. Membr. Sci. 2019, 572, 38–60. [Google Scholar] [CrossRef]
  15. Sun, J.; Yi, Z.; Zhao, X.; Zhou, Y.; Gao, C. CO2 separation membranes with high permeability and CO2/N2 selectivity prepared by electrostatic self-assembly of polyethylenimine on reverse osmosis membranes. RSC Adv. 2017, 7, 14678–14687. [Google Scholar] [CrossRef] [Green Version]
  16. Zou, J.; Ho, W.S.W. CO2-selective polymeric membranes containing amines in crosslinked poly(vinyl alcohol). J. Membr. Sci. 2006, 286, 310–321. [Google Scholar] [CrossRef]
  17. Zhao, Y.; Ho, W.S.W. CO2-Selective Membranes Containing Sterically Hindered Amines for CO2/H2 Separation. Ind. Eng. Chem. Res. 2013, 52, 8774–8782. [Google Scholar] [CrossRef]
  18. Zhao, Y.; Ho, W.S.W. Steric hindrance effect on amine demonstrated in solid polymer membranes for CO2 transport. J. Membr. Sci. 2012, 415–416, 132–138. [Google Scholar] [CrossRef]
  19. Xing, R.; Ho, W.S.W. Crosslinked polyvinylalcohol–polysiloxane/fumed silica mixed matrix membranes containing amines for CO2/H2 separation. J. Membr. Sci. 2011, 367, 91–102. [Google Scholar] [CrossRef]
  20. Zhao, Y.; Jung, B.T.; Ansaloni, L.; Ho, W.S.W. Multiwalled carbon nanotube mixed matrix membranes containing amines for high pressure CO2/H2 separation. J. Membr. Sci. 2014, 459, 233–243. [Google Scholar] [CrossRef]
  21. Mondal, A.; Mandal, B. Synthesis and characterization of crosslinked poly (vinyl alcohol)/poly(allylamine)/2-amino-2-hydroxymethyl-1,3-propanediol/polysulfone composite membrane for CO2/N2 separation. J. Membr. Sci. 2013, 446, 383–394. [Google Scholar] [CrossRef]
  22. Cai, Y.; Wang, Z.; Yi, C.; Bai, Y.; Wang, J.; Wang, S. Gas transport property of polyallylamine–poly(vinyl alcohol)/polysulfone composite membranes. J. Membr. Sci. 2008, 310, 184–196. [Google Scholar] [CrossRef]
  23. Brunetti, A.; Scura, F.; Barbieri, G.; Drioli, E. Membrane technologies for CO2 separation. J. Membr. Sci. 2010, 359, 115–125. [Google Scholar] [CrossRef]
  24. Hirayama, Y.; Kase, Y.; Tanihara, R.; Sumiyama, Y.; Kusuki, Y.; Haraya, K. Permeation properties to CO2 and N2 of poly(ethylene oxide)-containing and crosslinked polymer films. J. Membr. Sci. 1999, 160, 87–99. [Google Scholar] [CrossRef]
  25. Potreck, J.; Nijmeijer, K.; Kosinski, T.; Wessling, M. Mixed water vapor/gas transport through the rubbery polymer PEBAX (R) 1074. J. Membr. Sci. 2009, 338, 11–16. [Google Scholar] [CrossRef]
  26. Chen, C.; Chen, Y.; Xie, J.; Xu, Z.; Tang, Z.; Yang, F.; Fu, K. Effects of montmorillonite on the properties of cross-linked poly(vinyl alcohol)/boric acid films. Prog. Org. Coat. 2017, 112, 66–74. [Google Scholar] [CrossRef]
  27. Lim, M.; Kwon, H.; Kim, D.; Seo, J.; Han, H.; Khan, S.B. Highly-enhanced water resistant and oxygen barrier properties of cross-linked poly(vinyl alcohol) hybrid films for packaging applications. Prog. Org. Coat. 2015, 85, 68–75. [Google Scholar] [CrossRef]
  28. Rashidzadeh, M.; Fathi, A.; Ehsani, N.; Baharvandi, H.; Rahimnejad Yazdi, A. Synthesis of Boron Carbide Nano Particles Using Polyvinyl Alcohol and Boric Acid. Ceram-Silikaty 2012, 56, 32–35. [Google Scholar]
  29. Singh, K.; Devi, S.; Bajaj, H.C.; Ingole, P.; Choudhari, J.; Bhrambhatt, H. Optical Resolution of Racemic Mixtures of Amino Acids through Nanofiltration Membrane Process. Sep. Sci. Technol. 2014, 49, 2630–2641. [Google Scholar] [CrossRef]
  30. Roddick-Lanzilotta, A.D.; McQuillan, A.J. An in situ Infrared Spectroscopic Study of Glutamic Acid and of Aspartic Acid Adsorbed on TiO2: Implications for the Biocompatibility of Titanium. J. Colloid Interface Sci. 2000, 227, 48–54. [Google Scholar] [CrossRef]
  31. Saeed, M.; Rafiq, S.; Bergersen, L.H.; Deng, L. Tailoring of water swollen PVA membrane for hosting carriers in CO2 facilitated transport membranes. Sep. Purif. Technol. 2017, 179, 550–560. [Google Scholar] [CrossRef]
  32. Saeed, M.; Deng, L. Carbon nanotube enhanced PVA-mimic enzyme membrane for post-combustion CO2 capture. Int. J. Greenh. Gas. Control. 2016, 53, 254–262. [Google Scholar] [CrossRef]
  33. Deng, L.; Kim, T.J.; Hägg, M.B. Facilitated transport of CO2 in novel PVAm/PVA blend membrane. J. Membr. Sci. 2009, 340, 154–163. [Google Scholar] [CrossRef]
  34. Entezam, M.; Daneshian, H.; Nasirizadeh, N.; Khonakdar, H.A.; Jafari, S.H. Hybrid Hydrogels Based on Poly(vinyl alcohol) (PVA)/Agar/Poly (ethylene glycol) (PEG) Prepared by High Energy Electron Beam Irradiation: Investigation of Physico-Mechanical and Rheological Properties. Macromol. Mater. Eng. 2017, 302, 1600397. [Google Scholar] [CrossRef]
  35. Barooah, M.; Mandal, B. Enhanced CO2 separation performance by PVA/PEG/silica mixed matrix membrane. J. Appl. Polym. Sci. 2018, 135, 46481. [Google Scholar] [CrossRef]
  36. Dilshad, M.R.; Islam, A.; Sabir, A.; Shafiq, M.; Butt, M.T.Z.; Ijaz, A.; Jamil, T. Fabrication and performance characterization of novel zinc oxide filled cross-linked PVA/PEG 600 blended membranes for CO2/N2 separation. J. Ind. Eng. Chem. 2017, 55, 65–73. [Google Scholar] [CrossRef]
Figure 1. Schematic diagram of the polymer membrane separation system. (A) N2 or CO2, (B) floating flow controller, (C) pressure gauge, (D) precision regulator, (E) humidifier, (F) temperature and humidity meter, (G) membrane separation system, and (H) mass flow meter.
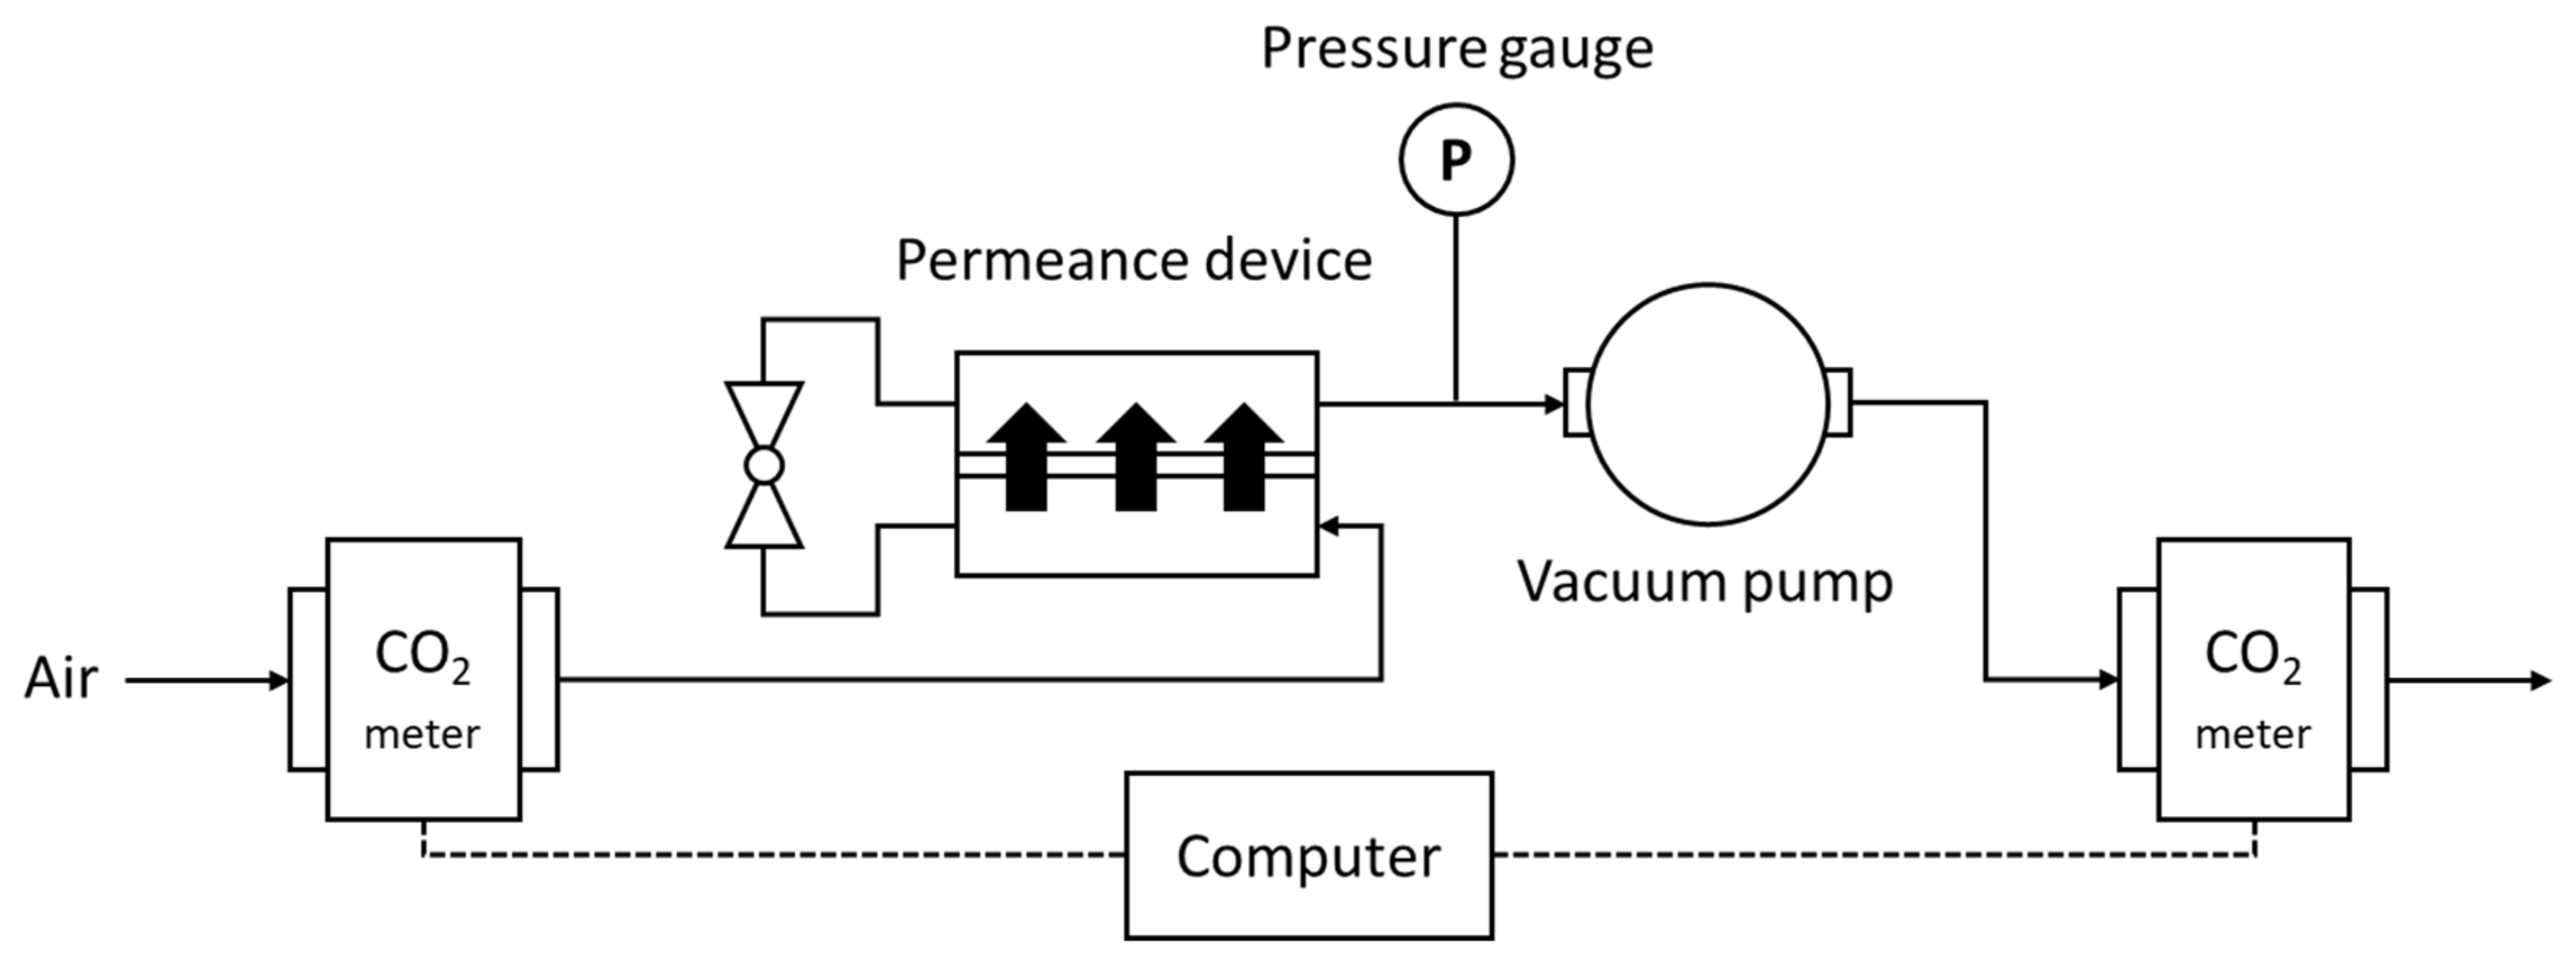
Sustainability 13 13367 g001
Figure 2. CO2 membrane separation energy measurement system.
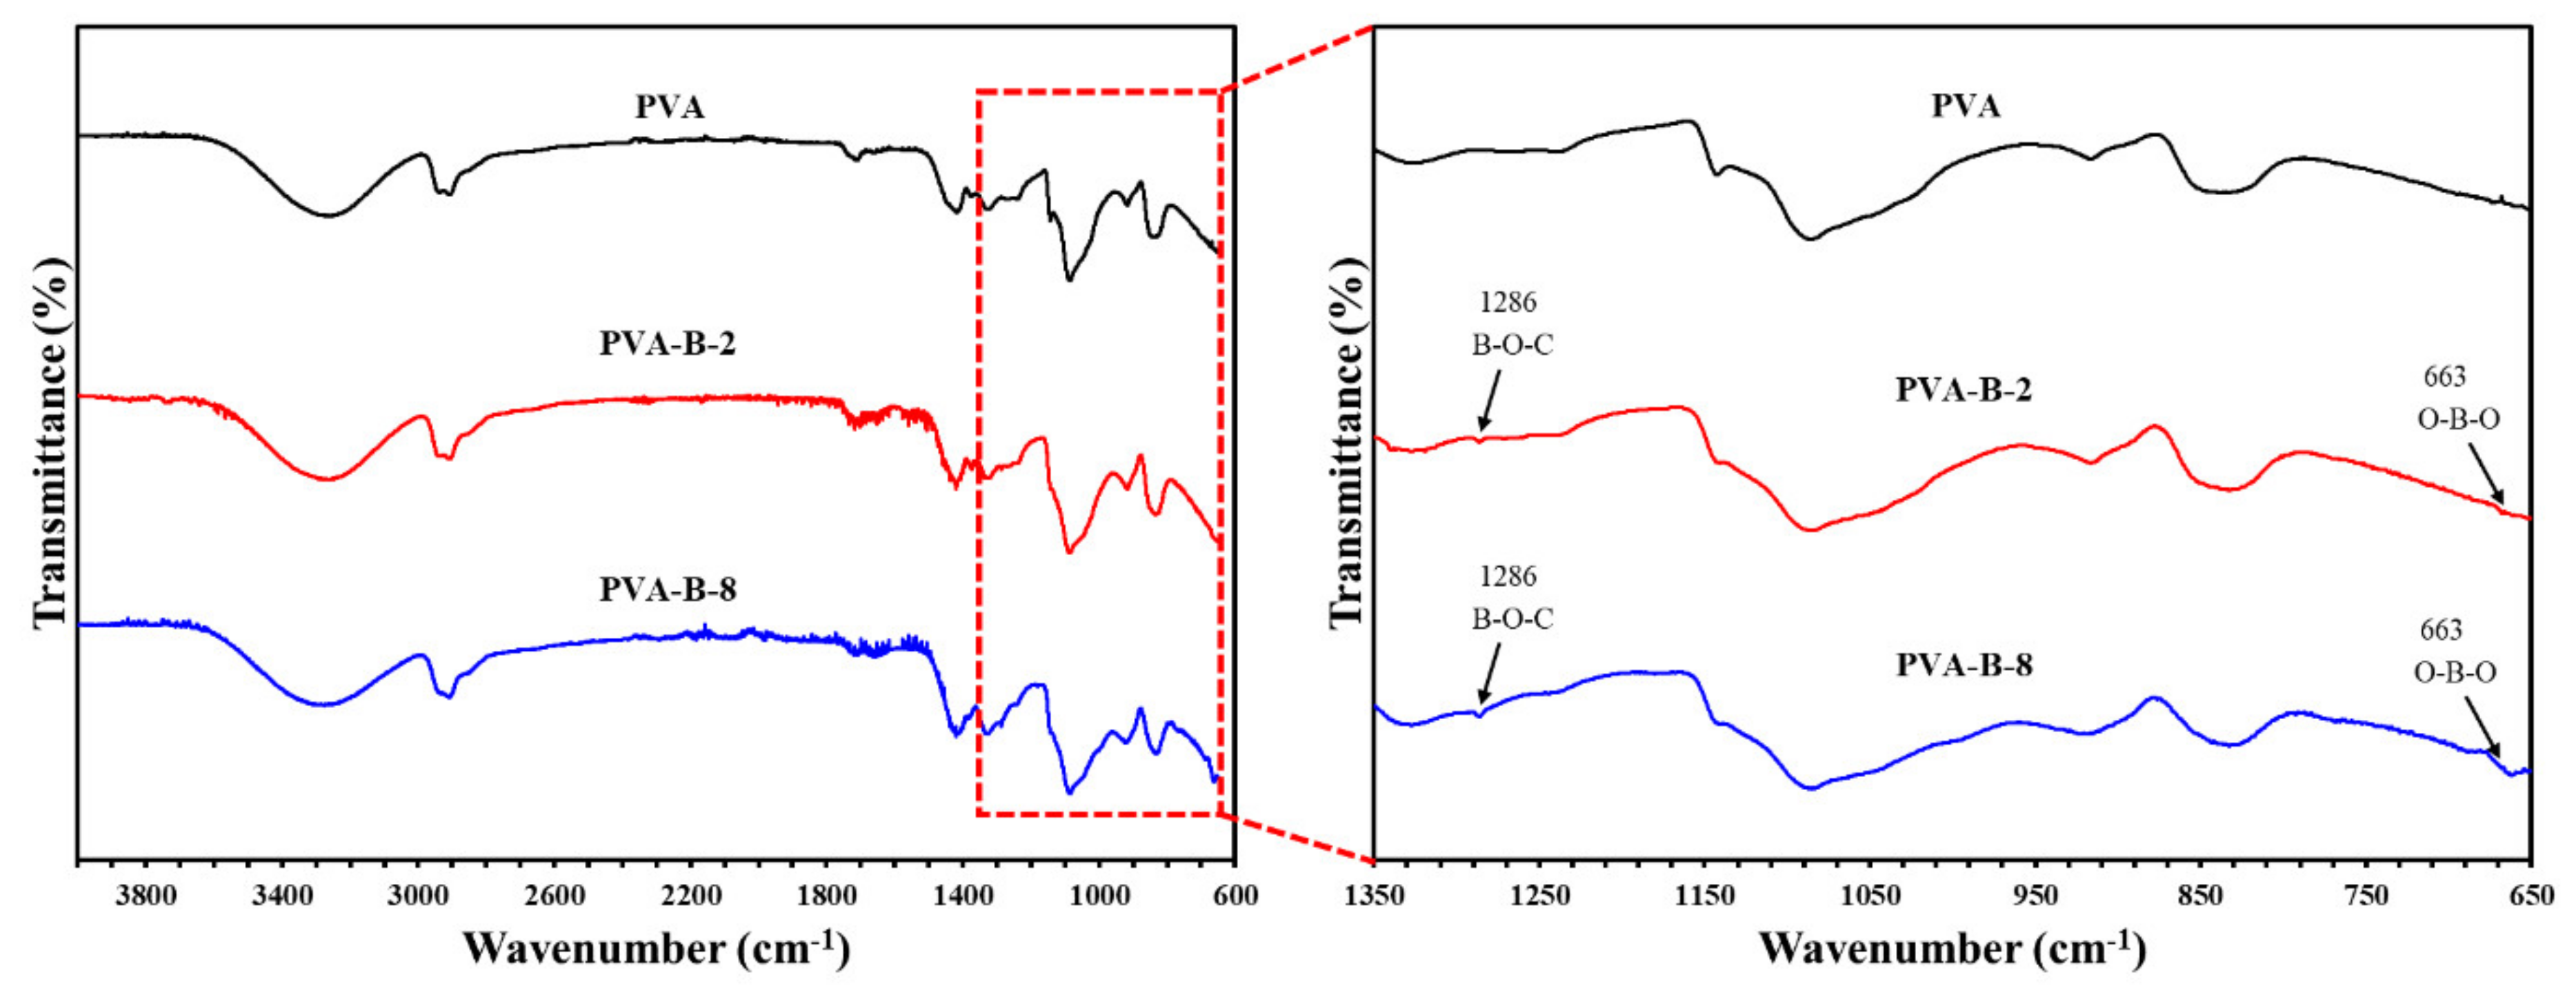
Sustainability 13 13367 g002
Figure 3. Infrared spectrum of PVA, PVA-B-2, and PVA-B-8 samples.
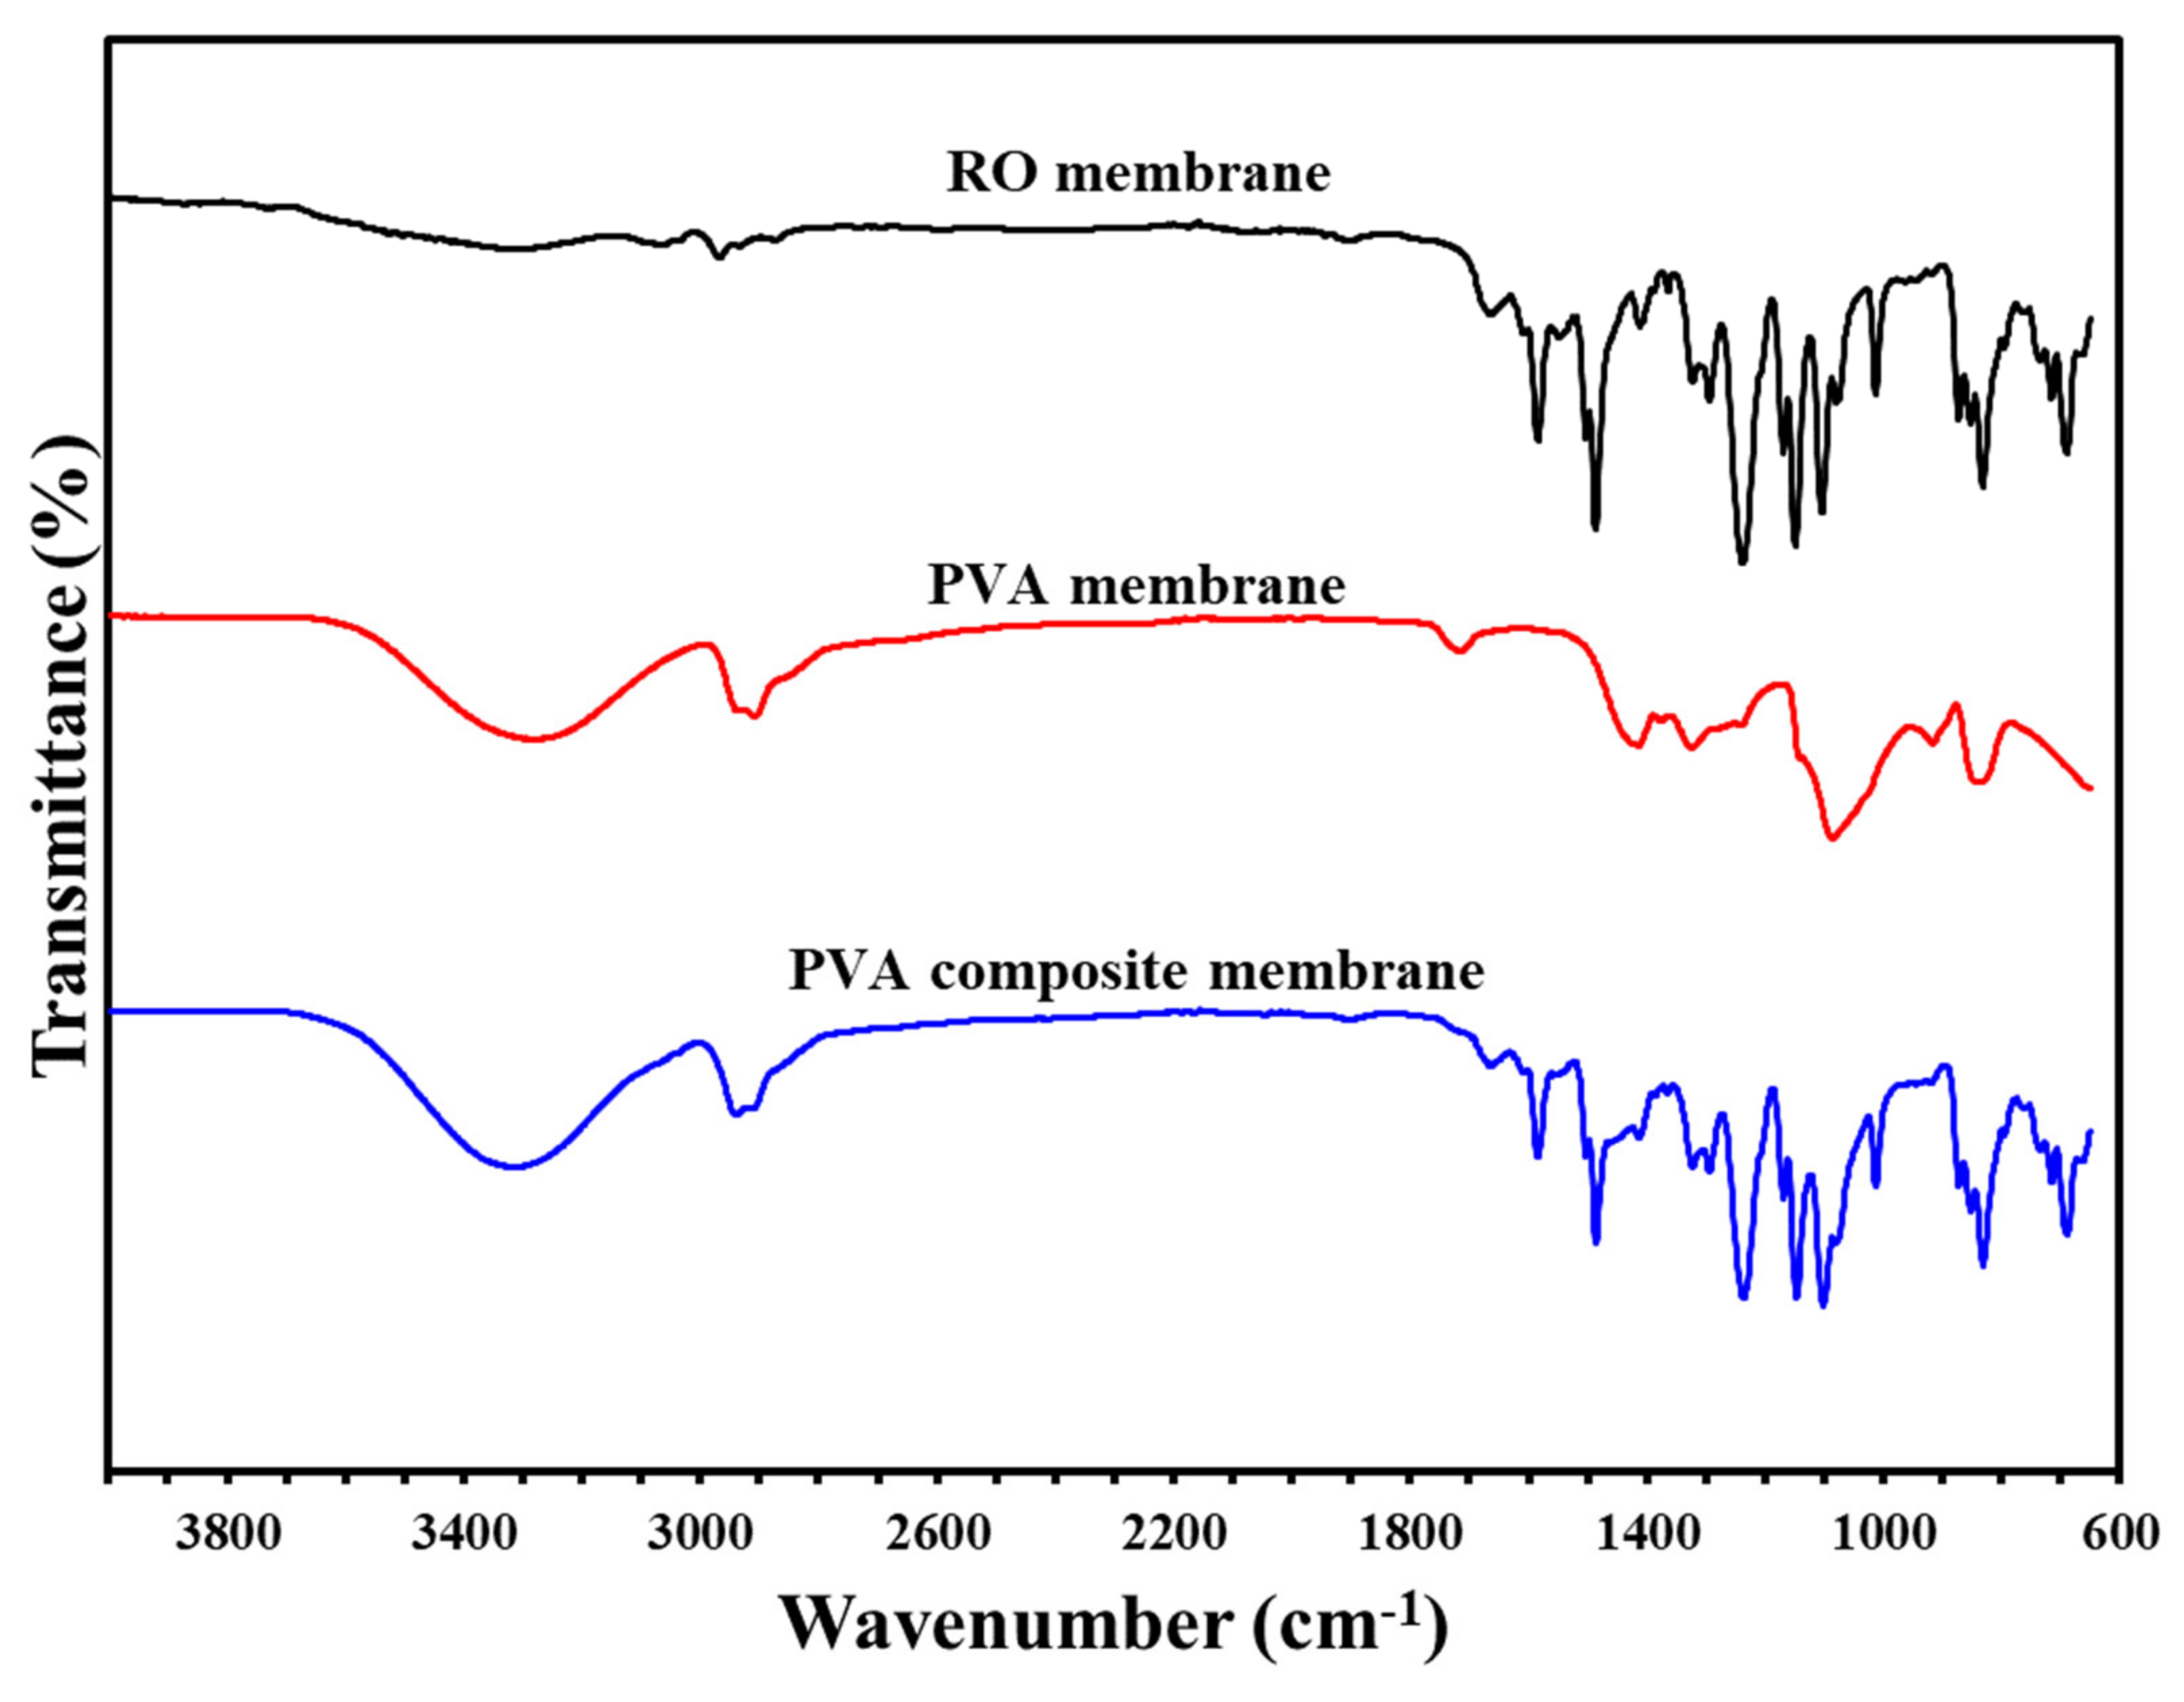
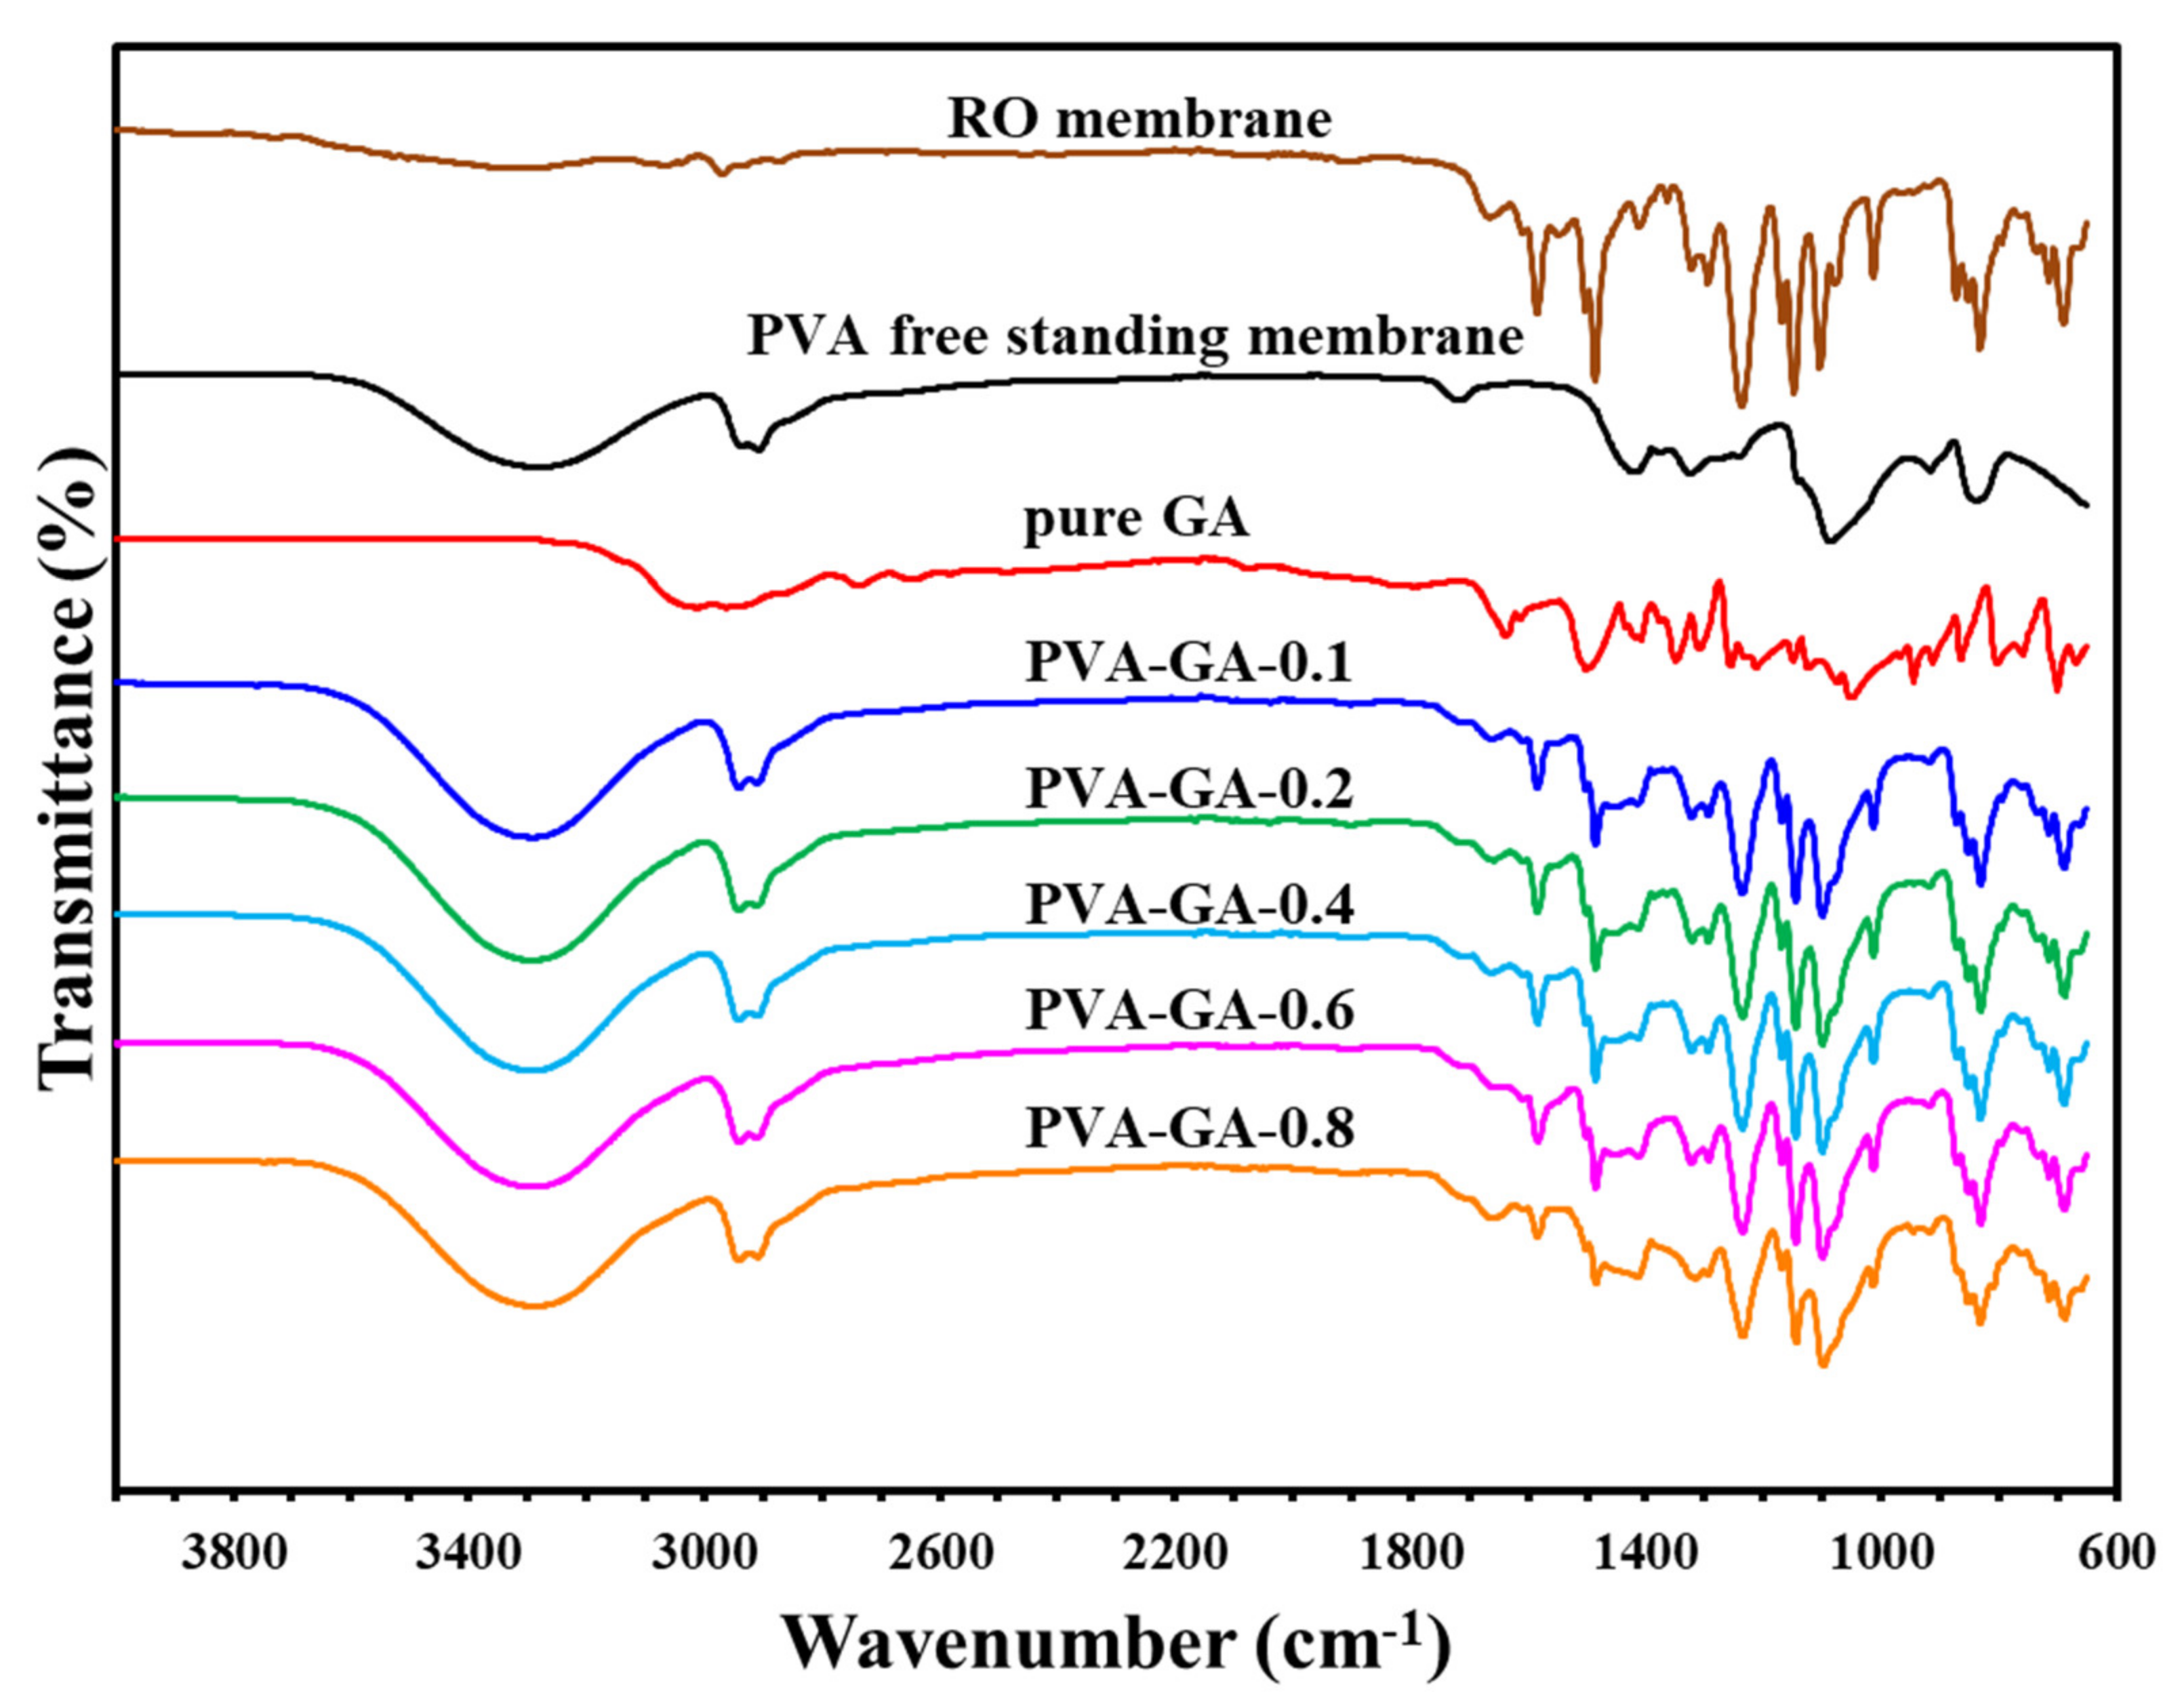
Sustainability 13 13367 g003
Figure 4. The infrared spectrum of the components of the composite membranes and each layer.
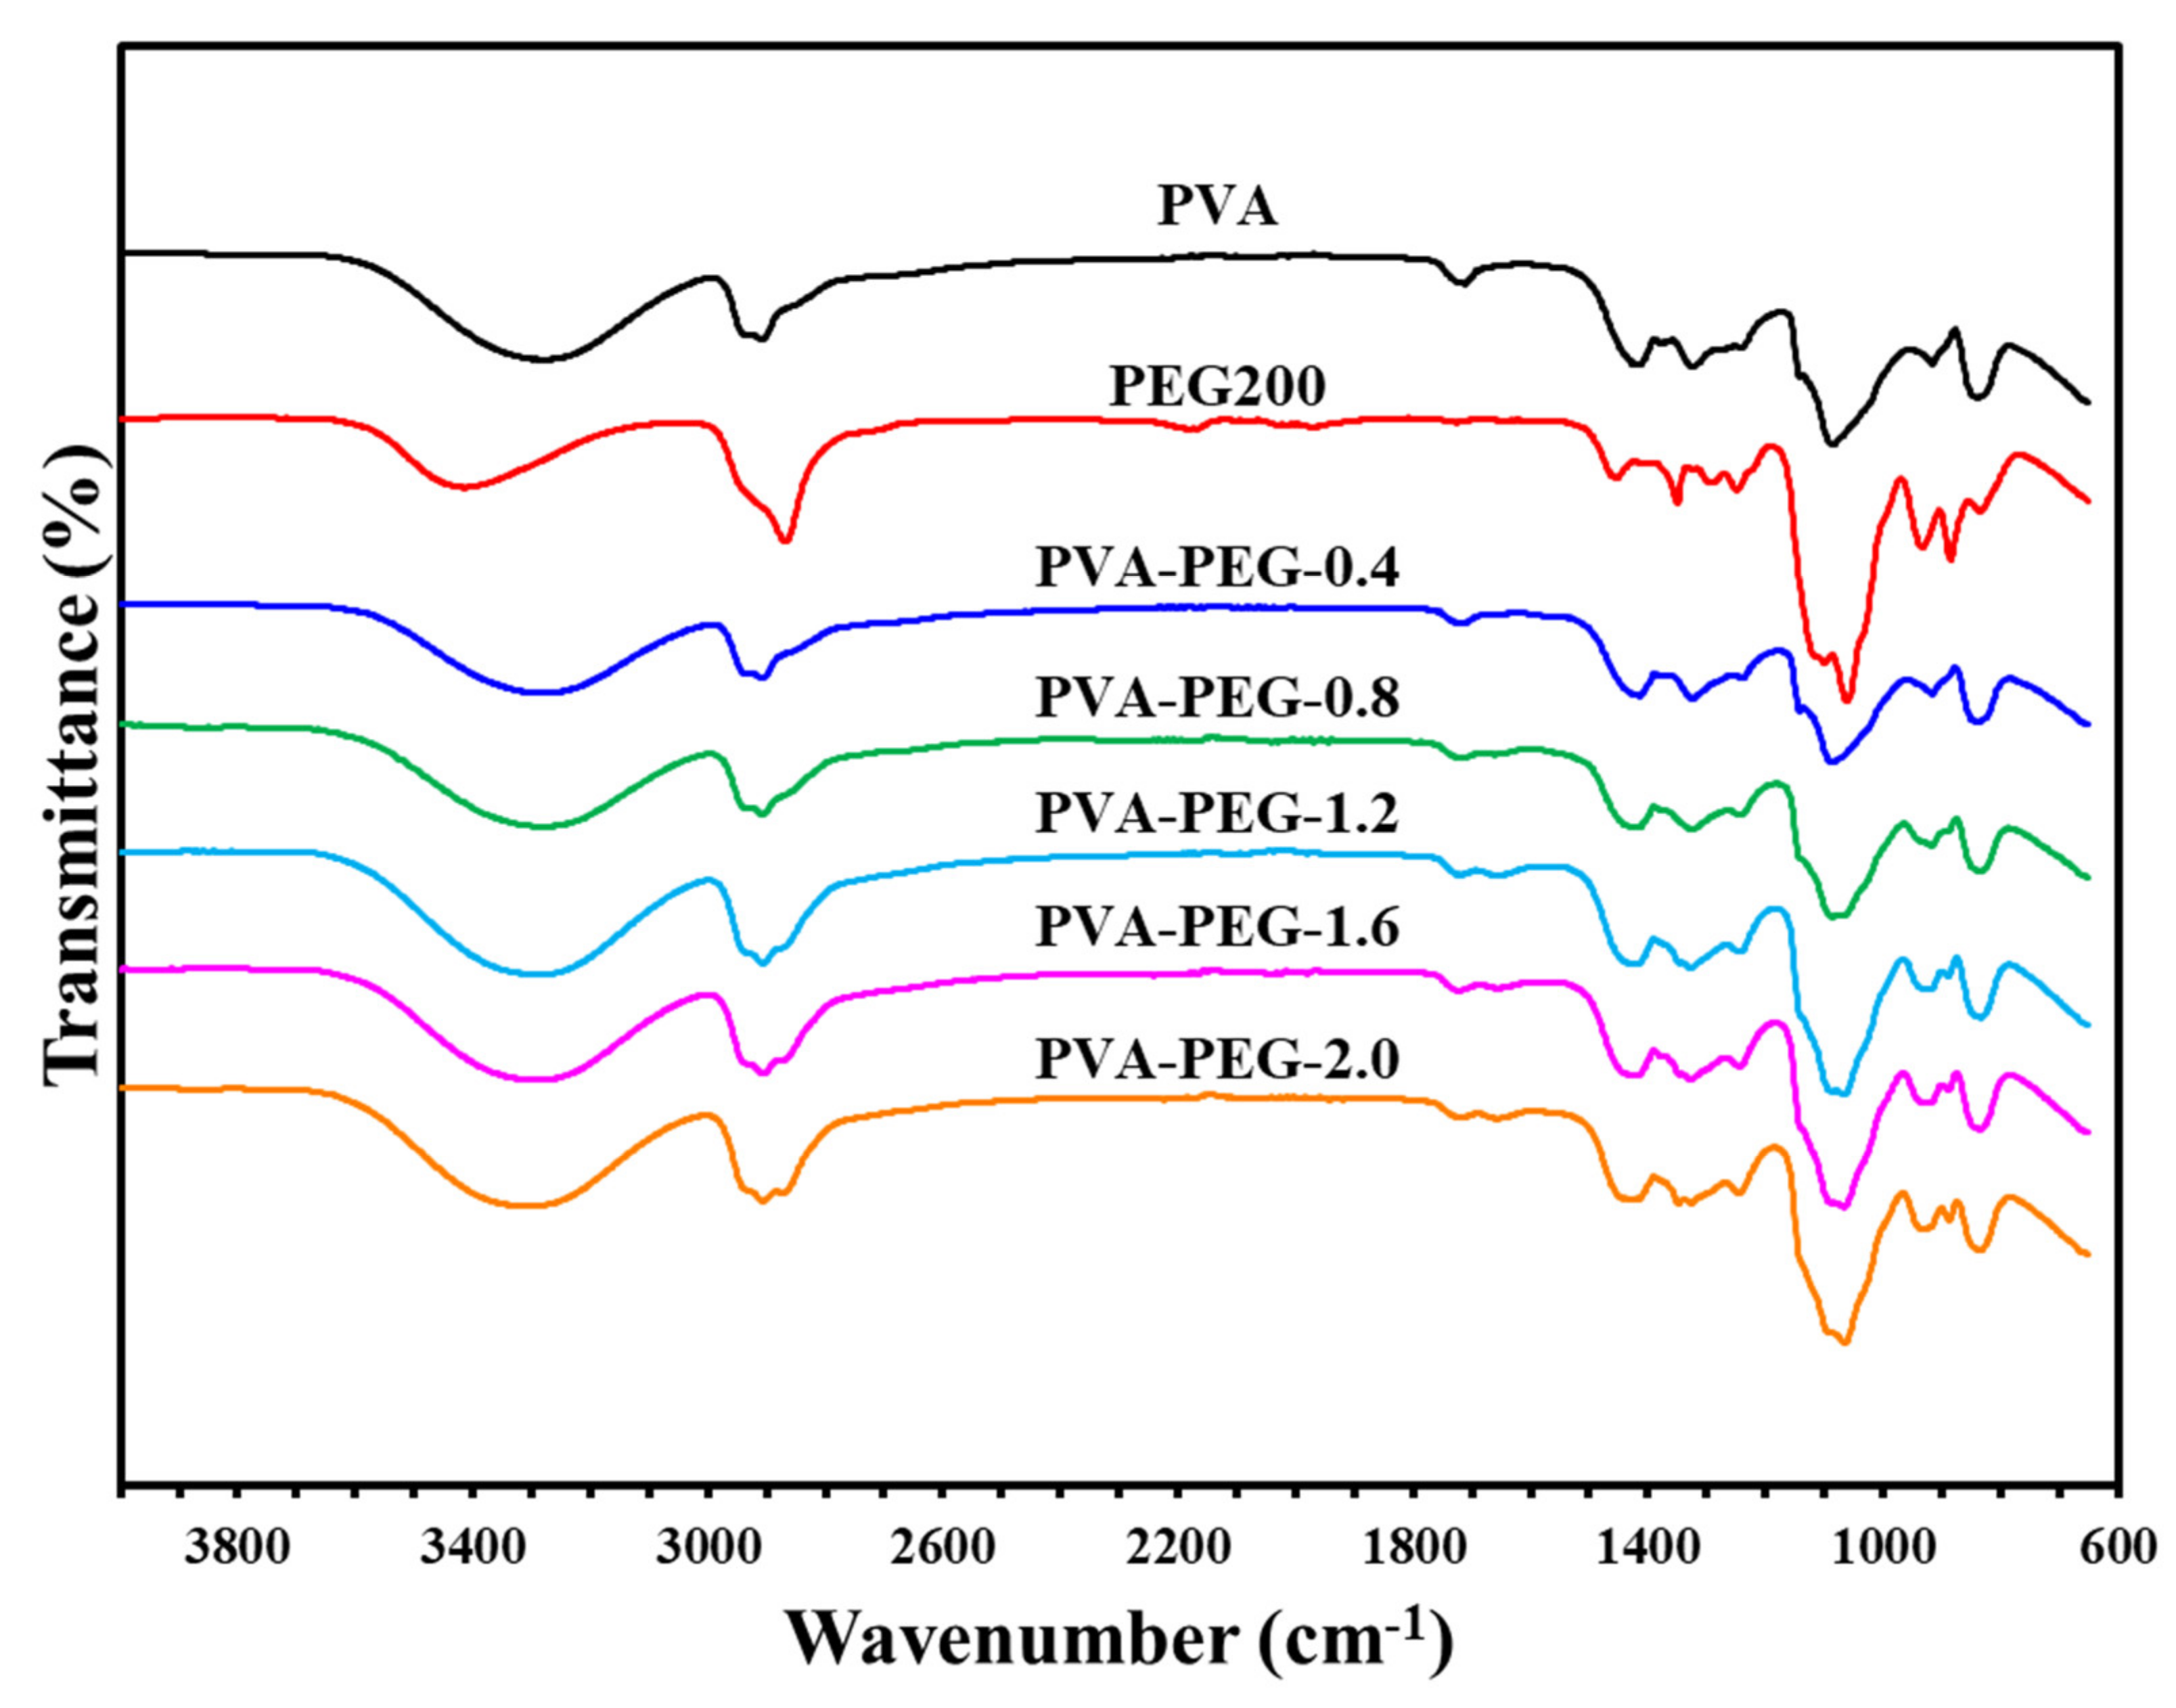
Sustainability 13 13367 g004
Figure 5. Infrared spectrum of polyvinyl alcohol-polyethylene glycol self-supporting membranes.
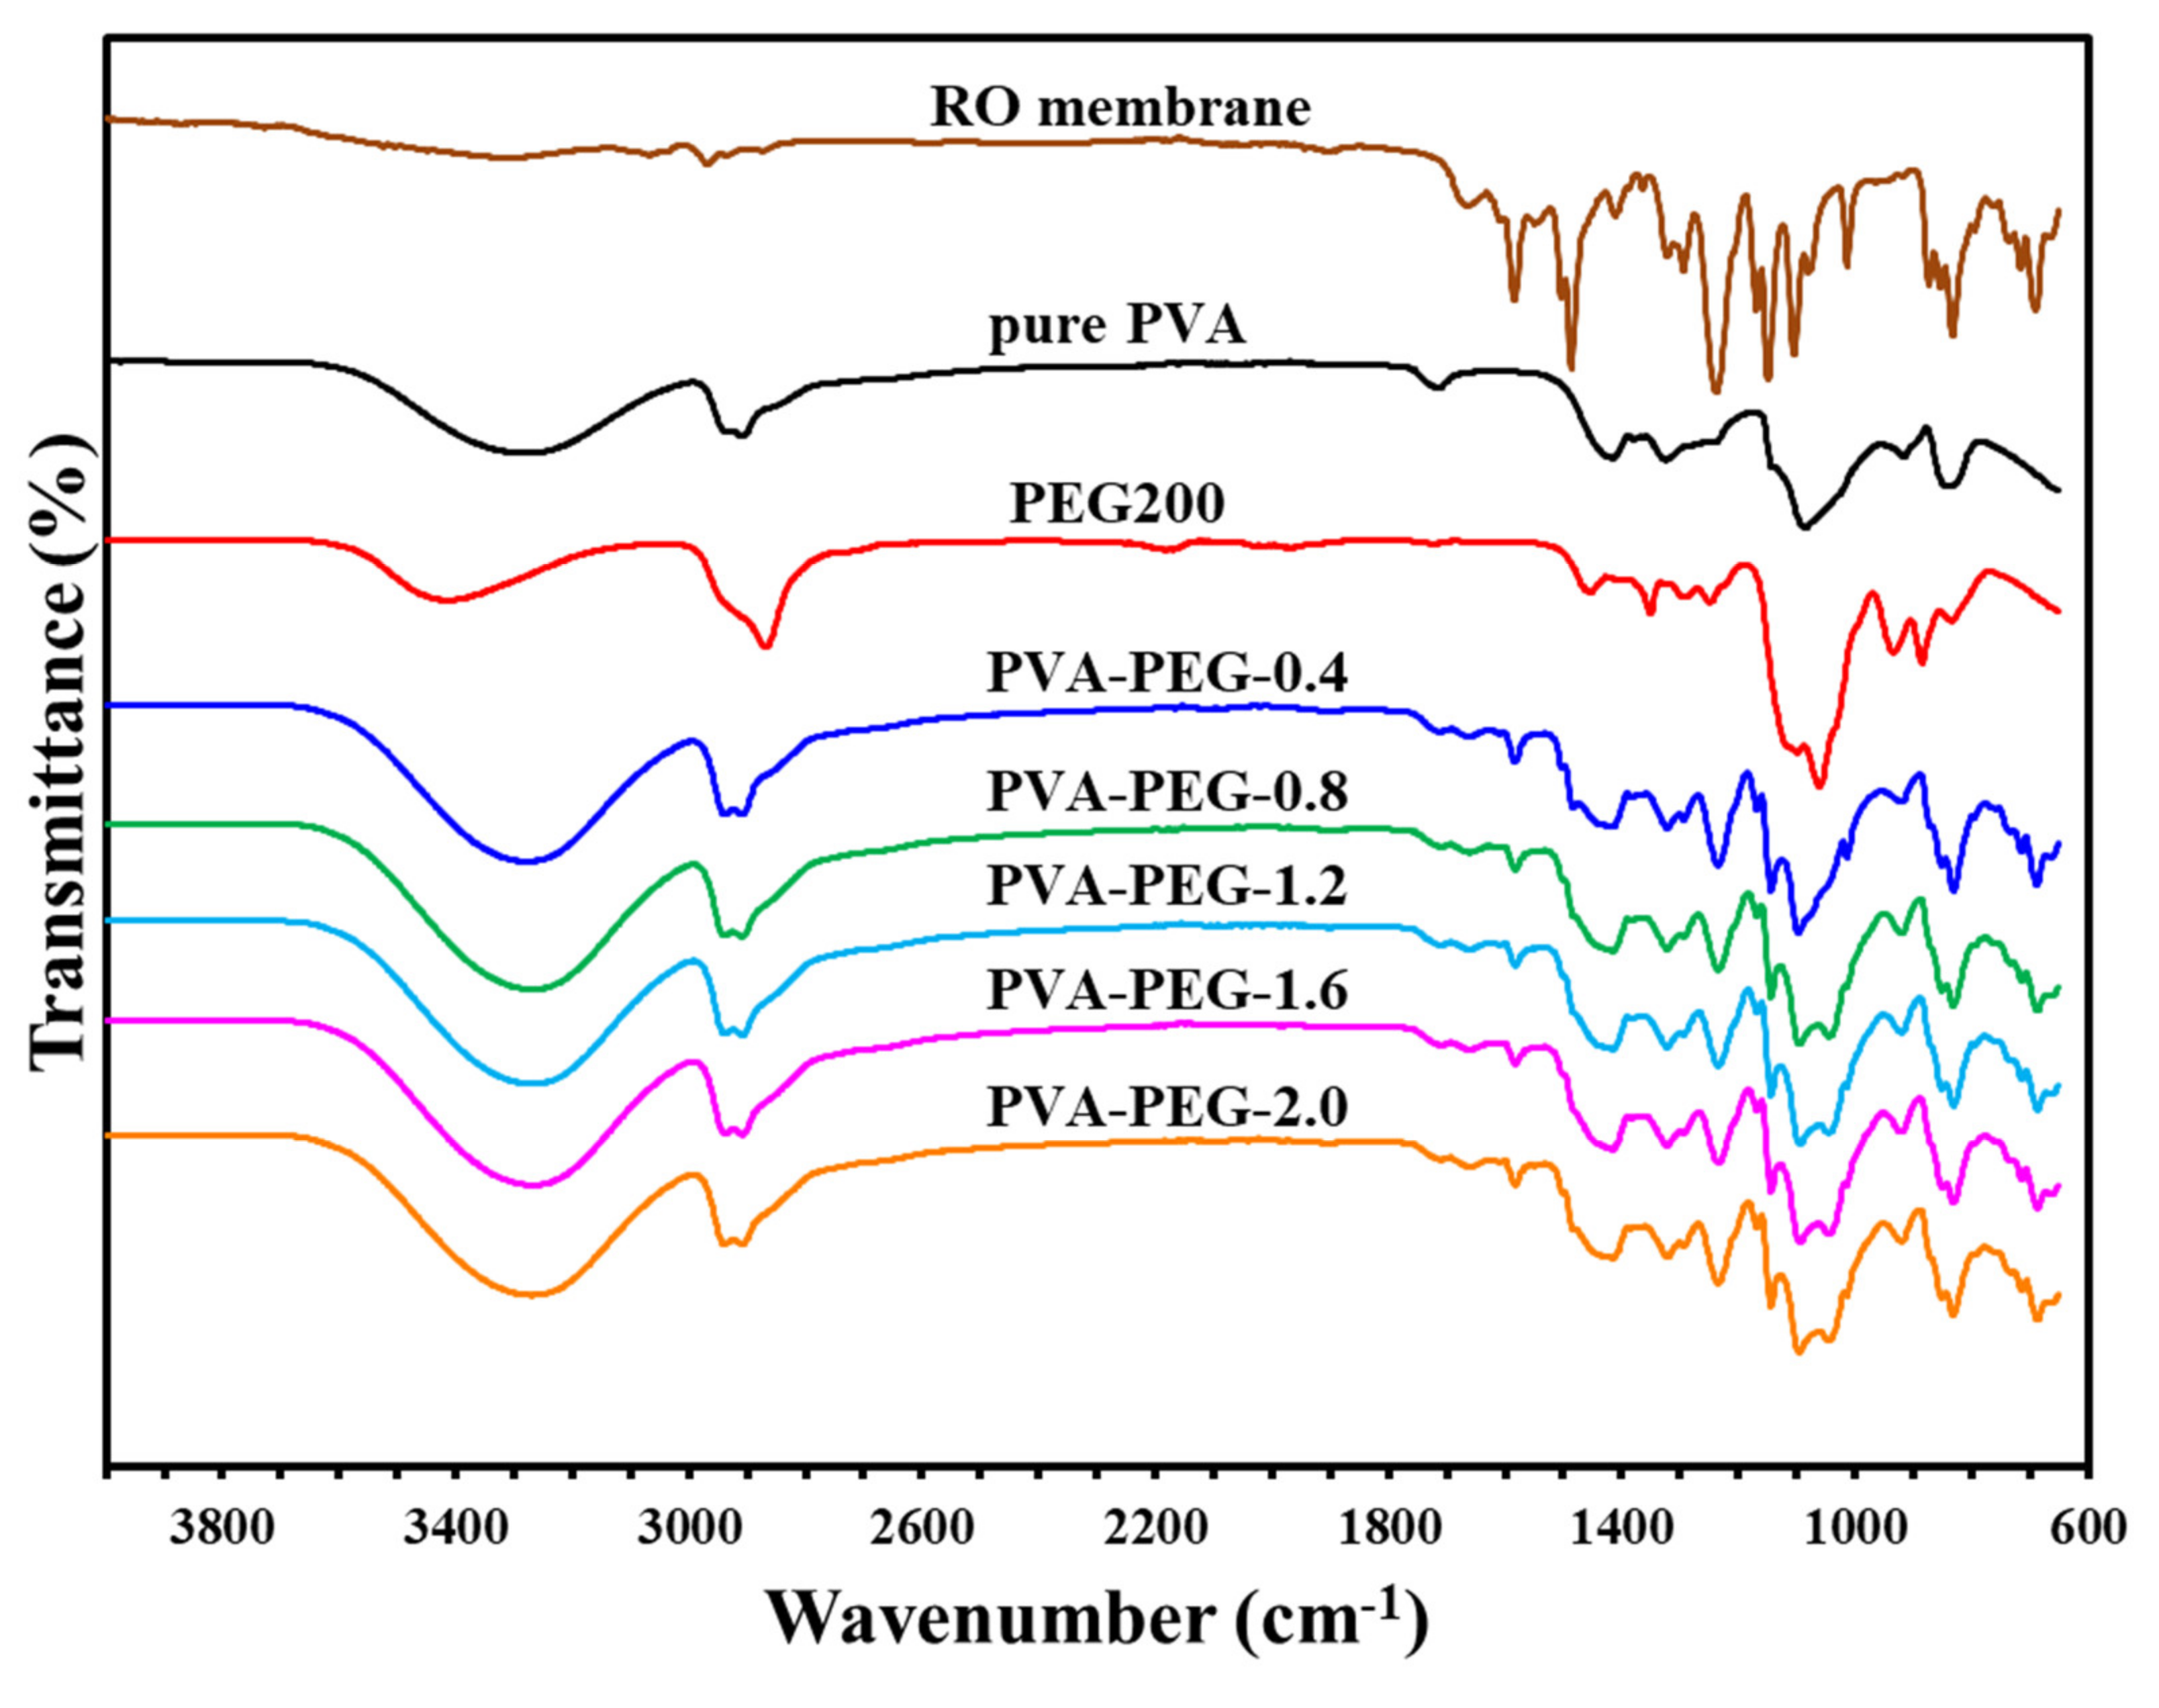
Sustainability 13 13367 g005
Figure 6. Infrared spectrum of polyvinyl alcohol–polyethylene glycol composite membranes.
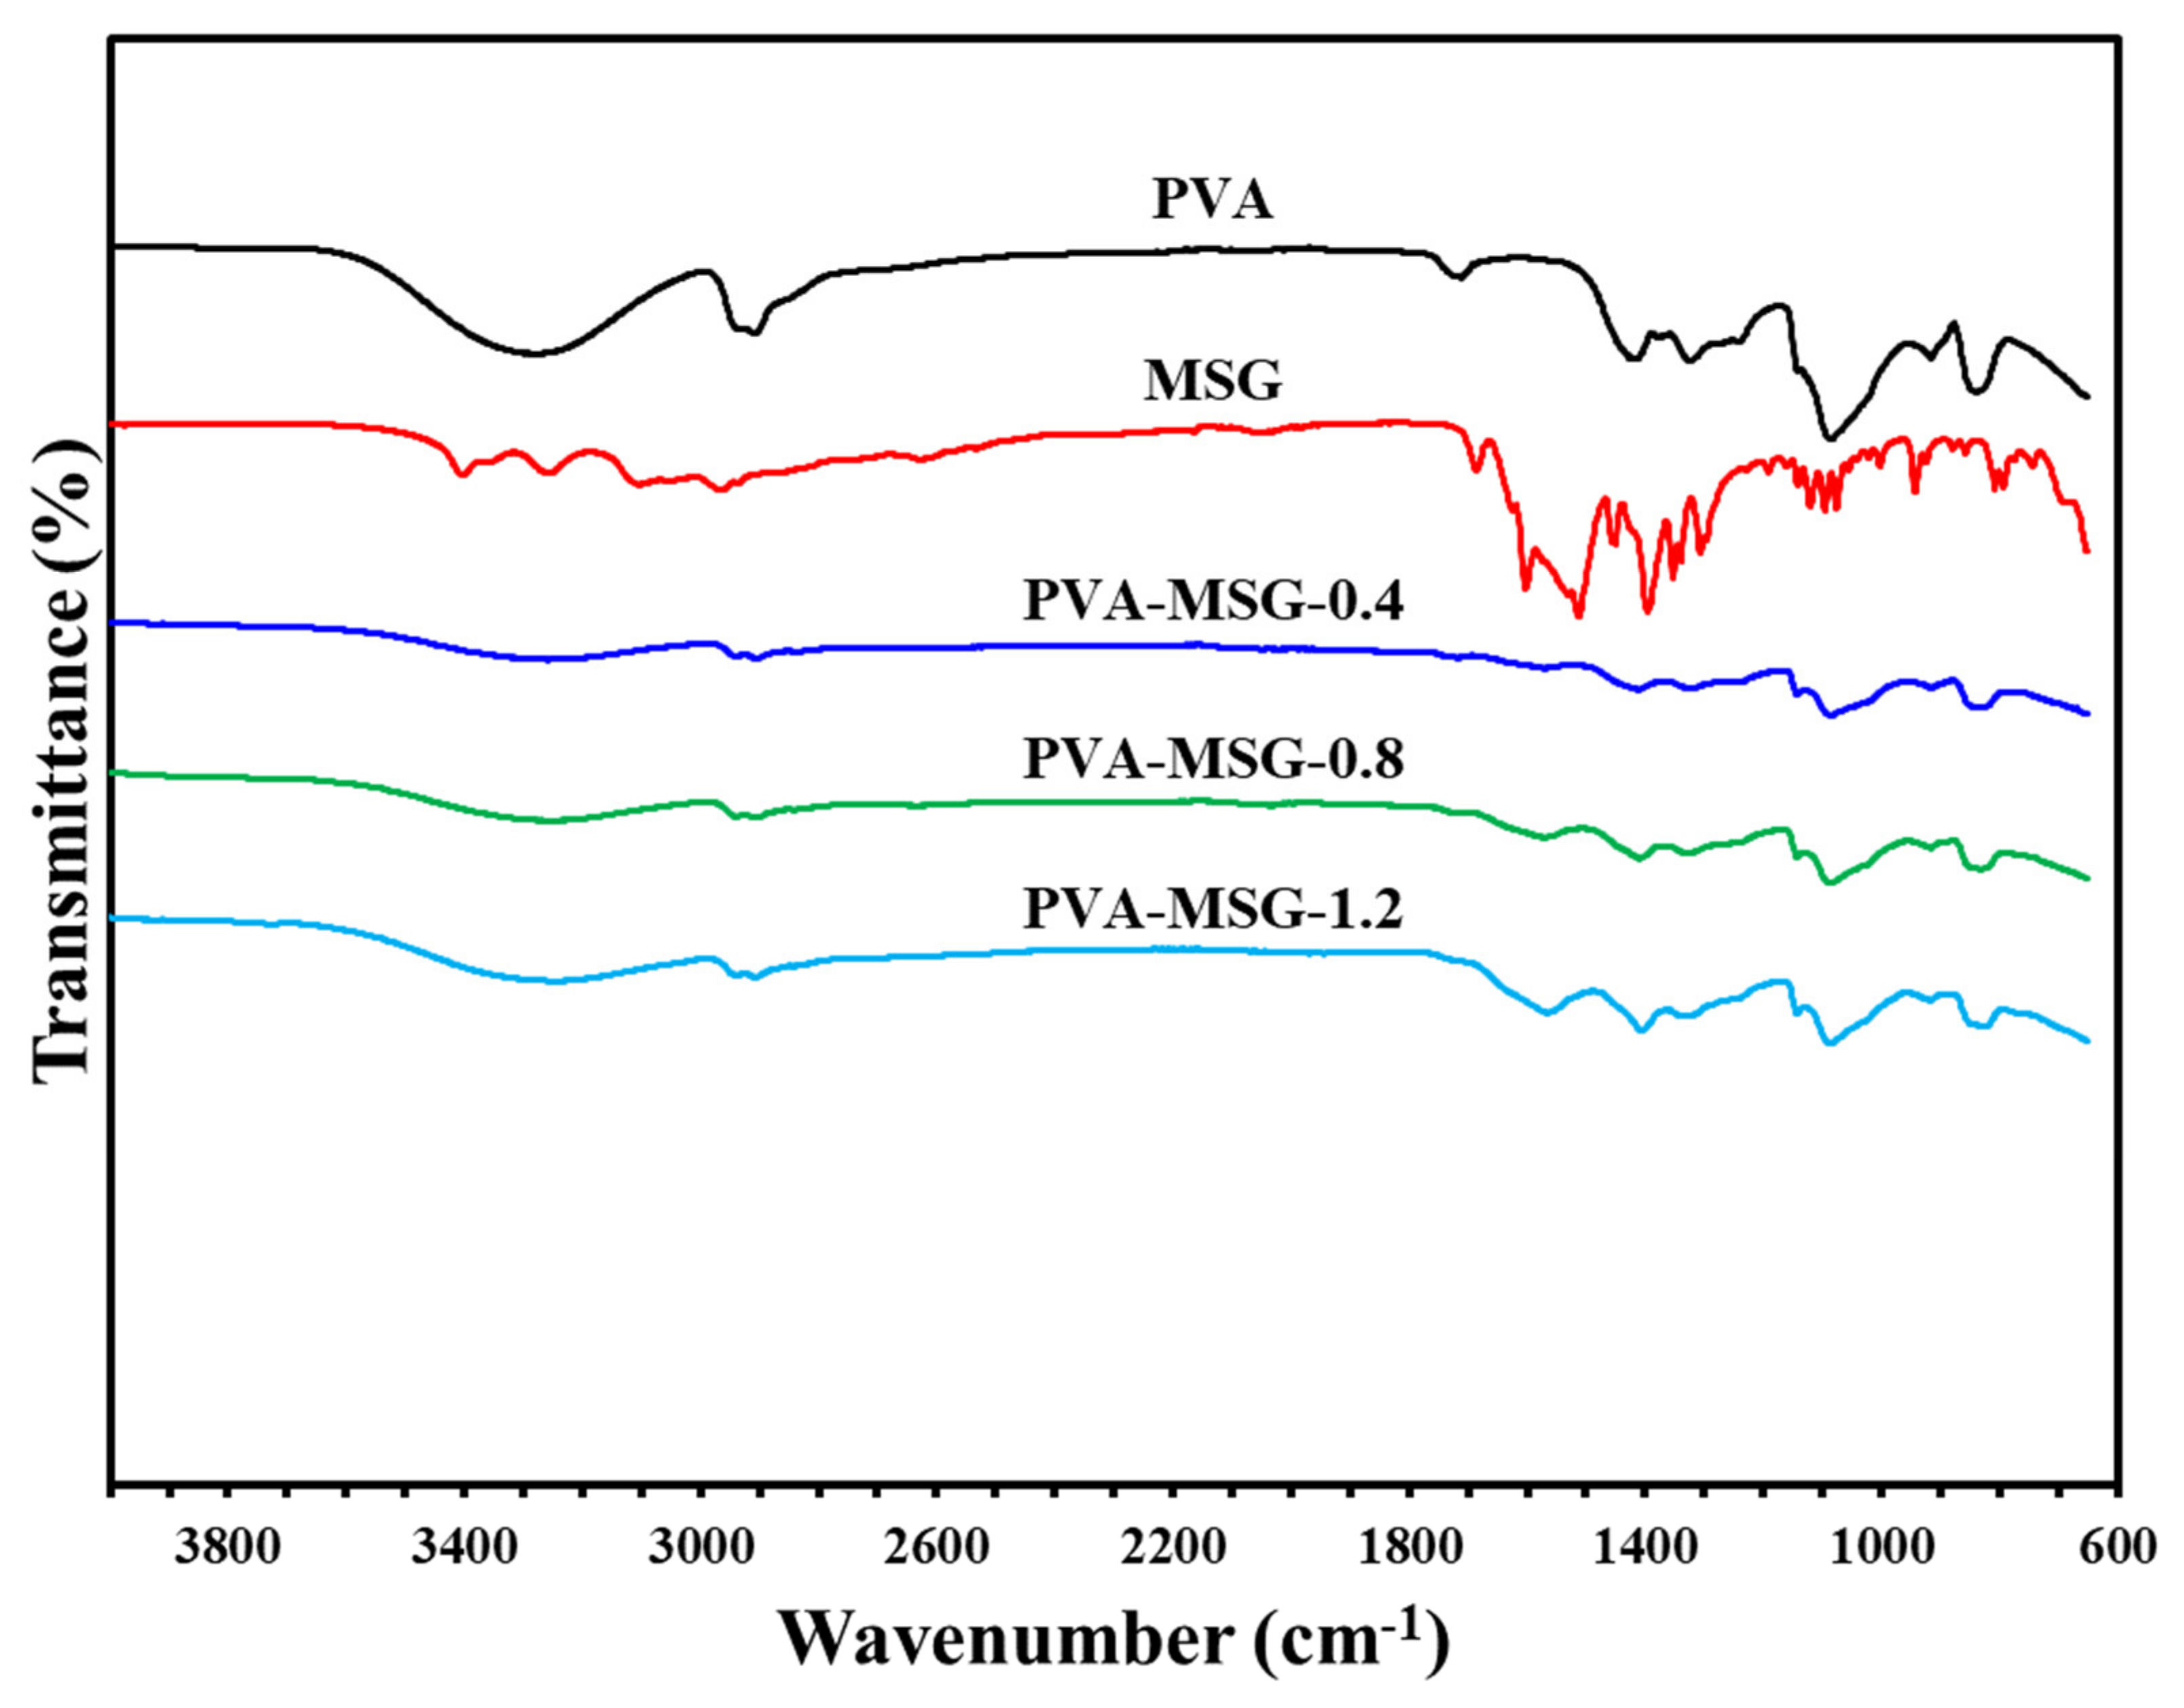
Sustainability 13 13367 g006
Figure 7. Infrared spectrum of polyvinyl alcohol–sodium glutamate self-supporting membranes.
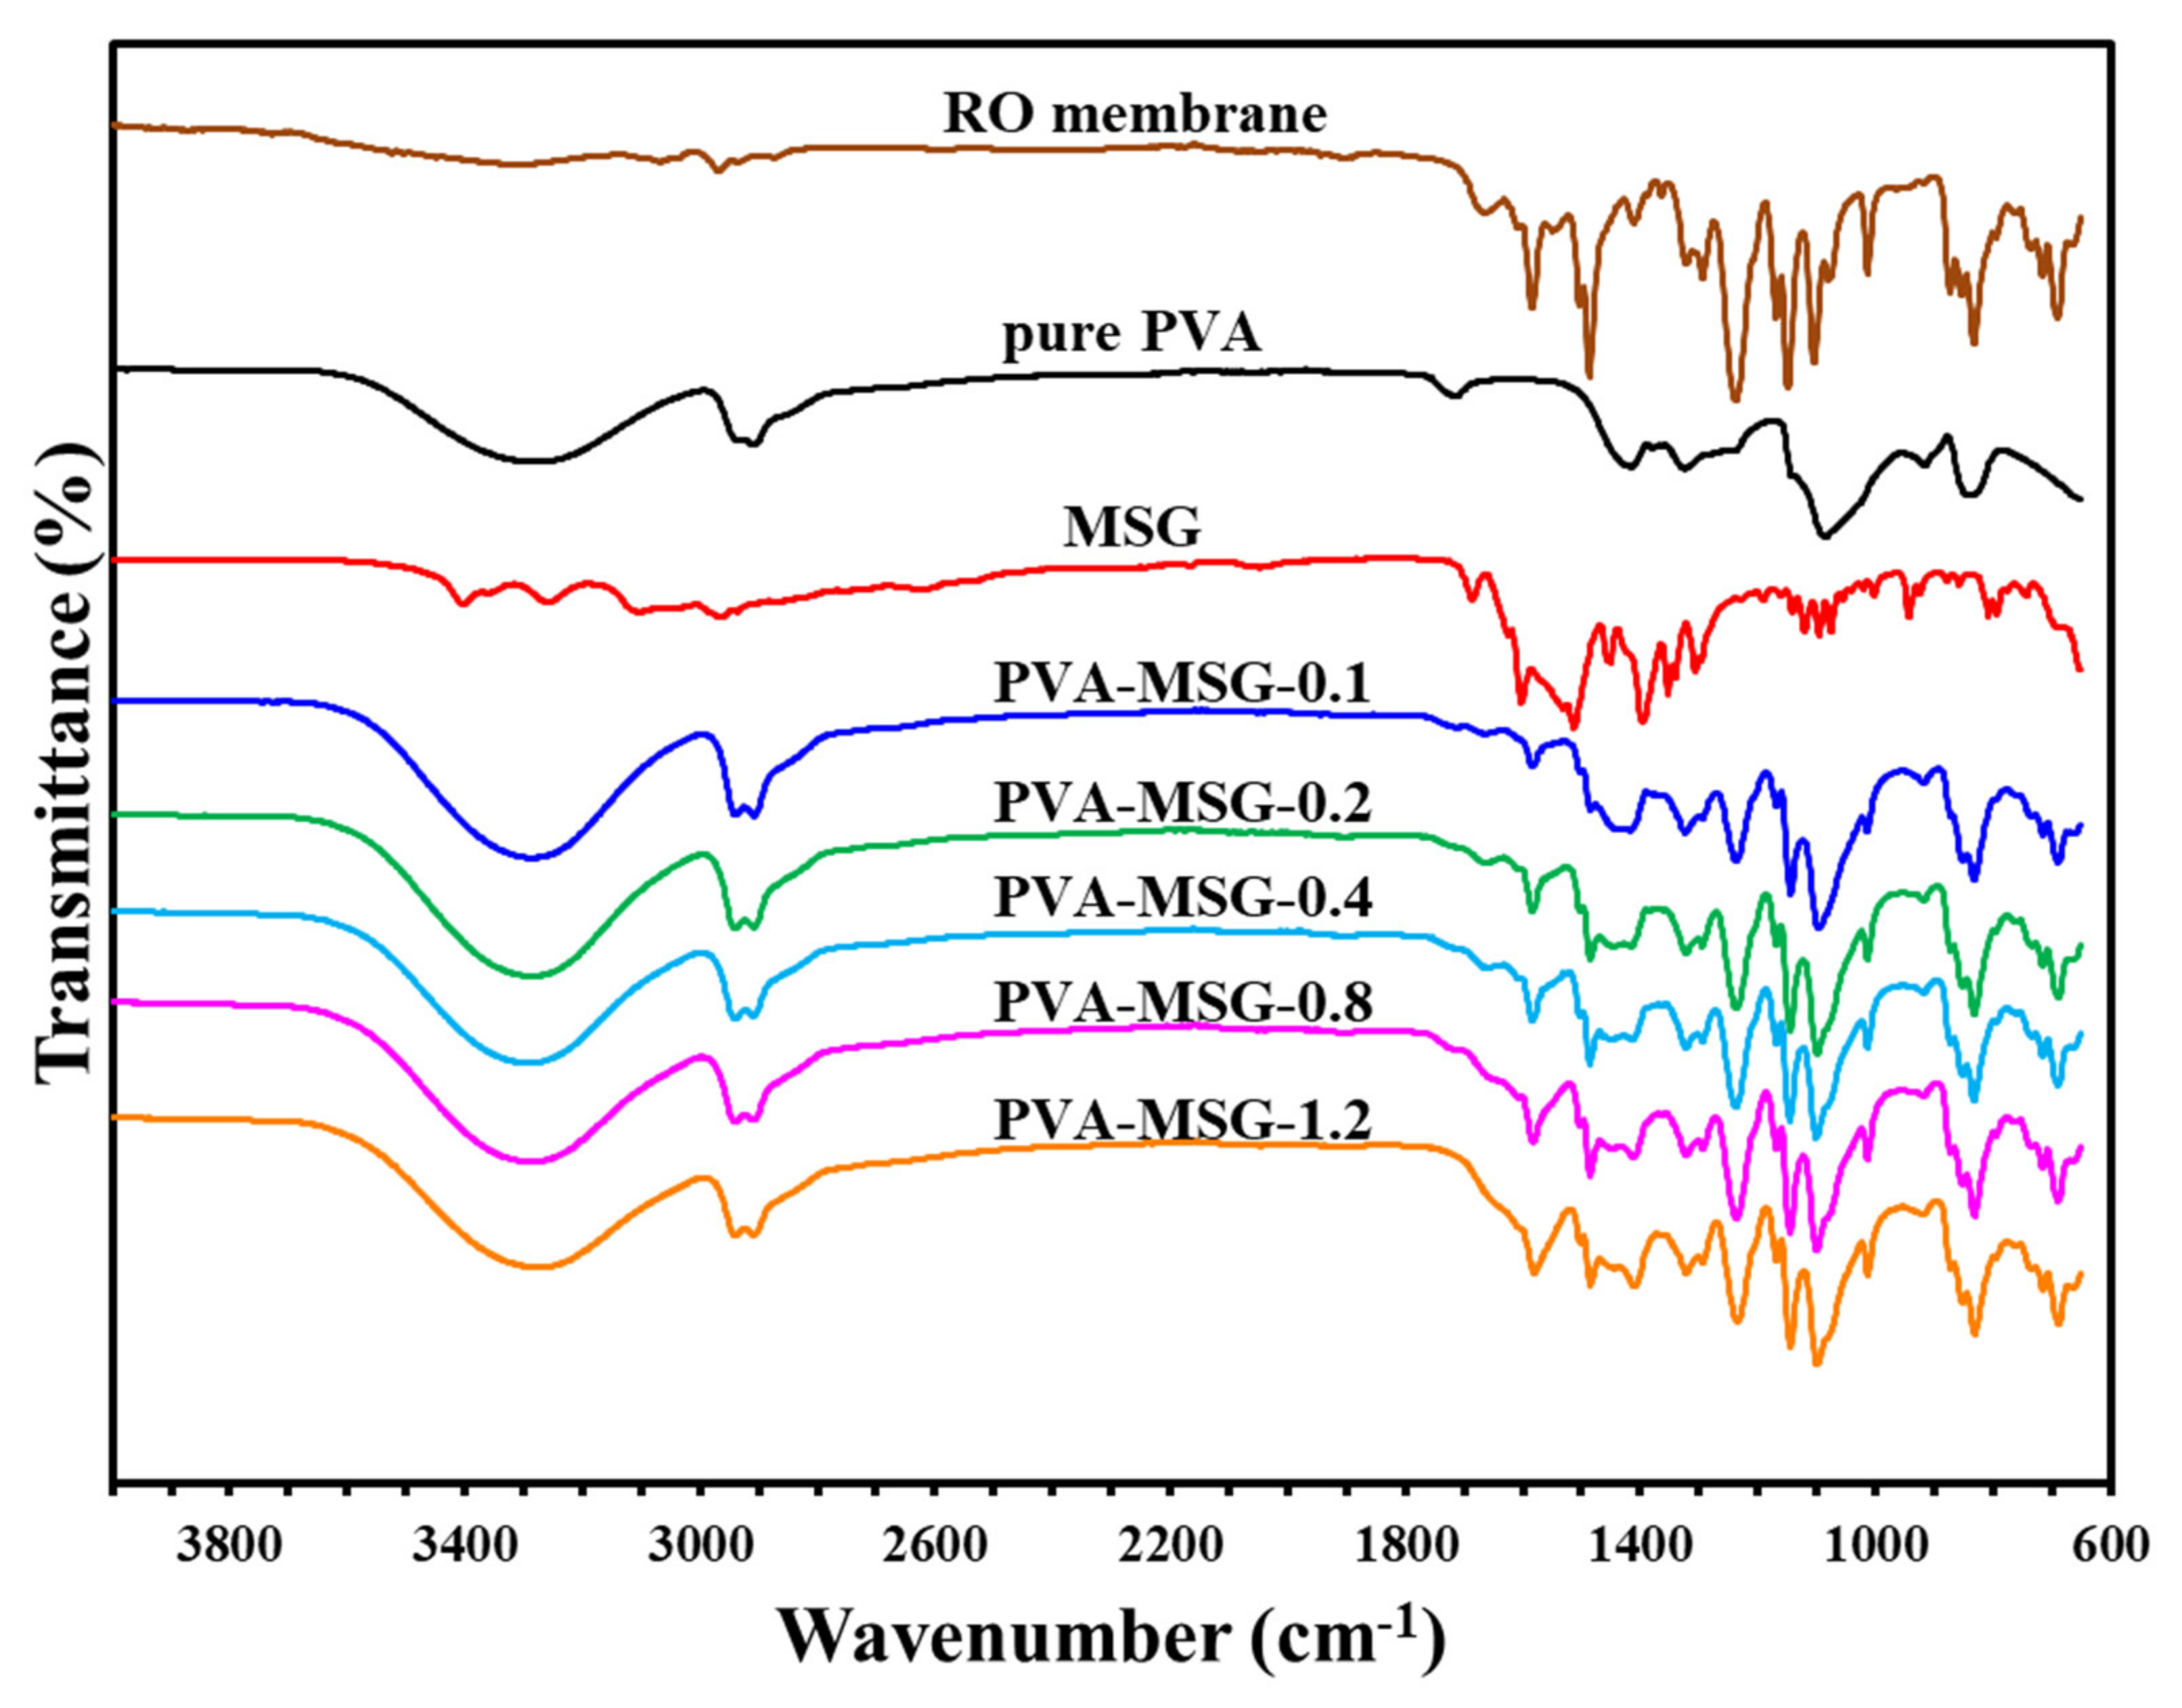
Sustainability 13 13367 g007
Figure 8. Infrared spectrum of polyvinyl alcohol-sodium glutamate composite membranes.
Sustainability 13 13367 g008
Figure 9. TGA diagram of polyvinyl alcohol–glutamic acid composite membranes.
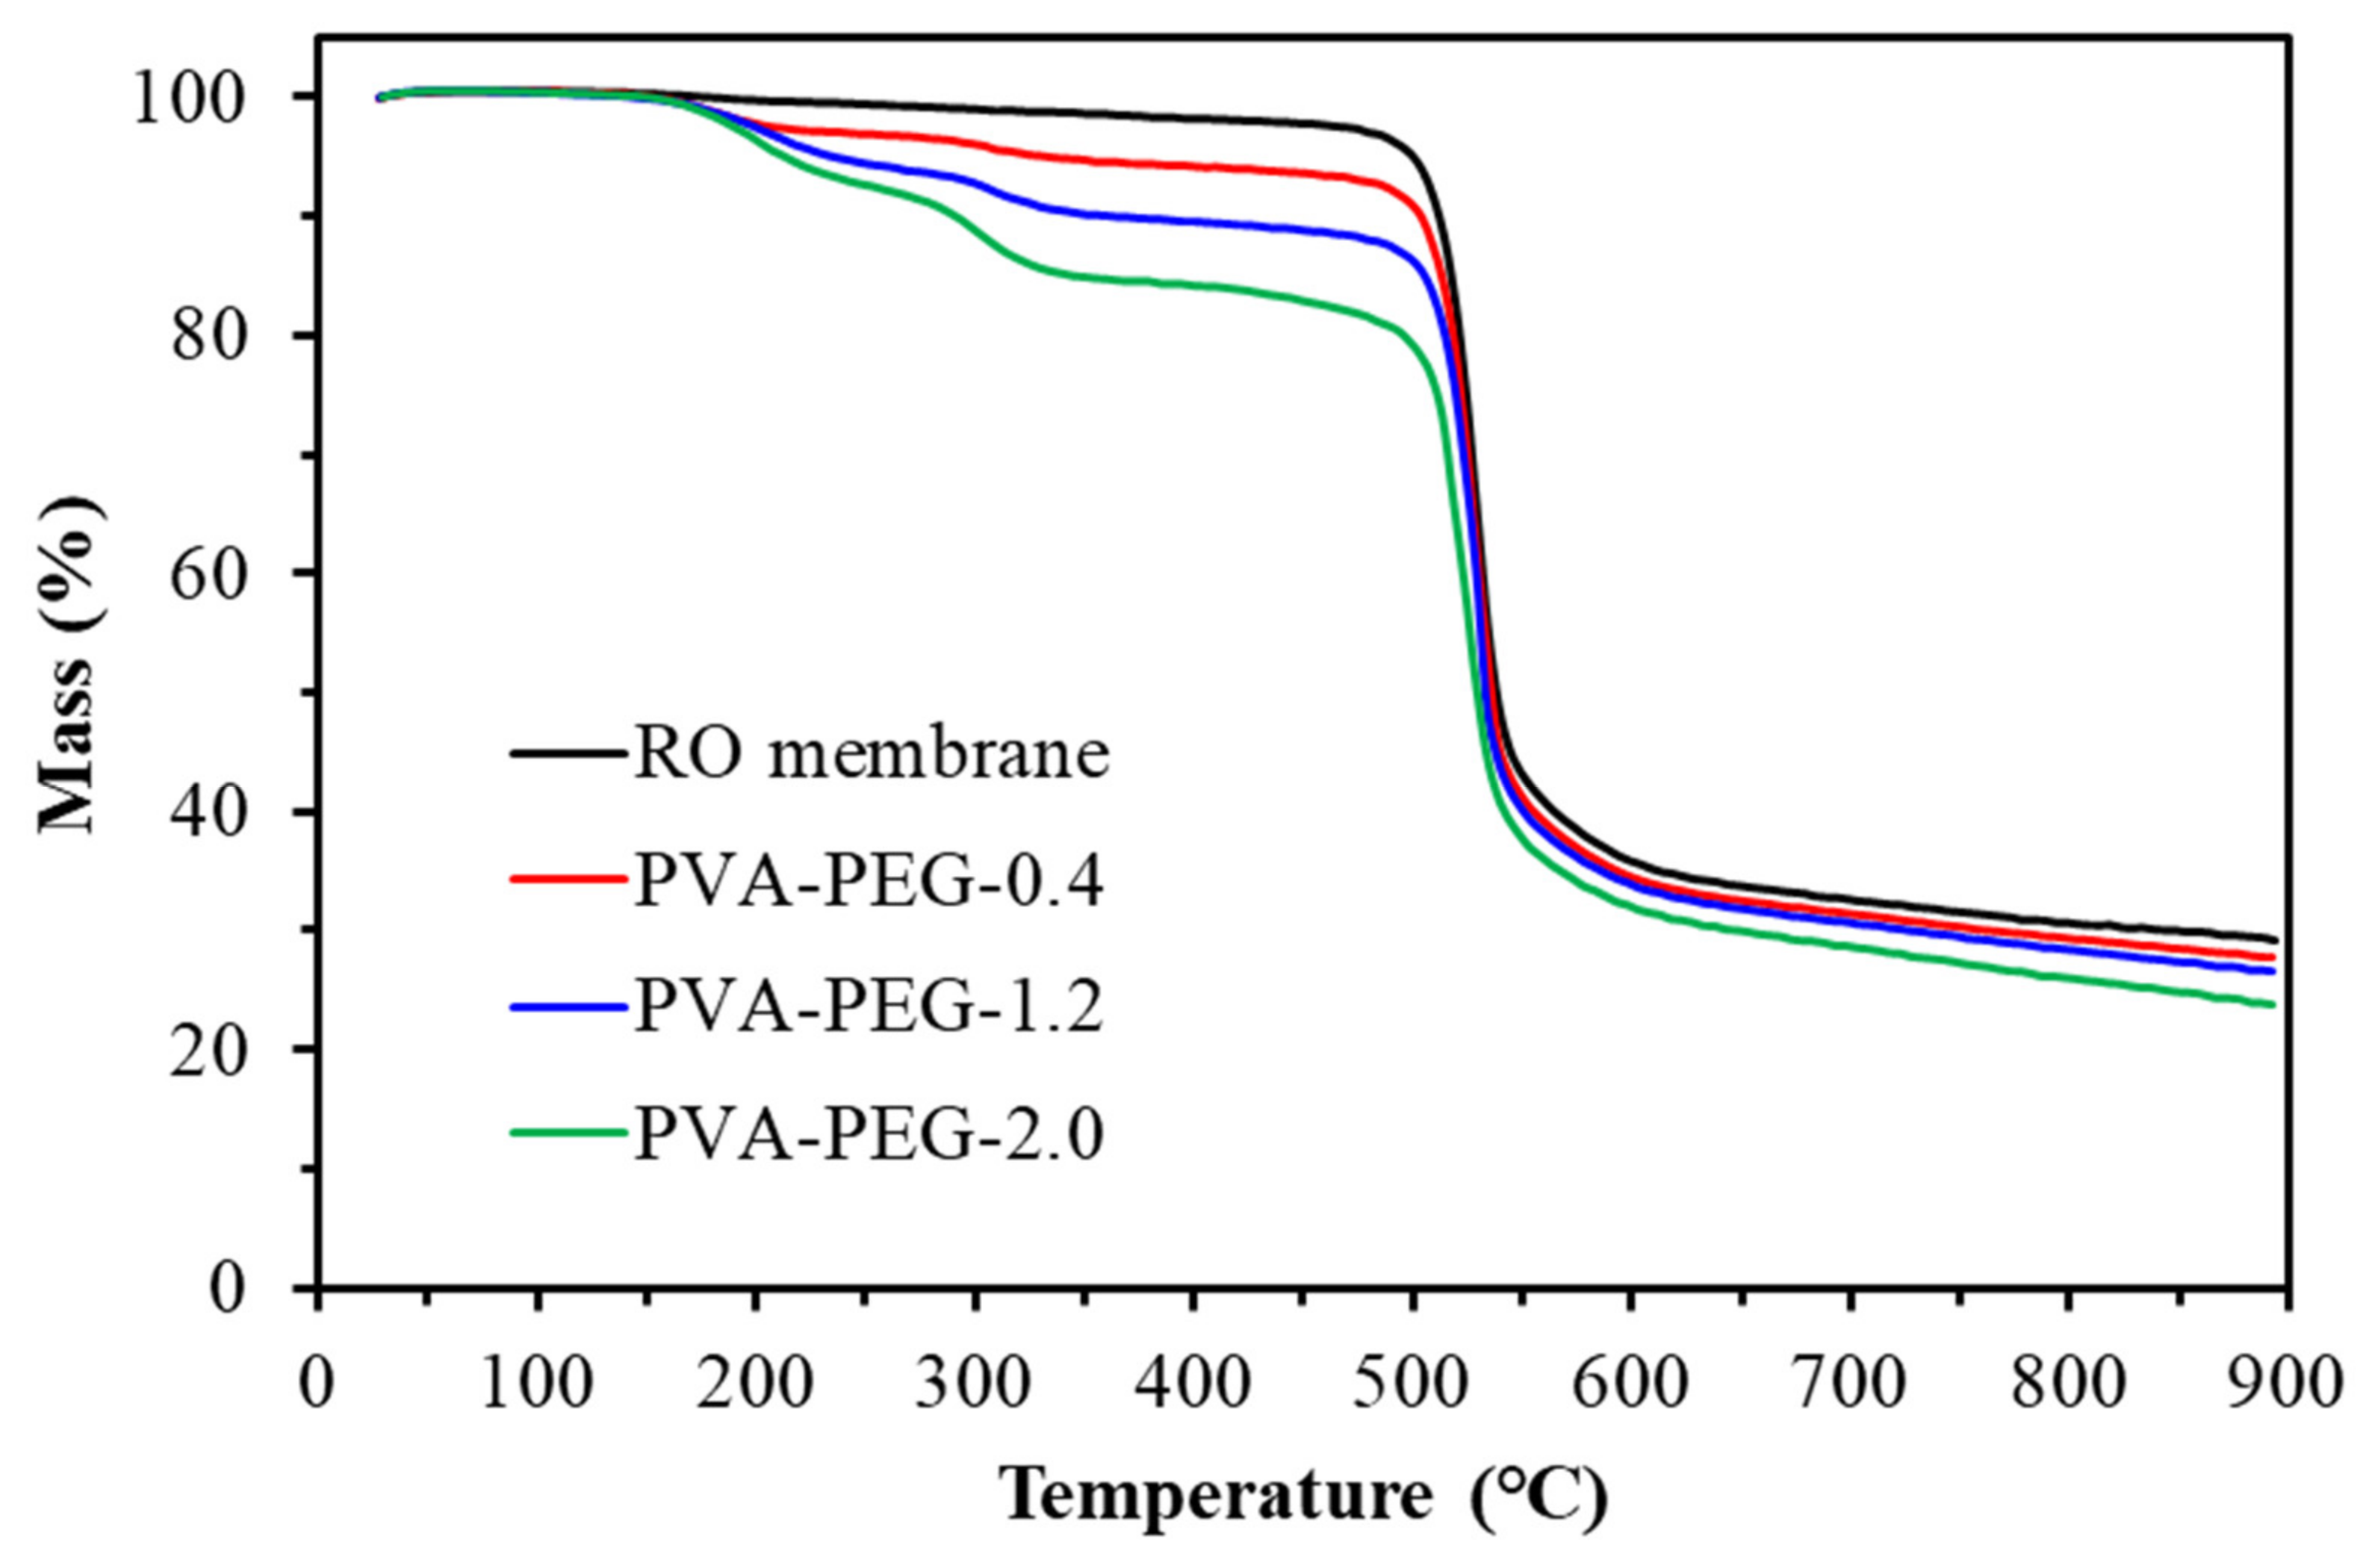
Sustainability 13 13367 g009
Figure 10. TGA diagram of polyvinyl alcohol-polyethylene glycol composite membranes.
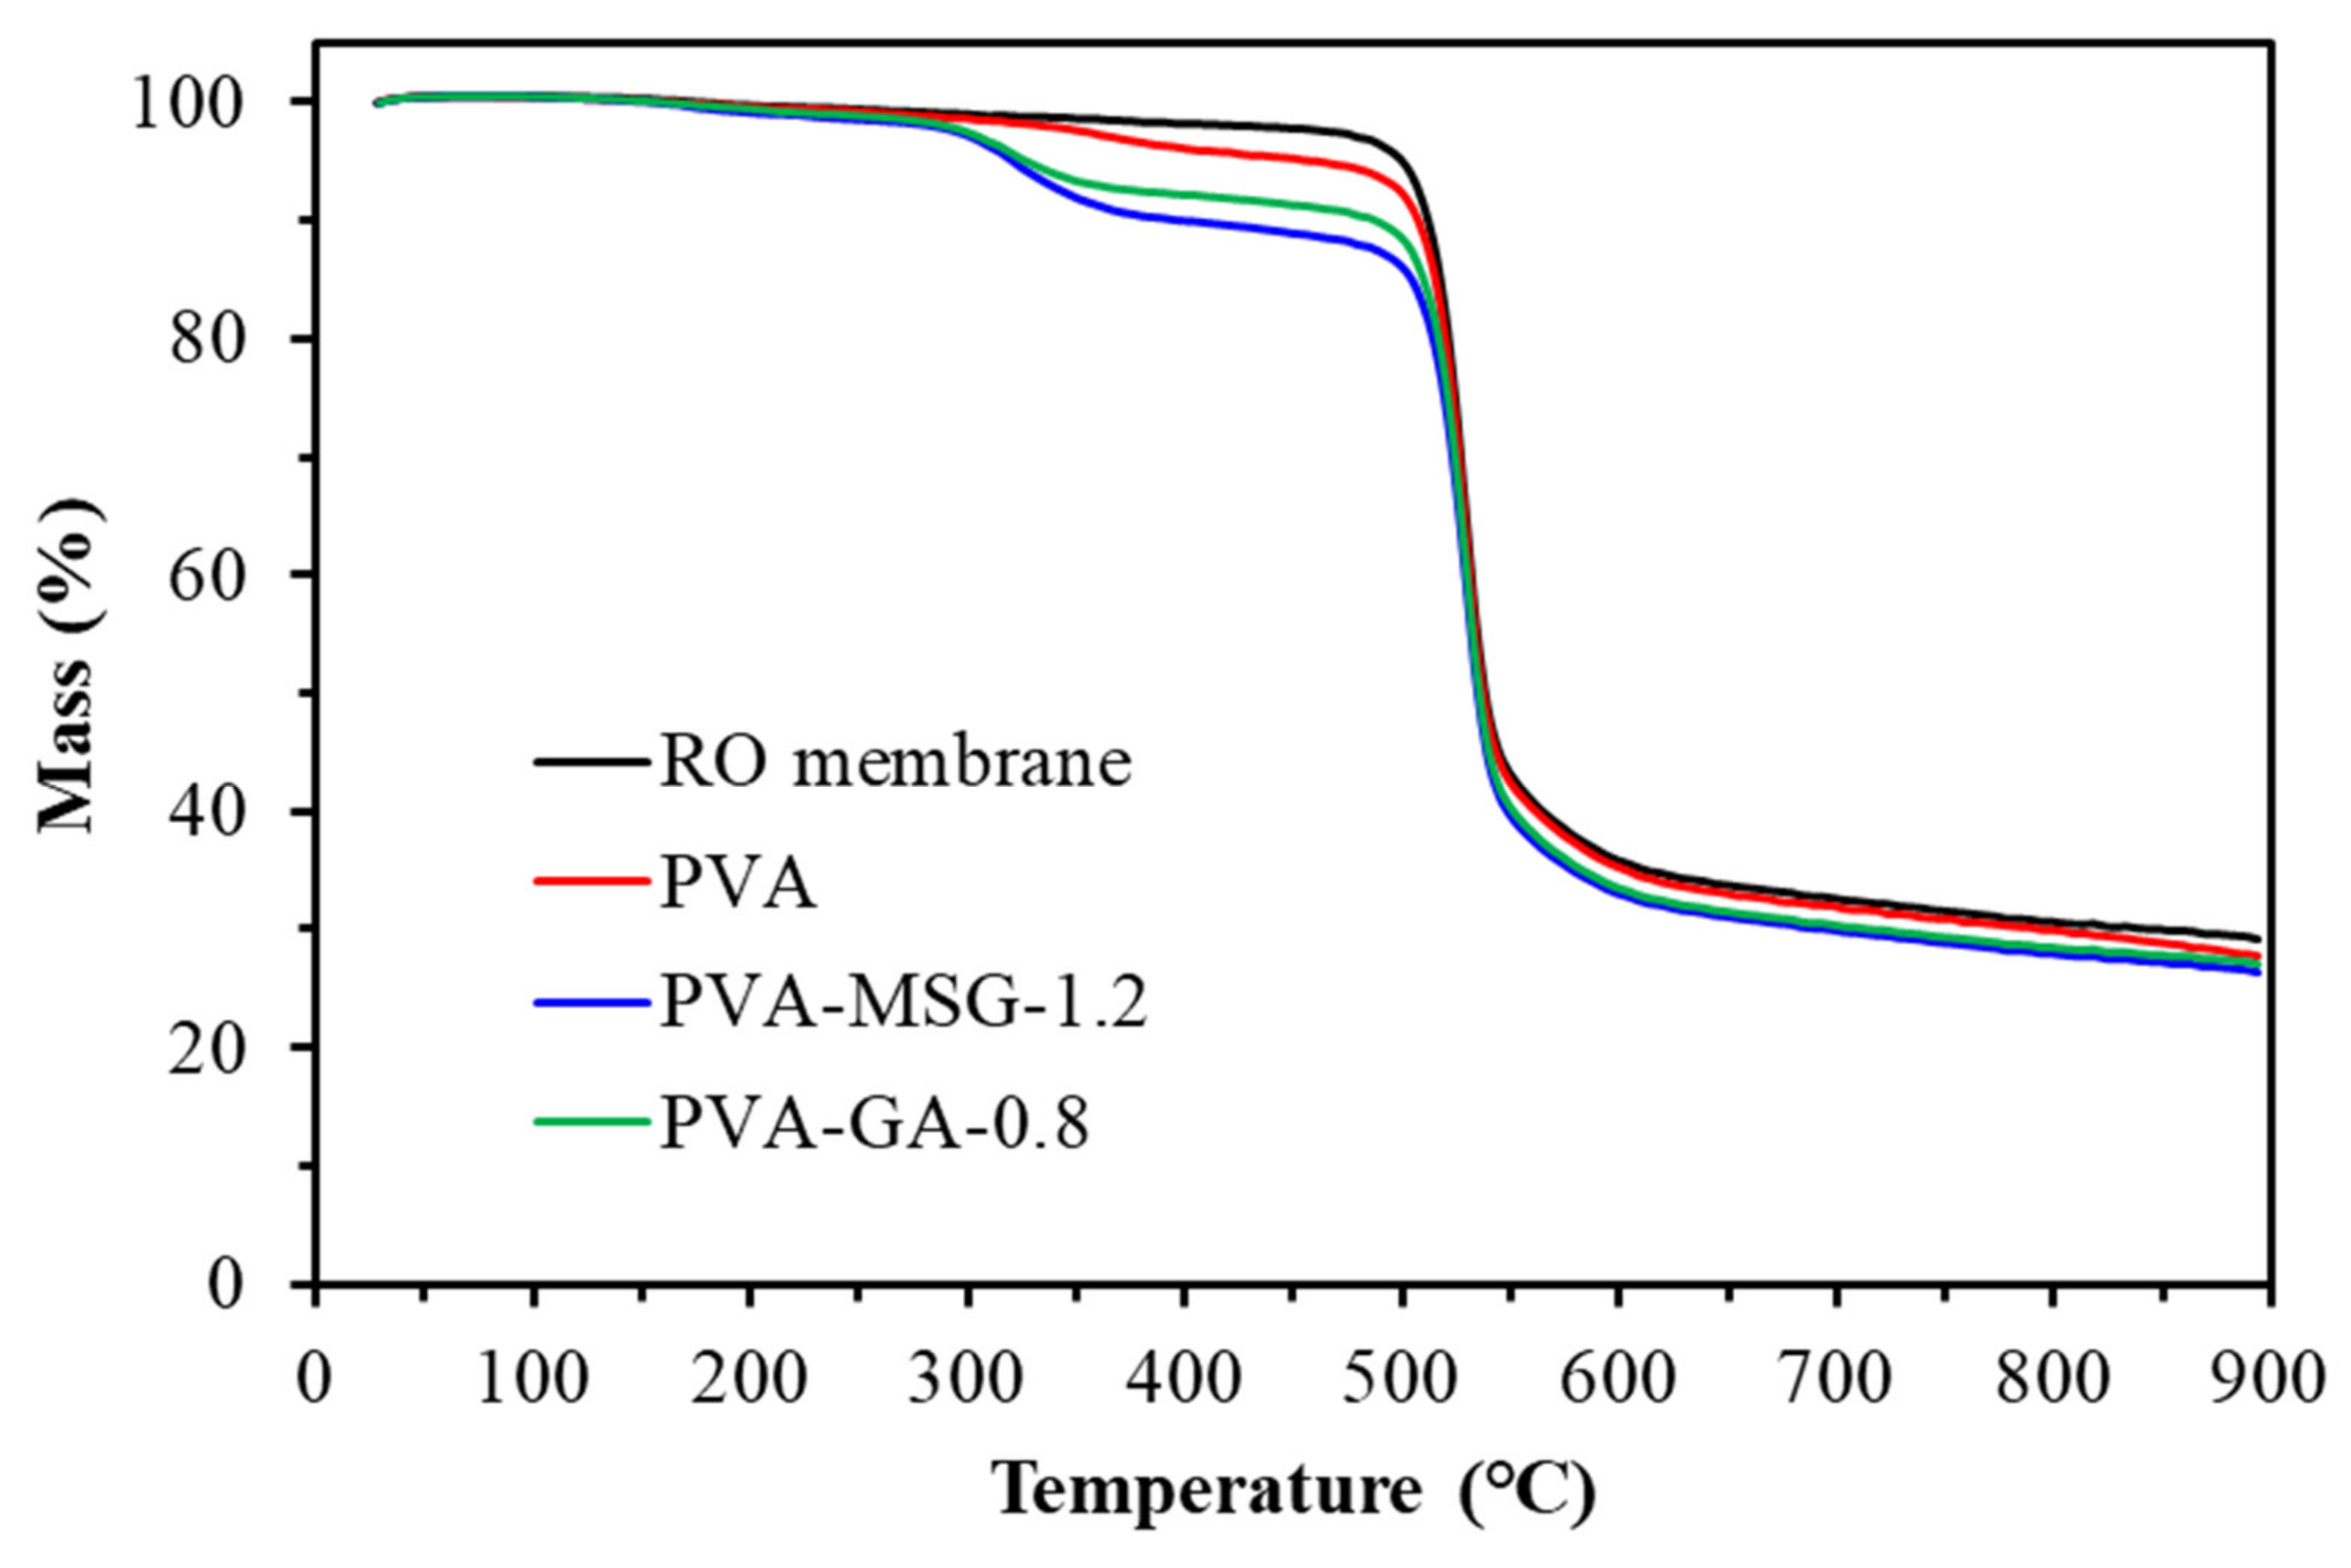
Sustainability 13 13367 g010
Figure 11. TGA diagram of polyvinyl alcohol-glutamic acid (salt) composite membranes.
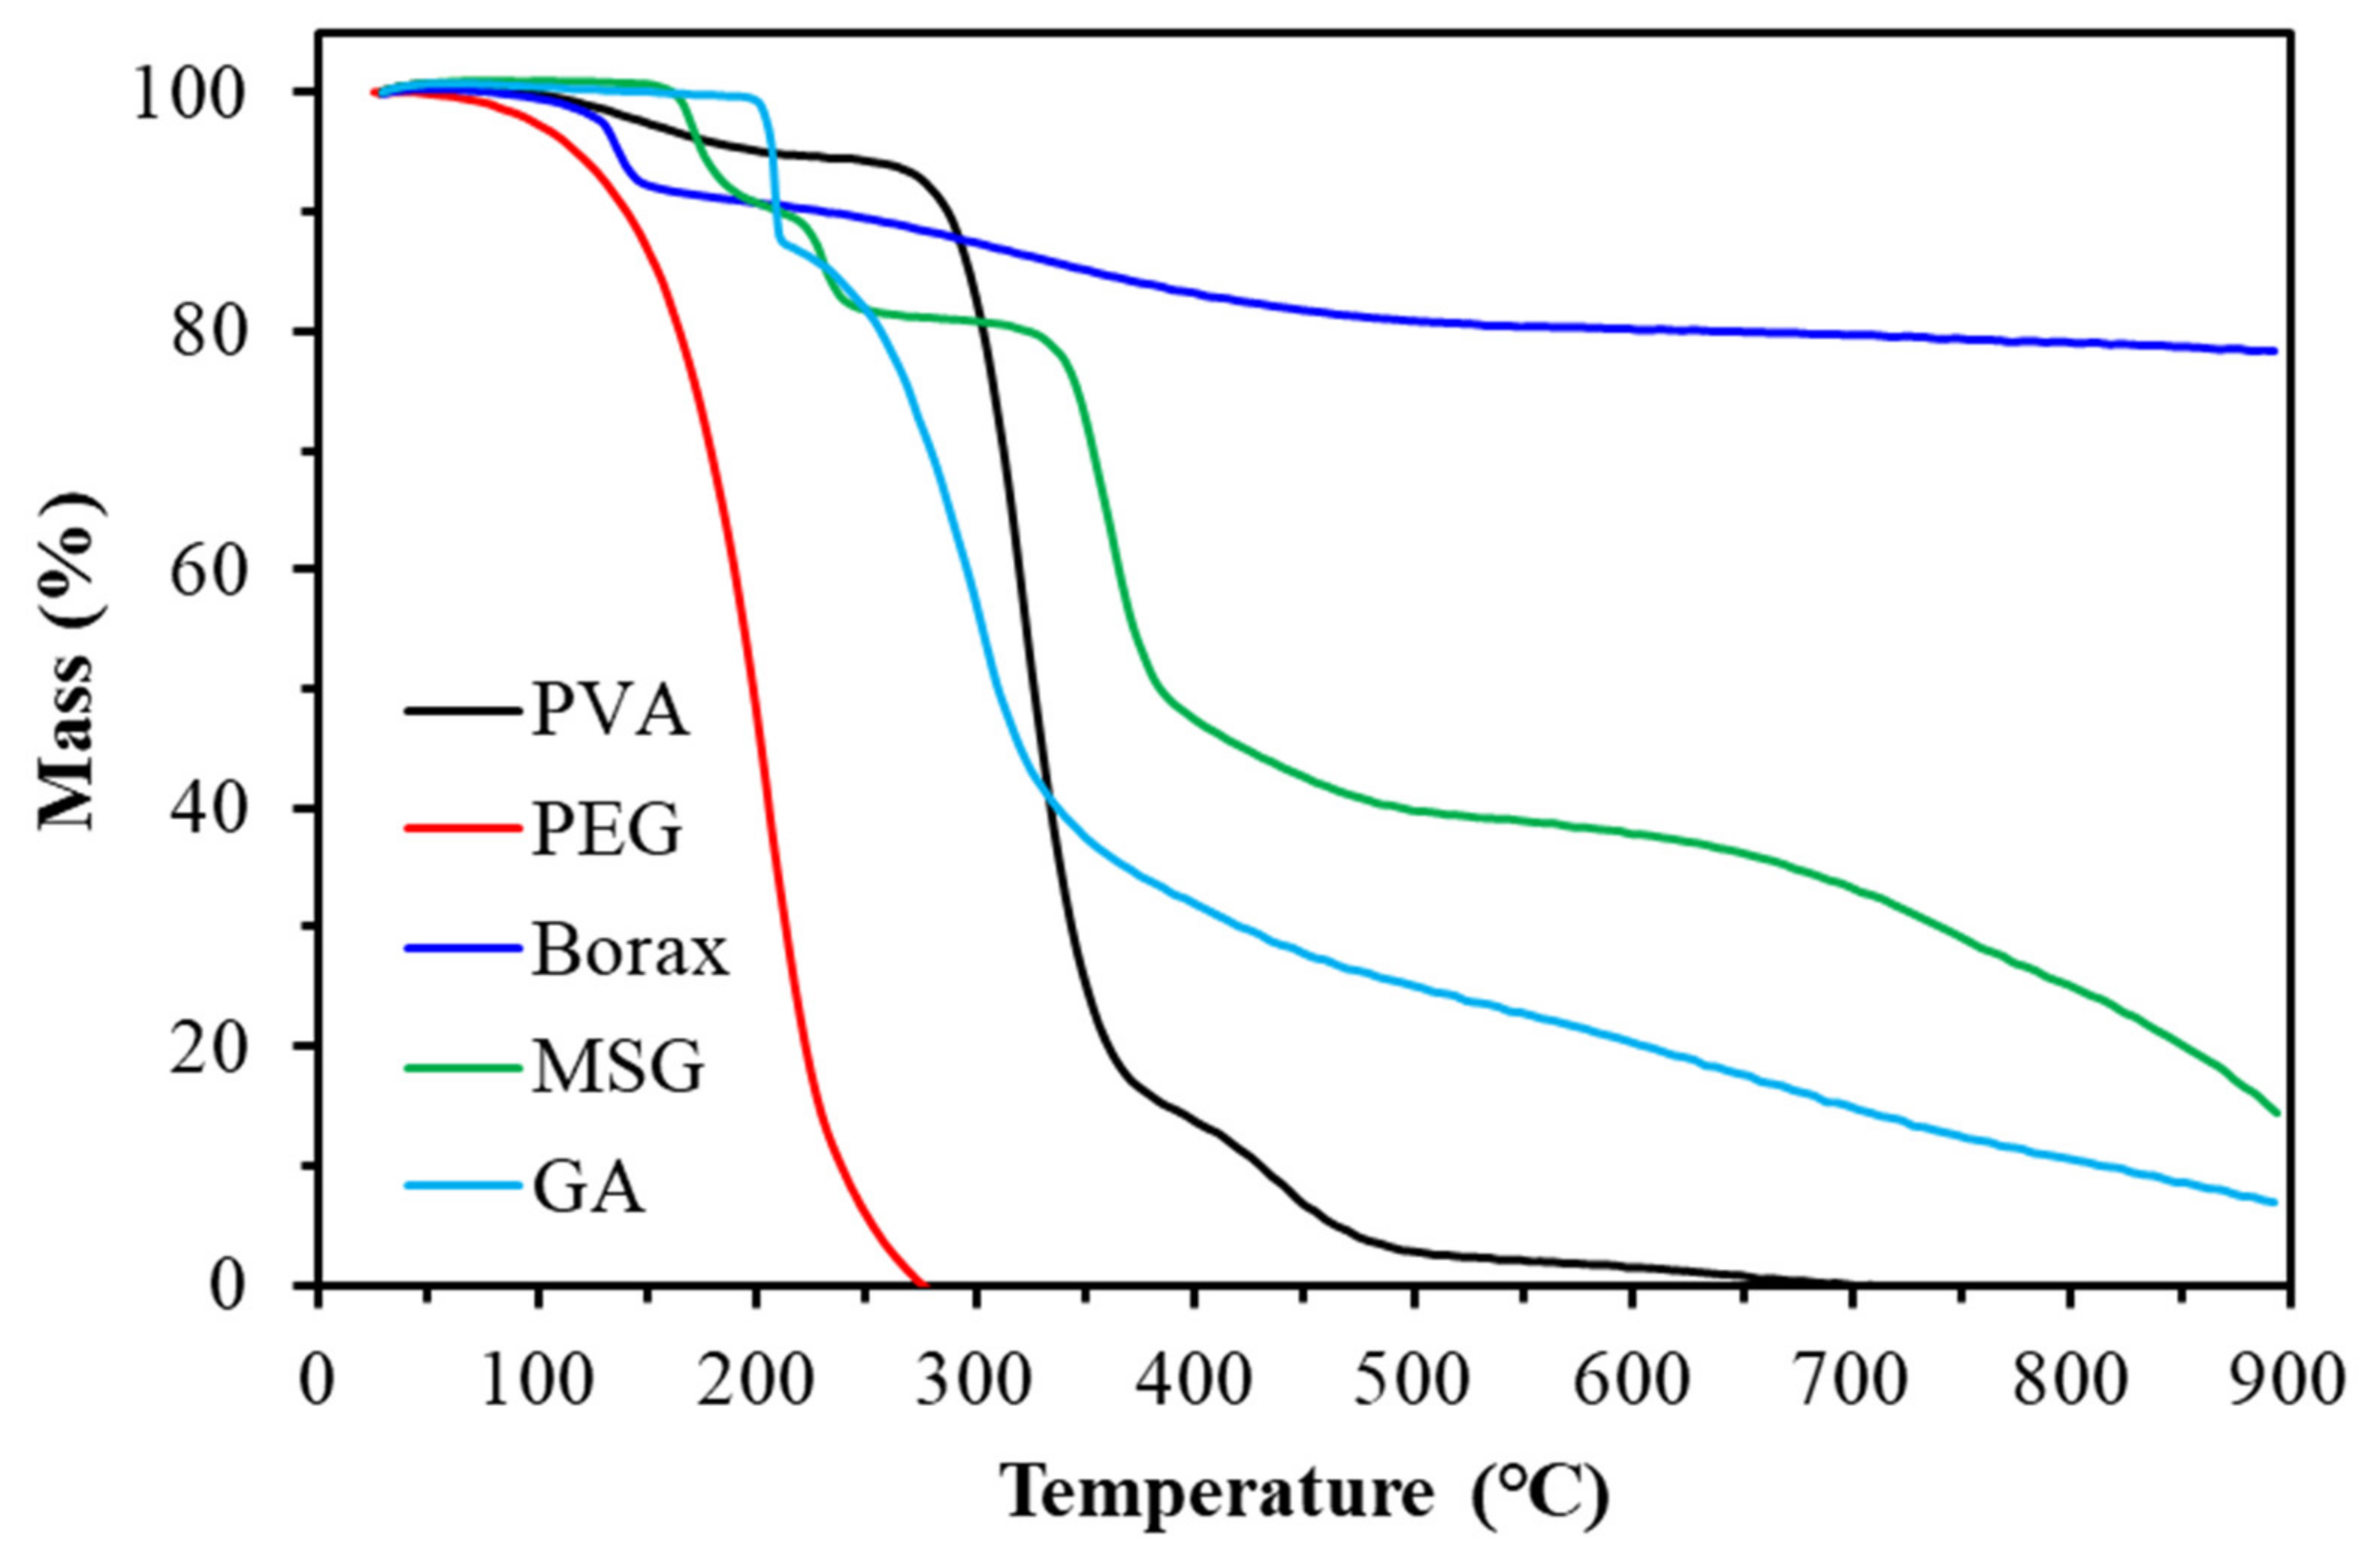
Sustainability 13 13367 g011
Figure 12. TGA diagram of experimental chemicals.
Sustainability 13 13367 g012
Figure 13. SEM diagrams of (A) reverse osmosis film and (B) PVA-B-2 coated film.
Sustainability 13 13367 g013
Figure 14. SEM diagrams of different PEG content PVA-PEG composite membranes: (A) no additional PEG, (B) 10 wt%, (C) 18 wt%, (D) 24 wt%, (E) 30 wt%, and (F) 35 wt%.
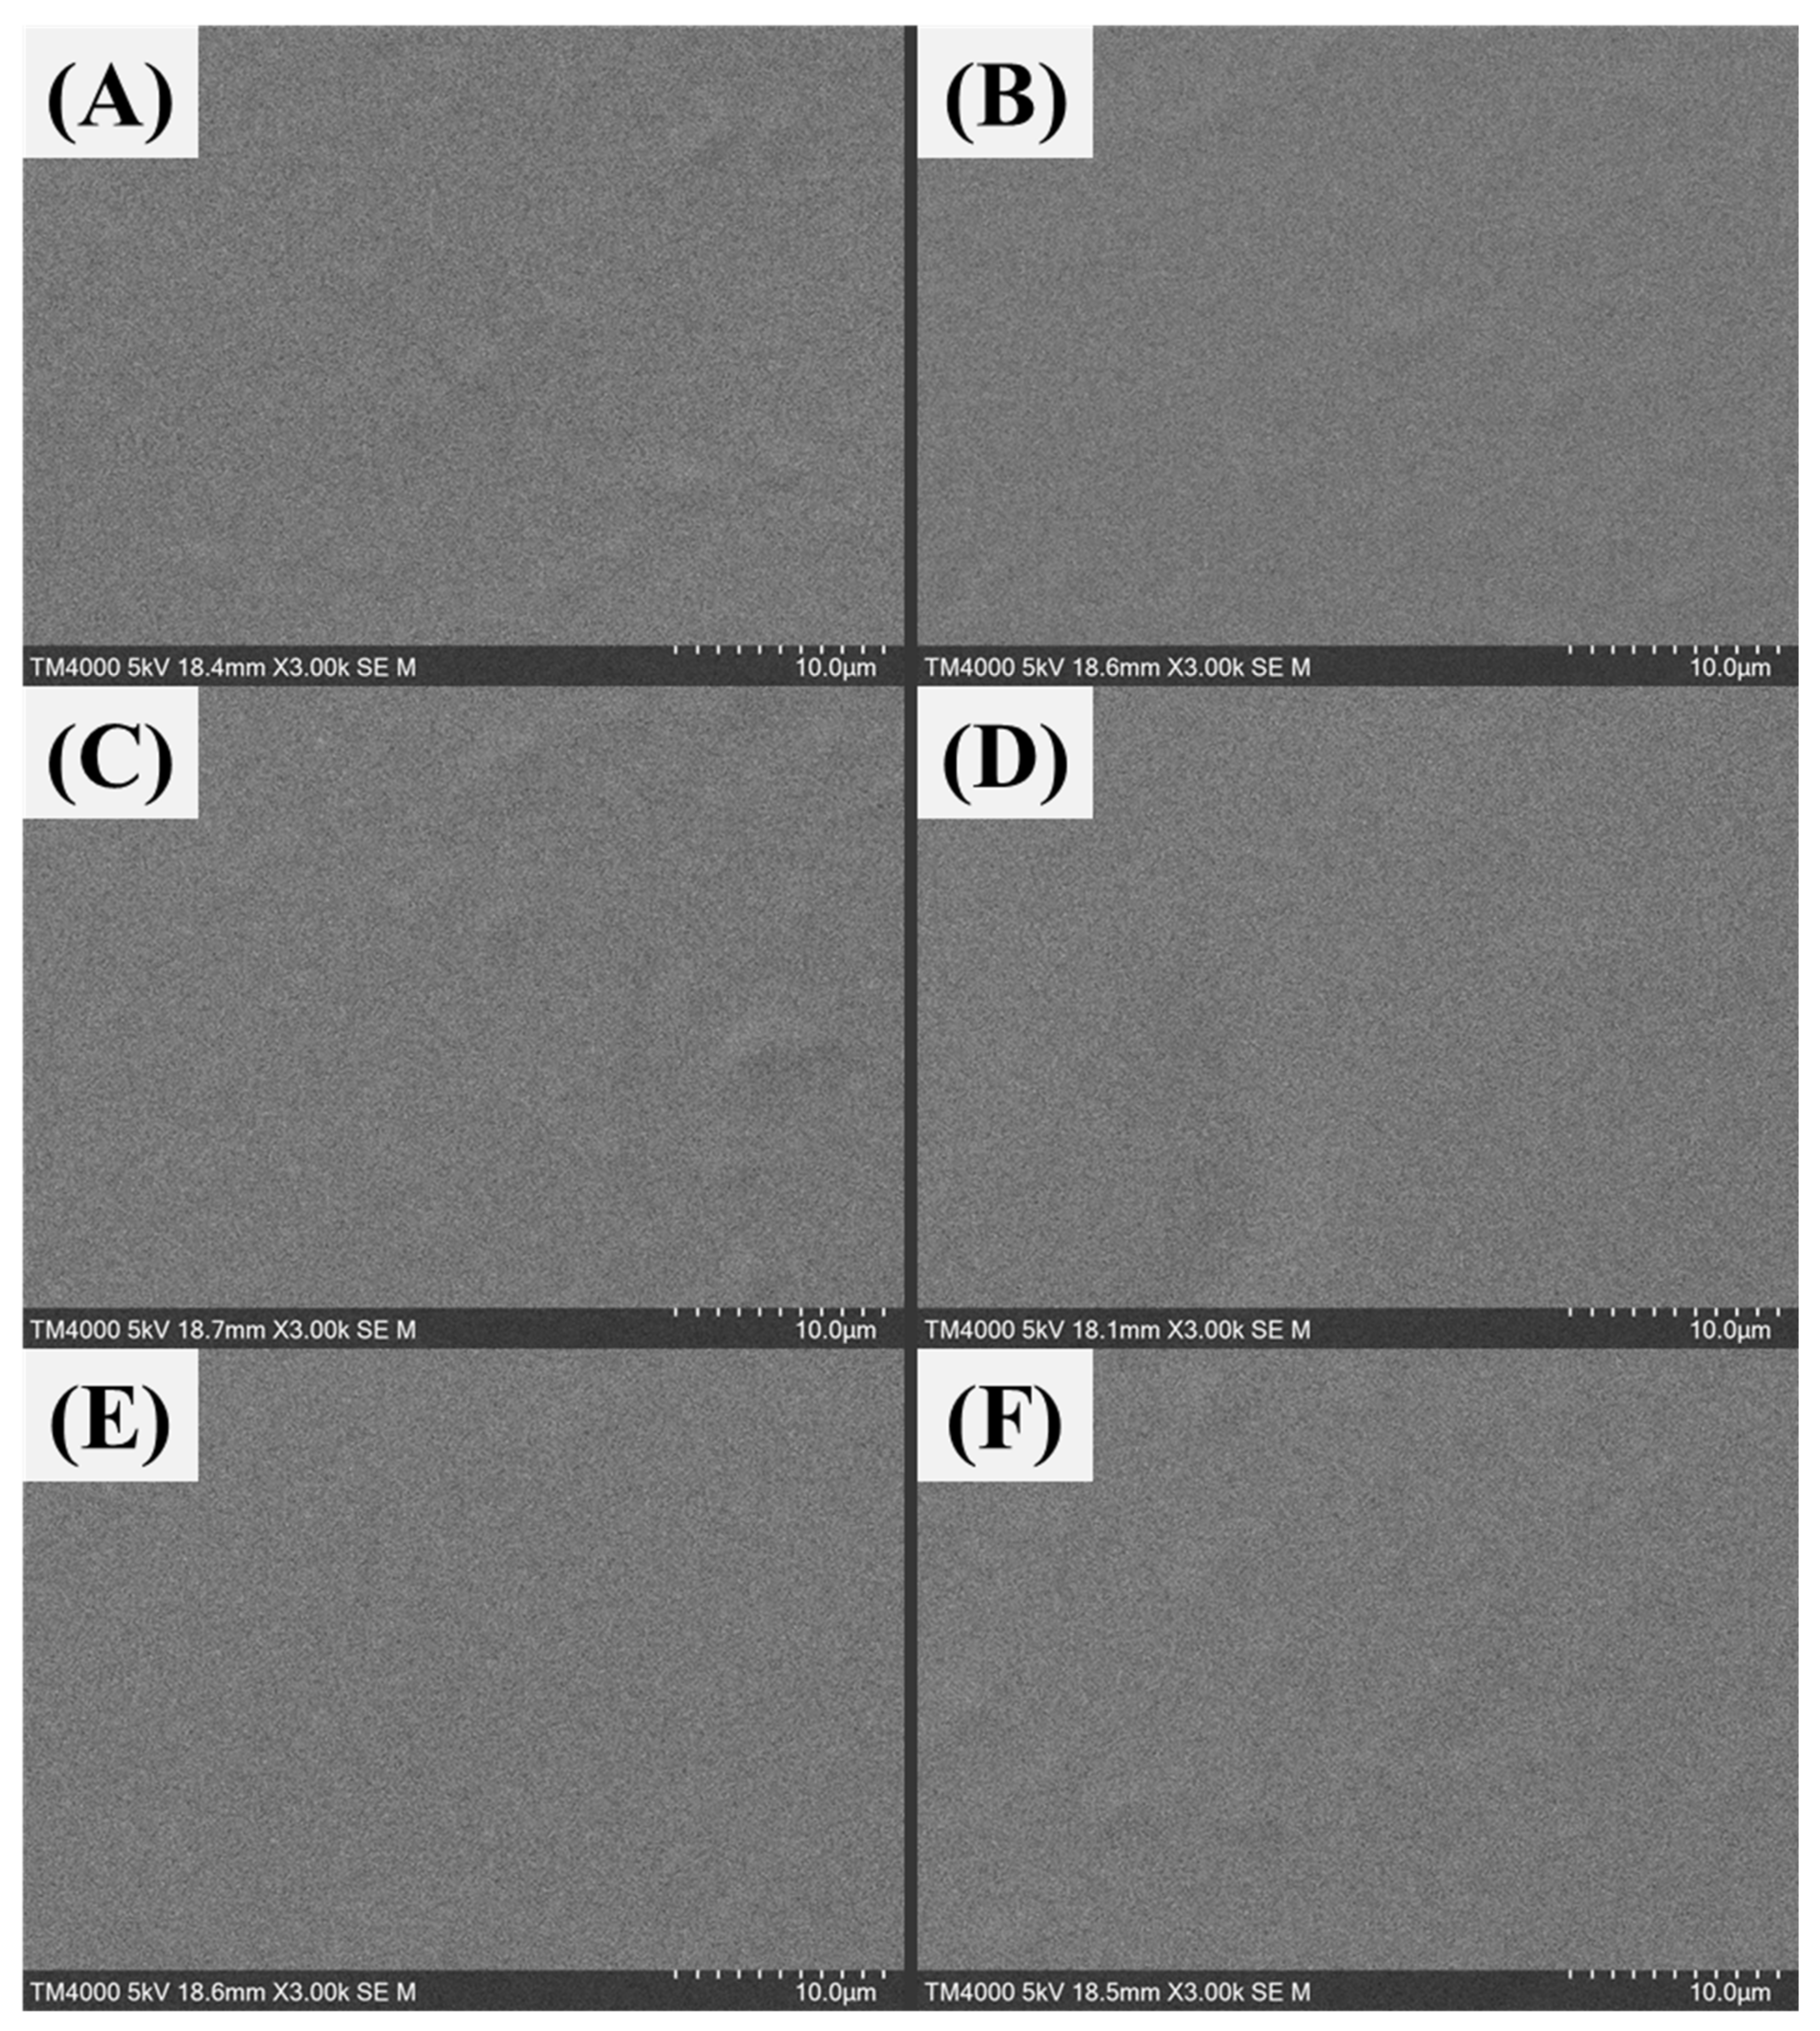
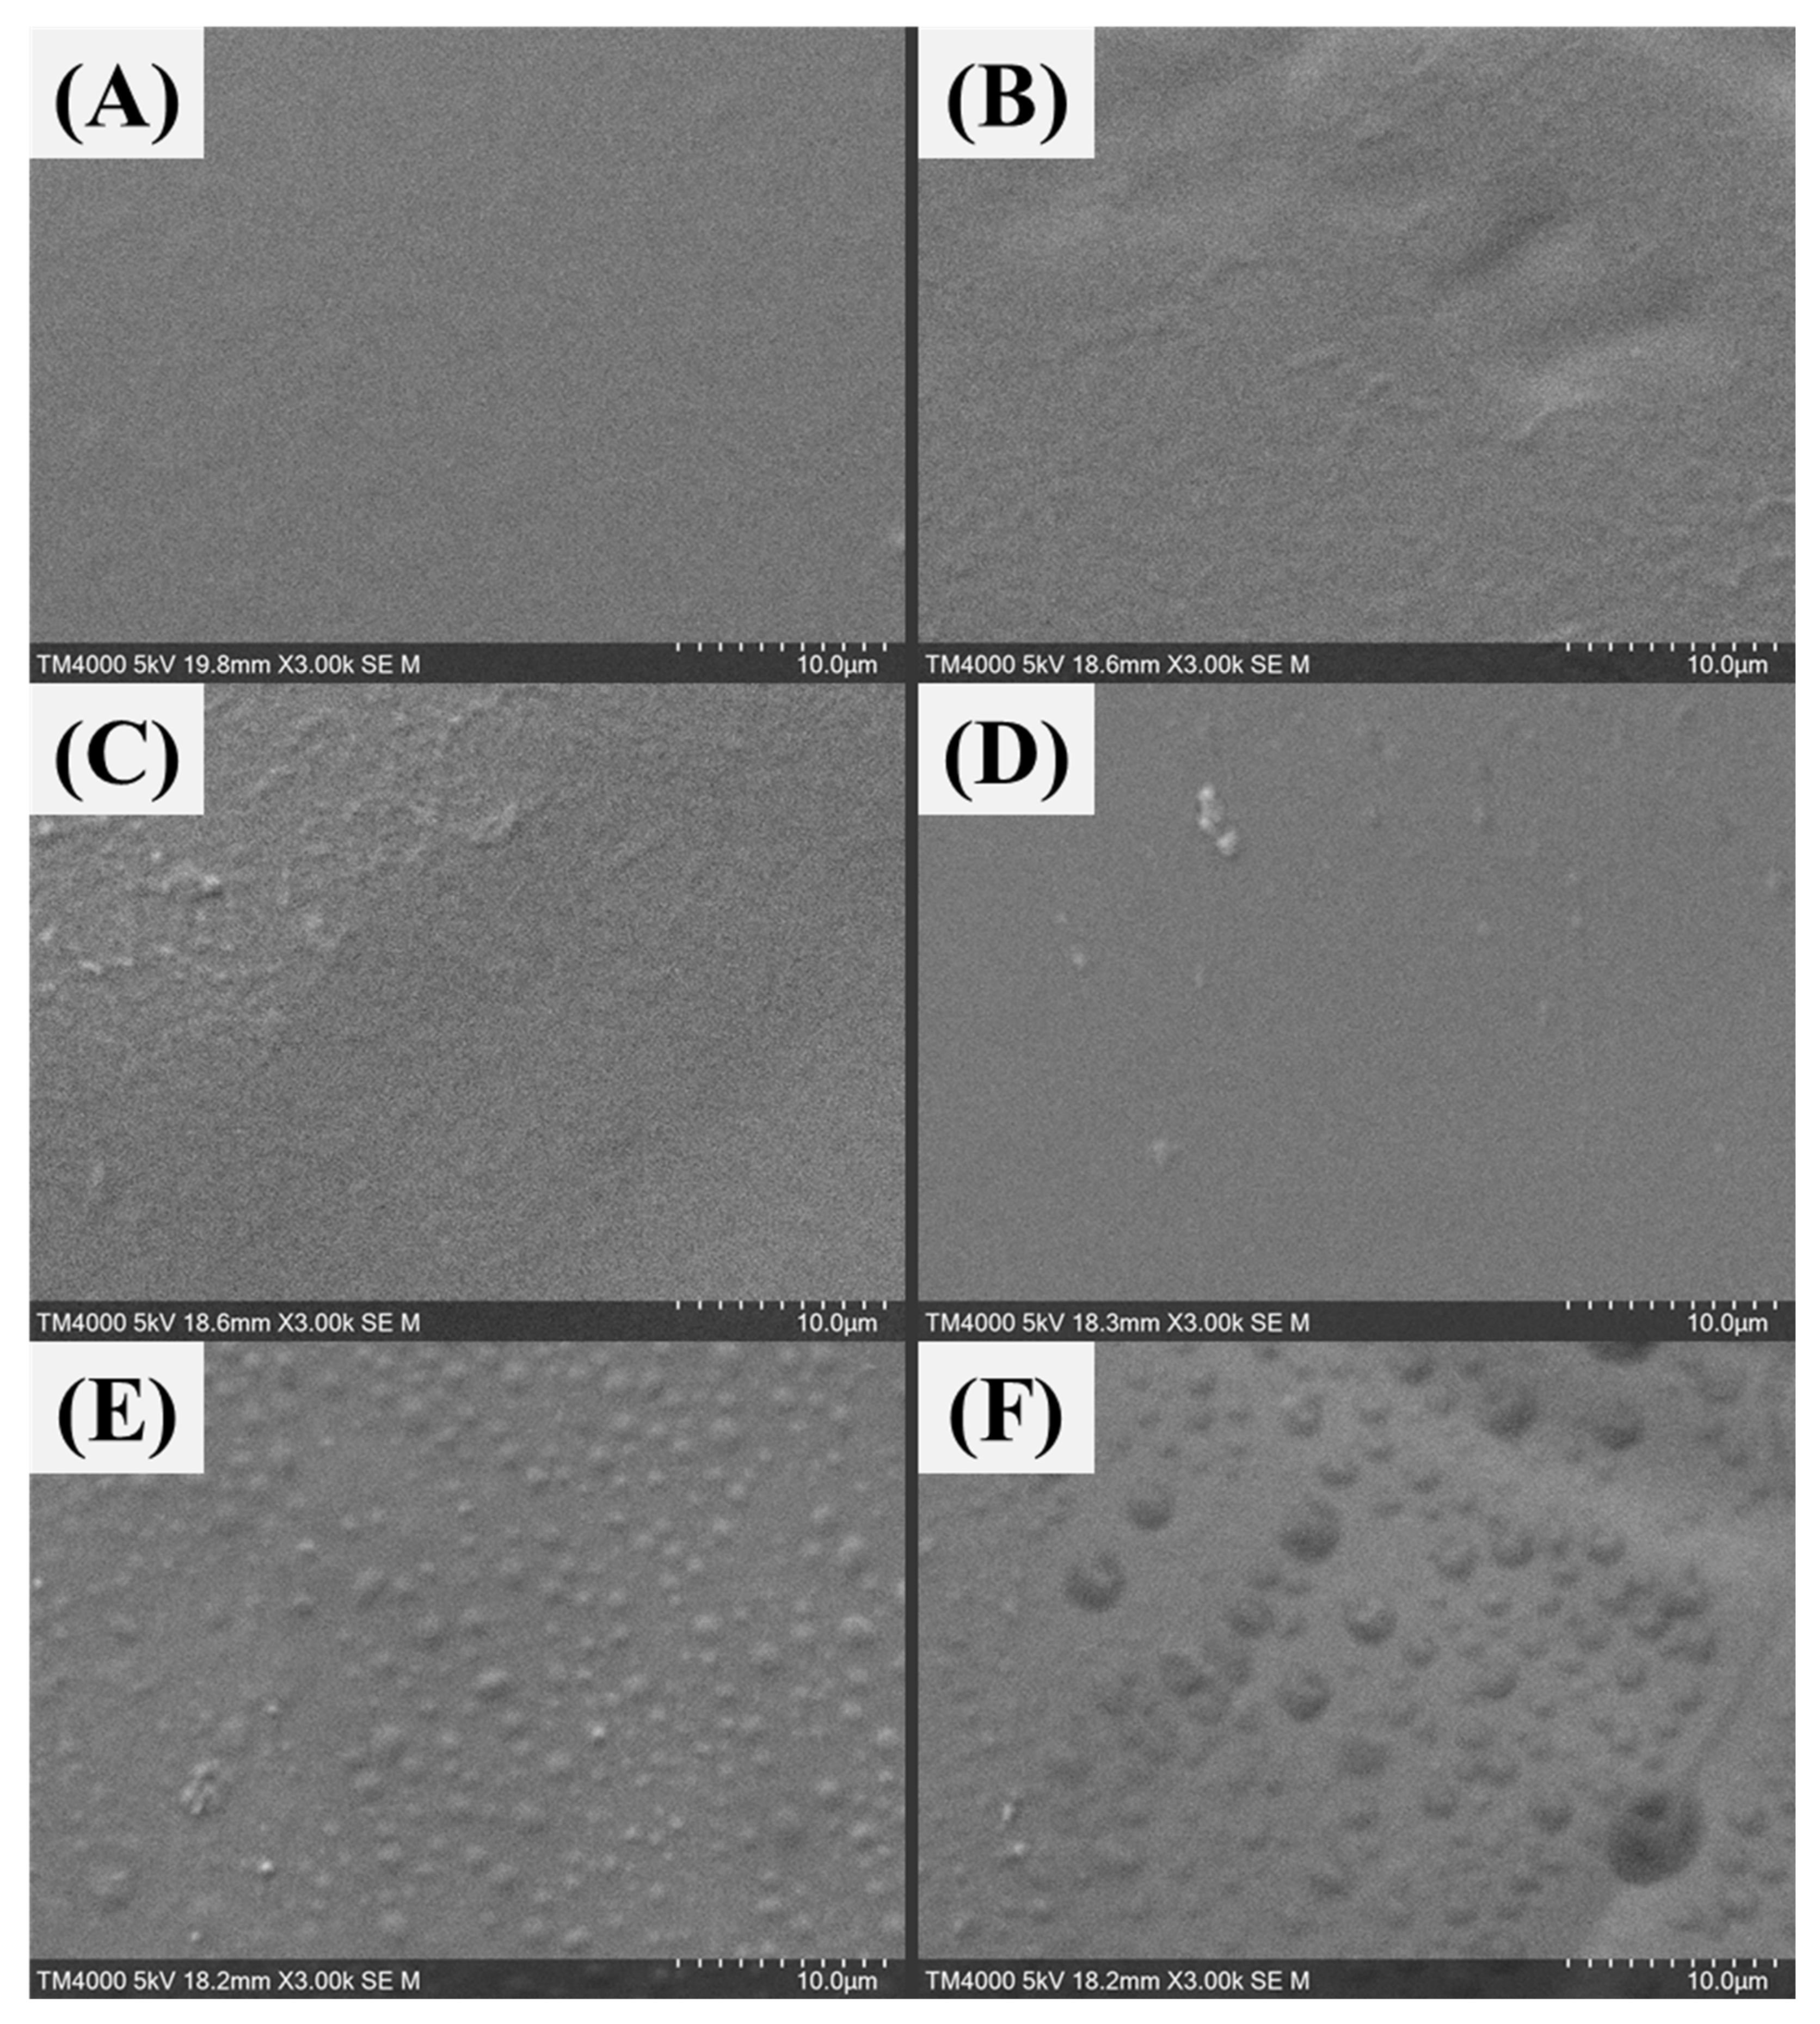
Sustainability 13 13367 g014
Figure 15. SEM diagrams of different MSG content PVA-MSG composite membranes: (A) no additional MSG, (B) 2 wt%, (C) 5 wt%, (D) 9 wt%, (E) 17 wt%, and (F) 23 wt%.
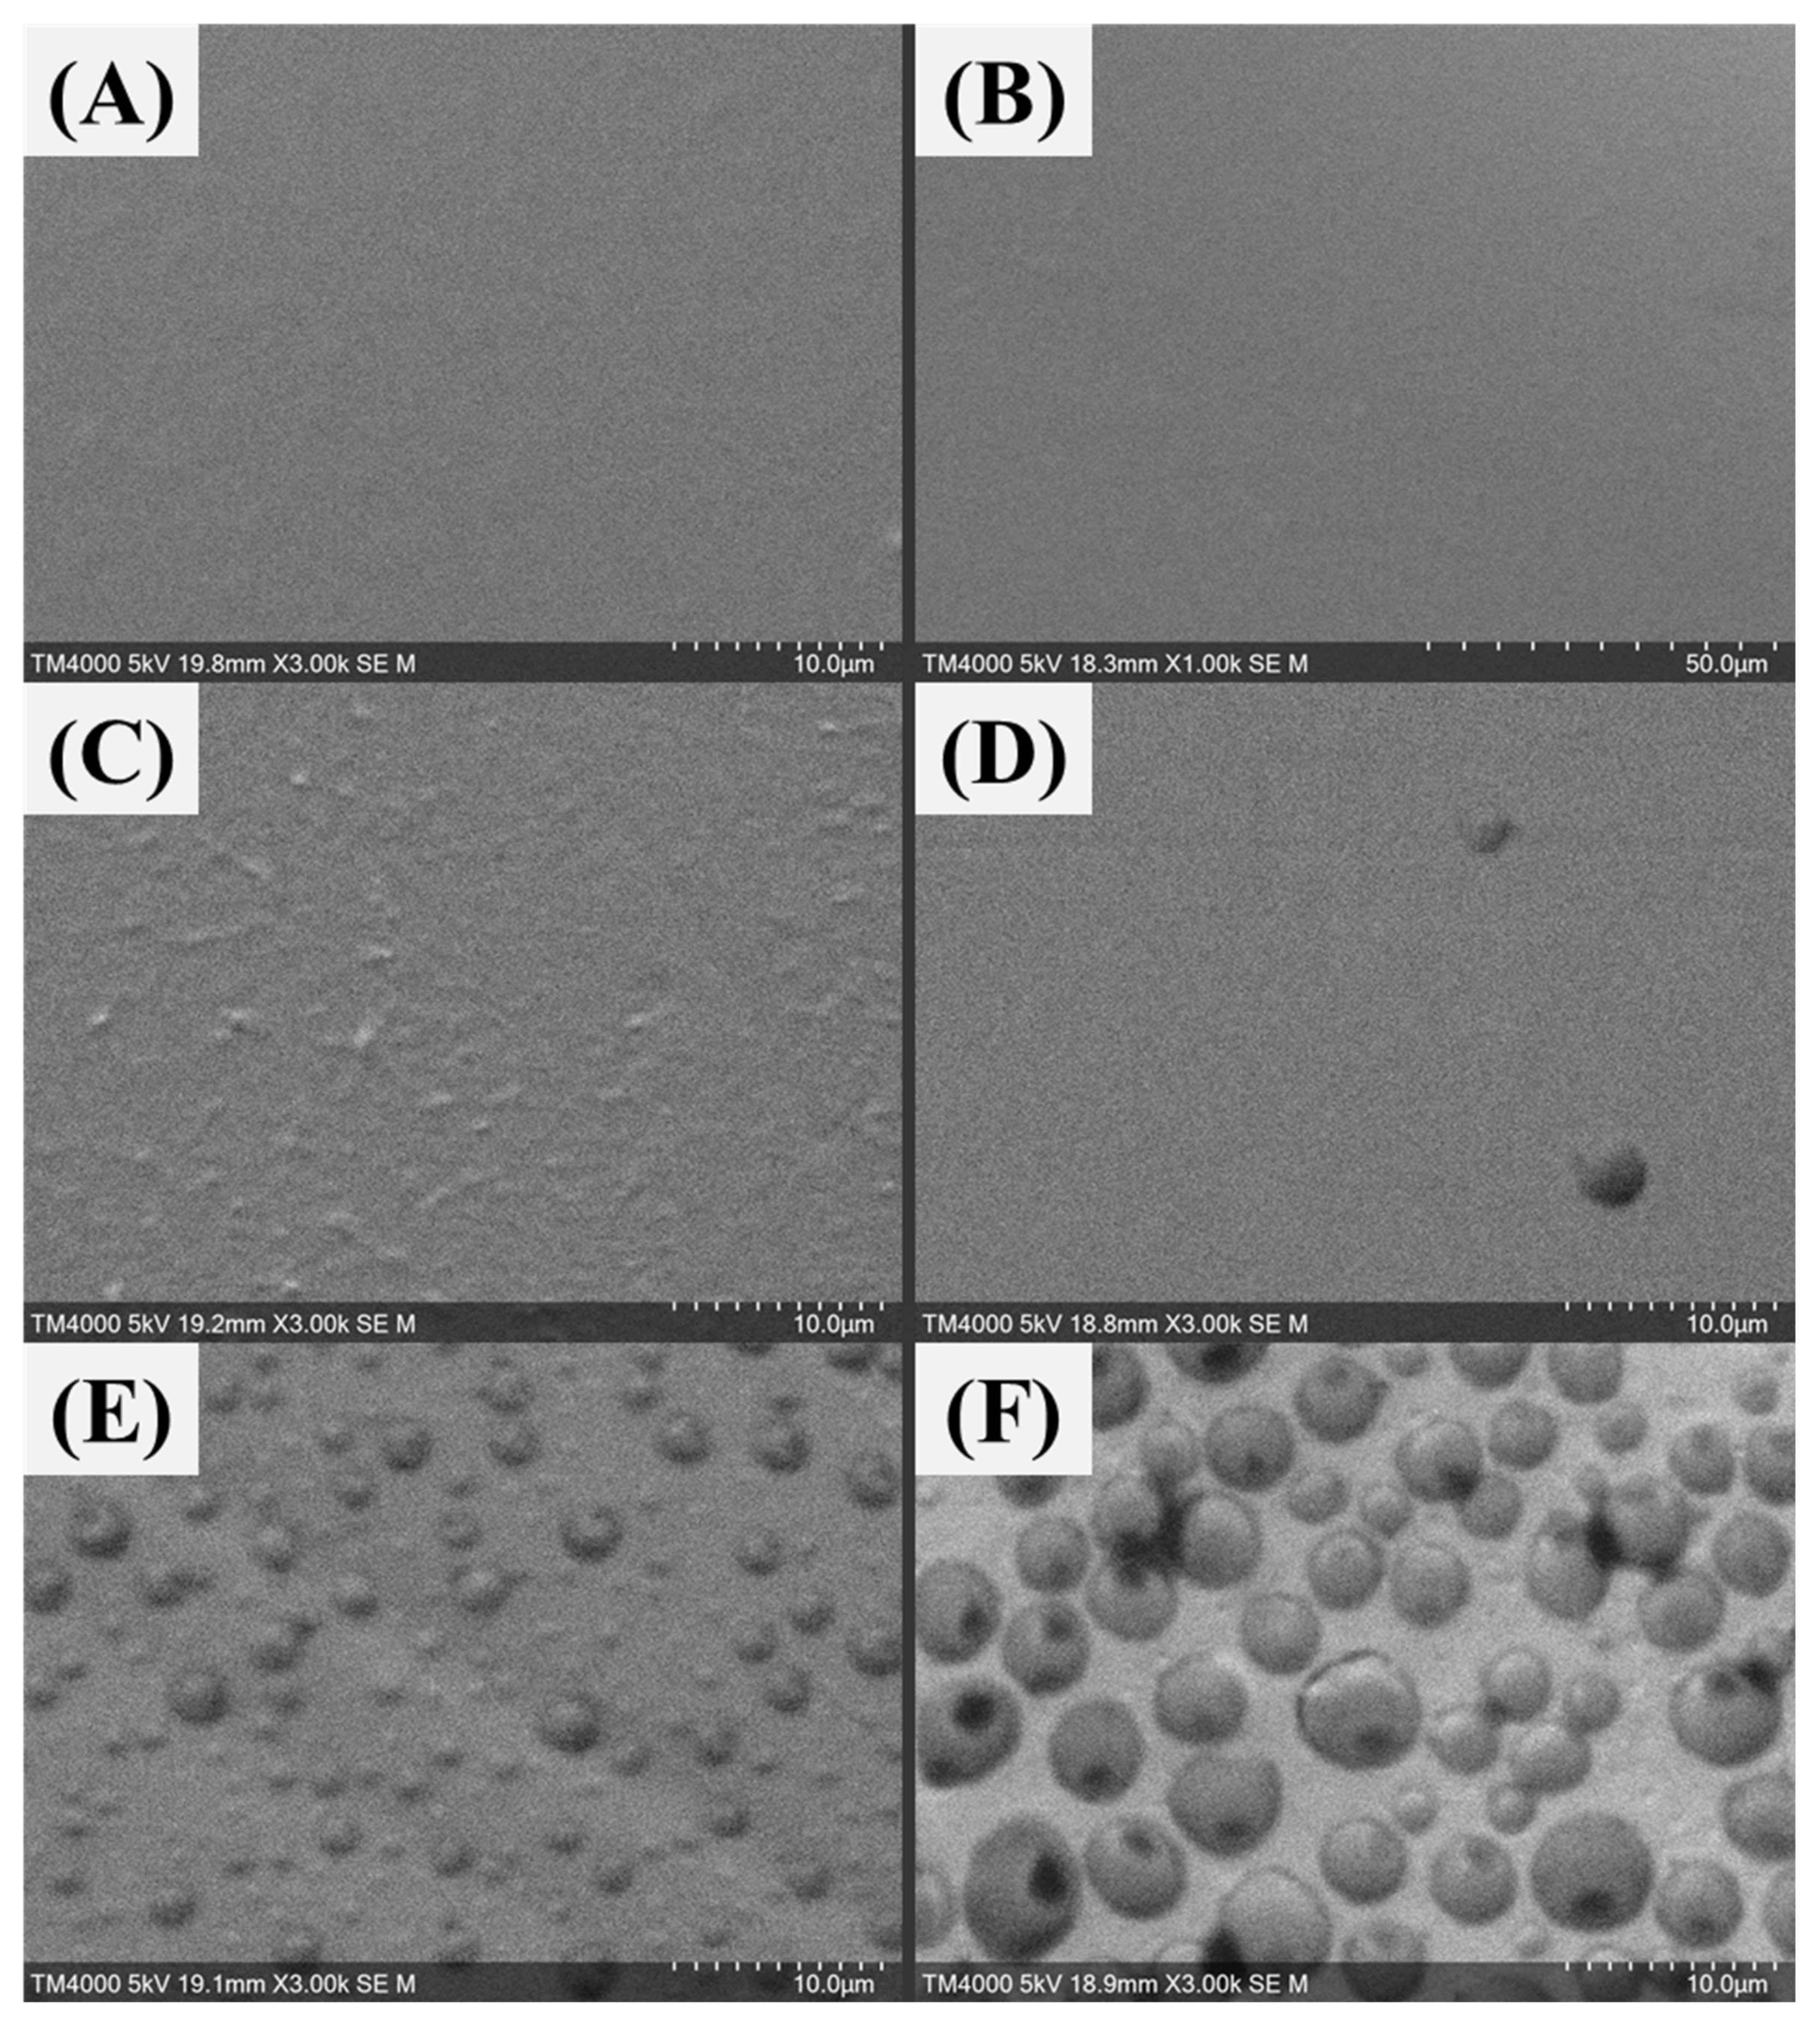
Sustainability 13 13367 g015
Figure 16. SEM diagrams of different GA content PVA-GA composite membranes: (A) no additional GA, (B) 2 wt%, (C) 5 wt%, (D) 9 wt%, (E) 13 wt%, and (F) 17 wt%.
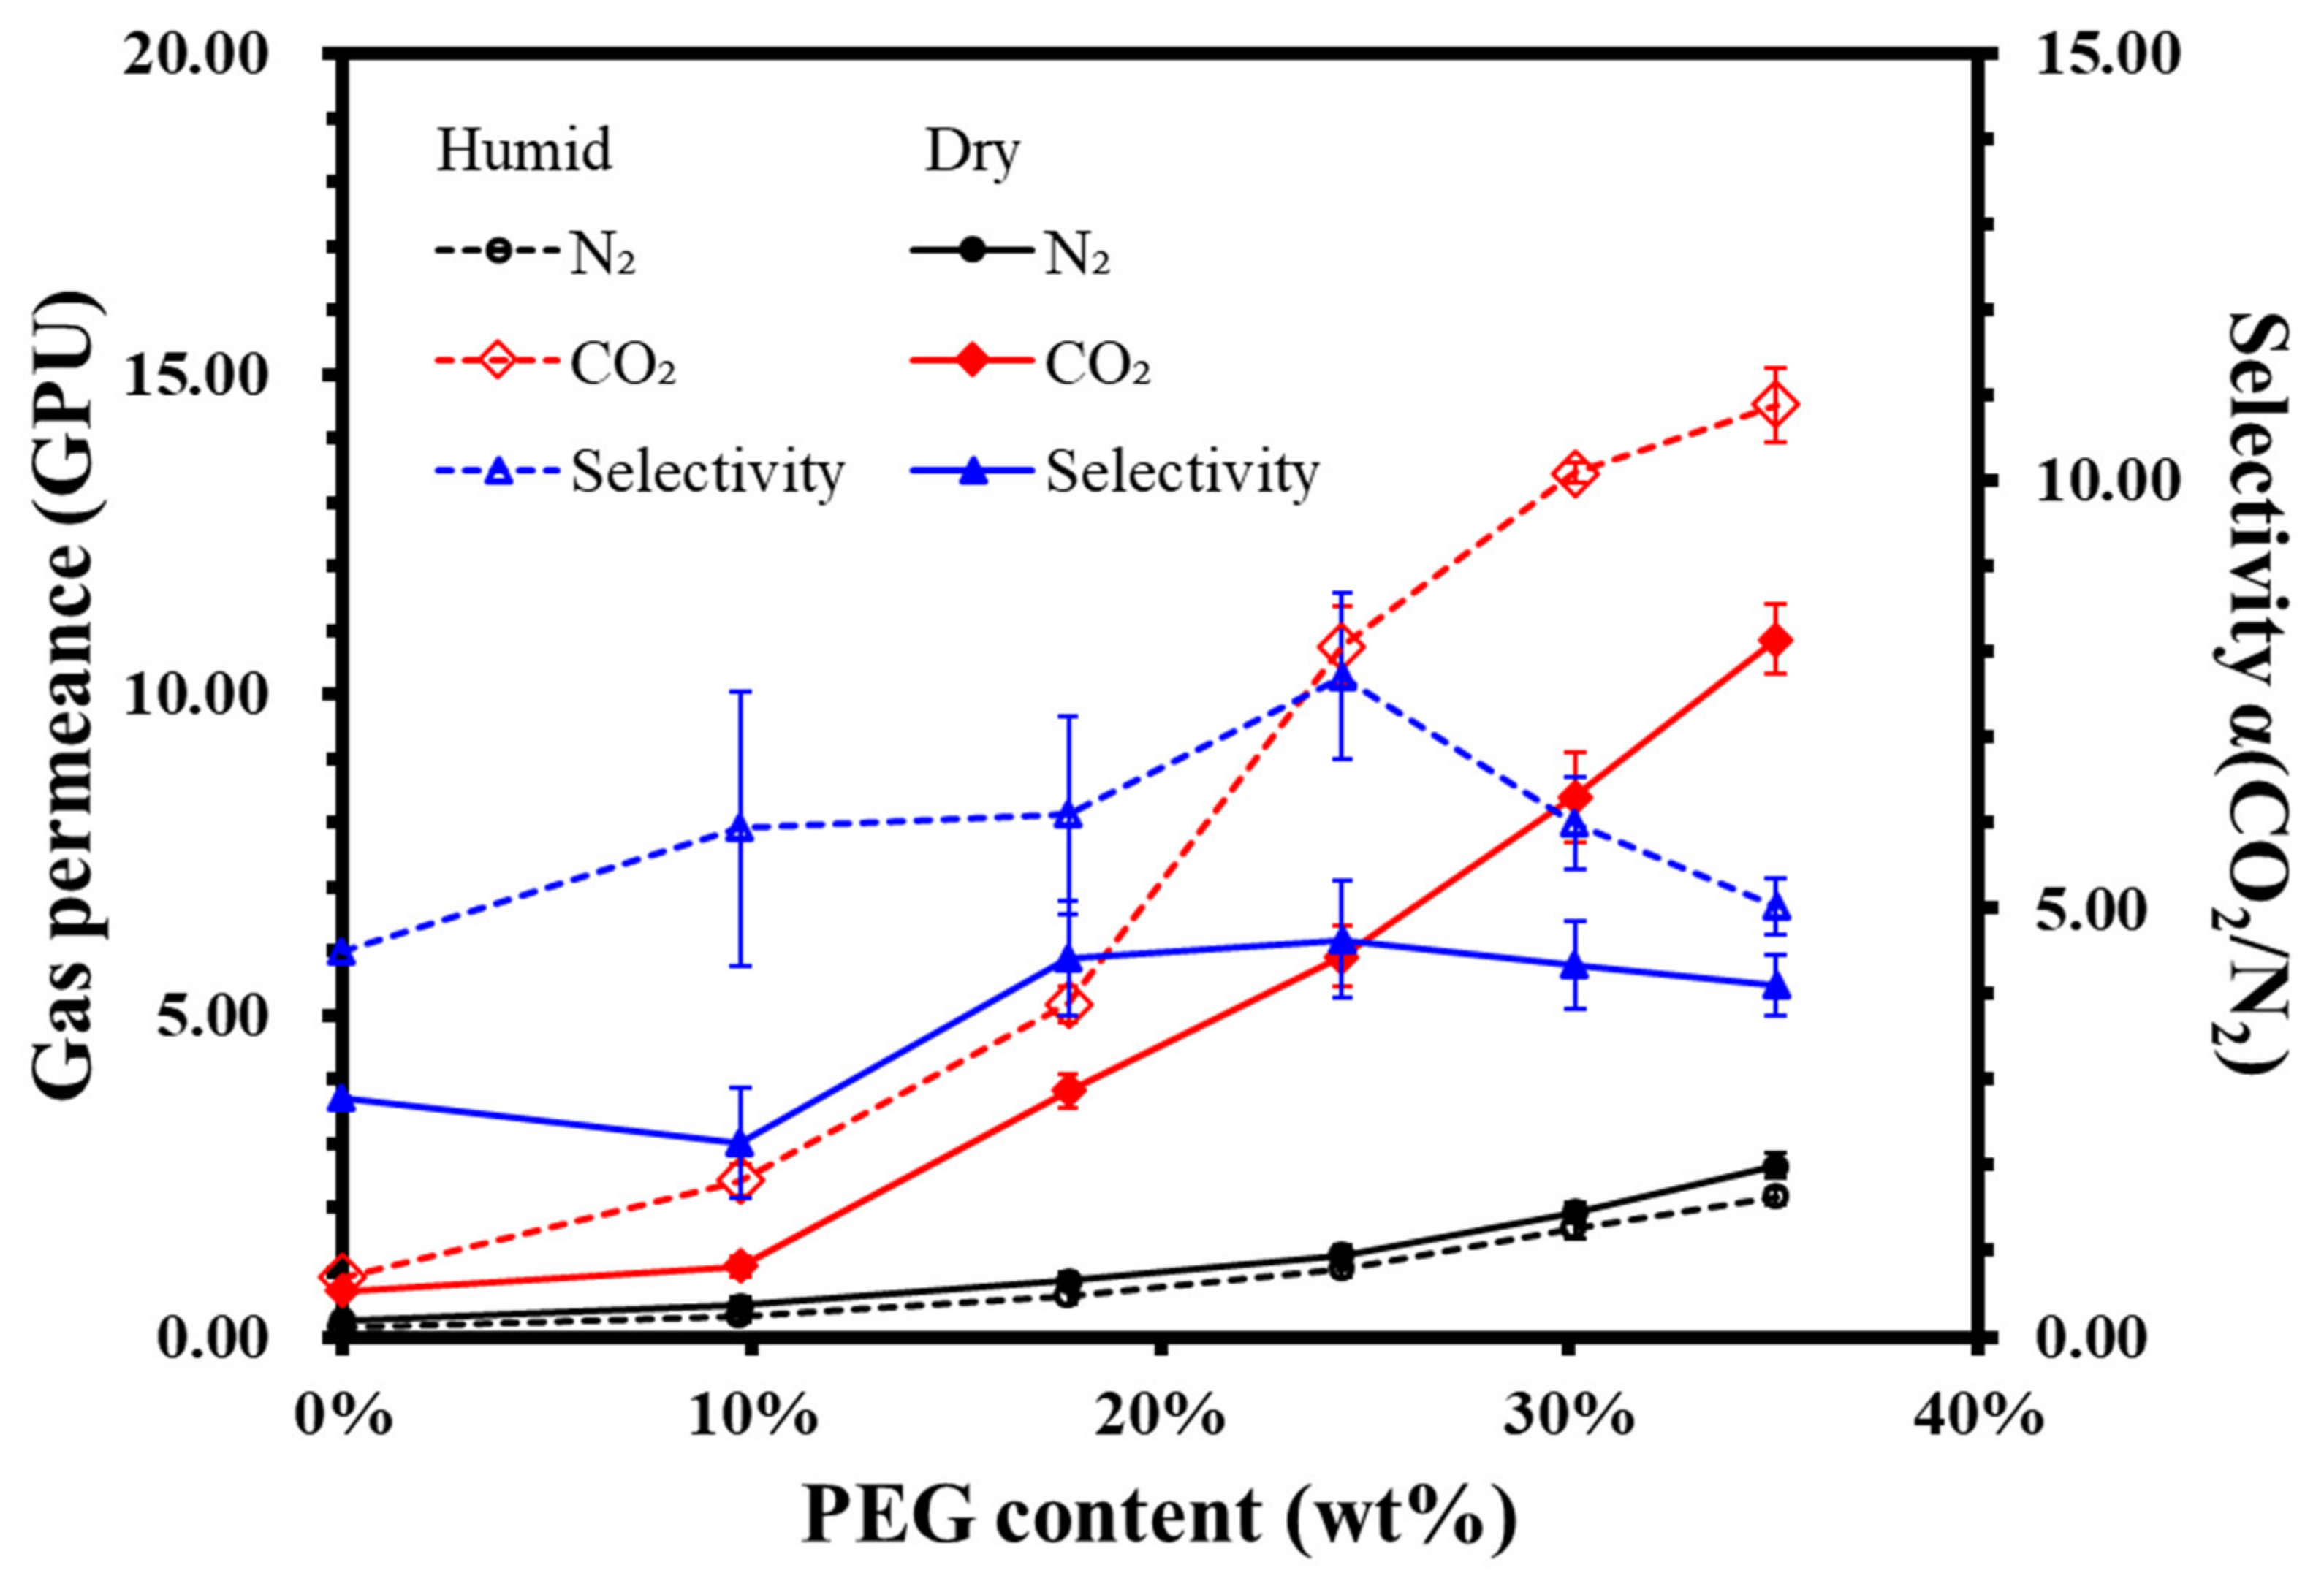
Sustainability 13 13367 g016
Figure 17. Effect of PEG content on the gas permeability of composite membrane in a dry or humid environment.
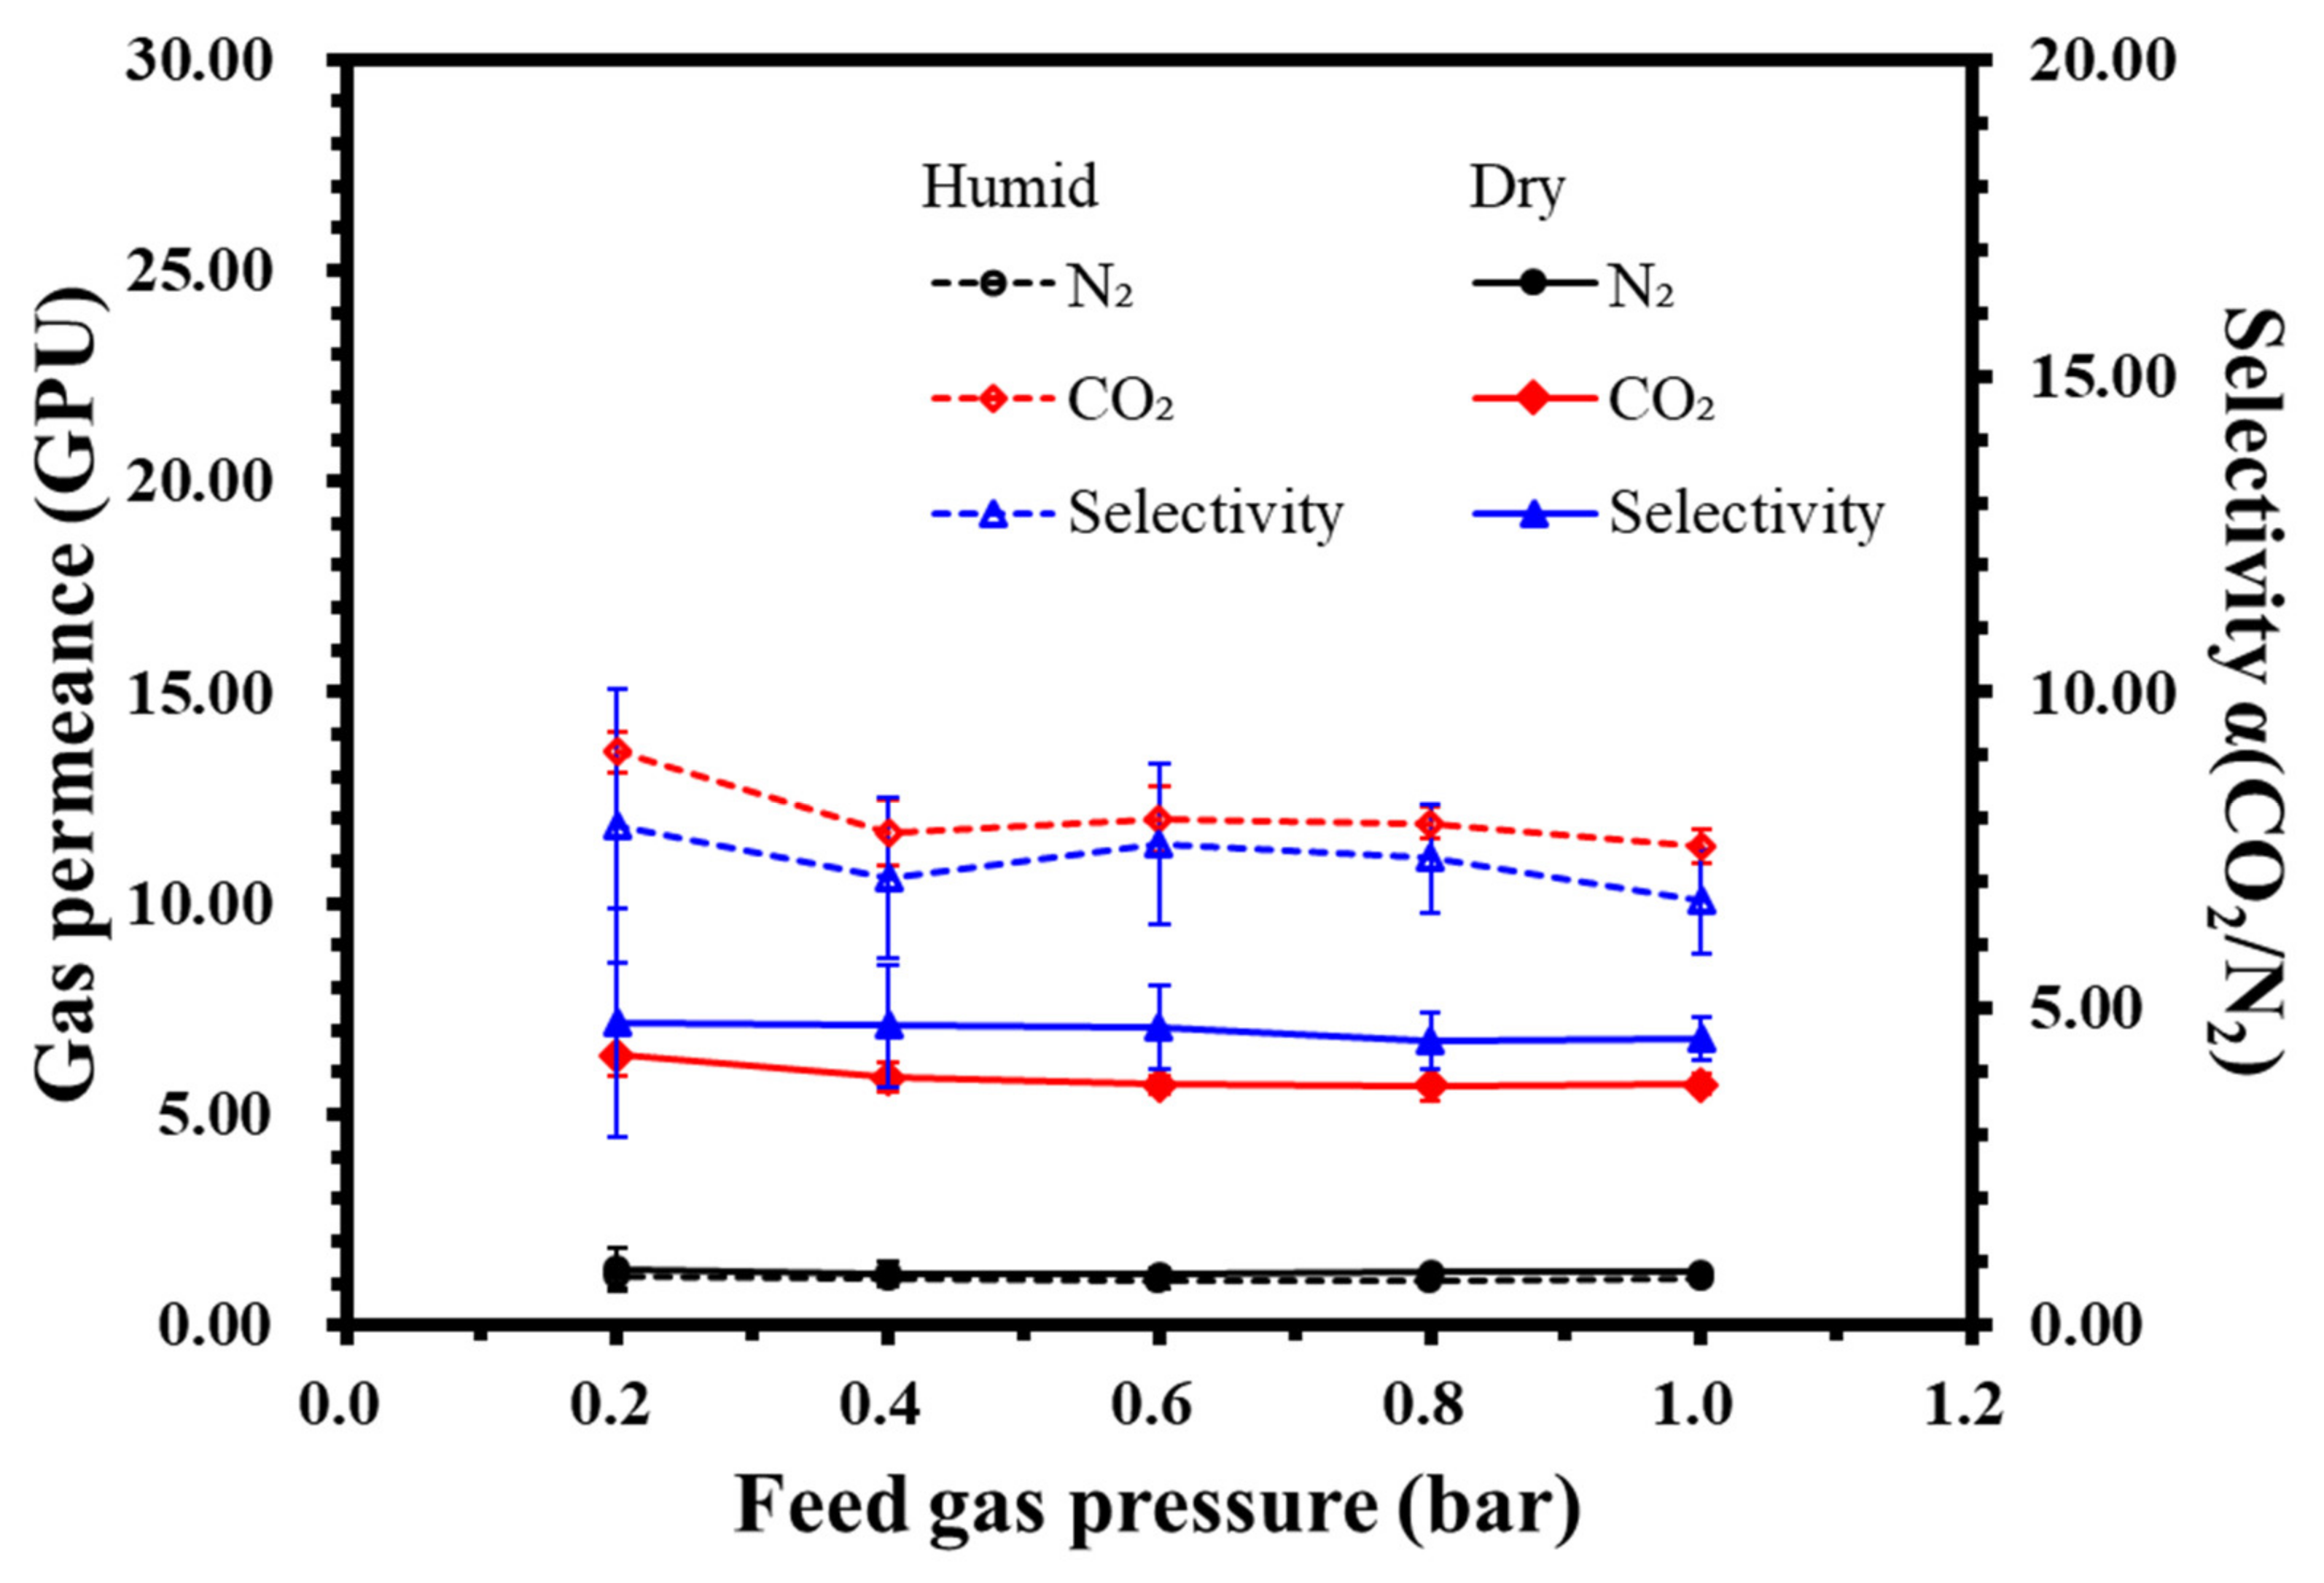
Sustainability 13 13367 g017
Figure 18. The relationship between gas permeability/selectivity and the pressure of the PVA-PEG-1.2 composite membrane in a dry or humid environment.
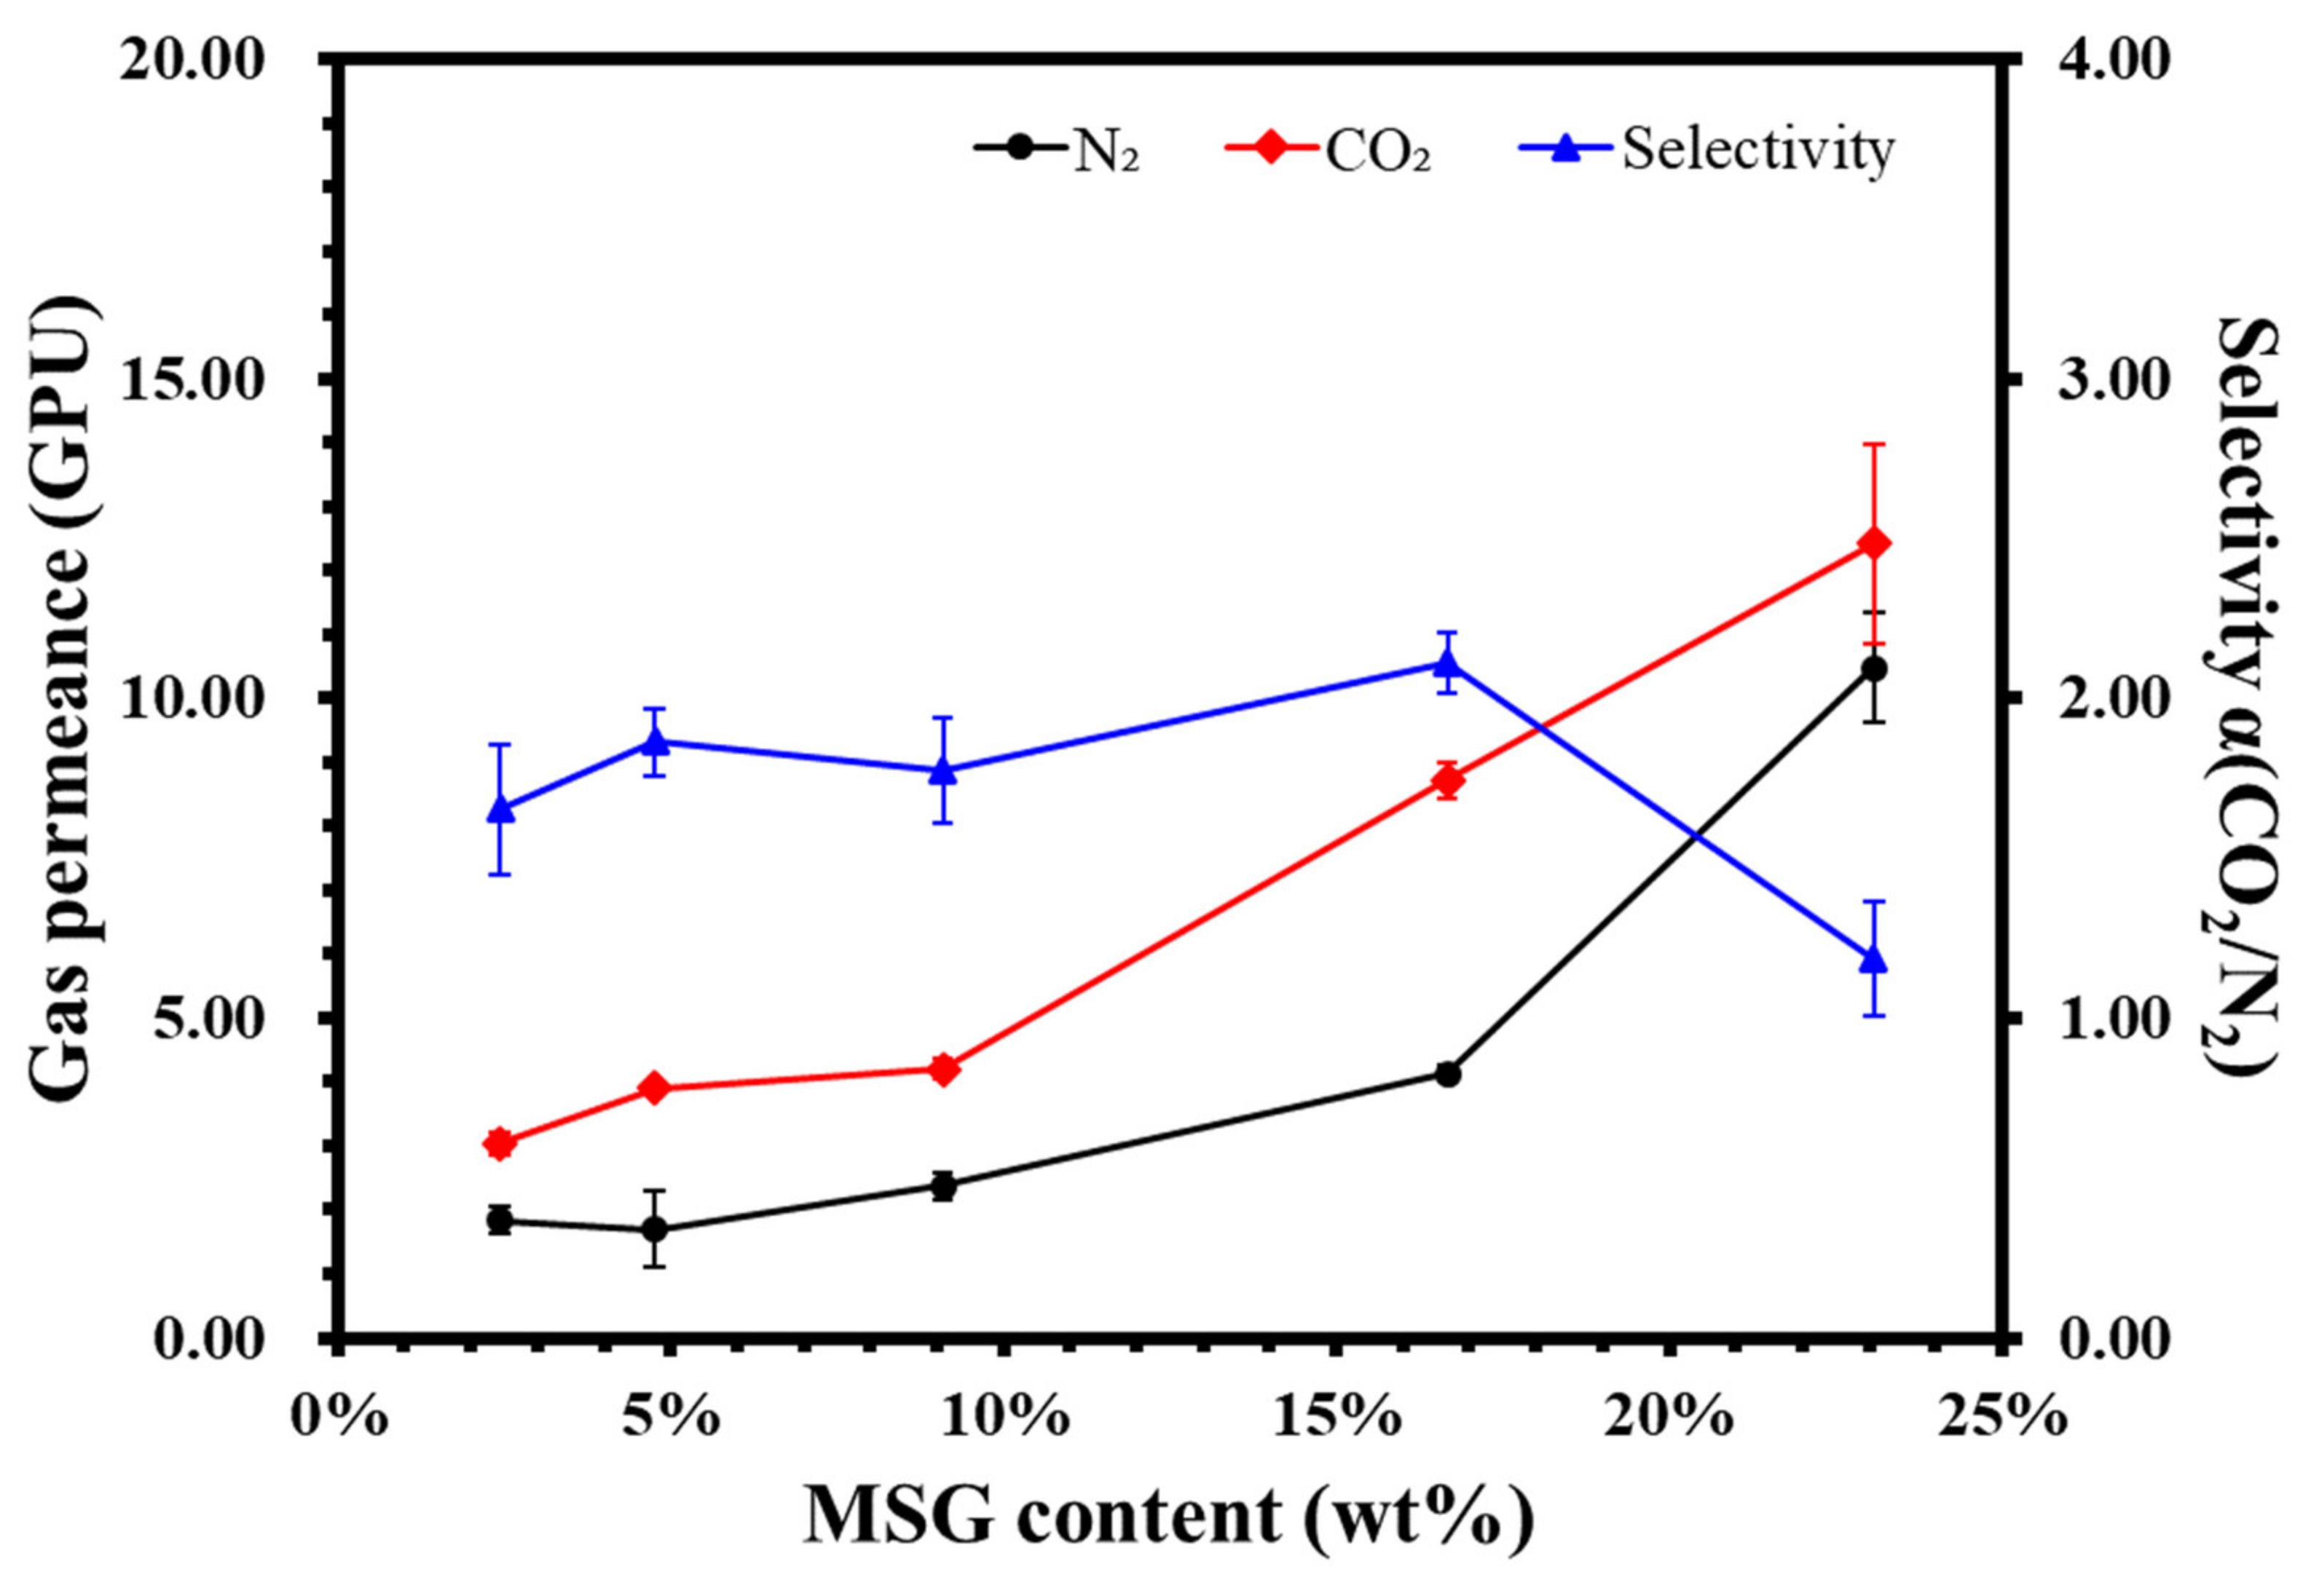
Sustainability 13 13367 g018
Figure 19. Effect of sodium glutamate content on the gas permeability of composite membrane.
Sustainability 13 13367 g019
Figure 20. Effect of glutamic acid content on the gas permeability of composite membrane.
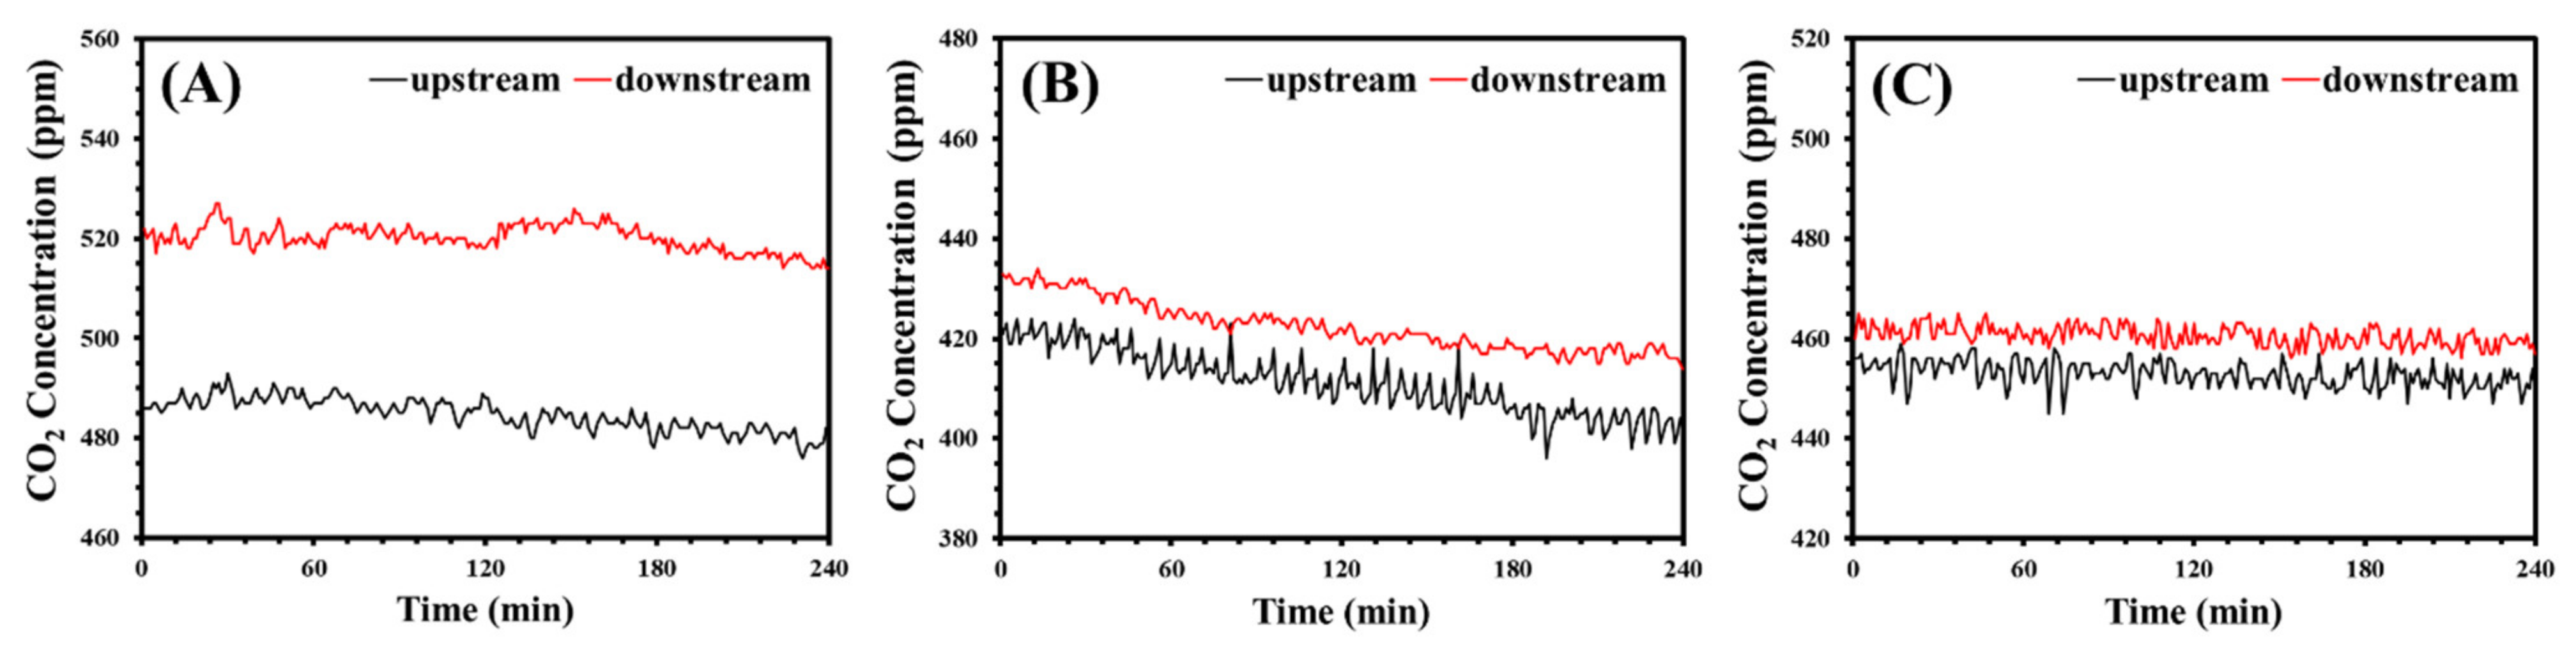
Sustainability 13 13367 g020
Figure 21. The concentration difference of CO2 in the composite membranes: (A) PVA-PEG-1.2, (B) PVA-MSG-0.8, and (C) PVA-GA-0.4.
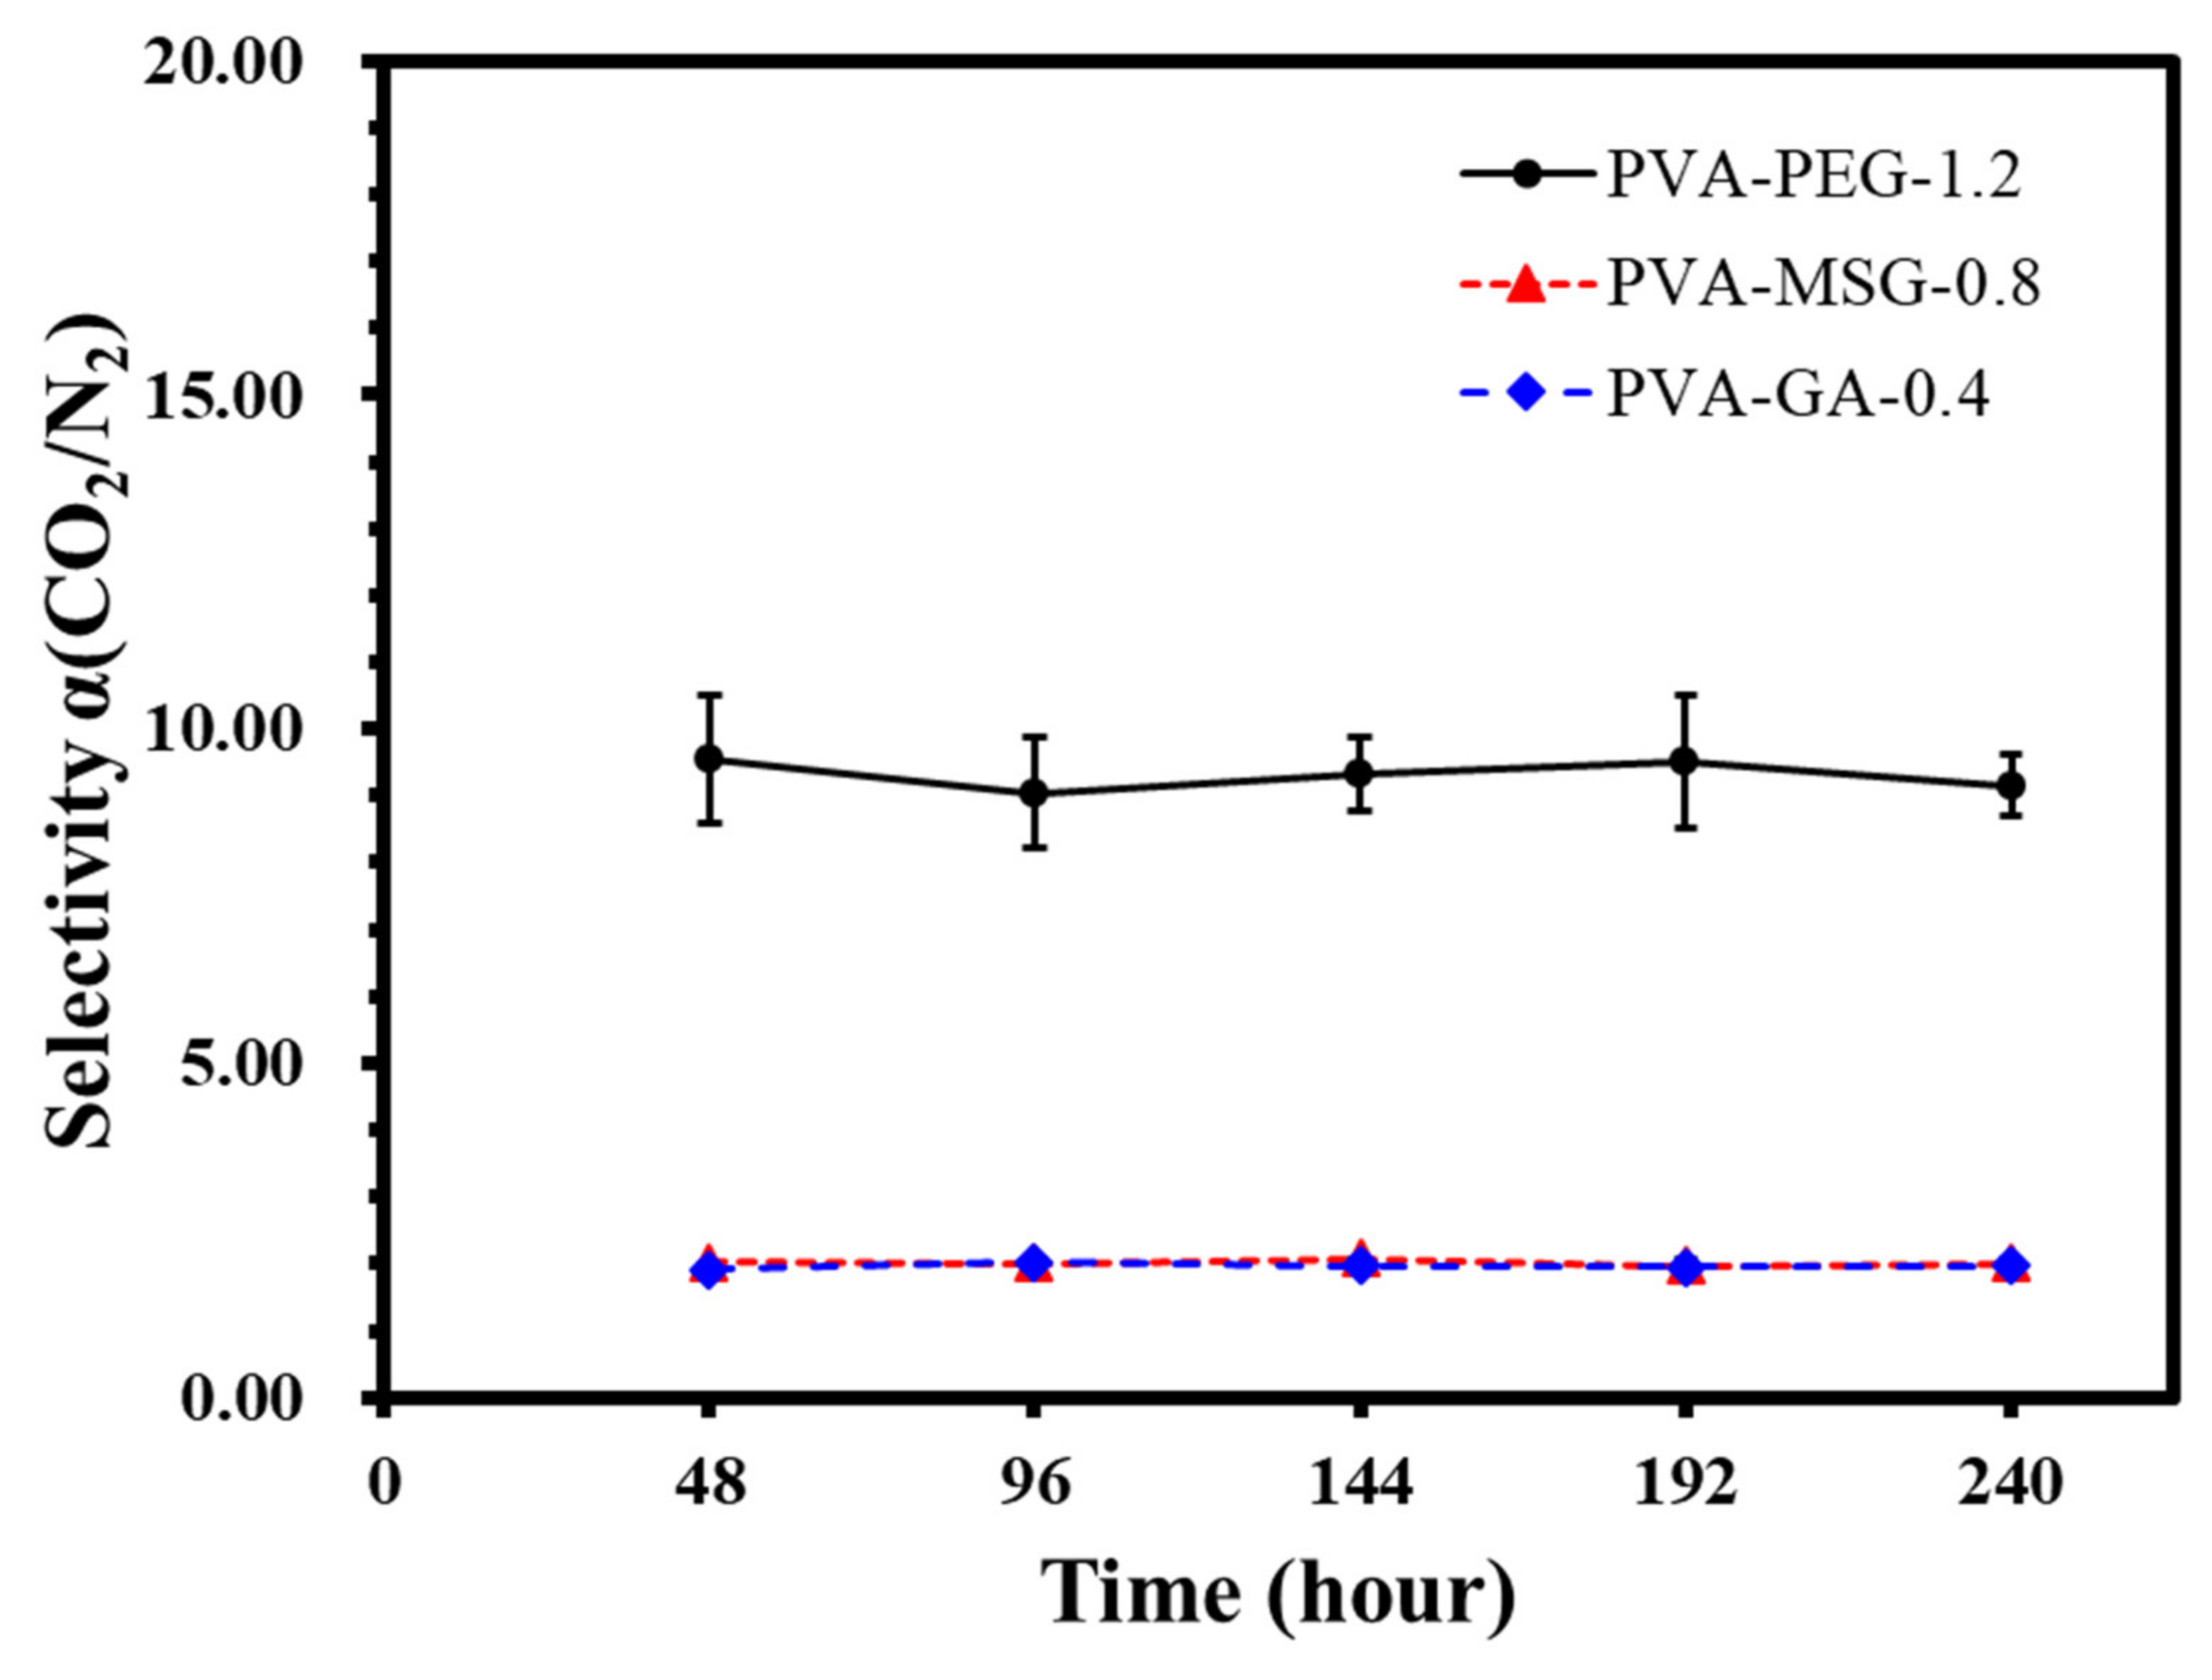
Sustainability 13 13367 g021
Figure 22. The selectivity of PVA-PEG-1.2, PVA-MSG-0.8, and PVA-GA-0.4 composite membranes.
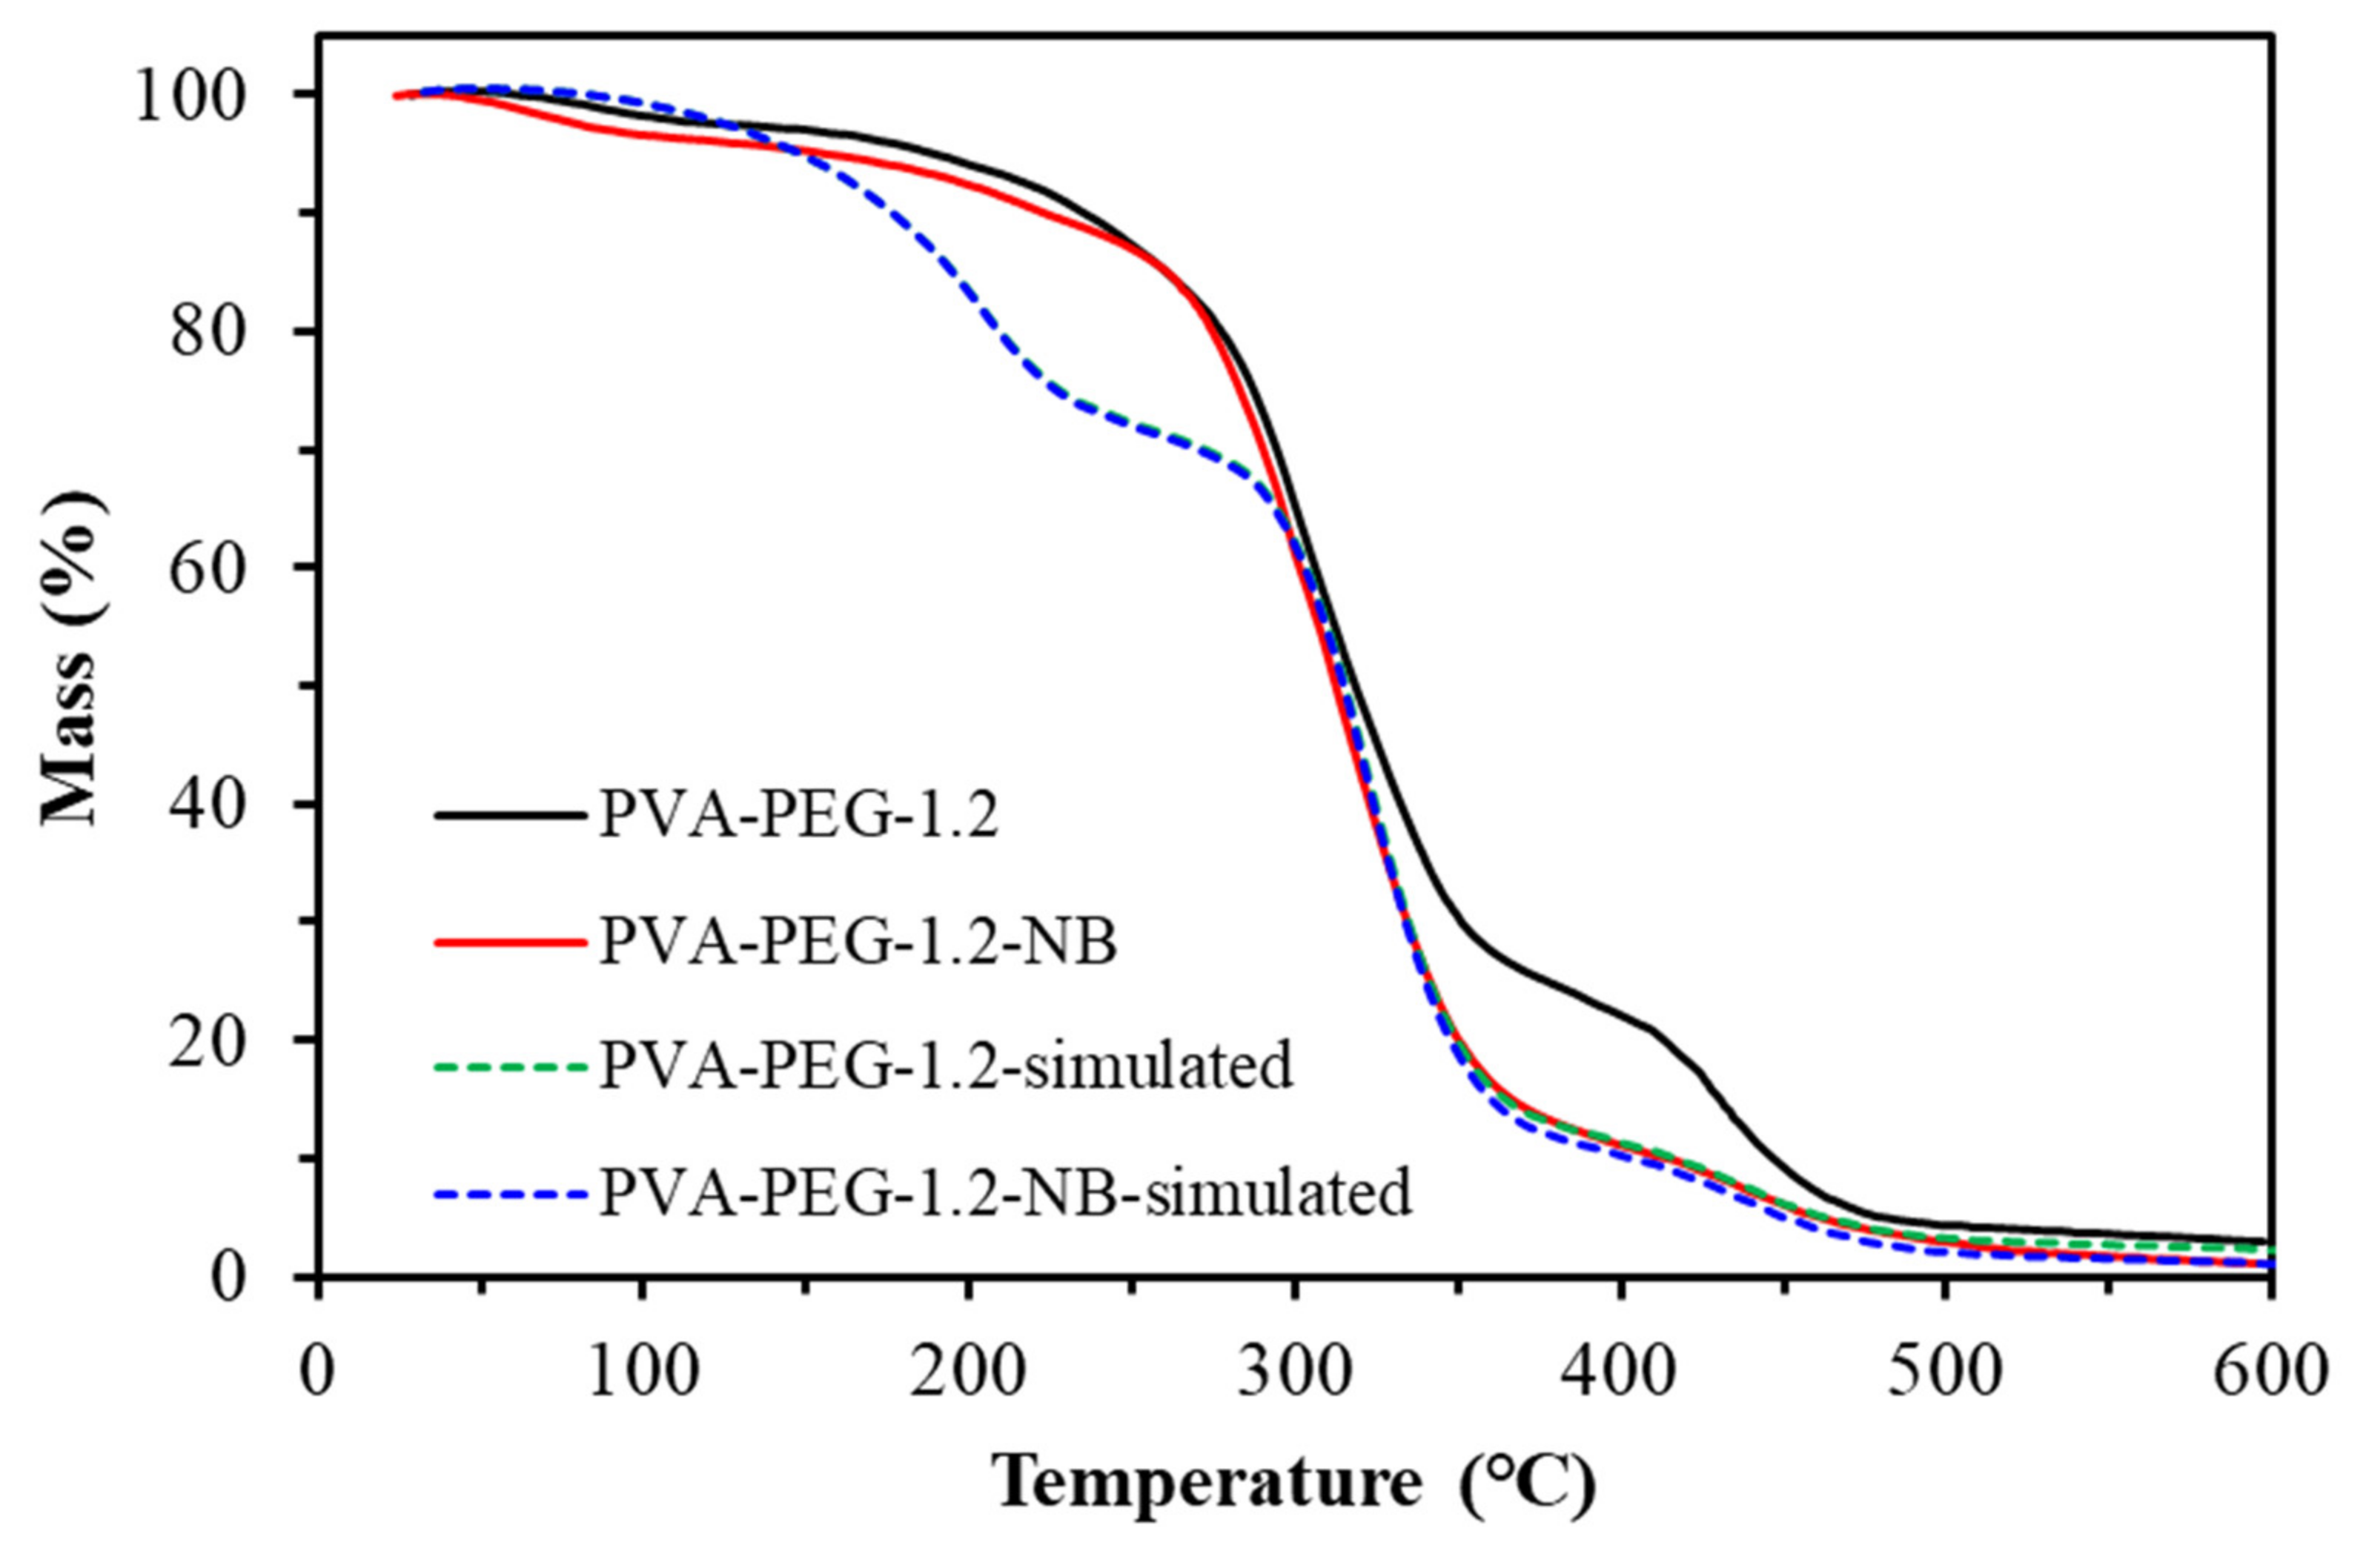
Sustainability 13 13367 g022
Figure 23. Thermal mass of the PVA-PEG-1.2 composite membrane.
Sustainability 13 13367 g023
Table 1. Peak assignments of PVA and cross-linked PVA.
Peak Position (cm−1)Peak Assignment
PVAPVA-B-Series
3100–36003100–3600O-H stretching
2850–29502850–2950C-H symmetric/asymmetric stretching
17301730C=O stretching
13501350C-H bending
11401140C-O stretching
10901090C-O stretching
1286B-O-C stretching
663O-B-O stretching
Table 2. Peak assignments of composite membrane.
Peak Position (cm−1)Peak Assignment
3600–3000O-H stretching
2966C-H stretching
2950–2850C-H symmetric asymmetric stretching
1585C=C stretching
1560N-H stretching
1500C=C stretching
1487C=C stretching
1236C-O-C stretching
1149O-S-O stretching
1050C-O stretching
1014C-H stretching
831C-H stretching
690C-S-C stretching
Table 3. Peak assignments of PVA-X composite membranes.
Peak Position (cm−1)Peak Assignment
PVA-PEGPVA-MSGPVA-GA
3000–36003000–36003000–3600O-H stretching
2800–29002950–30502950–3050C-H stretching
1635N-H stretching
1602 C-O stretching
1500N-H stretching, symmetric
1400COOH stretching, symmetric
1395 C-O stretching
1350 C-O stretching
1090 C-O stretching
Table 4. Thermal gravimetric analysis.
Sample1st Degradation2nd Degradation3rd Degradation
T1 (°C)Weight Loss (%)T2 (°C)Weight Loss (%)T3 (°C)Weight Loss (%)
RO500–55050----
PVA-PEG-2.0150–2507.3275–3505.8500–55045.8
PVA-MSG-1.2275–3757.7500–55051.1--
PVA-GA-0.8275–3755.9500–55054.0--
Table 5. Gas permeability and selectivity in a dry environment *.
SamplePEG (wt%)Permeance (GPU)Selectivity (CO2/N2)
CO2N2
PVA-B-200.71 ± 0.120.26 ± 0.122.80 ± 1.36
PVA-PEG-0.4101.10 ± 0.160.48 ± 0.122.26 ± 0.63
PVA-PEG-0.8183.83 ± 0.280.87 ± 0.124.41 ± 0.68
PVA-PEG-1.2245.72 ± 0.251.26 ± 0.084.53 ± 0.34
PVA-PEG-1.6308.42 ± 0.701.94 ± 0.164.34 ± 0.51
PVA-PEG-2.03510.86 ± 0.542.65 ± 0.194.10 ± 0.36
* Feed gas pressure: 1.00 bar.
Table 6. Gas permeability and selectivity in a humid environment *.
SamplePEG (wt%)Permeance (GPU)Selectivity (CO2/N2)
CO2N2
PVA-B-200.92 ± 0.150.15 ± 0.086.00 ± 3.16
PVA-PEG-0.4102.42 ± 0.250.31 ± 0.087.92 ± 2.14
PVA-PEG-0.8185.18 ± 0.270.64 ± 0.128.12 ± 1.55
PVA-PEG-1.22411.34 ± 0.411.13 ± 0.1310.05 ± 1.22
PVA-PEG-1.63013.46 ± 0.151.68 ± 0.158.00 ± 0.73
PVA-PEG-2.03514.54 ± 0.582.17 ± 0.126.71 ± 0.45
* Feed gas pressure: 1.00 bar.
Table 7. The gas permeability and selectivity of PVA-PEG-1.2 membrane in varied pressure.
Pressure (bar)Permeance (GPU)Selectivity
DryHumidDryHumid
CO2N2CO2N2(CO2/N2)
1.005.72 ± 0.251.26 ± 0.0811.34 ± 0.411.13 ± 0.134.53 ± 0.3410.05 ± 1.22
0.805.69 ± 0.371.27 ± 0.0911.91 ± 0.391.08 ± 0.124.49 ± 0.4411.07 ± 1.29
0.605.71 ± 0.221.21 ± 0.1611.99 ± 0.791.05 ± 0.164.71 ± 0.6611.39 ± 1.89
0.405.88 ± 0.331.24 ± 0.2511.67 ± 0.781.10 ± 0.184.73 ± 0.9810.61 ± 1.90
0.206.41 ± 0.481.34 ± 0.4913.58 ± 0.491.15 ± 0.314.79 ± 1.8011.83 ± 3.25
Table 8. Gas permeability of polyvinyl alcohol-sodium glutamate composite membranes *.
SampleMSG (wt%)Permeance (GPU)Selectivity (CO2/N2)
CO2N2
PVA-MSG-0.123.03 ± 0.161.84 ± 0.201.65 ± 0.20
PVA-MSG-0.253.91 ± 0.081.69 ± 0.601.86 ± 0.10
PVA-MSG-0.494.21 ± 0.152.37 ± 0.201.77 ± 0.16
PVA-MSG-0.8178.72 ± 0.274.13 ± 0.132.11 ± 0.09
PVA-MSG-1.22312.42 ± 1.5510.48 ± 0.851.18 ± 0.18
* Feed gas pressure: 1.00 bar, wet condition.
Table 9. Gas permeability of polyvinyl alcohol/glutamic acid composite membranes *.
SampleGA (wt%)Permeance (GPU)Selectivity (CO2/N2)
CO2N2
PVA-GA-0.122.78 ± 0.191.76 ± 0.081.58 ± 0.13
PVA-GA-0.252.83 ± 0.151.63 ± 0.561.46 ± 0.12
PVA-GA-0.495.43 ± 0.202.81 ± 0.121.94 ± 0.11
PVA-GA-0.6137.06 ± 0.273.85 ± 0.121.83 ± 0.09
PVA-GA-0.8177.88 ± 0.206.15 ± 0.231.28 ± 0.06
* Feed gas pressure: 1.00 bar, wet condition.
Table 10. Separation efficiency of the composite membranes.
SamplePressure Difference (mmHg)CO2 Concentration (ppm)
blank-2.43 ± 2.08
reverse osmosis membrane7002.73 ± 1.43
PVA-PEG-1.270035.37 ± 3.15
PVA-MSG-0.870011.32 ± 3.32
PVA-GA-0.47007.70 ± 2.76
Table 11. Water absorption measurement of the self-supporting membranes.
SampleWater Uptake (%)
PVA52.3 ± 1.4
PVA-B-260.7 ± 1.3
PVA-PEG-1.272.1 ± 1.6
PVA-MSG-0.839.9 ± 1.3
PVA-GA-0.4N/A
Table 12. The selectivity α(CO2/N2) of PVA-X composite membranes.
Time (hour)PVA-PEG-1.2PVA-MSG-0.8PVA-GA-0.4
489.59 ± 0.972.10 ± 0.081.91 ± 0.09
969.56 ± 0.952.02 ± 0.132.01 ± 0.04
1449.04 ± 0.832.01 ± 0.151.97 ± 0.11
1929.33 ± 0.541.97 ± 0.091.95 ± 0.14
2409.51 ± 0.992.01 ± 0.101.97 ± 0.09
Table 13. The composition of samples with or without Borax.
SamplePVA (g)PEG (mL)Borax (g)
PVA-PEG-1.24.001.200.08
PVA-PEG-1.2-NB4.001.20-
Table 14. The gas separation and adsorption properties of samples with or without Borax.
SamplePermeance (GPU)Selectivity
(CO2/N2)
Water Uptake (%)
CO2N2
PVA-PEG-1.210.76 ± 0.611.05 ± 0.1210.05 ± 1.2272.1 ± 1.6
PVA-PEG-1.2-NB13.95 ± 0.421.66 ± 0.128.42 ± 0.6566.9 ± 1.7
Table 15. Gas dynamic radius.
MoleculeKinetic Diameter (Å)
CO23.30
N23.64
Publisher’s Note: MDPI stays neutral with regard to jurisdictional claims in published maps and institutional affiliations.

