Article

Green Taxation Promotes the Intelligent Transformation of Chinese Manufacturing Enterprises: Tax Leverage Theory

College of Economics and Management, Qingdao University of Science and Technology, Qingdao 266061, China
*
Author to whom correspondence should be addressed.
Sustainability 2021, 13(23), 13321; https://doi.org/10.3390/su132313321
Submission received: 15 October 2021 / Revised: 15 November 2021 / Accepted: 22 November 2021 / Published: 1 December 2021
(This article belongs to the Topic Industrial Engineering and Management)

Abstract

:
A key issue that concerns governments is how to formulate optimal technology subsidies and green tax standards to promote the intelligent transformation of manufacturing enterprises. In this work, the Pollutant Emission Indicator Trading Mechanism (PEITM) is proposed, and green taxes are divided into Tax of Pollutant Emissions (TPE) and the Tax of Excess Pollutant Emissions (TEPE). On this basis, we study the impact of green taxes and technology subsidies on the intelligent transformation of enterprises in different manufacturing environments from the government’s perspective and provide the optimal government subsidy scheme under different green tax policies. Although it seems counter-intuitive, enterprises’ usual responses to increases in TPE and TEPE are non-monotonic. Moreover, we find a threshold effect for the government’s green taxation. Blindly increasing or reducing taxes may not promote intelligent transformation, but instead force enterprises towards negative choices. Lastly, an effective measure for the government to promote the intelligent transformation of manufacturing enterprises is proposed: by properly adjusting TPE and TEPE, governments can produce more cost-effective intelligent products than ordinary ones. Consequently, intelligent products will sell better than ordinary products, and manufacturing enterprises will be able to consciously carry out intelligent transformation to remain viable.

1. Introduction

With the integration and development of the traditional manufacturing industry with 5G, artificial intelligence, and other next-generation information technologies, the intelligent transformation of the traditional manufacturing industry for the sustainable development of enterprises has become a field of great research interest [1,2,3]. For example, Sany Heavy Industry Co., Ltd. (Changsha, Hunan, China) established an intelligent monitoring and data analysis platform—the Enterprise Control Center—by continuously increasing investment in technology research and development and technological innovation. Through the interconnection of production equipment and intelligent monitoring, real-time remote monitoring enabled the enterprise to increase the operating rate by 10%, increase the utilization rate by more than 50%, reduce the defect rate by 14%, and reduce the consumption of heat, gasoline, diesel, and electricity. However, many small- and medium-sized enterprises refuse to carry out intelligent transformation, mainly because of the high cost and risk of intelligent transformation, which hinders many enterprises from transformation [4]. Although many studies have shown that government subsidies for technological innovation can facilitate intelligent transformation, a key question arises as to whether government financial subsidies can cover the cost of intelligent transformation [5,6,7,8]. In addition to financial subsidies, the government should take further measures, such as environmental regimes [9,10], to facilitate the intelligent transformation of enterprises.
Based on the above analysis, it is clear that the government is an integral part of the intelligent transformation of enterprises. Among the many government policies that promote the intelligent transformation of enterprises, environmental policies and financial subsidies play an important role [11,12,13]. Some governments have adopted financial subsidies to stimulate enterprises towards intelligent transformation. Currently, technology innovation subsidies (TIS) and technological innovation awards (TIW) are the two most important forms of government financial subsidies. TIS means that the government subsidizes a certain percentage of the actual investment of the enterprise for the implementation of technological innovation [14,15]. For example, Henan Province in China provides an ex post facto subsidy of 30% of the actual investment in equipment and R&D for technological innovation demonstration projects. TIW is a government incentive for companies to innovate based on the results of their technological innovation [16]. For example, Henan Province offers a matching bonus of up to RMB 0.3 million for first-time certified high-tech enterprises and up to RMB 3 million for newly approved national major innovation platform carriers. In addition to the aforementioned financial subsidies, the government also uses the environmental system to promote the intelligent transformation of enterprises, and green taxation has become the main tool of the government. The government uses the principle of tax leverage to increase the tax cost of high resource consumption and environmental pollution to compel enterprises to improve their intelligent technologies, reduce pollutant emissions, and help them transform their production. At present, the Tax of Pollutant Emissions (TPE), the Tax of Excess Pollutant Emissions (TEPE), and the Pollutant Emission Indicator Trading Mechanism (PEITM) are the main instruments of governmental green taxation. TPE is a tax on the exploitation, pollution, and damage of environmental resources by entities and individuals [17,18]. The government sets emission standards for pollutants and collects TPE within the standards and collects TEPE from outside the standards (Fullerton 2017) [19]. PEITM is an effective approach to introducing the market mechanism into environmental protection through the premise of the paid use of the environment, by approving the total amount of emissions in the region and establishing a trading market between supply and demand [20,21]. The general practice of PEITM is that a government agency assesses the maximum amount of pollutants that can be emitted in a certain area to meet the environmental capacity and divides the maximum allowed emissions into a number of emission shares, with each share being one emission right. In the primary market of emission rights, the government offers the emission rights to the emitters for a fee by certain means, such as bidding, auctioning, etc. After purchasing the emission rights, the discharger can buy or sell the emission rights in the secondary market according to the usage.
Although government initiatives such as TIS, TIW, TPE, TEPE, and PEITM can facilitate intelligent transformation, their effects may be diverse. There has been a substantial amount of literature that has examined the impact of different government initiatives on the intelligent transformation of enterprises [22,23]. However, there are still several problems that require solving: according to the characteristics of enterprise production, enterprises are classified as light, medium, and heavy polluters; therefore, (1) how can the government formulate the optimal financial subsidy scheme and taxation strategy for different types of enterprises? (2) How can green taxation facilitate the intelligent transformation of enterprises? (3) How do green tax strategies affect government financial subsidy programs? From the perspective of government policymaking, it is important to understand the effectiveness of green taxation strategies and financial subsidy programs on the intelligent transformation process of different types of enterprises. This will help to determine which green tax strategies and financial subsidy programs are most effective in ensuring further intelligent transformation for different types of enterprises.
In this study, we propose a three-level game model for the interaction between government, intelligent and non-intelligent transforming firms, and consumers in a competitive environment. In this approach, the government acts as a leader to maximize social welfare by setting the level of financial subsidies and green tax rates. Government subsidies and green taxes will influence the intelligent transformation and pricing decisions of intelligent transformation companies, the pricing decisions of non-intelligent transformation companies, and the purchasing decisions of consumers. These decisions—of manufacturing firms and consumers—will, in turn, influence the government’s choice of subsidy programs and taxation strategies. This study provides theoretical support for the government’s decision-making process to determine subsidy schemes and taxation strategies for different types of enterprises with the goal of maximizing social welfare. The main contributions of the work are as follows:
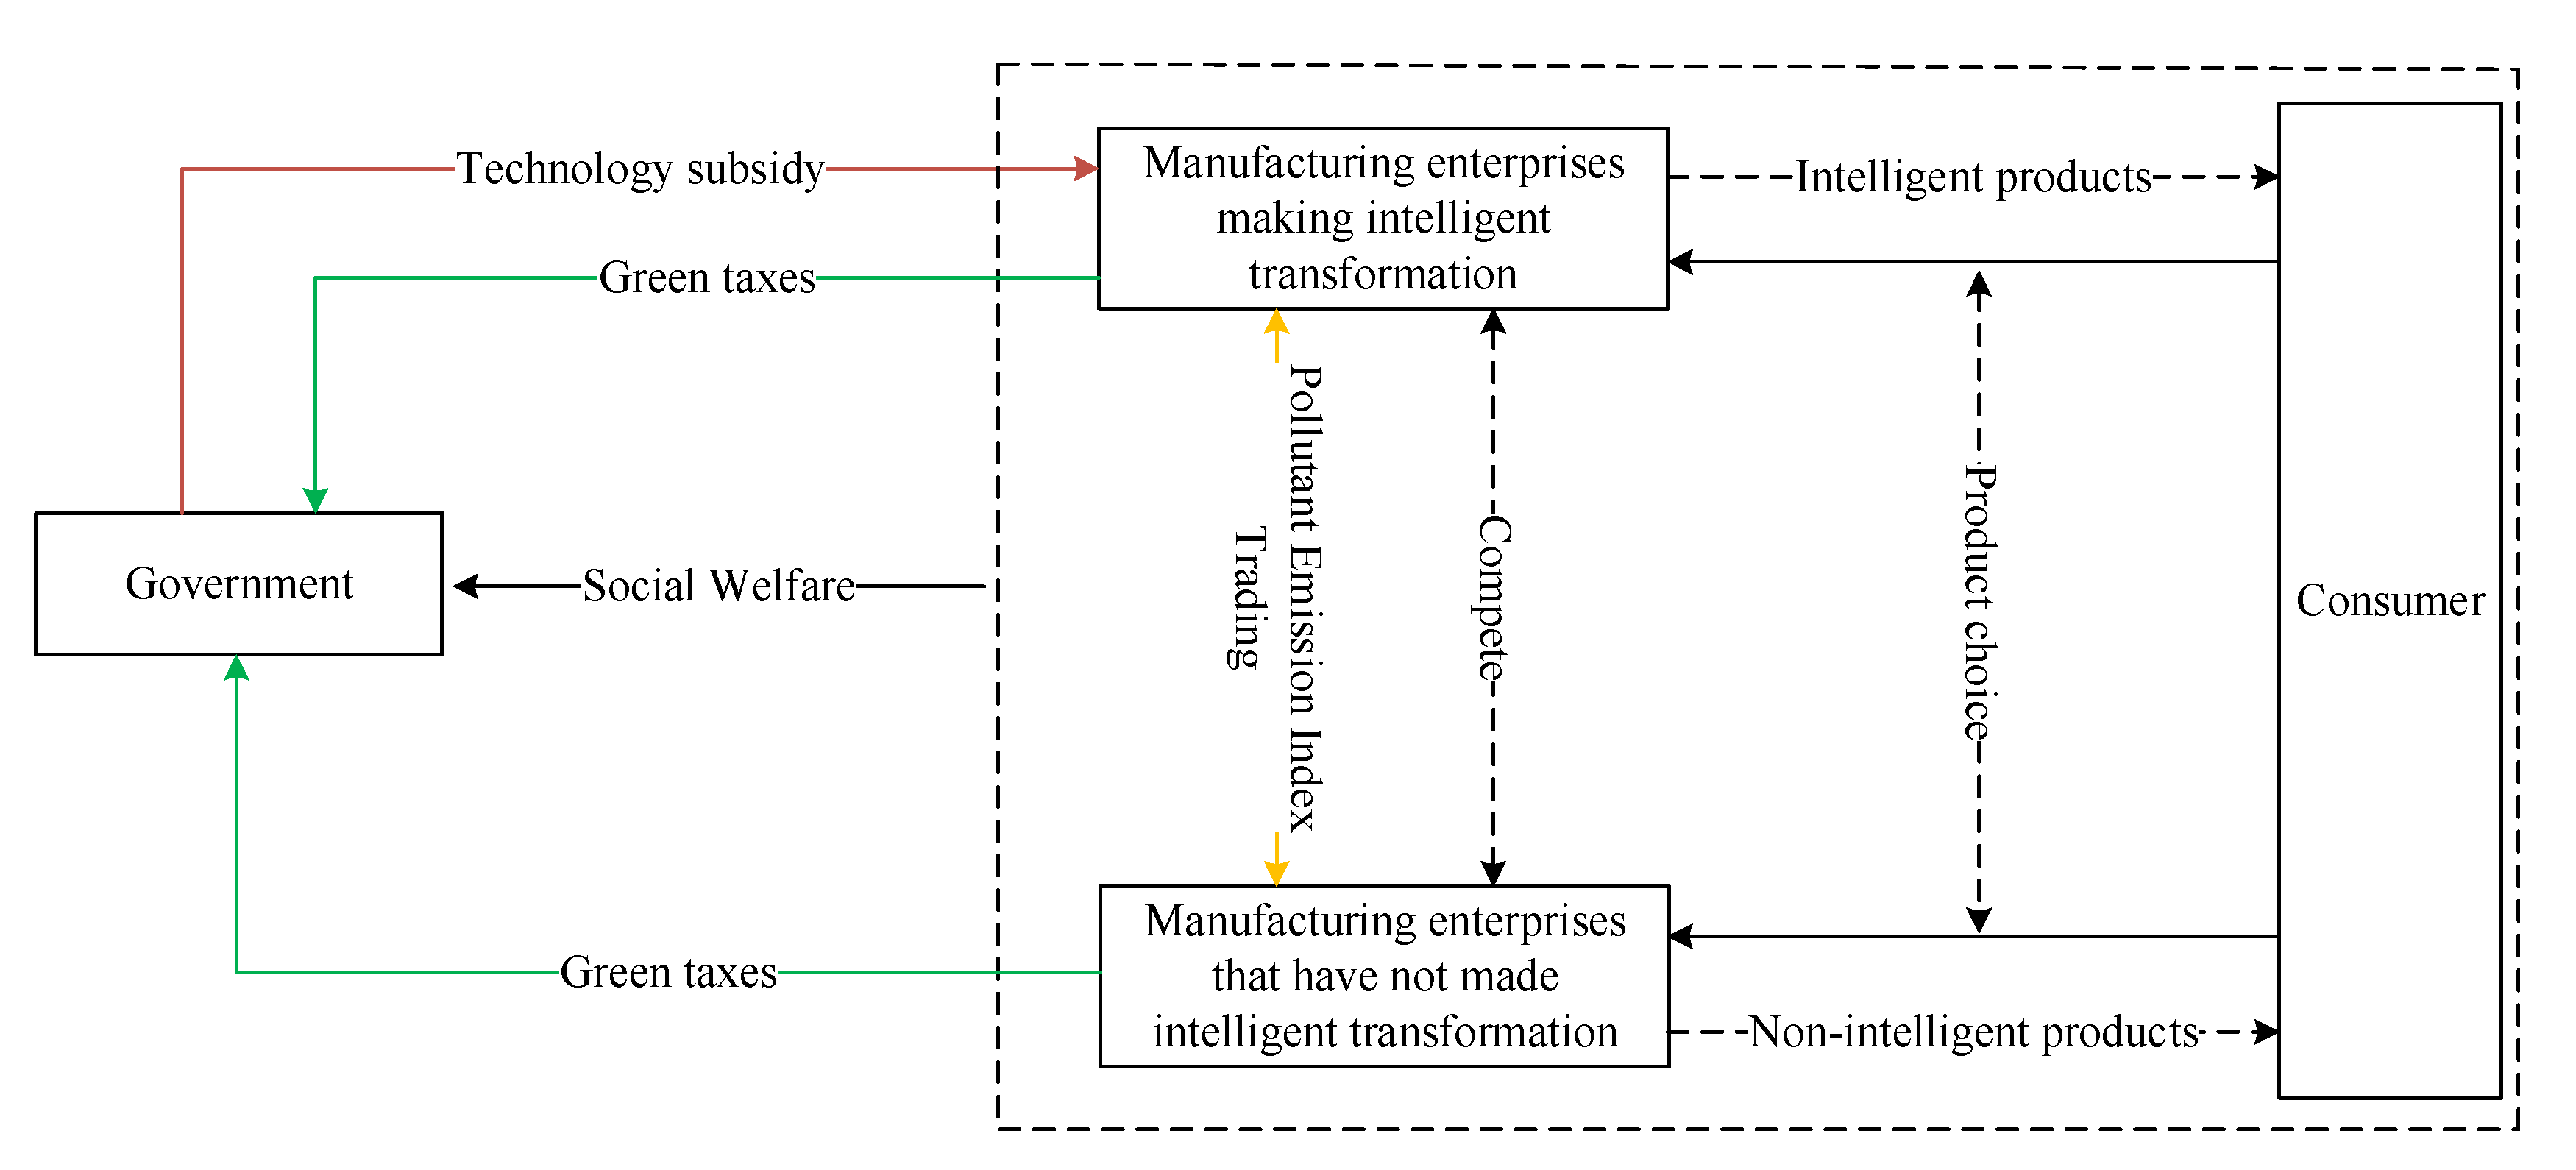
  • We proposed the PEITM, by which the government establishes legal rights to pollutant emissions and gives such rights the property of a commodity that can be bought and sold to achieve the control of pollutant emissions. Thus, the pollution emissions charge has been changed from a single pollutant emissions charge to pollutant emissions charges that can coexist with excess pollutant emissions charges. Green taxes are consequently divided into TPE and TEPE.
  • We designed the tax rate threshold according to principle of tax leverage, which leads to a threshold effect of the government’s green taxation, by which an effective measure for the government to promote the intelligent transformation of manufacturing enterprises can be proposed.
  • The work provides a theoretical basis for the government to formulate reasonable tax policies for different types of polluting enterprises. Manufacturing enterprises with high energy consumption and high pollution will receive more obvious incentive effects for intelligent transformation.
The remainder of the paper is organized as follows. Section 2 provides a literature review. Section 3 presents three subsidy schemes. Section 4 presents three subsidy schemes and constructs a game model. Section 5 analyses the optimal decision of the three subsidy schemes. Section 6 analyzes the optimal government green taxes scheme. Section 7 discusses the policy enlightenment of this research and Section 8 concludes. All evidence from this study is available in the Appendix A and Appendix B.

2. Literature Review

This research is largely inspired by previous studies on government financial subsidies and green taxes to promote the intelligent transformation of enterprises. These studies are briefly reviewed below.

2.1. Literature on Green Tax

In the field of green taxes, the stimulating effect of green taxes can have a chain effect through a change in the way companies produce. Green taxation, also known as environmental taxation, takes its prototype from the externality theory proposed by Marshall. Chiroleu et al. (2014) clarified that green taxes should include sewage charges and all taxes with a greening effect [24]. Matsukawa et al. (2012) considered green taxes to be the total amount of taxes to solve the social problems caused by environmental pollution [25]. Studies related to green taxation have focused on environmental effects and economic effects. Kuralbayeva et al. (2019) found that green taxes can significantly suppress carbon emissions in China but with significant regional heterogeneity. The inclusion of energy-saving and emissions reduction measures in the assessment system can further leverage the environmental effects of green taxes [26]. Loomis et al. (2008) argued that the abolition of emissions fees and the introduction of environmental taxes may lead to conflicting objectives of government, environmental protection, taxation, and other regulatory authorities, which may hinder the implementation of the policy [27]. Some scholars have therefore broadened the study of the economic effects of green taxes to include the study of the economic effects of environmental regulations. Li et al. (2019) suggested that environmental regulations are positively correlated with economic growth and that long-term gains can compensate for short-term losses [28]. The role of green taxes on the green transformation of manufacturing has always been controversial. On the one hand, green taxes increase production costs and reduce corporate profits. However, on the other hand, appropriate tax policies can guide companies to green production, offsetting the negative effects of rising costs through productivity gains and the development of new markets. This is the battle between the so-called “crowding-out effect” and the “Porter effect”. Li et al. (2019) found that there is heterogeneity in the impact of environmental taxes on manufacturing industries. The introduction of an environmental protection tax may be detrimental to technological upgrading [29]. Hu et al. (2020) found that tax incentives for specific enterprises encouraged technological research and supported the green transformation [30].

2.2. Literature on Technology Subsidy

In the research on technology subsidies, government subsidies for technological innovation can be divided into two forms. The first is direct funding, which is arranged through the fiscal budget. The other is indirect funding, which includes various incentives such as taxation and government procurement. The related research is divided into three parts: (1) Government subsidies have an incentive effect on technological innovation. The literature on this part argues that subsidies can promote enterprises to carry out more R&D activities. Wu et al. (2021) argued that government R&D subsidies are positively related to enterprises’ R&D investment. Sufficient non-R&D subsidies can effectively strengthen the incentive effect of R&D subsidies on enterprises’ R&D investment. In addition, R&D subsidies can promote firms’ innovation output through direct and indirect channels [31]. Jia et al. (2021) conducted a least-squares analysis using Stata16 software and showed that Chinese Government R&D subsidies have a significant incentive effect on enterprises’ investment in technological innovation [32]. Klette and Moen argued that R&D activities have typical externalities. That is, the knowledge spillover R&D activities generated by enterprises will enable other enterprises, including competitors, to acquire knowledge-sharing and innovation capabilities [33]. (2) Mixed effects. Yi et al. (2021) used the Ministry of Science and Technology’s database of innovation-oriented enterprises to study Chinese high-tech enterprises and found an inverted U relationship between R&D subsidies and innovation performance. The high dependence on government resources, as evidenced by the high proportion of R&D expenditures from government subsidies, diverted the attentional resources of recipient enterprises and led to lower innovation performance [34]. Yang et al. (2019) constructed a panel threshold effect model to examine the threshold effect of government subsidies on renewable energy investments. They further explored the effects and differences between the type of government subsidies and firm size [35]. (3) Crowding-out effect. If government R&D policies do not have the desired policy effect, they cannot provide incentives for enterprises to engage in substantial technological innovation. Jiang et al. found that when enterprises receive more government subsidies, the technological innovation promotion effect of enterprises is inhibited [36].

2.3. The Position of This Study

There is growing interest in the impact of government subsidies and green taxes on the intelligent transformation and innovation of firms. However, these studies have yet to reach a uniform conclusion. A review of the relevant literature reveals that scholars have mainly studied the impact of government subsidies or green taxes on the intelligent transformation of enterprises from a single perspective [37,38,39,40,41,42,43]. Few scholars have combined the two studies of government subsidies and green taxes. In addition, most of the studies on green taxation do not distinguish between TPE and TEPE, and most of the studies do not introduce PEITM. In addition, most of the studies only focus on certain types of enterprises and do not classify the enterprises according to the type of pollution.
The purpose of this study is to examine the interactions between government, intelligent transformation companies, non-intelligent transformation companies, and consumers in order to help governments make the best choices for green tax programs and technology subsidy programs. In this study, we classify Chinese manufacturing enterprises as light, medium, and heavy polluters according to the characteristics of the industry. Moreover, in this study, the synergistic mechanisms of TIS, TPE, TEPE, and PEITM are explored to assist the government in designing a reasonable green tax policy to promote the intelligent transformation of enterprises. This paper constructs a theoretical framework for using government tax leverage to promote the intelligent transformation of enterprises and uses it to clarify the relationship between government subsidies, green taxes, and the intelligent transformation of enterprises.

3. Path Selection for Transformation of Chinese Manufacturing Enterprises

3.1. TIS for Transformation of Enterprises

In the intelligent transformation of manufacturing enterprises, the biggest shortcoming, in the Chinese context, is the lack of awareness and motivation of technological innovation in manufacturing enterprises. Achieving technological innovation is a long-cycle, high-investment project, and therefore, many manufacturing enterprises in China usually choose to import technology from other enterprises to achieve development. Although the above-mentioned development model of manufacturing enterprises can help achieve economic growth in the short term, this development model is unsustainable and will cause problems such as low overall product quality, shortage of core production technologies, and low-level simple repetition of manufacturing processes, making it difficult for Chinese manufacturers to enter the high-end manufacturing field with high technology content, high added value, and strong competitiveness. In today’s large-scale and socialized technology R&D, high-tech and product R&D is characterized by large-scale high R&D costs, and many professional talents are required, which makes enterprises bear high risks. Therefore, according to the development needs of manufacturing enterprises and China’s economic development strategy, the government needs to influence manufacturing enterprises to engage in technological innovation through technology subsidies and reduce the risk of technological innovation in order to promote technological progress and the transformation of manufacturing enterprises. Currently, the Chinese government has supported—via subsidies—some technological innovations. For example, from 2005 to 2008, the financial resources of the Autonomous Region amounted to RMB 100.39 million, supporting 115 projects.

3.2. Market-Oriented PEITM for Transformation of Enterprises

The core idea of PEITM is that the government establishes legal rights to pollutant emissions and gives such rights the property of a commodity that can be bought and sold to achieve the control of pollutant emissions. The manufacturing enterprises decide whether to buy or sell the pollutant emissions indicators on their own based on the needs of enterprise development. Because the government sets overall pollutant emissions targets to meet environmental requirements, no matter how said emissions indicators are traded among manufacturing enterprises, they will not lead to a decline in environmental quality. By establishing a market-based trading mechanism, improvements in the trading mechanism of energy use rights, pollutant emissions rights, innovating mechanisms of paid use, budget management, investment and financing, cultivating and developing the trading market, economically stimulating manufacturing enterprises to pursue product structure upgrades, and improving the technology initiative development of manufacturing enterprises can lead to the realization of the intelligent transformation of manufacturing industries.

3.3. Green Tax System for Sustainable Development in China

As an important system of environmental management in China, pollutant emissions charges have played a positive role in promoting the control of emission units, raising funds for pollution control, and strengthening environmental protection efforts. With the development of China’s social economy, the existing pollutant emissions charges system can no longer meet the needs of reducing the total amount of pollutant emissions and improving environmental quality. According to the Law of the People’s Republic of China on the Prevention and Control of Water Pollution, the Law of the People’s Republic of China on the Prevention and Control of Air Pollution, and other relevant laws on environmental protection, the pollution emissions charge has been changed from a single pollutant emissions charge to pollutant emissions charges that can coexist with excess pollutant emissions charges.
Although China currently does not have an environmental tax in the legal sense, since the tax-sharing system in 1994, China’s environmental-related tax revenue has continued to increase. In 2007, it was estimated at about RMB 529 billion, which has laid the foundation for the implementation of environmental taxes to prevent ecological destruction and environmental pollution. It is worth noting that since 2000, China’s tax revenues, which are closely related to the environment, such as resource tax, consumption tax, and urban construction tax, have grown rapidly. The proportion of total tax revenue has been around 11%, accounting for the total national income, and this proportion has continued to increase. In 2002, the proportion was 1.7%, and in 2007, the proportion rose to 2.14%. In the mid-1990s, environmental tax revenue in OECD countries accounted for 2–3% of each country’s GDP. The environmental tax revenue of countries with higher proportions such as Denmark, Czech Republic, Finland, and others accounted for more than 3% of GDP; the U.S. is lower, at about 1%. It can be seen from the perspective of resources and the environment that China’s current tax system is close to the level of OECD countries in the mid-1990s in terms of income. This shows that China’s current tax system has a “light green” foundation.
Through the above-mentioned problems in the intelligent transformation of Chinese manufacturing enterprises, this paper considers the trading rights of pollutant emissions indicators, the TPE, TIS, and TEPE, and establishes a game model for manufacturing enterprises to foster intelligent manufacturing.

4. Model

4.1. Event Sequence

In the case of duopoly, this paper establishes a Stackelberg game involving the government, intelligent transformation manufacturing enterprises and non-intelligent transformation manufacturing enterprises, and consumers as participants. Among them, the government, as the leader of the Stackelberg game, maximizes social welfare by formulating technology subsidies, green tax rates, and pollutant emissions trading indicators. Among them, the green taxes include TPE and TEPE. The manufacturers determine the degree of intelligence transformation (expressed as s > 0 ), the retail price of intelligent products (expressed as p S ), and the retail price of non-intelligent products (expressed as p N ). Then, consumers make purchasing decisions to meet their own needs. In Figure 1, the relationship between decision makers is illustrated. Below, we give the relevant variables of the model.
Model parameters
c : The marginal production cost of non-intelligent transformation enterprises.
After a manufacturing enterprise implements intelligent transformation, it can generally reduce internal costs while reducing the marginal external costs of production.
k : Cost reduction rate. After manufacturing enterprises through intelligent transformation, production costs are reduced to a certain extent.
β : R&D cost factor.
β ( s s 0 ) 2 : The cost of intelligent transformation of enterprises. The greater the degree of intelligent transformation of an enterprise, the more intelligent transformation costs the enterprise invests.
γ : Negative environmental impact per unit of production of non-intelligent transformation enterprises (environmental governance fees).
φ : The environmental improvement effect of the increase in the degree of unit intelligence transformation.
φ ( s s 0 ) d S : The reduction in the negative impact of production on the environment, after the intelligent transformation of the enterprise.
S p : The enterprise gains income from the sale of unit pollutant emissions indicators.
μ : The influence coefficient of the sustainable development of the enterprise after the intelligent transformation of the enterprise.
g 0 : Pollutant emission standards set by the government.
σ : The TEPE rate. (Additional tax rates are outside the scope of pollutant emissions Standards g 0 .)
η : The government’s technology subsidies for enterprises undergoing intelligent transformation.
α : The TPE rate. (Tax rates within the scope of emissions standards g 0 .)
b : Consumer’s budget value for the product.
λ : The degree of enterprise intelligent transformation brings additional utility coefficients to users.
s : The degree of intelligence of the enterprise after the intelligent transformation.
s 0 : The initial degree of intelligence of the manufacturing enterprise.
p S : The products price of an intelligent transformation enterprise.
p N : The product prices of a non-intelligent transformation enterprise.
t : The travel cost or switching cost per unit distance.
x : Consumer location.

4.2. Consumer Utility

For consumers, products produced by intelligent transformation enterprises and non-intelligent transformation enterprises can be substituted; however, intelligent products can increase consumer satisfaction. Take Guangdong Xiaoxiong Electric Appliance Co., Ltd. (Foshan, China) as an example. The Bear Health Pot Household Multifunctional Boiling Teapot that the company produces can monitor the water temperature of the pot body in real time and adjust and automatically to keep water warm and reserve heating, among other functions. Compared with ordinary kettles, it not only meets the basic needs of consumers but also provides consumers an additional experience. Following many marketing and operations management studies, we use the Hotelling model to describe the difference between products produced by intelligently transformed enterprises and products produced by non-intelligently transformed enterprises in a duopoly environment. Potential consumers are evenly distributed along the Hotelling line, ranging from 0 to 1. The products of intelligent transformation enterprises are located at 0, and the products of non-intelligent transformation enterprises are located at 1. Therefore, the utility function for consumers to purchase products produced by intelligent transformation enterprises and products produced by non-intelligent transformation enterprises is as follows:
{ u S = b + λ ( s s 0 ) p S t x u N = b p N t ( 1 x )
When consumers buy products produced by intelligent transformation enterprises at x , the purchase price of t x will be incurred. Otherwise, if consumers buy the products of non-intelligent transformation enterprises at x , the price of t ( 1 x ) will be incurred.
Therefore, when u S = u N , we can obtain when consumers purchase products of intelligent transformation enterprises and the products of non-intelligent transformation enterprises; the position where there is no difference between the products of the intelligent transformation enterprises and the products of the non-intelligent enterprises is:
x * = 1 2 + 1 2 t [ λ ( s s 0 ) + p N p S ]
Therefore, in a duopoly environment, we can give consumers the demand function for purchasing products of intelligent transformation enterprises:
d S = 1 2 + 1 2 t [ λ ( s s 0 ) + p N p S ]
The demand function of consumers buying products from non-intelligent transformation enterprises is:
d N = 1 d S = 1 2 1 2 t [ λ ( s s 0 ) + p N p S ]
When consumers buy products from intelligent transformation enterprises, the utility to consumers is:
U S = 0 x * u S d x = [ b + λ ( s s 0 ) p S ] x * 1 2 t ( x * ) 2
When consumers buy products from non-intelligent transformation enterprises, the utility to consumers is:
U N = x * 1 u N d x = b p N t 2 ( b p N t ) x * 1 2 t ( x * ) 2
This paper classifies polluting enterprises as (1) slightly polluting enterprises—the enterprise’s pollutant emissions are less than g 0 ; (2) moderately polluting enterprises—manufacturing enterprise’s pollutant emissions are higher than g 0 , but they can meet their emissions requirements by purchasing pollutant emissions indicators; and (3) severely polluting enterprises—manufacturing enterprise’s pollutant emissions are higher than g 0 , and the purchase of pollutant emissions indicators cannot meet the needs of the enterprise. According to the relationship between the pollutant emissions of the manufacturing enterprises and the maximum pollutant emissions g 0 specified by the government, we established six models for the manufacturing enterprises and the government. Manufacturing enterprise 1 undergoes intelligent transformation; enterprise 2 does not undergo intelligent transformation.

4.3. The utility of the Government and Manufacturing Enterprises

Model 1: When γ d N < g 0 , [ γ φ ( s s 0 ) ] d S < g 0 , that is, the pollutant emissions of manufacturing enterprise 1 is lower than g 0 , and the pollutant emissions of manufacturing enterprise 2 is lower than g 0 .
The revenues of manufacturing enterprise 1 and manufacturing enterprise 2 are:
π S = [ p S c + k ( s s 0 ) ] d s β ( s s 0 ) 2 + η β ( s s 0 ) 2 + μ ( s s 0 ) α [ γ φ ( s s 0 ) ] d S
π N = ( p N c ) d N α γ d N
where p S c + k ( s s 0 ) and ( p N c ) represent the unit product revenue of manufacturing enterprise 1 and manufacturing enterprise 2, respectively. β ( s s 0 ) 2 represents the cost of intelligent transformation of manufacturing enterprise 1. η β ( s s 0 ) 2 represents the government’s technology subsidy to manufacturing enterprise 1. μ ( s s 0 ) represents the benefits of the sustainable development of manufacturing enterprise 1 after the intelligent transformation of manufacturing enterprise 1. α [ γ φ ( s s 0 ) ] d S represents the pollution emission fee paid by manufacturing enterprise 1 after the intelligent transformation. α γ d N represents the pollution emission fee paid by manufacturing enterprise 2.
Government revenue:
The government’s revenue function is the total social welfare; that is, the total consumer utility, the sum of the revenues of the two producers, and the green taxes, minus the government’s subsidies for technological innovation and the pollution caused by the enterprise to the environment:
G = π S + π N + U S + U N η β ( s s 0 ) 2 + α γ d N + α [ γ φ ( s s 0 ) ] d s γ d N [ γ φ ( s s 0 ) ] d s
Model 2: When max { [ γ φ ( s s 0 ) ] d S , γ d N + [ γ φ ( s s 0 ) ] d S 2 } < g 0 < γ d N , that is, the pollutant emissions of manufacturing enterprise 1 is lower than g 0 , and the pollutant emissions of manufacturing enterprise 2 is higher than g 0 ; however, the pollutant emission indicators sold by enterprise 1 can meet the needs of enterprise 2 through market transactions.
The revenues of manufacturing enterprise 1 and manufacturing enterprise 2 are:
π S = [ p S c + k ( s s 0 ) ] d s β ( s s 0 ) 2 + η β ( s s 0 ) 2 + μ ( s s 0 ) α [ γ φ ( s s 0 ) ] d S + [ γ d N g 0 ] S p
π N = ( p N c ) d N α γ d N ( γ d N g 0 ) S p
Among them, [ γ d N g 0 ] S p represents the profit gained from the sale of pollutant emission indicators by manufacturing enterprise 1 to manufacturing enterprise 2 in the pollutant emission indicator transaction.
Government revenue:
The government’s revenue function is the same with model 1.
Model 3: When [ γ φ ( s s 0 ) ] d S < g 0 < min { γ d N , γ d N + [ γ φ ( s s 0 ) ] d S 2 } , that is, the pollutant emissions of manufacturing enterprise 1 is lower than g 0 , and the pollutant emissions of manufacturing enterprise 2 is higher than g 0 . However, the remaining pollutant emissions indicators of manufacturing enterprise 1 cannot meet the demand of manufacturing enterprise 2.
The revenues of manufacturing enterprise 1 and manufacturing enterprise 2 are:
π S = [ p S c + k ( s s 0 ) ] d s β ( s s 0 ) 2 + η β ( s s 0 ) 2 + μ ( s s 0 ) α [ γ φ ( s s 0 ) ] d S + [ g 0 [ γ φ ( s s 0 ) ] d s ] S p
π N = ( p N c ) d N α [ 2 g 0 [ γ φ ( s s 0 ) ] d S ] [ g 0 [ γ φ ( s s 0 ) ] d S ] S p [ γ d N 2 g 0 + [ γ φ ( s s 0 ) ] d S ] σ
Among them, [ g 0 [ γ φ ( s s 0 ) ] d s ] S p represents the profit gained from the sale of pollutant emission indicators by manufacturing enterprise 1 to manufacturing enterprise 2 in the pollutant emissions indicator transaction. [ γ d N 2 g 0 + [ γ φ ( s s 0 ) ] d S ] σ represents the excessive emissions fee charged by the government for manufacturing enterprise 2 due to excessive emissions. α [ 2 g 0 [ γ φ ( s s 0 ) ] d S ] represents the pollution emissions fee paid by the manufacturing enterprise 2 for the part that does not exceed the standard g 0 .
Government revenue:
The government’s revenue function is the total social welfare; that is, the total utility of consumers, the sum of the revenues of the two producers, the tax of Pollutant Emissions of enterprise 1and 2, the tax of Excess Pollutant Emissions of enterprise 2, minus the government’s subsidies for technological innovation and the pollution caused by enterprises to the environment:
G = π S + π N + U S + U N γ d N [ γ φ ( s s 0 ) ] d s η β ( s s 0 ) 2 + α [ γ φ ( s s 0 ) ] d s + α [ 2 g 0 [ γ φ ( s s 0 ) ] d S ] + σ [ γ d N 2 g 0 + [ γ φ ( s s 0 ) ] d S ]
Model 4: When max { γ d N , γ d N + [ γ φ ( s s 0 ) ] d S 2 } < g 0 < [ γ φ ( s s 0 ) ] d S , that is, the pollutant emissions of manufacturing enterprise 1 is higher than g 0 , and the pollutant emissions of manufacturing enterprise 2 is lower than g 0 . However, the remaining pollutant emissions indicators of manufacturing enterprise 2 can meet the demand of manufacturing enterprise 1.
The revenues of manufacturing enterprise 1 and manufacturing enterprise 2 are:
π S = [ p S c + k ( s s 0 ) ] d s β ( s s 0 ) 2 + η β ( s s 0 ) 2 + μ ( s s 0 ) α [ γ φ ( s s 0 ) ] d S [ [ γ φ ( s s 0 ) ] d s g 0 ] S p
π N = ( p N c ) d N α γ d N + [ [ γ φ ( s s 0 ) ] d S g 0 ] S p
Among them, [ [ γ φ ( s s 0 ) ] d s g 0 ] S p represents the profit obtained from the sale of pollutant emissions indicators by manufacturing enterprise 2 to manufacturing enterprise 1 in the pollutant emissions indicator transaction.
Government revenue:
The government’s revenue function is the same with model 1
Model 5: When γ d N < g 0 < min { γ d N + [ γ φ ( s s 0 ) ] d S 2 , [ γ φ ( s s 0 ) ] d S } , that is, the pollutant emissions of manufacturing enterprise 1 is higher than g 0 , and the pollutant emissions of manufacturing enterprise 2 is lower than g 0 . Moreover, the remaining emissions indicators of manufacturing enterprise 2 do not meet the demand of manufacturing enterprise 1.
The revenues of manufacturing enterprise 1 and manufacturing enterprise 2 are:
π S = [ p S c + k ( s s 0 ) ] d S β ( s s 0 ) 2 + η β ( s s 0 ) 2 + μ ( s s 0 ) α ( 2 g 0 γ d N ) ( g 0 γ d N ) S p [ [ γ φ ( s s 0 ) ] d S 2 g 0 + γ d N ] σ
π N = ( p N c ) d N α γ d N + ( g 0 γ d N ) S p
Among them, ( g 0 γ d N ) S p represents the profit obtained from the sale of pollutant emissions indicators by manufacturing enterprise 2 to manufacturing enterprise 1 in the pollutant emissions indicator transaction. α ( 2 g 0 γ d N ) represents the pollution emissions fee paid by manufacturing enterprise 1 for normal pollution emissions. [ [ γ φ ( s s 0 ) ] d S 2 g 0 + γ d N ] σ represents the pollution emissions fee paid by manufacturing enterprise 2 for excessive emissions.
Government revenue:
The government’s revenue function is the total social welfare; that is, the total utility of consumers, the sum of the revenues of the two producers, the tax of Pollutant Emissions of enterprise 1and 2, the tax of Excess Pollutant Emissions of enterprise 1, minus government subsidies for technological innovation and the environmental impact of enterprises pollution:
G = π S + π N + U S + U N γ d N [ γ φ ( s s 0 ) ] d S + α ( 2 g 0 γ d N ) + α γ d N + σ [ [ γ φ ( s s 0 ) ] d S 2 g 0 + γ d N ] η β ( s s 0 ) 2
Model 6: When [ γ φ ( s s 0 ) ] d S > g 0 , γ d N > g 0 , that is, the pollutant emissions of manufacturing enterprise 1 is higher than g 0 , and the pollutant emissions of manufacturing enterprise 2 is higher than g 0 .
The revenues of manufacturing enterprise 1 and manufacturing enterprise 2 are:
π S = [ p S c + k ( s s 0 ) ] d S β ( s s 0 ) 2 + η β ( s s 0 ) 2 + μ ( s s 0 ) α g 0 [ [ γ φ ( s s 0 ) ] d S g 0 ] σ
π N = ( p N c ) d N α g 0 ( γ d N g 0 ) σ
Among them, α g 0 represents the normal pollution emissions fee paid by manufacturing enterprise 1 and manufacturing enterprise 2. [ [ γ φ ( s s 0 ) ] d S g 0 ] σ represents the excessive emissions fee paid by manufacturing enterprise 1, and ( γ d N g 0 ) σ represents the excessive emissions fee paid by manufacturing enterprise 2.
Government revenue:
The government’s revenue function is the total social welfare; that is, the total utility of consumers, the sum of the revenues of the two producers, the tax of Pollutant Emissions of enterprise 1 and 2, the tax of Excess Pollutant Emissions of enterprise 1 and 2, minus government subsidies for technological innovation and the environmental impact of enterprises pollution:
G = π S + π N + U N + U S γ d N [ γ φ ( s s 0 ) ] d S η β ( s s 0 ) 2 + 2 α g 0 + σ ( γ d N g 0 ) + σ [ [ γ φ ( s s 0 ) ] d S g 0 ]

5. The Optimal Decision of the Three Subsidy Schemes

In the government’s technology subsidy program, the government first determines the technology subsidy level η for the intelligent transformation of manufacturing enterprise 1. Then, intelligent transformation enterprise 1 determines the degree of intelligent transformation ( s ) and product retail price ( p S ), and non-intelligent transformation manufacturing enterprise 2 determines its retail price ( p N ). By using the reverse induction method, the equilibrium solution in the government’s technology subsidy program is summarized in Table 1, Table 2, Table 3, Table 4, Table 5 and Table 6.
In the above optimal scheme, we can see that the government’s green taxes α , σ will affect the degree of the manufacturing enterprise’s intelligent transformation s , the government’s technological innovation subsidy η for the manufacturing enterprise, product prices p S and p N , and the market demands d S and d N . Next, we study the impact of the government’s green taxes on the transformation of manufacturing enterprises. Through the analysis of Table 1, Table 2, Table 3, Table 4, Table 5 and Table 6, we obtain the following theorem.

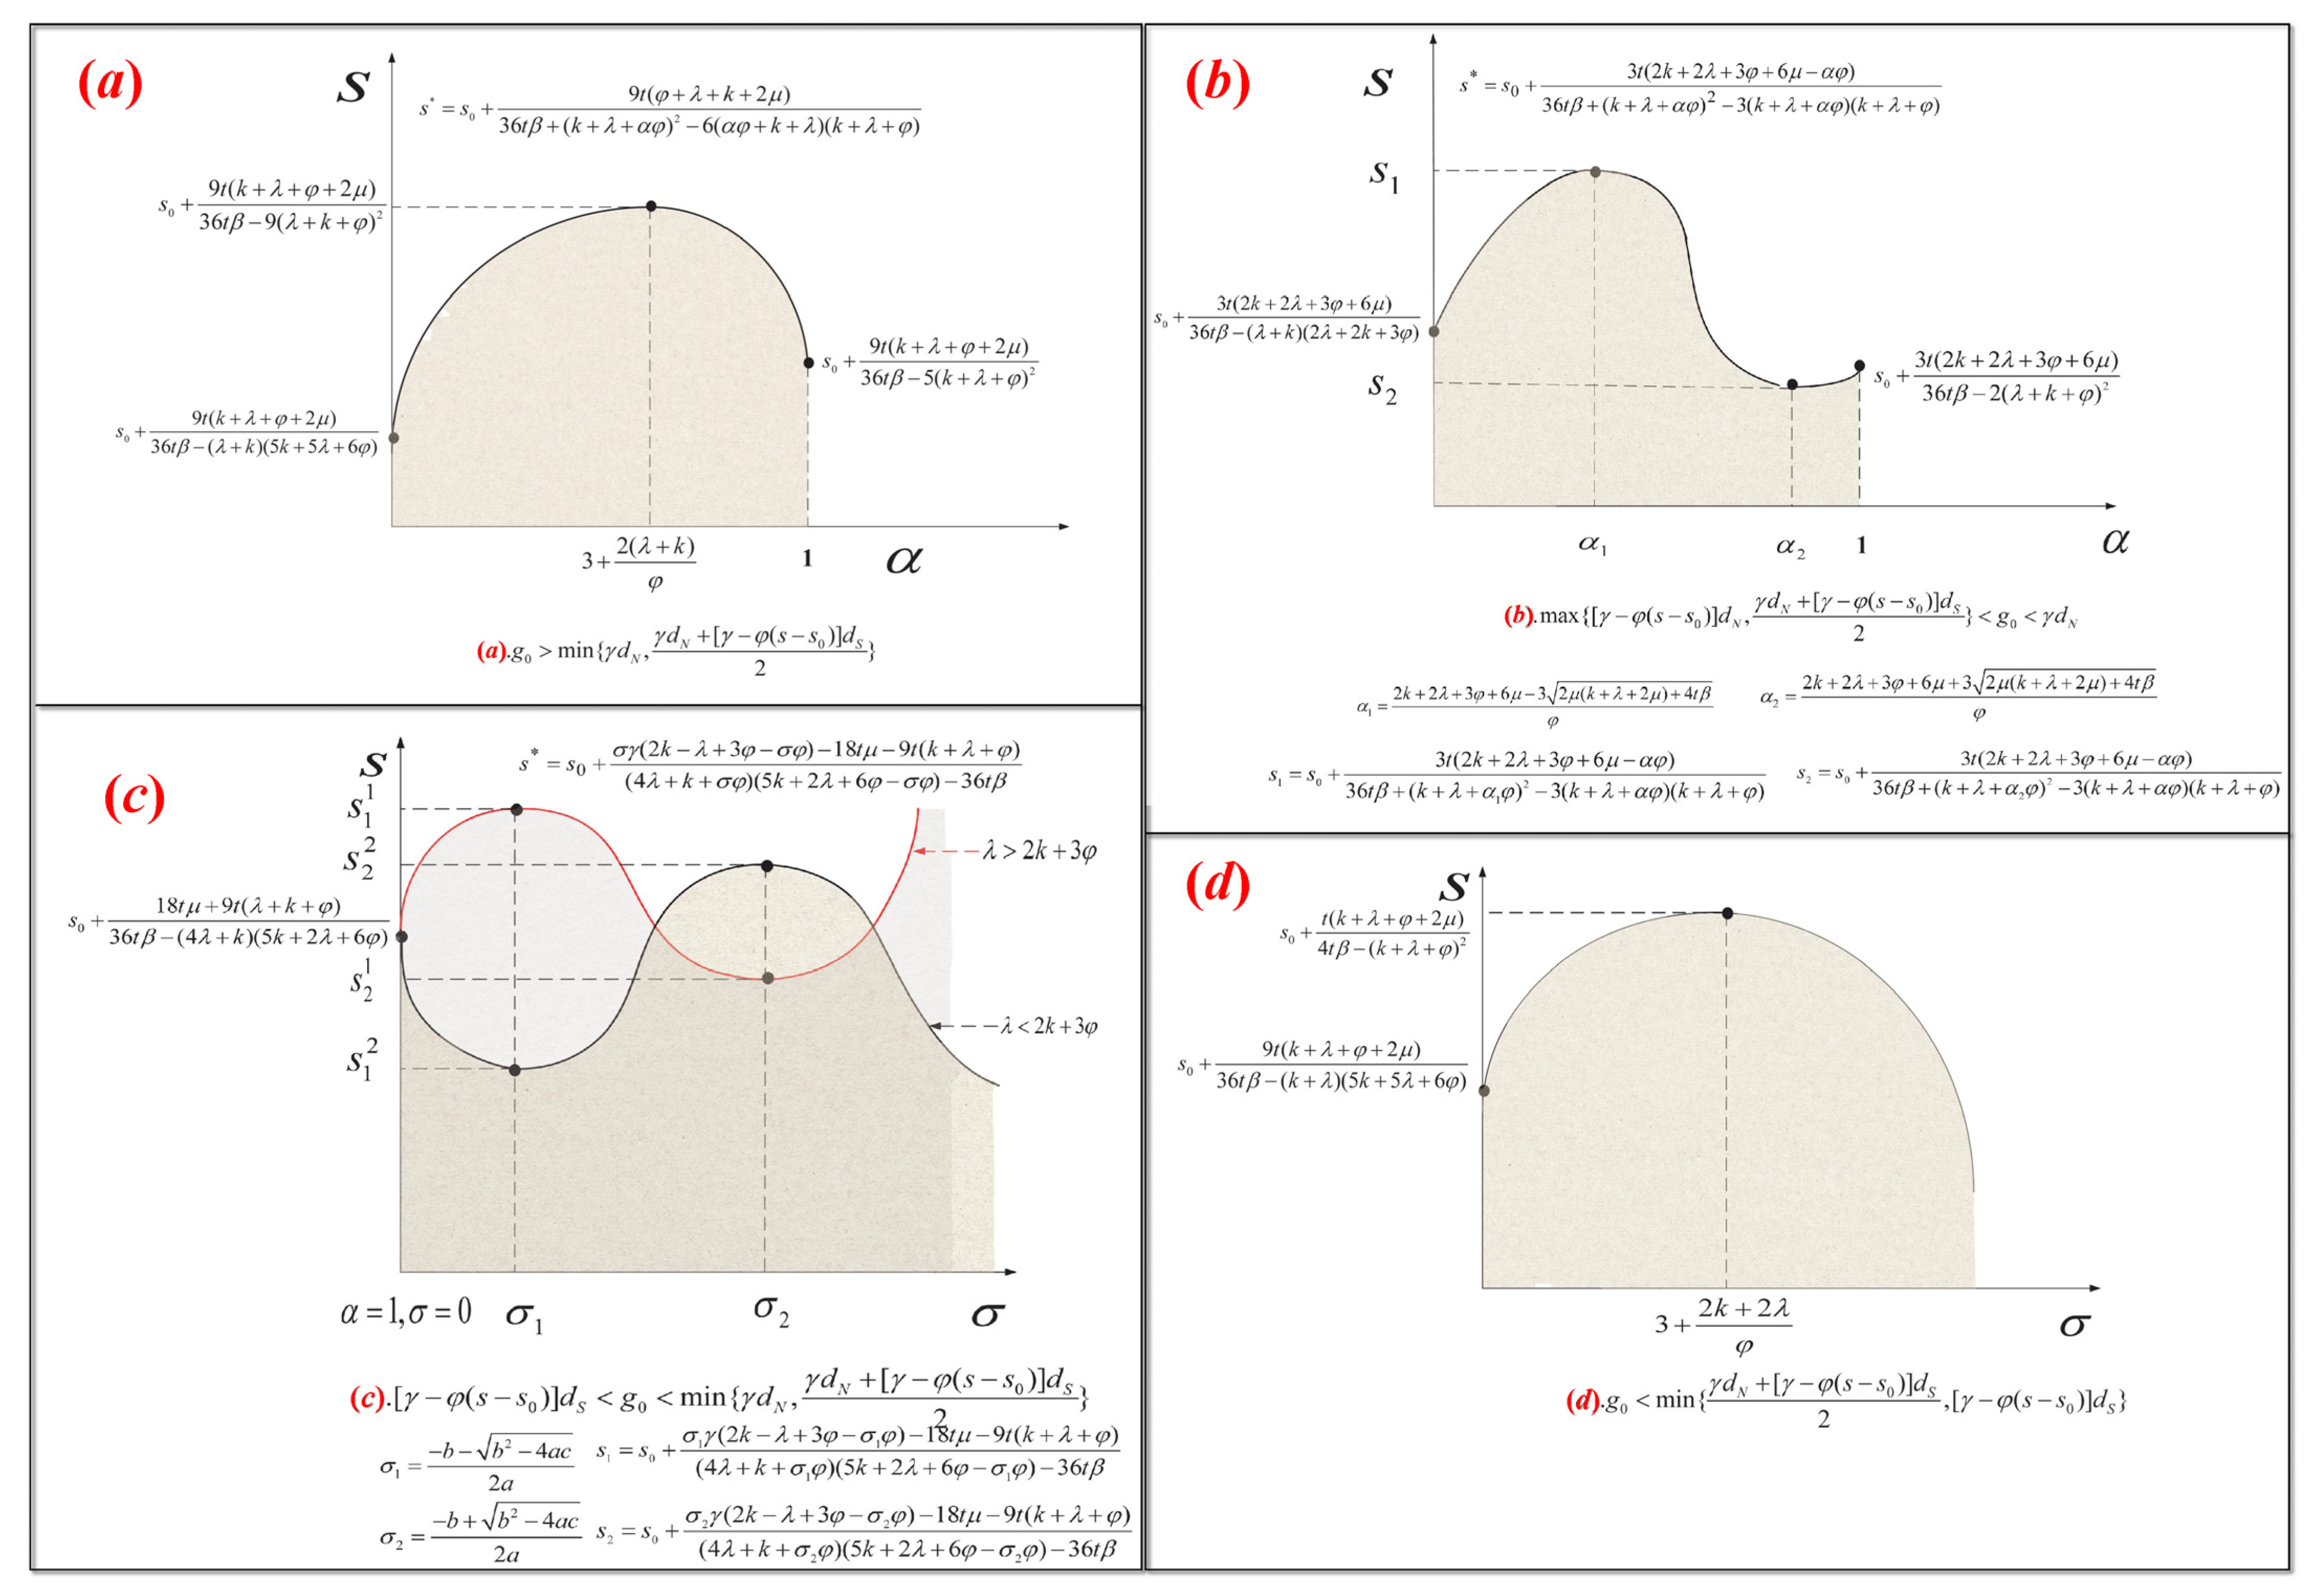
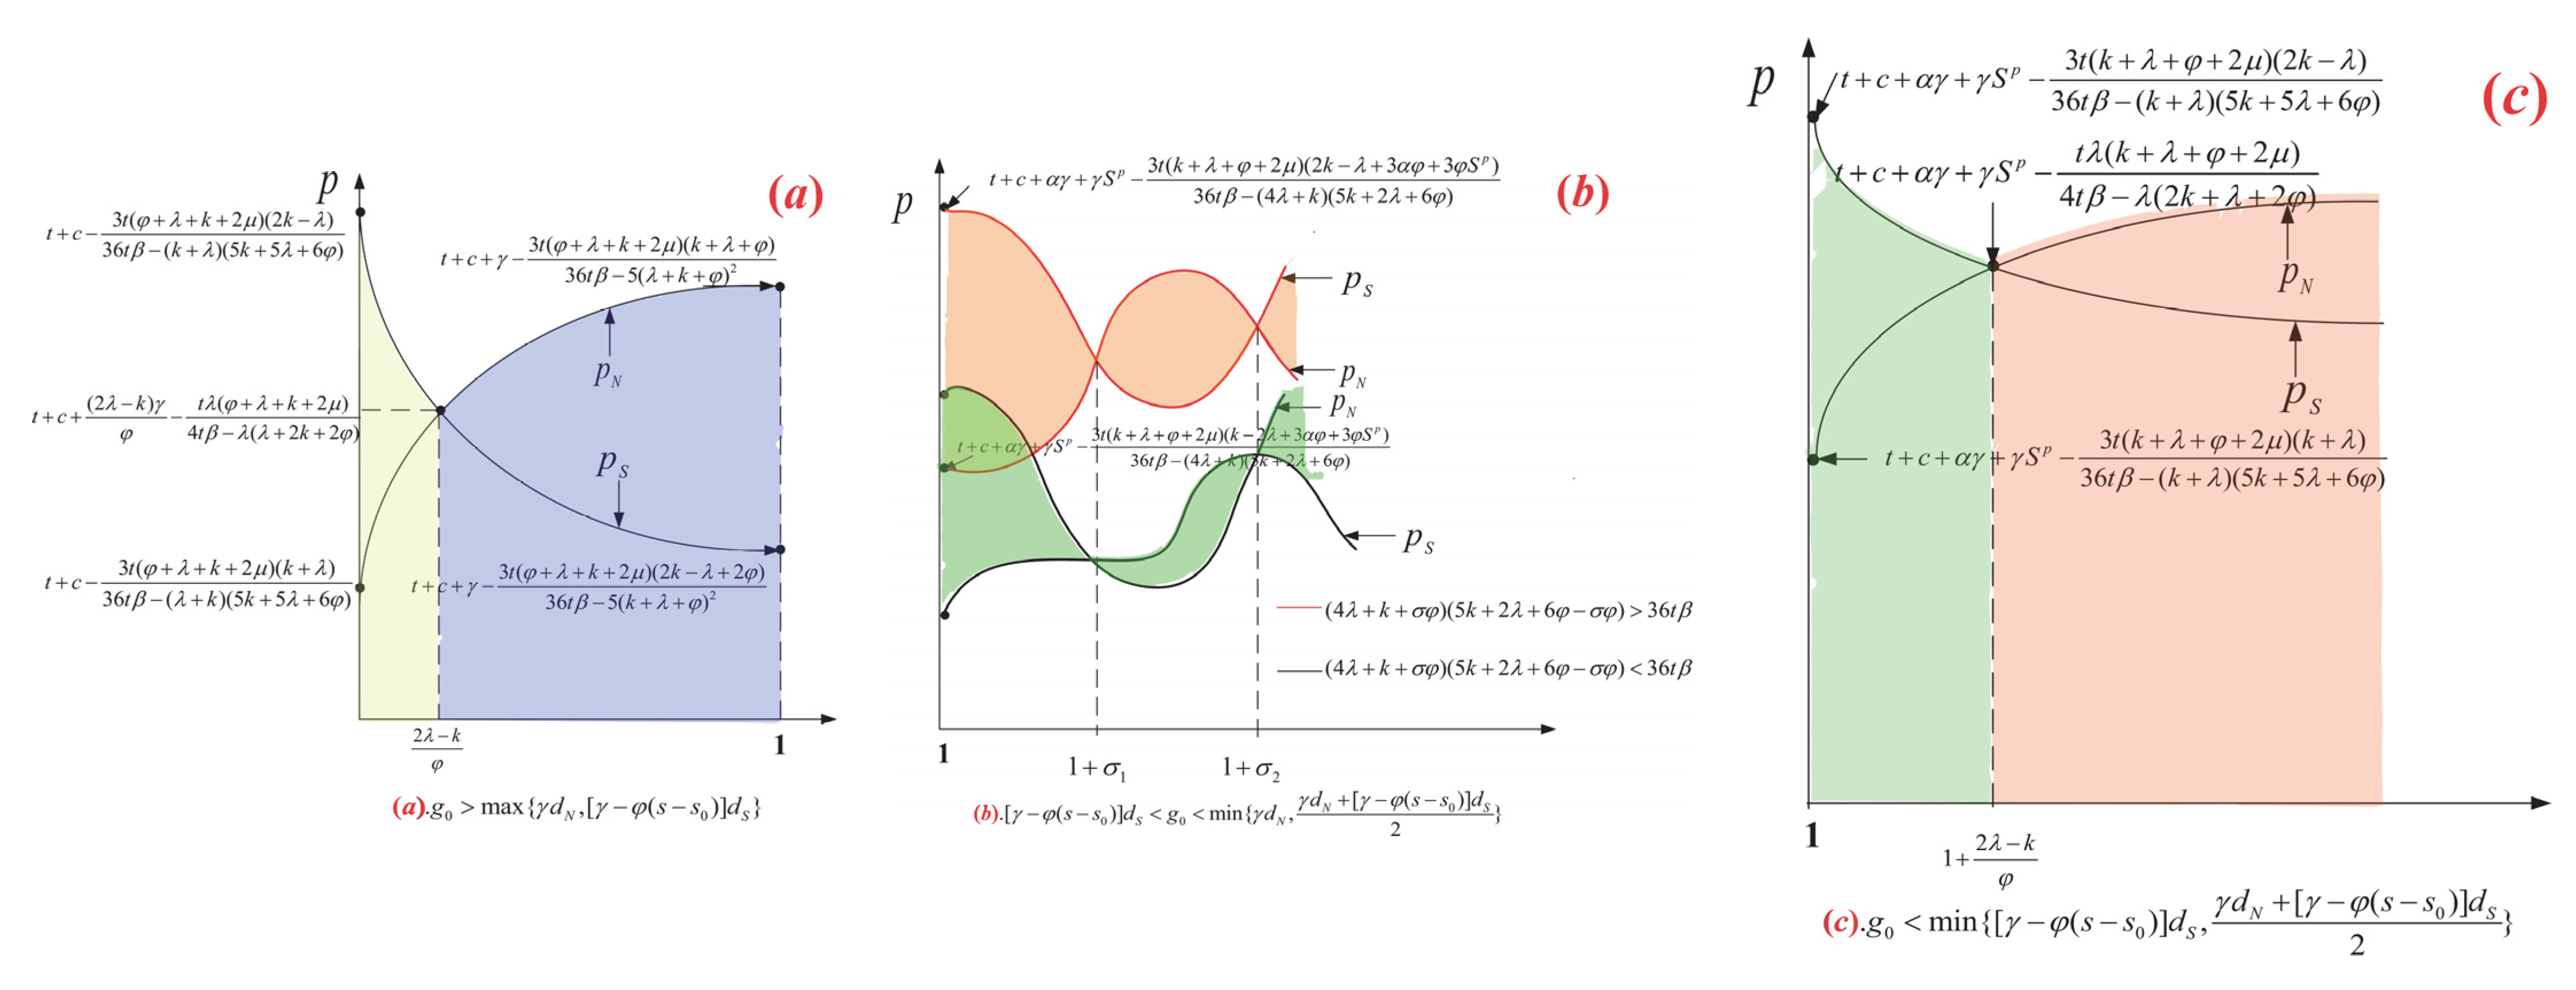
6. Optimal Government Green Taxes Scheme

Principle of Tax Leverage: Tax leverage refers to the function of adjusting the social and economic life of the state by adjusting the tax collection relationship and the distribution of benefits among taxpayers in accordance with the tax law.
Through the design of tax rates, the state can implement incentives or restrictive measures such as tax increases, tax reductions, tax exemptions, tax rebates, and stipulated thresholds to enable taxpayers to make production-, operation-, and consumption-related decisions consistent with the national economic development plan. The use of tax leverage can compensate and correct the shortcomings of the market mechanism and give full play to the positive role of the market mechanism.
Next, according to the principle of tax leverage, this article promotes the intelligent transformation of enterprises by adjusting the green tax rate. The high tax rate reflects the government’s intention to restrict the development of non-intelligent enterprises; the low tax rate reflects the government’s intention to encourage the development of enterprises. This paper uses the excess progressive tax rate to reflect the government’s policy of encouraging high-polluting enterprises to carry out intelligent transformation.

6.1. The Green Taxes Scheme of Lightly Polluting Enterprises and Moderately Polluting Enterprises

Theorem 1. 
When g 0 > min { γ d N , γ d N + [ γ φ ( s s 0 ) ] d S 2 } , if α > 3 + 2 ( k + λ ) φ ,
s ( α ) < s ( α 0 ) always holds, otherwise  s ( α ) s ( α 0 ) , and the government’s optimal tax rate is  α = 3 + 2 ( k + λ ) φ .
Theorem 1 and Figure 2a indicate that when lightly polluting enterprises choose to undergo intelligent transformation, or lightly polluting enterprises do not undergo intelligent transformation but moderately polluting enterprises undergo intelligent transformation, if the government’s pollutant emissions tax rate α satisfies α > 3 + 2 ( k + λ ) φ , at this time, the government should appropriately lower the tax rate α to promote the degree of intelligent transformation of lightly polluting enterprises. Conversely, if the government’s pollutant emissions tax rate α satisfies α < 3 + 2 ( k + λ ) φ , at this time, the government should appropriately raise the tax rate α to promote the degree of intelligent transformation of lightly polluting enterprises; the government’s optimal tax rate is α = 3 + 2 ( k + λ ) φ .
Through Theorem 1, this paper finds that when lightly polluting enterprises choose to undergo intelligent transformation, or lightly polluting enterprises do not undergo intelligent transformation, but moderately polluting enterprises undergo intelligent transformation, the government’s careless increase in the pollution emission tax rate reduces the motivation of enterprises to intelligently transform. When the government’s decision-making objects are lightly polluting enterprises—and these enterprises all choose to carry out intelligent transformation, or there are moderately polluting enterprises among the decision-making objects but moderately polluting enterprises choose to carry out intelligent transformation—no matter how the government raises the tax rate of pollution emission, the pollution cost paid by the enterprise does not differ too much from the cost of intelligent transformation. However, the ever-increasing tax rate will result in a reduction in government technology subsidies, leading to decreased opportunities for ordinary enterprises to transform into intelligent enterprises.
Theorem 2. 
When  max { [ γ φ ( s s 0 ) ] d S , γ d N + [ γ φ ( s s 0 ) ] d S 2 } < g 0 < γ d N , if 2 k + 2 λ + 3 φ + 6 μ 3 2 μ ( k + λ + 2 μ ) + 4 t β φ α 2 k + 2 λ + 3 φ + 6 μ + 3 2 μ ( k + λ + 2 μ ) + 4 t β φ , s ( α ) < s ( α 0 ) always holds, otherwise  s ( α ) s ( α 0 ) .
Theorem 2 and Figure 2b indicate that when the moderately polluting enterprises do not undergo intelligent transformation and the lightly polluting enterprises do undergo intelligent transformation, if the government’s pollutant emissions tax rate α satisfies:
2 k + 2 λ + 3 φ + 6 μ 3 2 μ ( k + λ + 2 μ ) + 4 t β φ α 2 k + 2 λ + 3 φ + 6 μ + 3 2 μ ( k + λ + 2 μ ) + 4 t β φ
The government should lower the tax rate α to promote the degree of intelligent transformation of lightly polluting enterprises. Conversely, if the government pollutant emissions tax rate α meets α > 2 k + 2 λ + 3 φ + 6 μ + 3 2 μ ( k + λ + 2 μ ) + 4 t β φ or α < 2 k + 2 λ + 3 φ + 6 μ 3 2 μ ( k + λ + 2 μ ) + 4 t β φ , the government should raise the tax rate α to promote the degree of intelligent transformation of lightly polluting enterprises.
Through Theorem 2, this paper finds that when moderately polluting enterprises do not undergo intelligent transformation and lightly polluting enterprises do undergo intelligent transformation, the government can increase the motivation for the intelligent transformation of moderately polluting enterprises by continuously increasing the tax rate. When the government’s decision-making objects—lightly polluting enterprises—choose to undergo intelligent transformation, and moderately polluting enterprises do not undergo intelligent transformation, the government raises the tax rate of pollution emission, making the pollution tax rate higher than MAC of intelligent transformation to achieve zero pollution emissions. Therefore, moderately polluting companies will continue to improve their motivation for intelligent transformation.
Theorem 3. 
 When  g 0 > max { γ d N , [ γ φ ( s s 0 ) ] d S } , if α > 2 λ k φ , p S < p N always holds.
Theorem 3 and Figure 3a indicate that to further promote the intelligent transformation of manufacturing enterprises, the government should adjust the pollutant emissions tax rate α to satisfy α > 2 λ k φ . Currently, the price of intelligent products is always lower than the price of ordinary products, that is, p S < p N .
Through Theorem 3, this paper finds that when continuously increasing the tax rate of pollution emissions, non-intelligent transformation enterprises will continuously increase the price of products to compensate for the loss caused by the increase in the tax rate. When a non-intelligent transformation enterprise pays more than the transformation cost of an intelligent transformation enterprise, the price of the intelligent product will be lower than the price of the non-intelligent product. Through price competition, the intelligent transformation enterprises can occupy more market shares; thereby, the government can achieve the purpose of promoting the intelligent transformation of enterprises.
From Figure 2, this paper finds that both the tax rate of pollution emission and the degree of intelligent transformation are non-monotonic. This non-monotonic relationship comes from the non-monotonicity between the cost advantage of intelligent transformation and the emission reduction. Once the tax rate of pollution emission is higher than the MAC for intelligent transformation to achieve zero pollution emissions, the relationship between the cost advantage and the diffusion rate and the tax rate is not significant.

6.2. The Research Object has Severely Polluting Enterprises

The price S p of the emission index transaction is determined by the market and is an endogenous variable. Therefore, the transaction price S p will be adjusted as the intelligent transformation promotes technological progress and the pollution emission volume changes. Since the emission index transaction mechanism has a small incentive effect on the intelligent transformation of enterprises, and this section involves the trading of emissions indicators, it is not discussed here.
Theorem 4. 
When additional utility coefficients λ satisfies:
(1)
When  λ > 2 k + 3 φ , if  b b 2 4 a c 2 a < σ < b + b 2 4 a c 2 a , s ( σ ) < s ( σ 0 ) always holds, otherwise  s ( σ ) s ( σ 0 ) .
(2)
When  λ < 2 k + 3 φ , if  b b 2 4 a c 2 a < σ < b + b 2 4 a c 2 a , s ( σ ) > s ( σ 0 ) always holds, otherwise s ( σ ) s ( σ 0 ) .
where:
a = φ 2 γ ( λ 2 k 3 φ )
b = 72 t β γ φ 2 γ φ ( 4 λ + k ) ( 5 k + 2 λ + 6 φ ) 18 t φ 2 ( k + λ + φ + 2 μ )
c = ( 4 λ + k ) ( 5 k + 2 λ + 6 φ ) ( 2 k λ + 3 φ ) γ + 9 t φ ( k + λ + φ + 2 μ ) ( 4 k 2 λ + 6 φ ) 36 t β γ ( 2 k λ + 3 φ )
Theorem 4 and Figure 2c indicate that when lightly polluting enterprises are pursuing intelligent transformation, severely polluting enterprises are not pursuing intelligent transformation. (1) When the additional utility λ brought by intelligent products to users is satisfied, λ > 2 k + 3 φ , and the government’s tax rate of excess pollutant emissions σ satisfies σ < b b 2 4 a c 2 a or σ > b + b 2 4 a c 2 a , the government should raise the tax rate σ to promote the degree of intelligent transformation of lightly polluting enterprises. Conversely, if the government’s tax rate of excess pollutant emissions σ satisfies b b 2 4 a c 2 a < σ < b + b 2 4 a c 2 a , the government should lower the tax rate σ to promote the degree of intelligent transformation of lightly polluting enterprises. (2) When the additional utility λ brought by the intelligent product to the user satisfies λ < 2 k + 3 φ , and the government sets the pollutant emissions tax rate σ to satisfy b b 2 4 a c 2 a < σ < b + b 2 4 a c 2 a , the government should raise the tax rate σ to promote the degree of intelligent transformation of lightly polluting enterprises. Conversely, if the government’s tax rate of excess pollutant emissions σ satisfies σ < b b 2 4 a c 2 a or σ > b + b 2 4 a c 2 a , the government should lower the tax rate σ to promote the degree of intelligent transformation of lightly polluting enterprises.
From Theorem 4 and Figure 2c, we find that the degree of intelligent transformation of enterprises that brings additional utility coefficients to users λ affects the government’s formulation of the excess pollution emission tax. If λ is large, enterprises can obtain additional benefits if they carry out intelligent transformation. Therefore, when the government increases the excess pollution emission tax rate, the enterprise will gradually increase the degree of intelligent transformation. However, if λ is small, the enterprise can realize the additional benefits that the intelligent transformation cannot bring to the enterprise. Therefore, when the government continues to increase the excess pollution emission tax rate, the enterprise’s motivation for intelligent transformation will not only not increase but may even cause some enterprises to cease production. The results of the study show that there is uncertainty regarding the impact of strict taxation policies for excess pollution emission on intelligent transformation and that policies that are too strict will hinder the development of intelligent transformation. Although Theorems 2 and 4 both describe enterprises with low pollution levels to undergo intelligent transformations, enterprises with high pollution levels do not undergo intelligent transformations, and the green tax strategy taken by the government is different. The reason for this phenomenon is that the buffering effect of the PEITM and the impact of the additional utility of intelligent transformation products on consumers have led to changes in taxation strategies.
Theorem 5. 
When  g 0 < min { γ d N + [ γ φ ( s s 0 ) ] d S 2 , [ γ φ ( s s 0 ) ] d S } , if σ < 3 + 2 k + 2 λ φ , s ( σ ) > s ( σ 0 ) always holds, otherwise, s ( σ ) s ( σ 0 ) . In addition, the government’s optimal excess pollutant emissions tax rate is  σ = 3 + 2 ( k + λ ) φ .
Theorem 5 and Figure 2d indicate that when lightly polluting enterprises do not undergo intelligent transformation and severely polluting enterprises undergo intelligent transformation, or among severely polluting enterprises, when some enterprises choose to undergo intelligent transformation, if the excess pollutant emissions tax σ satisfies σ < 3 + 2 k + 2 λ φ , the government should raise the tax rate σ to promote the degree of intelligent transformation of severely polluting enterprises. Conversely, if the government’s excess pollution tax σ satisfies σ > 3 + 2 k + 2 λ φ , the government should lower the tax rate σ to promote the degree of intelligent transformation of severely polluting enterprises. In addition, the government’s optimal excess pollutant emissions tax rate is σ = 3 + 2 ( k + λ ) φ .
From Theorem 5, this paper finds that when lightly polluting enterprises do not undergo intelligent transformation and severely polluting enterprises undergo intelligent transformation, or among severely polluting enterprises, when some enterprises choose to undergo intelligent transformation, to a certain extent, the government can effectively promote the intelligent transformation of heavily polluting enterprises by increasing the tax of excess polluting emissions. However, when the government’s tax rate of excess polluting emission is too high, due to the limited ability of the intelligent transformation to achieve emission reduction, it will cause heavily polluting enterprises to abandon transformation and stop production. Therefore, for the intelligent transformation of heavily polluting enterprises, it is necessary to set the excess pollution emission tax rate to meet σ = 3 + 2 k + 2 λ φ , and help the government to achieve the greatest degree of promotion for the intelligent transformation of enterprises.
Theorem 6. 
When  [ γ φ ( s s 0 ) ] d S < g 0 < min { γ d N , γ d N + [ γ φ ( s s 0 ) ] d S 2 } , we have.
When  β < ( 4 λ + k + σ φ ) ( 5 k + 2 λ + 6 φ σ φ ) 36 t , if  u 1 u 1 2 4 u 2 2 σ u 1 + u 1 2 4 u 2 2 , p S < p N always holds.
When  β > ( 4 λ + k + σ φ ) ( 5 k + 2 λ + 6 φ σ φ ) 36 t , if σ u 1 u 1 2 4 u 2 2 or σ u 1 + u 1 2 4 u 2 2 , p S < p N always holds.
where:
u 1 = [ γ ( 4 λ + k ) ( 5 k + 2 λ + 6 φ ) 36 t β γ ( 2 k λ + 3 φ ) ( λ + k ) γ + 9 t φ ( λ + k + φ + 2 μ ) ] 3 ( k + φ ) φ γ
u 2 = 3 t ( k + λ + φ + 2 μ ) ( k + λ ) ( k + φ ) φ γ
Theorem 6 and Figure 3b indicate that when severely polluting enterprises choose not to undergo intelligent transformation and severely polluting enterprises choose to undergo intelligent transformation, to further promote the intelligent transformation of lightly polluting enterprises, if ( 4 λ + k + σ φ ) ( 5 k + 2 λ + 6 φ σ φ ) > 36 t β , the government should formulate a reasonable taxation strategy for excess pollutant emissions, so that σ satisfies u 1 u 1 2 4 u 2 2 σ u 1 + u 1 2 4 u 2 2 , the price of intelligent products is lower than the price of non-intelligent products p S * < p N * , and consumers tend to purchase intelligent products. Conversely, if ( 4 λ + k + σ φ ) ( 5 k + 2 λ + 6 φ σ φ ) < 36 t β , the government should formulate a taxation strategy for excess pollutant emissions so that the tax rate σ satisfies σ u 1 u 1 2 4 u 2 2 or σ u 1 + u 1 2 4 u 2 2 , the price of intelligent products is lower than the price of non-intelligent products p S * < p N * , and consumers tend to purchase intelligent products.
From Theorem 6, this paper finds that the cost of enterprise intelligent transformation β affects the formulation of government taxation policies for excess polluting emission and the price of products. When the cost of enterprise intelligent transformation β is low, the government does not need to set a higher tax rate for excess polluting emissions and the price of non-intelligent transformation enterprise products can be higher than the price of intelligent transformation products. However, when the cost β of the intelligent transformation of the enterprise is high, the government must continuously increase the tax rate of excess pollution emissions, so that the increased fee—of excess pollution emissions—paid by the non-intelligent transformation enterprise is greater than the transformation cost of the intelligent transformation enterprise. The price of intelligent products will be lower than that of non-intelligent products. Through price competition, intelligent transformation enterprises can occupy more market share, and then achieve the purpose of promoting the intelligent transformation of enterprises.
Theorem 7. 
 When g 0 < min { γ d N + [ γ φ ( s s 0 ) ] d S 2 , [ γ φ ( s s 0 ) ] d S } , if  σ > 2 λ k φ , p S < p N always holds.
Theorem 7 and Figure 3c indicate that when severely polluting enterprises choose to undergo intelligent transformation and lightly polluting enterprises choose not to undergo intelligent transformation, or in severely polluting enterprises, when some enterprises undergo intelligent transformation, to further promote the intelligent transformation of lightly polluting enterprises, the government should formulate a taxation strategy for excess pollutant emissions σ to satisfy σ > 2 λ k φ , the price of intelligent products is lower than that of non-intelligent products p S * < p N * , and consumers tend to purchase intelligent products.
From Theorem 7, this paper finds that when the government continuously increases the excess pollution tax rate, non-intelligent transformation enterprises will continue to increase the price of their products to compensate for the loss caused by the increase in the excess pollution tax rate. When non-intelligent transformation enterprises’ excessive pollution discharge fee exceeds the transformation cost of the intelligent transformation enterprise, the price of intelligent products will be lower than the price of non-intelligent products. Through price competition, intelligent transformation enterprises will occupy more market shares; thereby, the government achieves the purpose of promoting the intelligent transformation of enterprises.
Conclusion 1: The impact of green taxation on the intelligent transformation of enterprises is non-monotonous, and green taxation has a threshold effect on the government’s green taxation. This also means that the government cannot blindly increase or reduce green taxes to achieve the purpose of promoting the intelligent transformation of manufacturing enterprises. Blindly raising or lowering green taxes α and σ will not only increase the degree and willingness of intelligent transformation of manufacturing enterprises, but will also backfire, reducing the willingness and degree of manufacturing enterprises’ intelligent transformation, and this measure of manufacturing enterprises will cause the government to reduce investment in technology related to intelligent transformation, etc., creating a vicious circle. As discussed in Theorems 1, 2, 4, and 5, the government should reasonably increase or reduce the tax rate within the threshold range of taxation to promote the intelligent transformation of enterprises.
Conclusion 2: The price of intelligent products is related to the additional product experience λ that intelligent products bring to consumers, the cost reduction brought about by product production k , and the reduction in the product production’s environmental impact α φ . The government can change the green tax α , σ so that the price of intelligent products is always lower than the price of ordinary products. This measure will steer consumers towards purchasing smart products, subsequently allowing smart products to occupy more market share, and allowing many manufacturing companies to take the initiative to adopt smart transformation—as discussed in Theorems 3, 6, and 7.
Conclusion 3: The green tax formulated by the government will affect the government’s technical subsidies for its intelligent transformation. From Table 1, Table 2, Table 3, Table 4, Table 5 and Table 6, we find that the government’s optimal technology subsidy is related to the green tax rates set by the government—there is a certain relationship between them. However, due to space limitations, we do not discuss this in detail, and the relationship between them will be given in follow-up research.
Note: In this paper, α 0 and α are in the same interval and satisfy α > α 0 . Moreover, σ 0 and σ are in the same interval and satisfy σ > σ 0 .

7. Policy Implications

The research results from this study provide new ideas for the formulation of government environmental policies, and the following policy implications can be drawn. (1) The government should adopt a variety of methods to formulate tax policies to promote the intelligent transformation of enterprises. It is necessary to play the role of market-based environmental policies (such as TPE, TEPE, and PEITM, etc.), but also to combine appropriate compulsory means (such as unified emission standards, etc.), and at the same time, it should also integrate information disclosure and other communication methods to reflect the stability, pertinence, and flexibility of green tax policies to better achieve regulatory goals. (2) The intelligent transformation of enterprises is the key driving force for solving environmental problems. Governments should formulate ideal environmental policies and financial subsidies to encourage enterprises to carry out intelligent transformation. At the same time, they must ensure that the transformation intensity is moderate and does not exceed the carrying capacity of the enterprise, so as to encourage enterprises to carry out technological innovation, otherwise, the result will be counterproductive. (3) Environmental policies should be adjusted in a timely and appropriate manner. Since the adoption of intelligent transformation of enterprises will lead to changes in the overall pollution level, governments must adjust environmental policies in a timely manner, but the impact of policy adjustments on corporate strategies must be anticipated, otherwise, it will inhibit the intelligent transformation of enterprises.
At the same time, several designs of the experiment indicate the validity of the model and also give enlightenment for future research. (1) The model discusses the PEITM of high pollution enterprises and low pollution enterprises, by which it is indicated that green taxation has different incentive effects for intelligent transformation on different industrial sectors. High-polluting manufacturing enterprises will be subject to relatively higher TPE and TEPE, so they will be more active in intelligent transformation, which is a potential research direction for the future. (2) As the model indicated, because of TPE and TEPE, consumers need to spend more money to obtain products. On the other hand, relying on intelligent transformation of products, consumers can obtain new intelligent products at a more economical price, thus offsetting the increased cost of green tax. In the future, it is meaningful to carry out further study on consumers’ satisfaction with intelligent products. (3) Because the model parameters are variable, the threshold of green taxation leverage is also variable. With the changes in the coming years, the deterioration or improvement of the environment and the improvement or reduction in the intelligent technology level of the majority of manufacturing enterprises, the green tax would change dynamically. According to the constraints, limiting the value of green tax to a feasible range, rather than just a value, may help policymaking become more practical, which is a problem worthy of study in the future.

8. Conclusions

This paper discusses the impact of the use of TPE α and TEPE σ on the intelligent transformation of manufacturing enterprises and provides an optimal technology subsidy plan for the government to promote the intelligent transformation of enterprises. In the process of intelligent transformation of manufacturing enterprises, we study how enterprises can determine the degree of intelligent transformation, how the government sets technical subsidies and green taxes, and how enterprises set product prices and expand market demand. In a Stackelberg game model, we first consider government technology subsidies, then consider the degree of intelligent transformation of manufacturing enterprises and product pricing, and finally consider how the government strategically sets TPE and TEPE rates to achieve maximum social welfare.
Through the research of this paper, we found that although green taxes can effectively promote the degree of intelligent transformation of manufacturing enterprises, the government cannot overuse green taxes. High tax rates will hinder the degree of intelligent transformation of manufacturing enterprises. Moreover, high pollution taxes may lead to a reduction in government subsidies for intelligent transformation. In this case, it may cause manufacturing enterprises to never introduce the most advanced manufacturing technology and information technology. Our results also show how the government sets technology subsidies to increase the enthusiasm of manufacturing enterprises for intelligent transformation. In addition, we find that consumers’ demand for intelligent products gradually exceeds the demand for ordinary products.
Intuitively speaking, governments that set a low green tax rate will indirectly encourage manufacturing enterprises to choose to sacrifice the environment in exchange for economic development. In addition, we found an interesting result: the government can make the price of smart products lower than the price of ordinary products by formulating appropriate green taxes. This makes ordinary products lose their price advantage and allows more consumers to choose smart products, thus forcing manufacturing enterprises to carry out intelligent transformation.
However, this paper is limited to the formulation of the government’s green taxation policy, and it does not separate the discussion of green taxation and the PEITM. In fact, the PEITM and green taxation will affect the intelligent transformation of enterprises. However, the price of emission indicators is affected by the market and has great uncertainty; in this case, the discussion is more problematic, and this paper does not discuss this topic.
Regarding future work, in a follow-up paper, we will discuss which of the green tax and technology subsidies is the most effective measure for intelligent transformation, the impact of green taxes on enterprise technology subsidies, and whether to use one of the above two measures alone or to mix the two measures.

Author Contributions

Conceptualization, L.Y. and J.Z.; methodology, L.Y., J.Z. and Z.W.; validation, J.Z.; formal analysis, J.Z.; investigation, L.Y.; writing—original draft preparation, L.Y. and J.Z.; writing—review and editing, Z.W.; supervision, J.Z.; L.Y. and Z.W. contributed equally to this article and are both first authors. All authors have read and agreed to the published version of the manuscript.

Funding

This research was funded by the Qingdao City Philosophy and Social Science Planning Project (QDSKL1801166) in the context of “Conversion of New and Old Kinetic Energy, Research on the Innovation and Development of Qingdao’s High-End Chemical Industry” and by the National Social Science Foundation Youth Project (12CJL013) under the framework of “Research on Economic Growth Model Including Institutional Factors”.

Acknowledgments

The authors would like to thank the anonymous reviewers and journal editors for their valuable and constructive feedback.

Conflicts of Interest

The authors declare no conflict of interest.

Appendix A

Model 1:
The manufacturer determines the price of the product:
π S p S = 1 2 t [ t + ( s s 0 ) ( λ k α φ ) + p N 2 p S + c + α γ ]
π N p N = 1 2 t [ t λ ( s s 0 ) 2 p N + p S + c + α γ ]
Let π S p S = 0 , π N p N = 0 ; we can obtain:
p N * = t + c + α γ 1 3 ( k + λ + α φ ) ( s s 0 )
p S * = t + c + α γ 1 3 ( 2 k λ + 2 α φ ) ( s s 0 )
Furthermore, we can obtain:
d S * = 1 2 + 1 6 t ( s s 0 ) ( k + λ + α φ )
d N * = 1 2 1 6 t ( s s 0 ) ( k + λ + α φ )
Finally:
π S = 1 2 t [ t + 1 3 ( λ + k + α φ ) ( s s 0 ) ] 2 + ( η 1 ) β ( s s 0 ) 2 + μ ( s s 0 )
π N = 1 2 t [ t 1 3 ( λ + k + α φ ) ( s s 0 ) ] 2
The enterprise determines the optimal degree of intelligent transformation:
π S s = 1 3 ( α φ + k + λ ) + 1 9 t ( α φ + k + λ ) 2 ( s s 0 ) + 2 ( η 1 ) β ( s s 0 ) + μ
Let π S s = 0 ; we can obtain:
s * = s 0 + 3 t ( α φ + λ + k + 3 μ ) 18 t β ( 1 η ) ( α φ + k + λ ) 2
The government determines the optimal technology subsidy:
G * = d S * [ t + ( s * s 0 ) ( k + λ + φ ) ] + b t 2 c γ + μ ( s * s 0 ) β ( s * s 0 ) 2 t ( d S * ) 2
Take the derivative of G * :
G * η = d s * * s * s * η [ t + ( s * s 0 ) ( k + λ + φ ) ] + d s * * ( k + λ + φ ) s * η + μ s * η 2 β ( s * s 0 ) s * η 2 t d s * * d s * * s * s * η
Let G * η = 0 ; we can obtain:
η * = 1 + ( k + λ + α φ + 3 μ ) [ 6 ( k + λ + α φ ) ( k + λ + φ ) 36 t β ( k + λ + α φ ) 2 ] 3 ( k + λ + φ + 2 μ ) ( k + λ + α φ ) 2 54 t β ( k + λ + φ + 2 μ )
Equilibrium solution of the government subsidy program in Model 1 as Table 1 is shown at page 12.
Model 2
The manufacturer determines the best-selling price:
π S p S = 1 2 + 1 2 t [ λ ( s s 0 ) + p N p S ] 1 2 t [ p S c + k ( s s 0 ) ] + α 2 t [ γ φ ( s s 0 ) ] + γ S p 2 t
π N p N = 1 2 1 2 t [ λ ( s s 0 ) + p N p S ] 1 2 t ( p N c ) + α γ 2 t + γ S p 2 t
Let π S p S = 0 , π N p N = 0 ; we can obtain:
p S = t + λ ( s s 0 ) + 2 p N c α γ γ S p
{ p S * = t + c + α γ + γ S p 1 3 ( s s 0 ) ( 2 k + 2 α φ λ ) p N * = t + c + α γ + γ S p 1 3 ( s s 0 ) ( k + α φ + λ )
Furthermore, we can obtain:
{ d S * = 1 2 + 1 6 t ( s s 0 ) ( k + λ + α φ ) d N * = 1 2 1 6 t ( s s 0 ) ( k + λ + α φ )
The enterprise determines the optimal degree of intelligent transformation:
π S = 1 2 t [ t + 1 3 ( s s 0 ) ( k + λ + α φ ) ] 2 + γ S p 2 t [ t + ( s s 0 ) 3 ( k + λ + α φ ) ] + ( η 1 ) ( s s 0 ) 2 + μ ( s s 0 ) + [ γ 2 γ 6 t ( s s 0 ) ( k + λ + α φ ) g 0 ] S p
Let π S s = 0 ; we can obtain:
s * = s 0 + 3 t ( k + λ + α φ + 3 μ ) 18 t β ( 1 η ) ( k + λ + α φ ) 2
As shown in Equations (A11) and (A12). Let G η = 0 ; we can obtain:
η * = 1 ( k + λ + α φ ) 2 18 t β ( k + λ + α φ + 3 μ ) [ 36 t β + ( k + λ + α φ ) 2 3 ( k + λ + α φ ) ( k + λ + φ ) ] 18 t β ( 2 k + 2 λ + 3 φ + 6 μ α φ )
Equilibrium solution of the government subsidy program in Model 2 as Table 2 is shown at page 12.
Model 3
The manufacturer determines the optimal sales price and sales output:
π S p S = 1 2 + 1 2 t [ λ ( s s 0 ) + p N p S ] 1 2 t [ p S c α γ S p γ + ( s s 0 ) ( k + α φ + φ S p ) ]
π N p N = 1 2 1 2 t [ λ ( s s 0 ) + p N p S ] 1 2 t ( p N c ) + S p + α σ 2 t [ γ φ ( s s 0 ) ]
Let π S p s = 0 , π N p N = 0 ; we can obtain:
{ p S * = t + c + α γ + γ S p ( s s 0 ) 3 ( 2 k + 3 α φ λ + 3 φ S p σ φ ) σ γ 3 p N * = t + c + α γ + γ S p 1 3 ( s s 0 ) ( k + 3 α φ 2 λ + 3 φ S p 2 σ φ ) 2 σ γ 3
Furthermore, the demand function of the market can be obtained as:
{ d S * = 1 2 σ γ 6 t + 1 6 t ( s s 0 ) ( k + 4 λ + σ φ ) d N * = 1 2 + σ γ 6 t 1 6 t ( s s 0 ) ( k + 4 λ + σ φ )
The enterprises choose the optimal degree of intelligent transformation:
π S = [ p S * c + k ( s s 0 ) ] d S * + ( η 1 ) β ( s s 0 ) 2 + μ ( s s 0 ) α [ γ φ ( s s 0 ) ] d s * + [ g 0 [ γ φ ( s s 0 ) ] d S * ] S p
π S s = ( p S * s + k ) d S * + [ p S * c + k ( s s 0 ) ] d S * s + 2 β ( η 1 ) ( s s 0 ) + μ α [ γ φ ( s s 0 ) ] d S * s + α φ d S * + φ d S * S p [ γ φ ( s s 0 ) ] S p d S * s
Let π S s = 0 ; we can obtain:
s * = s 0 + ( 3 t σ γ ) ( 5 λ + 2 k + 2 σ φ ) 36 t β ( 1 η ) ( 4 λ + k + σ φ ) ( 2 λ + k + 2 σ φ )
As shown in Equations (A11) and (A12). Let G η = 0 ; we can obtain:
η * = 1 ( 4 λ + k + σ φ ) ( 2 λ + k + 2 σ φ ) 36 t β [ 6 ( 4 λ + k + σ φ ) ( k + λ + φ ) 36 t β ( 4 λ + k + σ φ ) 2 ] ( 3 t σ γ ) ( 5 λ + 2 k + 2 σ φ ) 36 t β [ σ γ ( 2 k λ + 3 φ σ φ ) 18 t μ 9 t ( k + λ + φ ) ]
Equilibrium solution of the government subsidy program in Model 3 as Table 3 is shown at page 12.
Model 4
The manufacturer determines the optimal sales price and sales output:
π S p S = 1 2 + 1 2 t [ λ ( s s 0 ) + p N p S ] 1 2 t [ p S c + k ( s s 0 ) ] + α + S p 2 t [ γ φ ( s s 0 ) ]
π N p N = 1 2 1 2 t [ λ ( s s 0 ) + p N p S ] 1 2 t ( p N c ) + α γ 2 t + S p 2 t [ γ φ ( s s 0 ) ]
Let π S p s = 0 , π N p N = 0 ; we can obtain:
{ p S * = t + c + α γ + γ S p ( s s 0 ) 3 ( 2 k + 2 α φ λ + 3 φ S p ) p N * = t + c + α γ + γ S p 1 3 ( s s 0 ) ( k + α φ + λ + 3 φ S p )
Furthermore, the demand function of the enterprises can be obtained:
{ d S * = 1 2 + 1 6 t ( s s 0 ) ( k + λ + α φ ) d N * = 1 2 1 6 t ( s s 0 ) ( k + λ + α φ )
The enterprise chooses the optimal degree of intelligent transformation:
π S = [ p S * c + k ( s s 0 ) ] d S * + ( η 1 ) β ( s s 0 ) 2 + μ ( s s 0 ) α [ γ φ ( s s 0 ) ] d s * + [ g 0 [ γ φ ( s s 0 ) ] d S * ] S p [ [ γ φ ( s s 0 ) ] d S * g 0 ] S p
π S s = ( p S * s + k ) d S * + [ p S * c + k ( s s 0 ) ] d S * s + 2 β ( η 1 ) ( s s 0 ) + μ α [ γ φ ( s s 0 ) ] d S * s + α φ d S * + ( α + S p ) φ d S * [ γ φ ( s s 0 ) ] S p d S * s
Let π S s = 0 ; we can obtain:
s * = s 0 + 18 t μ + ( 6 t + 3 α γ ) ( λ + k + α φ ) 36 t β ( 1 η ) ( λ + k + α φ ) ( 2 λ + 2 k α φ )
As shown in Equations (A11) and (A12). Let G η = 0 ; we can obtain
η * = 1 [ 6 t μ + ( 2 t + α γ ) ( λ + k + α φ ) ] [ 36 t β ( λ + k + α φ ) ( 5 λ + 5 k + 6 φ α φ ) ] 108 t 2 β ( λ + k + φ + 2 μ ) ( λ + k + α φ ) ( 2 k + 2 λ α φ ) 36 t β
Equilibrium solution of the government subsidy program in Model 4 as Table 4 is shown at page 13.
Model 5
The manufacturer determines the optimal sales price and sales output:
π S p S = 1 2 t [ t + λ ( s s 0 ) + p N 2 p S + c k ( s s 0 ) + ( α + S p ) γ σ φ ( s s 0 ) ]
π N p N = 1 2 t [ t λ ( s s 0 ) 2 p N + p S + c + α γ + S p γ ]
Let π S p s = 0 , π N p N = 0 ; we can obtain:
{ p S * = t + c + α γ + γ S p ( s s 0 ) 3 ( 2 k + 2 σ φ λ ) p N * = t + c + α γ + γ S p 1 3 ( s s 0 ) ( k + σ φ + λ )
Then, the demand for the enterprises’ products can be obtained:
{ d S * = 1 2 + 1 6 t ( s s 0 ) ( k + λ + σ φ ) d N * = 1 2 1 6 t ( s s 0 ) ( k + λ + σ φ )
The enterprise chooses the optimal degree of intelligent transformation:
π S s = ( p S * s + k ) d S * + [ p S * c + k ( s s 0 ) ] d S * s + 2 β ( η 1 ) ( s s 0 ) + μ + ( α + S p ) γ d N * s [ [ γ φ ( s s 0 ) ] d S * s φ d S * + γ d N * s ] σ
Let π S s = 0 ; we can obtain:
s * = s 0 + 3 t ( 6 μ + λ + k + σ φ ) 36 t β ( 1 η ) 2 ( λ + k + σ φ ) 2
As shown in Equations (A11) and (A12). Let G η = 0 ; we can obtain
η * = 1 ( k + λ + σ φ ) 2 18 t β [ 36 t β + ( k + λ + σ φ ) 2 6 ( k + λ + σ φ ) ( k + λ + φ ) ] ( 6 μ + k + λ + σ φ ) 108 t β ( k + λ + φ + 2 μ )
Equilibrium solution of the government subsidy program in Model 5 as Table 5 is shown at page 13.
Model 6
The manufacturer determines the optimal sales price and sales output:
π S p S = 1 2 t [ t + λ ( s s 0 ) + p N 2 p S + c k ( s s 0 ) + σ γ σ φ ( s s 0 ) ]
π N p N = 1 2 t [ t λ ( s s 0 ) 2 p N + p S + c + σ γ ]
Let π S p s = 0 , π N p N = 0 ; we can obtain:
{ p S * = t + c + σ γ ( s s 0 ) 3 ( 2 k + 2 σ φ λ ) p N * = t + c + σ γ 1 3 ( s s 0 ) ( k + σ φ + λ )
Then, we can obtain:
{ d S * = 1 2 + 1 6 t ( s s 0 ) ( k + λ + σ φ ) d N * = 1 2 1 6 t ( s s 0 ) ( k + λ + σ φ )
The enterprises choose the optimal degree of intelligent transformation:
π S s = ( p S * s + k ) d S * + [ p S * c + k ( s s 0 ) ] d S * s + 2 β ( η 1 ) ( s s 0 ) + μ σ [ γ φ ( s s 0 ) ] d S * s + σ φ d S *
Let π S s = 0 ; we can obtain:
s * = s 0 + 3 t ( 3 μ + λ + k + σ φ ) 18 t β ( 1 η ) ( λ + k + σ φ ) 2
As shown in Equations (A11) and (A12). Let G η = 0 ; we can obtain:
η * = 1 ( k + λ + σ φ ) 2 18 t β [ 36 t β + ( k + λ + σ φ ) 2 6 ( k + λ + σ φ ) ( k + λ + φ ) ] ( k + λ + σ φ + 3 μ ) 54 t β ( k + λ + φ + 2 μ )
Equilibrium solution of the government subsidy program in Model 6 as Table 6 is shown at page 13.

Appendix B

Theorem A1. 
For Model 1 and Model 4:
Let
f ( α ) = 36 t β + ( k + λ + α φ ) 2 6 ( k + λ + α φ ) ( k + λ + φ )
Derivative of  f ( α ) :
f ( α ) = 2 φ ( k + λ + α φ ) 6 φ ( k + λ + φ )
Let  f ( α ) = 0 ; we can obtain: α = 3 + 2 k + 2 λ φ .
When  α > 3 + 2 k + 2 λ φ , f ( α ) is an increasing function, so s * ( α ) is a decreasing function.
When  α < 3 + 2 k + 2 λ φ , f ( α ) is a decreasing function, so s * ( α ) is an increasing function.
Theorem A2. 
For Model 2, first let
f ( α ) = 3 t ( 2 k + 2 λ + 3 φ + 6 μ α φ ) 36 t β + ( k + λ + α φ ) 2 3 ( k + λ + α φ ) ( k + λ + φ )
Derivative of  f ( α ) :
f ( α ) = 36 t β ( k + λ + α φ ) 2 + 3 ( k + λ + α φ ) ( k + λ + φ ) 2 ( 2 k + 2 λ + 3 φ + 6 μ α φ ) ( k + λ + α φ ) [ 36 t β + ( k + λ + α φ ) 2 3 ( k + λ + α φ ) ( k + λ + φ ) ] 2 + 3 ( 2 k + 2 λ + 3 φ + 6 μ α φ ) ( k + λ + φ ) [ 36 t β + ( k + λ + α φ ) 2 3 ( k + λ + α φ ) ( k + λ + φ ) ] 2
Let f ( α ) = 0 and  x = k + λ + α φ ; we can obtain:
x 2 6 x ( λ + k + φ + 2 μ ) + 9 ( λ + k + φ + 2 μ ) ( λ + k + φ ) 36 t β = 0
Furthermore, we can obtain:
α 1 = 2 k + 2 λ + 3 φ + 6 μ + 3 2 μ ( k + λ + 2 μ ) + 4 t β φ
α 2 = 2 k + 2 λ + 3 φ + 6 μ 3 2 μ ( k + λ + 2 μ ) + 4 t β φ
Therefore, when:
2 k + 2 λ + 3 φ + 6 μ 3 2 μ ( k + λ + 2 μ ) + 4 t β φ α 2 k + 2 λ + 3 φ + 6 μ + 3 2 μ ( k + λ + 2 μ ) + 4 t β φ
s * ( α ) decreases with an increase in  α ; on the contrary  s * ( α ) increases with an increase in  α .
Theorem A3. 
For Model 1:
p N * = t + c + α γ ( k + λ + α φ ) 3 t ( α φ + λ + k + 3 μ ) 54 t β ( 1 η ) 3 ( α φ + k + λ ) 2
p S * = t + c + α γ ( 2 k λ + 2 α φ ) 3 t ( α φ + λ + k + 3 μ ) 54 t β ( 1 η ) 3 ( α φ + k + λ ) 2
Therefore, when  λ < 1 2 ( k + α φ ) , p N > p S . In the same way, Models 2 and 4 can be proven.
Theorem A4. 
For Model 3, let
f ( σ ) = σ 2 γ φ + ( 2 k λ + 3 φ ) σ γ 9 t ( k + λ + φ + 2 μ ) σ 2 φ 2 + σ φ ( 4 k 2 λ + 6 φ ) + ( 4 λ + k ) ( 5 k + 2 λ + 6 φ ) 36 t β
Derivative of  f ( σ ) :
f ( σ ) = σ 2 φ 2 γ ( 2 k + λ 3 φ ) + σ [ 72 t β γ φ 2 γ φ ( 4 λ + k ) ( 5 k + 2 λ + 6 φ ) 18 t φ 2 ( k + λ + φ + 2 μ ) ] [ σ 2 φ 2 + σ φ ( 4 k 2 λ + 6 φ ) + ( 4 λ + k ) ( 5 k + 2 λ + 6 φ ) 36 t β ] 2 + ( 4 λ + k ) ( 5 k + 2 λ + 6 φ ) ( 2 k λ + 3 φ ) γ + 9 t φ ( k + λ + φ + 2 μ ) ( 4 k 2 λ + 6 φ ) 36 t β γ ( 2 k λ + 3 φ ) [ σ 2 φ 2 + σ φ ( 4 k 2 λ + 6 φ ) + ( 4 λ + k ) ( 5 k + 2 λ + 6 φ ) 36 t β ] 2
Let
a = φ 2 γ ( λ 2 k 3 φ ) b = 72 t β γ φ 2 γ φ ( 4 λ + k ) ( 5 k + 2 λ + 6 φ ) 18 t φ 2 ( k + λ + φ + 2 μ ) c = ( 4 λ + k ) ( 5 k + 2 λ + 6 φ ) ( 2 k λ + 3 φ ) γ + 9 t φ ( k + λ + φ + 2 μ ) ( 4 k 2 λ + 6 φ ) 36 t β γ ( 2 k λ + 3 φ )
If λ > 2 k + 3 φ ,
When  σ < b b 2 4 a c 2 a or σ > b + b 2 4 a c 2 a , as  σ increases, s * ( σ ) increases.
When  b b 2 4 a c 2 a < σ < b + b 2 4 a c 2 a , as  σ increases, s * ( σ ) decreases.
If  λ < 2 k + 3 φ ,
When  σ < b b 2 4 a c 2 a or σ > b + b 2 4 a c 2 a , as  σ increases, s * ( σ ) decreases. when b b 2 4 a c 2 a < σ < b + b 2 4 a c 2 a , as  σ increases, s * ( σ ) increases.
Theorem A5. 
For Model 5 and Model 6, let
f ( σ ) = 9 t ( k + λ + φ + 2 μ ) 36 t β + ( k + λ + σ φ ) 2 6 ( k + λ + σ φ ) ( k + λ + φ )
Derivative of  f ( σ ) :
f ( σ ) = 9 t ( k + λ + φ + 2 μ ) [ 6 φ ( k + λ + φ ) 2 φ ( k + λ + σ φ ) ] [ 36 t β + ( k + λ + σ φ ) 2 6 ( k + λ + σ φ ) ( k + λ + φ ) ] 2
Let f ( σ ) = 0 ; we can obtain: σ = 3 + 2 k + 2 λ φ .
Therefore, when  σ < 3 + 2 k + 2 λ φ , as  σ increases, s * ( σ ) increases. When  σ > 3 + 2 k + 2 λ φ , as  σ increases, s * ( σ ) decreases; when  σ = 3 + 2 k + 2 λ φ , s * ( σ ) reaches the maximum.
Theorem A6. 
For Model 3, when  p S * < p N * , we can obtain:
σ γ 3 < [ σ γ ( 2 k λ + 3 φ σ φ ) 18 t μ 9 t ( k + λ + φ ) ] ( k + λ + σ φ ) 3 [ ( 4 λ + k + σ φ ) ( 5 k + 2 λ + 6 φ σ φ ) 36 t β ]
If  ( 4 λ + k + σ φ ) ( 5 k + 2 λ + 6 φ σ φ ) > 36 t β , we can obtain:
σ 2 + σ [ γ ( 4 λ + k ) ( 5 k + 2 λ + 6 φ ) 36 t β γ ( 2 k λ + 3 φ ) ( λ + k ) γ + 9 t φ ( λ + k + φ + 2 μ ) ] 3 ( k + φ ) φ γ + 3 t ( k + λ + φ + 2 μ ) ( k + λ ) ( k + φ ) φ γ < 0
Let
u 1 = [ γ ( 4 λ + k ) ( 5 k + 2 λ + 6 φ ) 36 t β γ ( 2 k λ + 3 φ ) ( λ + k ) γ + 9 t φ ( λ + k + φ + 2 μ ) ] 3 ( k + φ ) φ γ u 2 = 3 t ( k + λ + φ + 2 μ ) ( k + λ ) ( k + φ ) φ γ
Then, we can obtain the value range of  σ :
u 1 u 1 2 4 u 2 2 σ u 1 + u 1 2 4 u 2 2
If ( 4 λ + k + σ φ ) ( 5 k + 2 λ + 6 φ σ φ ) < 36 t β , we can obtain:
σ 2 + σ [ γ ( 4 λ + k ) ( 5 k + 2 λ + 6 φ ) 36 t β γ ( 2 k λ + 3 φ ) ( λ + k ) γ + 9 t φ ( λ + k + φ + 2 μ ) ] 3 ( k + φ ) φ γ + 3 t ( k + λ + φ + 2 μ ) ( k + λ ) ( k + φ ) φ γ > 0
Then, we can obtain the value range of  σ :
σ u 1 u 1 2 4 u 2 2   or   σ u 1 + u 1 2 4 u 2 2
Theorem A7. 
For Model 5 and Model 6, when  p S * < p N * , we can obtain:
3 t ( 2 k + 2 σ φ λ ) ( λ + k + φ + 2 μ ) 36 t β + ( λ + k + σ φ ) 2 6 ( λ + k + σ φ ) ( λ + k + φ ) > 3 t ( k + σ φ + λ ) ( λ + k + φ + 2 μ ) 36 t β + ( λ + k + σ φ ) 2 6 ( λ + k + σ φ ) ( λ + k + φ )
Furthermore, we can obtain:
σ > 2 λ k φ

References

  1. Su, J.; Su, K.; Wang, S. Does the Digital Economy Promote Industrial Structural Upgrading?—A Test of Mediating Effects Based on Heterogeneous Technological Innovation. Sustainability 2021, 13, 10105. [Google Scholar] [CrossRef]
  2. Tim, S.; Michael, O.; Sascha, K.; Holger, K. Industry 4.0 as Enabler for a Sustainable Development: A Qualitative Assessment of its Ecological and Social Potential. Process. Saf. Environ. 2018, 118, S1879791293. [Google Scholar]
  3. Niu, P.; Zhu, J.; Sun, Y. Dynamic Modeling and Chaos Control of Informatization Development in Manufacturing Enterprises. Entropy 2021, 23, 681. [Google Scholar] [CrossRef]
  4. Jz, A.; Ys, B. Dynamic modeling and chaos control of sustainable integration of informatization and industrialization—ScienceDirect. Chaos Solitons Fract. 2020, 135, 109745. [Google Scholar]
  5. Li, F.; Andries, P.; Pellens, M.; Xu, J. The importance of large firms for generating economic value from subsidized technological innovation: A regional perspective. Technol. Forecast Soc. 2021, 171, 120973. [Google Scholar] [CrossRef]
  6. Lin, B.; Luan, R. Do government subsidies promote efficiency in technological innovation of China’s photovoltaic enterprises? J. Clean Prod. 2020, 254, 120108. [Google Scholar] [CrossRef]
  7. Xu, J.; Wang, X.; Liu, F. Government subsidies, R&D investment and innovation performance: Analysis from pharmaceutical sector in China. Technol. Anal. Strateg. Manag. 2020, 33, 535–553. [Google Scholar]
  8. Luo, G.; Liu, Y.; Zhang, L.; Xu, X.; Guo, Y. Do governmental subsidies improve the financial performance of China’s new energy power generation enterprises? Energy 2021, 227, 120432. [Google Scholar] [CrossRef]
  9. Ouyang, X.; Li, Q.; Du, K. How does environmental regulation promote technological innovations in the industrial sector? Evidence from Chinese provincial panel data. Energ. Policy 2020, 139, 111310. [Google Scholar] [CrossRef]
  10. Ma, H.; Li, L. Could environmental regulation promote the technological innovation of China’s emerging marine enterprises? Based on the moderating effect of government grants. Environ. Res. 2021, 202, 111682. [Google Scholar] [CrossRef]
  11. Hattori, M.; Tanaka, Y. Subsidy or tax policy for new technology adoption in duopoly with quadratic and linear cost functions. Mpra Pap. 2015, 35, 1423–1433. [Google Scholar]
  12. Krass, D.; Nedorezov, T.; Ovchinnikov, A. Environmental taxes and the choice of green technology. Oper. Res. 2015, 22, 1035–1055. [Google Scholar] [CrossRef]
  13. Liu, L.; Kang, C.; Yin, Z.; Liu, Z. The effects of fiscal and taxation policies on the innovation efficiency of manufacturing enterprises: A comparative study from the perspective of economic regions. Transform. Bus. Econ. 2019, 18, 206–228. [Google Scholar]
  14. Wu, H.; Hu, S. The impact of synergy effect between government subsidies and slack resources on green technology innovation. J. Clean Prod. 2020, 274, 122682. [Google Scholar] [CrossRef]
  15. Buravleva, Y.; Tang, D.; Bethel, B.J. Incentivizing Innovation: The Causal Role of Government Subsidies on Lithium-Ion Battery Research and Development. Sustainability 2021, 13, 8309. [Google Scholar] [CrossRef]
  16. Zhang, G.P.; Yu, J.; Xia, Y. The Payback of Effective Innovation Programs: Empirical Evidence from Firms that Have Won Innovation Awards. Prod. Oper. Manag. 2014, 23, 1401–1420. [Google Scholar] [CrossRef] [Green Version]
  17. He, P.; Ning, J.; Yu, Z.; Xiong, H.; Jin, H. Can Environmental Tax Policy Really Help to Reduce Pollutant Emissions? An Empirical Study of a Panel ARDL Model Based on OECD Countries and China. Sustainability 2019, 11, 4384. [Google Scholar] [CrossRef] [Green Version]
  18. Mardones, C.; Mena, C. Economic, environmental and distributive analysis of the taxes to global and local air pollutants in Chile. J. Clean Prod. 2020, 259, 120893. [Google Scholar] [CrossRef]
  19. Fullerton, D.; Karney, D.H. Multiple pollutants, co-benefits, and suboptimal environmental policies. J. Environ. Econ. Manag. 2017, 87, S516208804. [Google Scholar] [CrossRef]
  20. Bing, X.; Mitchell, B.; Yong, G.; Ren, W.; Mueller, K.; Ma, Z.; Oliveira, J.; Fujita, T.; Tobias, M. A review on China’s pollutant emissions reduction assessment. Ecol. Indic. 2014, 38, 272–278. [Google Scholar]
  21. Gao, G.; Zeng, X.; An, C.; Lei, Y. A Sustainable Industry-Environment Model for the Identification of Urban Environmental Risk to Confront Air Pollution in Beijing, China. Sustainability 2018, 10, 962. [Google Scholar] [CrossRef] [Green Version]
  22. Yu, F.; Wang, L.; Li, X. The effects of government subsidies on new energy vehicle enterprises: The moderating role of intelligent transformation. Energ. Policy 2020, 141, 111463. [Google Scholar] [CrossRef]
  23. Meng, B.; Kuang, H.; Niu, E.; Li, J.; Li, Z. Research on the Transformation Path of the Green Intelligent Port: Outlining the Perspective of the Evolutionary Game “Government–Port–Third-Party Organization”. Sustainability 2020, 12, 8072. [Google Scholar] [CrossRef]
  24. Chiroleu-Assouline, M.; Fodha, M. From regressive pollution taxes to progressive environmental tax reforms. Eur. Econ. Rev. 2014, 69, 126–142. [Google Scholar] [CrossRef] [Green Version]
  25. Matsukawa, I. The Welfare Effects of Environmental Taxation on a Green Market Where Consumers Emit a Pollutant. Environ. Resour. Econ. 2012, 52, 87–107. [Google Scholar] [CrossRef]
  26. Kuralbayeva, K. Environmental Taxation, Employment and Public Spending in Developing Countries. Environ. Resour. Econ. 2019, 72, 877–912. [Google Scholar] [CrossRef] [Green Version]
  27. Loomis, J.B.; Allen, B. Using Non Market Valuation to Inform the Choice Between Permits and Fees in Environmental Regulation. Environ. Resour Econ. 2008, 40, 329–337. [Google Scholar] [CrossRef]
  28. Li, H.L.; Zhu, X.H.; Chen, J.Y.; Jiang, F.T. Environmental regulations, environmental governance efficiency and the green transformation of China’s iron and steel enterprises. Ecol. Econ. 2019, 165, 106397. [Google Scholar] [CrossRef]
  29. Li, D.; Zhu, J. The Role of Environmental Regulation and Technological Innovation in the Employment of Manufacturing Enterprises: Evidence from China. Sustainability 2019, 11, 2982. [Google Scholar] [CrossRef] [Green Version]
  30. Hu, B.; Dong, H.; Jiang, P.; Zhu, J. Analysis of the Applicable Rate of Environmental Tax through Different Tax Rate Scenarios in China. Sustainability 2020, 12, 4233. [Google Scholar] [CrossRef]
  31. Wu, W.; Zhao, K.; Li, L. Can government subsidy strategies and strategy combinations effectively stimulate enterprise innovation? Theory and evidence. Econ. Polit. 2021, 1–12. [Google Scholar] [CrossRef]
  32. Jia, L.; Nam, E.; Chun, D. Impact of Chinese Government Subsidies on Enterprise Innovation: Based on a Three-Dimensional Perspective. Sustainability 2021, 13, 1288. [Google Scholar] [CrossRef]
  33. Klette, T.J.; Møen, J. R&D investment responses to R&D subsidies: A theoretical analysis and a microeconometric study. Dep. Bus. Manag. Sci. Nor. Sch. Econ. 2010, 9, 169–203. [Google Scholar]
  34. Yi, J.; Murphree, M.; Meng, S.; Li, S. The More the Merrier? Chinese Government R&D Subsidies, Dependence and Firm Innovation Performance. J. Prod. Innovat. Manag. 2021, 38, 289–310. [Google Scholar]
  35. Yang, X.; He, L.; Xia, Y.; Chen, Y. Effect of government subsidies on renewable energy investments: The threshold effect. Energ. Policy 2019, 132, 156–166. [Google Scholar] [CrossRef]
  36. Jiang, Y.; Wang, D.; Zeng, Q. Can founders’dual rolesfacilitate innovation? —From the perspective of founders’ R&D network characteristics. J. Bus. Econ. Manag. 2021, 22, 1288–1307. [Google Scholar]
  37. Wang, Y.; Yu, L. Can the current environmental tax rate promote green technology innovation?—Evidence from China’s resource-based industries. J. Clean Prod. 2020, 278, 123443. [Google Scholar] [CrossRef]
  38. Zhang, S.; Yu, Y.; Zhu, Q.; Qiu, C.M.; Tian, A. Green Innovation Mode under Carbon Tax and Innovation Subsidy: An Evolutionary Game Analysis for Portfolio Policies. Sustainability 2020, 12, 1385. [Google Scholar] [CrossRef] [Green Version]
  39. Deng, Y.; You, D.; Zhang, Y. Research on improvement strategies for low-carbon technology innovation based on a differential game: The perspective of tax competition. Sustain. Prod. Consum. 2021, 26, 1046–1061. [Google Scholar] [CrossRef]
  40. Guo, D.; Guo, Y.; Jiang, K. Government-subsidized R&D and firm innovation: Evidence from China. Res. Policy 2016, 45, 1129–1144. [Google Scholar]
  41. Wu, A.; Li, H. The impact of government subsidies on contract design of green technology R&D cooperation. Technol. Anal. Strat. Manag. 2021, 33, 1–17. [Google Scholar]
  42. Li, Y.; Li, G.; Shao, W.; Duan, K. Impact of government subsidies and environmental regulations on investment in technological innovation. Technol. Soc. 2019, 37, 1694–1701. [Google Scholar]
  43. Sungmin, P. Evaluating the efficiency and productivity change within government subsidy recipients of a national technology innovation research and development program. R D Manag. Res. Dev. Manag. 2015, 45, 549–568. [Google Scholar]
Figure 1. Relationship between decision makers.
Sustainability 13 13321 g001
Figure 2. The impact of green taxation on the degree of intelligent transformation. (a) shows the relationship between the degree of intelligence s and taxation α in models 1 and 4. (b) shows the relationship between the degree of intelligence s and taxation α in models 2. (c) shows the relationship between the degree of intelligence s and taxation σ in models 3. (d) shows the relationship between the degree of intelligence s and taxation σ in models 5 and 6.
Sustainability 13 13321 g002
Figure 3. The impact of green taxation on product price. (a) shows the relationship between the price and taxation α in models 1. (b) shows the relationship between the price and taxation σ in models 3. (c) shows the relationship between the price and taxation σ in models 5 and 6.
Sustainability 13 13321 g003
Table 1. Equilibrium solution of the government subsidy program in Model 1.
Technology Subsidy η * = 1 + ( k + λ + α φ + 3 μ ) [ 6 ( k + λ + α φ ) ( k + λ + φ ) 36 t β ( k + λ + α φ ) 2 ] 3 ( k + λ + φ + 2 μ ) ( k + λ + α φ ) 2 54 t β ( k + λ + φ + 2 μ )
Degree of Intelligent Transformation s * = s 0 + 9 t ( φ + λ + k + 2 μ ) 36 t β + ( k + λ + α φ ) 2 6 ( α φ + k + λ ) ( k + λ + φ )
Product price p N * = t + c + α γ 3 t ( φ + λ + k + 2 μ ) ( k + λ + α φ ) 36 t β + ( k + λ + α φ ) 2 6 ( k + λ + α φ ) ( k + λ + φ )
Market demand d S * = 1 2 + 3 t ( α φ + λ + k + 3 μ ) ( k + λ + α φ ) 2 [ 36 t β + ( k + λ + α φ ) 2 6 ( k + λ + α φ ) ( k + λ + φ ) ] p S * = t + c + α γ 3 t ( φ + λ + k + 2 μ ) ( 2 k λ + 2 α φ ) 36 t β + ( k + λ + α φ ) 2 6 ( k + λ + α φ ) ( k + λ + φ )
Note: In this table, the parameters meet: γ d N < g 0 , [ γ φ ( s s 0 ) ] d S < g 0 η * ( 0 , 1 ] , p N * > 0 , p S * > 0 , d S * > 0 , d N * > 0 β > ( k + λ + α φ ) 36 t ( 5 k + 5 λ + 6 φ α φ ) .
Table 2. Equilibrium solution of the government subsidy program in Model 2.
Technology subsidy η * = 1 ( k + λ + α φ ) 2 18 t β ( k + λ + α φ + 3 μ ) [ 36 t β + ( k + λ + α φ ) 2 3 ( k + λ + α φ ) ( k + λ + φ ) ] 18 t β ( 2 k + 2 λ + 3 φ + 6 μ α φ )
Degree of intelligent transformation s * = s 0 + 3 t ( 2 k + 2 λ + 3 φ + 6 μ α φ ) 36 t β + ( k + λ + α φ ) 2 3 ( k + λ + α φ ) ( k + λ + φ )
Product price p N * = t + c + α γ t ( k + λ + α φ ) ( 2 k + 2 λ + 3 φ + 6 μ α φ ) 36 t β + ( k + λ + α φ ) 2 3 ( k + λ + α φ ) ( k + λ + φ ) p S * = t + c + α γ t ( 2 k λ + 2 α φ ) ( 2 k + 2 λ + 3 φ + 6 μ α φ ) 36 t β + ( k + λ + α φ ) 2 3 ( k + λ + α φ ) ( k + λ + φ )
Market demand d S * = 1 2 + t ( k + λ + α φ ) ( 2 k + 2 λ + 3 φ + 6 μ α φ ) 2 [ 36 t β + ( k + λ + α φ ) 2 3 ( k + λ + α φ ) ( k + λ + φ ) ] d N * = 1 2 t ( k + λ + α φ ) ( 2 k + 2 λ + 3 φ + 6 μ α φ ) 2 [ 36 t β + ( k + λ + α φ ) 2 3 ( k + λ + α φ ) ( k + λ + φ ) ]
Note: In this table, the parameters meet: max { [ γ φ ( s s 0 ) ] d S , γ d N + [ γ φ ( s s 0 ) ] d S 2 } < g 0 < γ d N ; η * ( 0 , 1 ] , p N * > 0 , p S * > 0 , d S * > 0 , d N * > 0 ; β > ( k + λ + α φ ) 36 t ( 2 k + 2 λ + 3 φ α φ ) and α φ < 2 k + 2 λ + 3 φ + 6 μ or β < ( k + λ + α φ ) 36 t ( 2 k + 2 λ + 3 φ α φ ) and α φ > 2 k + 2 λ + 3 φ + 6 μ .
Table 3. Equilibrium solution of the government subsidy program in Model 3.
Technology subsidy η * = 1 ( 4 λ + k + σ φ ) ( 2 λ + k + 2 σ φ ) 36 t β [ ( 4 λ + k + σ φ ) ( 5 k + 2 λ + 6 φ σ φ ) 36 t β ] ( 3 t σ γ ) ( 5 λ + 2 k + 2 σ φ ) 36 t β [ σ γ ( 2 k λ + 3 φ σ φ ) 18 t μ 9 t ( k + λ + φ ) ]
Degree of intelligent transformation s * = s 0 + σ γ ( 2 k λ + 3 φ σ φ ) 18 t μ 9 t ( k + λ + φ ) ( 4 λ + k + σ φ ) ( 5 k + 2 λ + 6 φ σ φ ) 36 t β
Product price p S * = t + c + α γ + S p γ σ γ 3 ( 2 k λ + 3 α φ + 3 φ S p σ φ ) [ σ γ ( 2 k λ + 3 φ σ φ ) 18 t μ 9 t ( k + λ + φ ) ] 3 [ ( 4 λ + k + σ φ ) ( 5 k + 2 λ + 6 φ σ φ ) 36 t β ] p N * = t + c + α γ + S p γ 2 σ γ 3 ( k 2 λ + 3 α φ + 3 φ S p 2 σ φ ) [ σ γ ( 2 k λ + 3 φ σ φ ) 18 t μ 9 t ( k + λ + φ ) ] 3 [ ( 4 λ + k + σ φ ) ( 5 k + 2 λ + 6 φ σ φ ) 36 t β ]
Market demand d S * = 1 2 σ γ 6 t
+ ( 4 λ + k + σ φ ) [ σ γ ( 2 k λ + 3 φ σ φ ) 18 t μ 9 t ( k + λ + φ ) ] 6 t [ ( 4 λ + k + σ φ ) ( 5 k + 2 λ + 6 φ σ φ ) 36 t β ]
d N * = 1 2 + σ γ 6 t
( 4 λ + k + σ φ ) [ σ γ ( 2 k λ + 3 φ σ φ ) 18 t μ 9 t ( k + λ + φ ) ] 6 t [ ( 4 λ + k + σ φ ) ( 5 k + 2 λ + 6 φ σ φ ) 36 t β ]
Note: In this table, the parameters meet: [ γ φ ( s s 0 ) ] d S < g 0 < min { γ d N , γ d N + [ γ φ ( s s 0 ) ] d S 2 } ; η * ( 0 , 1 ] , p N * > 0 , p S * > 0 , d S * > 0 , d N * > 0 ; ( 4 λ + k + σ φ ) ( 5 k + 2 λ + 6 φ σ φ ) 36 t < β < ( 4 λ + k + σ φ ) [ σ γ ( k + λ + φ ) + 3 t ( 2 μ + k + λ + φ ) ] 12 t σ γ or ( 4 λ + k + σ φ ) [ σ γ ( k + λ + φ ) + 3 t ( 2 μ + k + λ + φ ) ] 12 t σ γ < β < ( 4 λ + k + σ φ ) ( 5 k + 2 λ + 6 φ σ φ ) 36 t .
Table 4. Equilibrium solution of the government subsidy program in Model 4.
Technology Subsidy η * = 1 [ 6 t μ + ( 2 t + α γ ) ( λ + k + α φ ) ] [ 36 t β ( λ + k + α φ ) ( 5 λ + 5 k + 6 φ α φ ) ] 108 t 2 β ( λ + k + φ + 2 μ ) ( λ + k + α φ ) ( 2 k + 2 λ α φ ) 36 t β
Degree of Intelligent Transformation s * = s 0 + 9 t ( λ + k + φ + 2 μ ) 36 t β + ( λ + k + α φ ) 2 6 ( λ + k + α φ ) ( λ + k + φ )
Product Price p N * = t + c + α γ + S p γ 3 t ( λ + k + φ + 2 μ ) ( λ + 3 S p φ + k + α φ ) 36 t β + ( λ + k + α φ ) 2 6 ( λ + k + α φ ) ( λ + k + φ ) p S * = t + c + α γ + S p γ 3 t ( λ + k + φ + 2 μ ) ( 3 S p φ λ + 2 k + 2 α φ ) 36 t β + ( λ + k + α φ ) 2 6 ( λ + k + α φ ) ( λ + k + φ )
Market Demand d N * = 1 2 3 ( λ + k + α φ ) ( λ + k + φ + 2 μ ) 72 t β + 2 ( λ + k + α φ ) 2 12 ( λ + k + α φ ) ( λ + k + φ ) d S * = 1 2 + 3 ( λ + k + α φ ) ( λ + k + φ + 2 μ ) 72 t β + 2 ( λ + k + α φ ) 2 12 ( λ + k + α φ ) ( λ + k + φ )
Note: In this table, the parameters meet: max { γ d N , γ d N + [ γ φ ( s s 0 ) ] d S 2 } < g 0 < [ γ φ ( s s 0 ) ] d S ; η * ( 0 , 1 ] , p N * > 0 , p S * > 0 , d S * > 0 , d N * > 0 ; β > ( k + λ + α φ ) 36 t ( 5 k + 5 λ + 6 φ α φ ) .
Table 5. Equilibrium solution of the government subsidy program in Model 5.
Technology Subsidy η * = 1 ( k + λ + σ φ ) 2 18 t β [ 36 t β + ( k + λ + σ φ ) 2 6 ( k + λ + σ φ ) ( k + λ + φ ) ] ( 6 μ + k + λ + σ φ ) 108 t β ( k + λ + φ + 2 μ )
Degree of Intelligent Transformation s * = s 0 + 9 t ( k + λ + φ + 2 μ ) 36 t β + ( k + σ φ + λ ) 2 6 ( k + λ + σ φ ) ( k + λ + φ )
Product Price p N * = t + c + α γ + γ S p 3 t ( k + λ + φ + 2 μ ) ( k + λ + σ φ ) 36 t β + ( k + λ + σ φ ) 2 6 ( k + λ + σ φ ) ( k + λ + φ ) p S * = t + c + α γ + γ S p 3 t ( k + λ + φ + 2 μ ) ( 2 k λ + 2 σ φ ) 36 t β + ( k + λ + σ φ ) 2 6 ( k + λ + σ φ ) ( k + λ + φ )
Market Demand d N * = 1 2 3 ( k + λ + φ + 2 μ ) ( k + λ + σ φ ) 2 [ 36 t β + ( k + λ + σ φ ) 2 6 ( k + λ + σ φ ) ( k + λ + φ ) ] d S * = 1 2 + 3 ( k + λ + φ + 2 μ ) ( k + λ + σ φ ) 2 [ 36 t β + ( k + λ + σ φ ) 2 6 ( k + λ + σ φ ) ( k + λ + φ ) ]
Note: In this table, the parameters meet: γ d N < g 0 < min { γ d N + [ γ φ ( s s 0 ) ] d S 2 , [ γ φ ( s s 0 ) ] d S } ; η * ( 0 , 1 ] , p N * > 0 , p S * > 0 , d S * > 0 , d N * > 0 ; β > ( k + λ + σ φ ) 36 t ( 5 k + 5 λ + 6 φ σ φ ) .
Table 6. Equilibrium solution of the government subsidy program in Model 6.
Technology Subsidy η * = 1 ( k + λ + σ φ ) 2 18 t β [ 36 t β + ( k + λ + σ φ ) 2 6 ( k + λ + σ φ ) ( k + λ + φ ) ] ( k + λ + σ φ + 3 μ ) 54 t β ( k + λ + φ + 2 μ )
Degree of Intelligent Transformation s * = s 0 + 9 t ( k + λ + φ + 2 μ ) 36 t β + ( k + λ + σ φ ) 2 6 ( k + λ + σ φ ) ( k + λ + φ )
Product Price p N * = t + c + γ σ 3 t ( λ + k + σ φ ) ( λ + k + φ + 2 μ ) 36 t β + ( λ + k + σ φ ) 2 6 ( k + λ + σ φ ) ( k + λ + φ ) p S * = t + c + γ σ 3 t ( 2 k + 2 σ φ λ ) ( λ + k + φ + 2 μ ) 36 t β + ( λ + k + σ φ ) 2 6 ( k + λ + σ φ ) ( k + λ + φ )
Market Demand d N * = 1 2 3 ( k + λ + φ + 2 μ ) ( k + λ + σ φ ) 2 [ 36 t β + ( k + λ + σ φ ) 2 6 ( λ + k + σ φ ) ( λ + k + φ ) ] d S * = 1 2 + 3 ( k + λ + φ + 2 μ ) ( k + λ + σ φ ) 2 [ 36 t β + ( k + λ + σ φ ) 2 6 ( λ + k + σ φ ) ( λ + k + φ ) ]
Note: In this table, the parameters meet: [ γ φ ( s s 0 ) ] d S > g 0 , γ d N > g 0 ; η * ( 0 , 1 ] , p N * > 0 , p S * > 0 , d S * > 0 , d N * > 0 ; β > ( k + λ + σ φ ) 36 t ( 5 k + 5 λ + 6 φ σ φ ) .
Publisher’s Note: MDPI stays neutral with regard to jurisdictional claims in published maps and institutional affiliations.

