Abstract
With the proposed goals of reaching its “carbon peak” by 2030 and becoming “carbon neutral” by 2060, China will comprehensively build a diversified, efficient and clean energy system. The differences in China’s resource endowments have made the development of carbon emission reduction in the thermal power industry uncoordinated in various regions. Therefore, it is necessary to optimize the method for measuring thermal power carbon emission efficiency and determine the impact of regional development imbalances on the carbon emission efficiency of thermal power. For this article, we used the stochastic frontier analysis method and selected a variety of influencing factors as technical inefficiency items. After that, we measured the thermal power carbon emission efficiency in 30 provinces and municipalities (autonomous regions) in China in the past 10 years, and it was found that the efficiency was increasing yearly and showed obvious spatial differences. The impact of the clean energy substitution effect on the thermal power carbon emission efficiency cannot be ignored. After performing a coupled and coordinated analysis on the efficiency of thermal carbon emission in various regions and its influencing factors, the three indicators of power consumption intensity, urbanization level and clean energy substitution effect were selected. The weight of the indicator subsystem was determined in view of the estimation of the technical inefficiency. The results of the coupling and coordination analysis show that the degree of coupling and coordination of thermal power carbon emission efficiency is increasing yearly and presents a distribution of “high in the eastern region and low in the western region”. Therefore, all provinces need to vigorously carry out clean replacement work to enhance the coordinated development of carbon emission reduction in the thermal power industry and the level of regional economic development.
1. Introduction
In order to reduce greenhouse gas emissions, China has proposed “two alternatives”, namely “electricity substitution” and “clean energy substitution”. China is vigorously developing the replacement of fossil energy with clean energy, taking a low-carbon and green development path, and the country has proposed the goals of reaching a “carbon peak” by 2030 and becoming “carbon neutral” by 2060. At present, 37.6% of China’s overall carbon emissions come from the power generation industry, of which thermal power carbon emissions are the main source of carbon emissions. Wang, Y. et al. [1] found that the possibility of reducing carbon emissions by optimizing the power generation structure is decreasing. Duan, N. et al. [2] found that the energy efficiency of the thermal power industry is affected by the performance of carbon dioxide emissions. The efficiency of carbon emission reduction and the achievement of carbon emission reduction targets are mainly based on the development of the thermal power industry [3,4,5,6]. Therefore, replacing thermal power generation with clean energy will become an important way to achieve the “carbon peak and neutrality” goal. China has a large land area and abundant resources, leading to large differences in the development of different provinces. Against the background of clean energy substitution, the efficiency measurement of thermal power carbon emissions is no longer simply a matter of pure input and output efficiency; rather, it considers the common influence of multiple factors and clarifies the coordination relationship between them.
The main measurement methods for thermal power carbon emission efficiency are concentrated on two approaches: single-factor and multi-factor. Yamaji, K. et al. [7] converted carbon dioxide productivity into the ratio of the gross national product to total carbon emissions to measure carbon emission efficiency. Mielnik, O. et al. [8] measured the carbon emission efficiency by comparing the carbon dioxide emissions produced by each unit of energy consumption in different provinces. Sun J W [9] used the carbon emissions per unit GDP growth as an evaluation index of carbon emission efficiency. Using single-factor indicators to evaluate carbon emission efficiency is easy to understand and easy to operate, but it also has obvious shortcomings. Therefore, many researchers have used multi-factor indicators to measure carbon emission efficiency. Sheng, L.A. et al. [10] pointed out that the change of carbon emission efficiency is determined by multiple influencing factors. Wang, K. et al. [11] used Slacks-based measures and window analysis methods to find that the carbon emission efficiency and potential are related to resources. Xu, S.-C. et al. [12] used the logarithmic average two-dimensional West Asia index decomposition method to decompose the influencing factors of carbon emission efficiency into energy structure, energy intensity, economic structure and economic output effect. The Data Envelopment Analysis (DEA) method can be applied in conjunction with other models to measure the carbon emission efficiency of various provinces in China [13,14]. Gao, P. et al. [15] used the super efficiency slack-based model (SBM) to measure carbon emission efficiency under specific carbon emission and direct carbon emission scenarios. Cheng, Z. et al. [16] used an improved non-radial directional distance function (NDDF) in the process of the dynamic evolution analysis of carbon emission efficiency and constructed a new meta-boundary total factor carbon emission efficiency index (TCEI). The stochastic frontier analysis (SFA) model is widely used for analyzing the impact of other influencing factors on carbon emission efficiency [17,18], among which Wang, L. et al. [19] measured the carbon emission efficiency of multiple countries with the minimum distance method combined with SFA.
With the popularization of multi-factor carbon emission efficiency measurement methods, Yan, D. et al. [20] found that the electric power carbon emission efficiency is spatially different and is determined by a variety of influencing factors. There are many works that have found a great relationship between energy efficiency, environmental efficiency, ecological benefits and the use of clean energy and carbon emission reduction [21,22,23,24]. Increasing numbers of researchers are tending to explore the coupling and coordination relationship between carbon emission efficiency and its influencing factors. Zhou, D. et al. [25] made policy recommendations for a coordinated development between provinces and cities based on the coupling and coordination path between China’s carbon emission efficiency and industrial structure. Chen, J. et al. [26] analyzed the coupling mechanism between carbon emissions and the ecological environment and identified the key factors that affect the degree of coordination. Shen, L. et al. [27] found that the coordinated development of social economy and carbon emissions is very important for the sustainable development of cities. Song, Q. et al. [28] constructed a coordinated model of urbanization and carbon emissions to explore low-carbon development models in the urban phase. Some scholars [29,30] analyzed the coordinated development model between carbon emissions and various influencing factors, such as the economy, environment, energy, technology, etc., and then gave the spatial characteristics of carbon emissions among different provinces. With the deepening of the research, Chai, J.X. et al. [31] found that the determination of the weights between the research indicators has a decisive effect on the analysis of coupling and coordination. Li, W.W. et al. [32] used the entropy weighting method to construct an objective coupling and coordination analysis method to analyze the urban economy, society and environment. Hou, C. and Wang, P. et al. [33,34] combined the coupling coordination with the entropy method, the non-dimensional method and the principal component analysis method to establish a coupling coordination model.
This paper aims to analyze the production frontier before analyzing the coupling relationship between thermal power carbon emission efficiency and its influencing factors. At present, Andor, M. et al. [35] found that Data Envelopment Analysis (DEA) and Stochastic Frontier Analysis (SFA) are the most representative methods for this. Many scholars [36,37,38,39] have found that the DEA method did not take random factors into consideration when calculating the efficiency, and that the calculation would be affected by the quality of the data. Therefore, the statistical data of carbon emission efficiency may produce large errors. The SFA method not only considers a variety of factors that lead to deviation from the frontier but also conducts a statistical analysis of the degree of interference of random factors [40,41,42], which can provide data support for the subsequent coupling and coordination analysis. Therefore, this paper drew on the use of the SFA method in previous studies to estimate carbon emission efficiency. For the first time in the efficiency calculation, the substitution effect of clean energy and various other effects are combined as random interference items. In previous studies, the weights of subsystems in the coupling and coordination analysis were all equally distributed. In this paper, the influence degree of the random interference items in the SFA method was transformed into the subsystem weights in the coupling and coordination analysis. Finally, the degree of coupling and coordination between the influencing factors of thermal power carbon emission efficiency in different provinces is determined.
The fundamental way for China to achieve carbon peaks in 2030 and carbon neutrality in 2060 is to reduce carbon dioxide emissions. Based on the background and significance of the research, this article first puts forward the questions that need to be studied in combination with the research that has been completed so far. After that, the main theoretical methods used are introduced, including the SFA analysis method and the coupling coordination analysis method. Next, the SFA input and output factors and influencing factors are analyzed. Then, this paper uses the SFA efficiency measurement method, considering the combined impact of the clean energy substitution effect and other factors, to calculate the thermal power carbon emission efficiency of 30 provinces and municipalities (autonomous regions) in China from 2009 to 2018. Afterwards, based on the regional spatial characteristics of thermal power carbon emission efficiency and the estimation of technical inefficiency, the influencing factor indicators of the coupling and coordination analysis and the weights of the indicator subsystems are determined. Then, a coupling analysis of the influencing factors of thermal power carbon emission efficiency is carried out for each province. Finally, this article presents the degree and difference of coordinated development in various regions and clarifies the links of coordinated development between regions, thereby providing a theoretical basis for the planning of inter-provincial power generation structure and the proposal and implementation of carbon emission reduction policies. To better explain the content of the article, the chapter structure is shown in Figure 1.
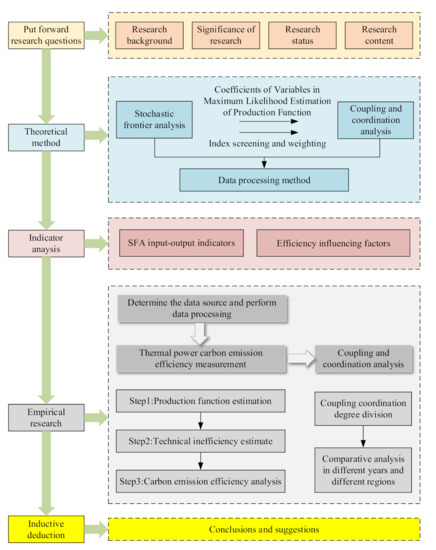
Figure 1.
The structure of the paper.
2. Materials and Methods
2.1. Stochastic Frontier Analysis
Stochastic Frontier Analysis (SFA) is a method of measuring production efficiency based on input and output proposed by Aigner, D., Meeusen, W. and others in 1977 [43,44]. This method assumes that individual producers cannot reach the production frontier due to the interference of random disturbance items and technical inefficiency items. The general model is
where represents the output of the i-th product in period t, represents the production factor input of the i-th product in period t, represents the parameter to be estimated, and indicates that the production function represents the forefront of producer technology. The random disturbance item and the technical inefficiency item , respectively, represent the interference of the i-th product in period t. ρv and ρu are the variances of the normal distribution. represents the total impact of the technical inefficiency item on production, is the parameter to be estimated, and represents the degree of impact of the i-th product on output in period t. The most commonly used method is to express the technical efficiency by the ratio of the observable output to the output of the corresponding random frontier. The technical efficiency (TE) is the ratio of the average actual production efficiency to the average maximum production efficiency.
Based on the related research results, Battese et al. [45] improved the above model and applied it to the research and development of panel data, improving the SFA method. At the same time, all the factors that may affect efficiency and the production boundary of an enterprise can be estimated at the same time, which expands the scope of application of this method. In order to be more intuitive and concise, they proposed the trans-logarithmic production function, the general form of which is
where , , , respectively, represent the capital, labor and resources invested in the i-th product in period t, is the compound residual of the equation, with a variance of , and the definition is ; the closer is to 1, the more the actual deviations in production efficiency are caused by technical inefficiencies.
2.2. Coupling and Coordination Analysis
With the development of social diversification, there are complex, diverse and interconnected coupling relationships between different systems, such as resources, economy and ecology. The analysis of the overall equilibrium level between different systems has also been incorporated into the content of the regional comprehensive evaluation. Therefore, the analysis of coupling and coordination has become an effective evaluation tool. The formula of the traditional dual coupling coordination model is as follows:
where X and Y represent two influencing factor subsystems’ comprehensive evaluation value, P is their coupling degree, T represents their comprehensive development level, represents their importance, usually , and D represents the coupling of their degree of coordination.
Through the summary of various documents, the calculation of the efficiency of firepower carbon emissions is affected by multiple influencing factors. Therefore, a multi-coupled coordination analysis model is introduced to analyze the degree of coordination. The specific model is as follows:
where represents the comprehensive evaluation value of n subsystems. In this paper, it specifically refers to the factors with larger coefficients obtained by screening the coefficients of the variables in the maximum likelihood estimation of the production function after analyzing all the influencing factors of thermal power carbon emission efficiency through the SFA method. , respectively, represent their importance to the system. Normally, it is defined as . When calculating the comprehensive development level, if the definition of each subsystem is equally important, the coordinated development degree formula is simplified, so it is necessary to consider the definition of the weights of influencing factors in the coupling degree analysis process.
This article considers the difference between the SFA model’s method of measuring efficiency and other models—that is, the degree of influence of the factors that affect the carbon emission efficiency can be obtained in the calculation process. The coefficient of each variable in the maximum likelihood estimate of the production function is used to determine the weight of each subsystem, and the coupling coordination degree obtained from this is more in line with the actual level.
In the coupling and coordination analysis, the index construction of influencing factors is subjective, and it is difficult to compare the research results horizontally. The calculated coupling coordination degree is the relative value of a certain year in the current region, which also makes it impossible to compare the results of a region after the expansion year. In order to solve this problem, based on the obtained coupling degree results of different influencing factors, the thermal power carbon emission efficiency coupling coordination degree is classified according to the commonly used coupling coordination degree classification method, and the results of different regions and different years are compared and analyzed. The classification standard is shown in Table 1.

Table 1.
Coupling coordination degree division table.
2.3. Data Processing Method
To eliminate the difference in the magnitude of data between different regions and years, some indicators need to be standardized before the analysis of thermal power carbon emission efficiency and the coupling degree of its influencing factors. According to the difference in the impact of variable factors on the carbon emission efficiency, it can be divided into positive and negative influencing factors, and there will be differences in the standardization process. According to the formula of coupling degree analysis, the comprehensive value of each subsystem should be a non-zero number. If the traditional maximum and minimum standardization method is used, the value will be zero. Therefore, the following improved processing method is adopted:
Positive influence factors:
Negative influence factors:
where represents the value of the j-th index in the i-th year, represents the normalized data result, and represents all the values of the j-th index.
3. Analysis of Indicators
3.1. SFA Input–Output Indicators
Among the input factors, capital K is represented by the thermal power installed capacity, and labor L is represented by the number of people working in thermal power, thermal power production and supply. This paper regards thermal power carbon emissions as the input factor resource C in the production process, and the annual thermal power generation in each region is considered as the output factor in the efficiency measurement model. In order to determine the carbon emissions in the process of thermal power generation, this paper assumes that the carbon emissions produced by the combustion of energy in thermal power generation are all electricity carbon emissions. Based on the emission factor method provided in the “2006 IPCC National Greenhouse Gas Inventory Guidelines” [46], the calculation method of fire carbon emissions is as follows:
where stands for the total emissions of carbon, is the consumption of the i-th energy, is the average low calorific value of the i-th energy, is the energy carbon content of the i-th energy, and is the carbon oxidation factor of the i-th energy. The molecular weights of carbon dioxide and carbon are 44 and 12, respectively.
According to general assumptions, it can be considered that the emission factor of a certain energy type is constant during use. Therefore, this method, as an indirect method of measuring carbon dioxide emissions, does not represent the true carbon dioxide emissions. Energy consumption mainly includes eight types of energy: coal, crude oil, kerosene, gasoline, coke, diesel, fuel oil and natural gas.
3.2. Efficiency Influencing Factors
This paper chooses to analyze seven influencing factors—energy consumption structure, clean energy substitution effect, economic scale, population scale, industrial structure, power consumption intensity and urbanization level—and use them as the technical inefficiency items in the SFA production function. The following is a detailed analysis of the meaning and calculation formula of these influencing factors:
- Energy consumption structure
The carbon emissions produced by different energy sources in electricity production vary widely. Coal is the main raw material in thermal power generation, and its combustion and utilization are the main sources of carbon emissions in power production, so the energy consumption structure directly affects the carbon emission efficiency of thermal power. This paper chooses the proportion of coal consumption to the total energy consumption in power production to represent the energy consumption structure.
- 2.
- Clean energy substitution effect
Clean energy refers to energy that does not emit pollutants and can be directly used for production and life. It includes non-fossil energies such as nuclear energy, wind energy, solar energy, hydropower and biomass energy. As an inevitable requirement of the energy transition, clean energy substitution not only refers to the transition from low-density energy consumption to high-density, but also to the decarbonization process of energy consumption from high carbon emissions to zero carbon emissions. Carbon reduction in energy production and the replacement of thermal power generation with clean energy power generation will reduce the total carbon emissions in the process of thermal power generation, thereby effectively improving the carbon emission efficiency of thermal power. Therefore, this paper chooses the proportion of clean energy power generation and thermal power generation to represent the clean energy substitution effect.
- 3.
- Economic scale
With the rapid expansion of China’s economy, carbon emissions are increasing every year due to the continuous increase in energy consumption. Economic development cannot be at the cost of the environment, so the balanced relationship between the two is an important prerequisite for sustainable development. Therefore, in the research of thermal power carbon emission efficiency, GDP per capita is used to represent the size of the economy.
- 4.
- Population size
In recent years, with the continuous growth of the population, the consequent energy demand, transportation demand, daily necessities demand and cultural goods demand have gradually increased. The growth of these demands has directly driven the growth of carbon emissions. China is a populous country, and the impact of population size on the carbon emission efficiency of thermal power cannot be ignored.
- 5.
- Industrial structure
At present, China is undergoing a comprehensive industrial revolution. The industrial structure has gradually shifted to a higher level, with the center of gravity gradually shifting from primary industry to secondary and tertiary industries. Secondary industry mainly includes most of the manufacturing industries in life, and these production activities will increase carbon emissions. Therefore, this article selects the ratio of the output value of tertiary industry to the output value of secondary industry to represent the change in the industrial structure.
- 6.
- Power consumption intensity
Electricity consumption intensity is the electric energy consumed by a certain area to produce a unit of GDP in a certain period of time, and it reflects the efficiency of electric energy utilization in that area. This paper takes the ratio of total power consumption to total GDP as the technical inefficiency item included in the SFA production function as power consumption intensity.
- 7.
- Urbanization level
The process of urbanization is generally accompanied by the construction and trans-formation of a large amount of infrastructure, and the gradual large-scale agglomeration of population in cities, which leads to an increasing demand for electricity, and the amount of carbon emissions generated by production activities will gradually increase substantially. Therefore, the level of urbanization can be used as an influencing factor for the carbon emission efficiency of thermal power generation. This paper takes the proportion of urban population in each region as the standard for the urbanization rate, where the urban population refers to the population living in cities and market towns, which are mainly classified according to the people’s place of residence and the industry they are engaged in.
Based on the above analysis and the explanation of each influencing factor, this article constructs the influencing factor index table as shown in Table 2.
Table 2.
Influencing factors index table.
4. Empirical Analysis Results
4.1. Data Source and Processing
China’s clean energy development began in the 21st century, and the “Renewable Energy Law of the People’s Republic of China” was implemented in 2006. With the advancement of science and technology, clean energy has developed rapidly. Through data collection, it is found that the relevant data on clean energy in various regions of China after 2009 are relatively complete. In order to ensure the reliability of the research, the data from nearly 10 years after 2009 were selected for research. Based on the previous calculation method and indicator system construction of thermal power carbon emission efficiency, considering the availability of data, this paper selected the data of 30 provinces and municipalities (autonomous regions) in China from 2009 to 2018 for 10 years for analysis. All variables and data are from the “China Statistical Yearbook”, “China Electric Power Statistical Yearbook”, “China Energy Statistical Yearbook”, “Provincial Greenhouse Gas Inventory Compilation Guide” and “China Industrial Statistical Yearbook” [47,48,49,50,51].
After collecting the required data, use Formulas (14) and (15) to process the collected data based on the characteristics of the indicators. According to the SFA production function model, we used Frontier4.1 software to filter and process the collected data from 30 provinces and municipalities (autonomous regions) and obtain statistical data on the thermal power carbon emission efficiency and its influencing factors in various regions in the past 10 years. In the paper, the environment in which the software was run used a 64-bit Win11 operating system. The specific results are shown in the following figures and tables.
4.2. Calculation of Carbon Emission Efficiency of Thermal Power
4.2.1. Production Function Estimation
In this paper, the maximum likelihood estimation results after the efficiency measurement using a software are shown in Table 3.
Table 3.
Maximum likelihood estimates of the production function.
According to the results in Table 2, the coefficients of variables other than LnK * LnL in the model are all statistically significant, and most of them pass the t-test at the 1% significance level. The positive coefficients are the capital variable K and the labor variable L, indicating that the increase of the two is conducive to the improvement of the carbon emission efficiency of thermal power. The advancement in technical efficiency, the increase in the installed capacity thermal power and the increase in the number of people in related industries represent the expansion of thermal power investment. The increase in capital and labor has a positive impact on the improvement of carbon emission efficiency, which is consistent with the actual situation. Meanwhile, the negative coefficient is the input factor resource variable C, which shows that the increase in the carbon emissions of thermal power will inhibit the improvement of thermal power carbon emission efficiency. This paper regards the carbon emissions generated by the various energy sources for the production of thermal power as the carbon emissions of thermal power, and the increase in this number has a negative impact on the efficiency of carbon emissions, which is consistent with the actual situation. The value of is 0.8022, which passes the maximum likelihood test, indicating that the deviation of the carbon emission efficiency of thermal power in most provinces from the frontier is caused by technical inefficiency. Therefore, it was advisable in this paper to use the SFA method to measure the carbon emission efficiency of thermal power generation.
4.2.2. Technical Inefficiency Estimate
The maximum likelihood estimates of the technical inefficiency term are shown in Table 4.
Table 4.
Maximum likelihood estimates of technical inefficiency.
It can be seen from Table 3 that most of the influencing factors are significantly effective. Of these, the maximum likelihood estimates of the five influencing factors of energy consumption structure, economic scale, population size, power consumption intensity and urbanization level are negative. This shows that the impact of these influencing factors on the carbon emission efficiency of thermal power plants is negative. The more obvious roles are the intensity of power consumption and the level of urbanization. Power consumption intensity can roughly indicate the connection between economic development and power production in a certain area. The increase in power consumption intensity will indicate that the same level of economic development will consume more power, which will bring about an increase in carbon emissions and suppress the efficiency of carbon emissions. The level of urbanization can reflect the degree of construction in a certain area. The higher the degree of urbanization, the greater the demand for electricity and other energy sources in the region, which in turn will increase the carbon emissions of thermal power generation and inhibit its efficiency. The maximum likelihood estimates of clean energy substitution effects and the industrial structure are positive. This shows that as clean energy power generation replaces thermal power generation and the industrial structure gradually shifts to a higher level, the thermal power carbon emission efficiency improves. The impact of the clean energy substitution effect is stronger, because clean substitution directly affects carbon dioxide emissions and improves carbon emission efficiency. Therefore, it is advisable to incorporate the clean substitution effect into the factors affecting the thermal power carbon emission efficiency in this paper.
4.2.3. Carbon Emission Efficiency Analysis
In order to more intuitively reflect the regional distribution characteristics of thermal power carbon emission efficiency, the 30 provinces and municipalities (autonomous regions) in China are divided into eastern, northeastern, central and western regions based on their geographic locations, which are represented by “E, NE, C and W”. Using the trans-logarithmic production function to measure the thermal power carbon emission efficiency, the carbon emission efficiency of thermal power generation in various regions in the past ten years can be obtained. The results are shown in Table 5.
Table 5.
Summary table of carbon emission efficiency.
Comparing the average thermal power carbon emission efficiency of the four regions with the national average efficiency, the results are shown in Figure 2, above. According to the results, the average carbon emission efficiency of China’s 30 provinces and municipalities (autonomous regions) in the 10 years from 2009 to 2018 is 0.819, which is a relatively high level and shows a fluctuating upward trend. According to the regional division, the distribution of efficiency presents a certain spatial aggregation characteristic. The average efficiency of the eastern coastal area is 0.900, followed by the central economic development region at 0.871, which is higher than the nationwide mean. The average efficiencies of the old industrial clusters in the northeast and the western developed areas are 0.780 and 0.717, respectively, which are both lower than the nationwide mean. At the provincial level, economically developed areas such as Zhejiang, Jiangsu and Guangdong are more efficient. These provinces have relatively high levels of economic development and urbanization, and the development rate of clean substitution and electric power substitution is also at a leading level. They not only vigorously develop the economy, but are also concentrating on the protection of the ecological environment and strictly implementing the prevention and control measures of carbon dioxide and other pollutants, which is conducive to improving the carbon emission efficiency in the process of thermal power generation. However, the three provinces of Heilongjiang, Jilin and Liaoning in the old industrial clusters and in western regions such as Sichuan, Yunnan, Qinghai and Ningxia have a low carbon emission efficiency. The level of economic development in these provinces has not been high, and the importance of environmental protection has not been high. In general, the thermal power carbon emission efficiency decreases in the following order: east, northeast, center and west. There are big differences between provinces, and the reasons for the differences are also bound up with the changes in the resources and the environment, the human environment and the policies and regulations between regions. Therefore, the coupling relationship between the influencing factors of thermal power carbon emission efficiency in various provinces needs to be further studied.
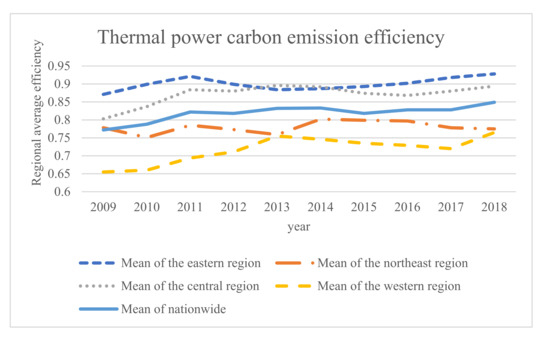
Figure 2.
Thermal power carbon emission efficiency trend.
4.3. Coupling and Coordination Analysis
According to the previous estimation of the technical inefficiency of thermal power carbon emission efficiency, it can be found that the intensity of electricity consumption, the level of urbanization and the clean energy substitution effect have a greater impact on the deviation of efficiency. Based on the previous hypothesis, the absolute value of the estimated result of the coefficient value of the technical inefficiency term can represent its weight. Calculating according to formula (10~13), we can obtain weights of 0.21, 0.35 and 0.44, respectively. After normalizing the data according to the influencing factors in the direction that promotes efficiency improvement, combined with the size of its weight, the coupling and coordination degree of thermal power carbon emission efficiency in each province in 10 years is finally obtained. Since the data from 10 years are not clear enough to compare, the data of the coupling coordination degree every two years are selected for comparison. At the same time, in order to show the spatio-temporal characteristics of the degree of coupling and coordination, the average value of each region is compared and analyzed. The final result is shown in Figure 3.
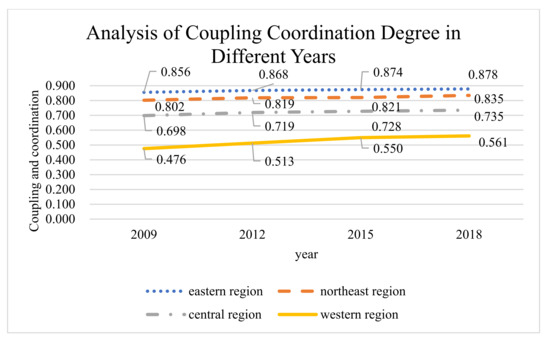
Figure 3.
Analysis of the degree of coupling and coordination in different regions.
According to the division rules of the coupling coordination degree in Table 1, the coupling coordination degree of each region can be obtained within 10 years. In order to see the changes in the degree of coupling and coordination in different regions more intuitively, the degree of coupling and coordination in different regions can be drawn on the data map. Taking into account the number of pictures, this paper selects the coupling coordination degree every two years to draw a data map to analyze the general trend of changes. The results are shown in Figure 4, below.
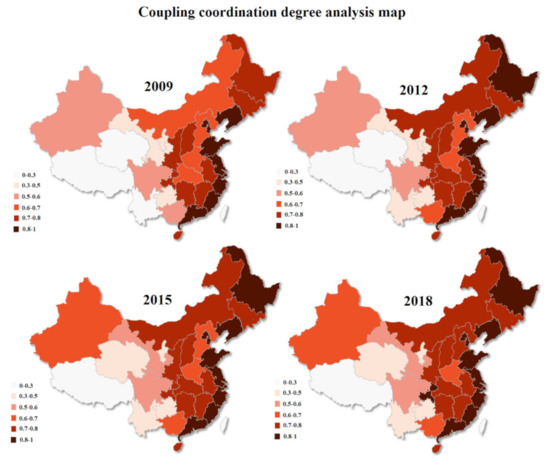
Figure 4.
Coupling coordination degree analysis map.
In general, most areas of China have improved the coordination level between their thermal power carbon emission efficiency and power consumption intensity, urbanization level and clean substitution effect in the past 10 years, and the degree of coupling coordination has shown the following pattern: “eastern region > northeastern region > central region > western region”. In the four typical years, the eastern coastal areas and Beijing, Tianjin and Liaoning have been in a high-level coupling stage, with a highly coordinated degree of coupling. These areas are economically developed and resource-rich, and clean energy can be used efficiently in these regions; in addition, the development of thermal power carbon emission efficiency is highly coordinated with the power consumption intensity, urbanization level and clean substitution effect. The central region, the northeastern region and Xinjiang, in the western region, are in the appropriate stage. Xinjiang has gradually developed from the degree of coupling coordination to being on the verge of coordination and to primary coordination. Heilongjiang, Hebei, Anhui and other regions have gradually developed from primary coordination to intermediate coordination. Inner Mongolia and Chongqing have gradually developed from primary coordination to high coordination. Although Xinjiang is rich in clean energy, it cannot be highly coordinated with its development level. The carbon emission efficiency of coal-fired power in Heilongjiang and other places has increased, but the development of its coordination degree has lagged. Except for Xinjiang, most of the western regions are in the stage of antagonism and low-level coupling. Qinghai went from severe to moderate disorder, and Gansu went from moderate to near disorder. Although these two regions are rich in clean energy, their utilization level is not high, and their impact on the carbon emission efficiency of thermal power is poorly coordinated.
5. Conclusions and Suggestions
Aiming at addressing the lack of research on the thermal power carbon emission efficiency in various regions of China against the background of clean energy substitution, this paper adopts the SFA method to calculate the thermal power carbon emission efficiency in 30 provinces and municipalities (autonomous regions) in China from 2009 to 2018. According to the results of the SFA method, the weights of the influencing factors of the coupling analysis are determined, and the degree of coupling and coordination of the three influencing factors of thermal power carbon emission efficiency and power consumption intensity, urbanization level and clean energy substitution effect is analyzed. The main conclusions are as follows.
First, through the calculation of the thermal power carbon emission efficiency of China’s 30 provinces and municipalities (autonomous regions) in the past 10 years, it can be seen that the deviation of efficiency from the frontier is caused by technical inefficiency. For the improvement of thermal power carbon emission efficiency, the energy consumption structure, economic scale, population size, power consumption intensity and urbanization level play negative roles, and the clean substitution effect and industrial structure play positive roles.
Second, the carbon emission efficiency of China’s thermal power has been at a relatively high level and has shown a trend of volatility, increasing year by year. Through regional statistics, it can be found that China’s thermal power carbon emission efficiency has obvious spatial differences and shows a decreasing trend in the east, northeast, center and west.
Third, the intensity of power consumption, the level of urbanization and the replacement effect of clean energy have a greater impact on the deviation of the carbon emission efficiency of thermal power. In the four typical years, the level of coordination has improved, and the following pattern can be seen: “eastern region > northeastern region > central region > western region”.
In response to the above conclusions, it is recommended that all provinces vigorously carry out clean replacement and promote the coordinated development of thermal power carbon emission efficiency. This can be implemented in terms of the following aspects.
On the one hand, in order to better carry out clean energy substitution and further optimize the energy system, it is necessary not only to accelerate the clean use of coal and other fossil energy in energy production and accelerate the withdrawal of high-emission thermal power units, but also to promote the rapid development of new energy sources and guide the incremental demand for clean energy in terms of energy production and consumption.
On the other hand, various provinces must not only adapt measures to local conditions and vigorously carry out electricity substitution and clean energy substitution in multiple energy-using fields, such as industry, transportation and agriculture, but also improve energy utilization efficiency at the technical and market levels to optimize the allocation of energy resources. The inter-provincial exchanges of talents and technologies should be strengthened, and the development differences between regions should be narrowed so that the carbon emission efficiency of thermal power can develop in an all-round and coordinated manner, and the sustainable development of the “two alternatives” should be promoted.
Author Contributions
Conceptualization, Y.L. and D.N.; methodology, Y.L.; software, Y.L.; validation, Y.L. and D.N.; formal analysis, Y.L.; investigation, Y.L.; resources, Y.L.; data curation, D.N.; writing—original draft preparation, Y.L.; writing—review and editing, Y.L.; visualization, D.N.; supervision, D.N.; project administration, Y.L.; funding acquisition, D.N. All authors have read and agreed to the published version of the manuscript.
Funding
This research was funded by the 2018 Key Projects of Philosophy and Social Sciences Research, Ministry of Education, China (18JZD032), and the National Key Research and Development Program of China (2020YFB1707801).
Institutional Review Board Statement
Not applicable.
Informed Consent Statement
Informed consent was obtained from all subjects involved in the study.
Data Availability Statement
All data, models or code that support the findings of this study are available from the corresponding author upon reasonable request.
Acknowledgments
The authors would like to thank the editor and anonymous reviewers for their valuable comments.
Conflicts of Interest
The authors declare no conflict of interest.
References
- Wang, Y.; Yao, X.; Yuan, P. Strategic Adjustment of China’s Power Generation Capacity Structure Under the Constraint of Carbon Emission. Comput. Econ. 2015, 46, 421–435. [Google Scholar] [CrossRef]
- Duan, N.; Guo, J.-P.; Xie, B.-C. Is there a difference between the energy and CO2 emission performance for China’s thermal power industry? A bootstrapped directional distance function approach. Appl. Energy 2016, 162, 1552–1563. [Google Scholar] [CrossRef]
- Liu, L.; Zong, H.; Zhao, E.; Chen, C.; Wang, J. Can China realize its carbon emission reduction goal in 2020: From the perspective of thermal power development. Appl. Energy 2014, 124, 199–212. [Google Scholar] [CrossRef]
- Dai, L.; Wang, M. Study on the influence of carbon emission constraints on the performance of thermal power enterprises. Environ. Sci. Pollut. Res. 2020, 27, 30875–30884. [Google Scholar] [CrossRef]
- Lou, L.; Mu, H.; Chen, X.; Li, H. The carbon footprint analysis of thermal power plants. Adv. Mater. Res. 2013, 807, 814–821. [Google Scholar] [CrossRef]
- Grant, D.; Running, K.; Bergstrand, K.; York, R. A sustainable “building block”?: The paradoxical effects of thermal efficiency on US power plants’ CO2 emissions. Energy Policy 2014, 75, 398–402. [Google Scholar] [CrossRef]
- Yamaji, K.; Matsuhashi, R.; Nagata, Y.; Kaya, Y. A study on economic measures for CO2 reduction in Japan. Energy Policy 1993, 21, 123–132. [Google Scholar] [CrossRef]
- Mielnik, O.; Goldemberg, J. Communication The evolution of the “carbonization index” in developing countries. Energy Policy 1999, 27, 307–308. [Google Scholar] [CrossRef]
- Sun, J.W. The decrease of CO2 emission intensity is decarbonization at national and global levels. Energy Policy 2005, 33, 975–978. [Google Scholar] [CrossRef]
- Liu, S.; Xia, X.H.; Tao, F.; Chen, X.Y. Assessing Urban Carbon Emission Efficiency in China: Based on the Global Data Envelopment Analysis. Energy Procedia 2018, 152, 762–767. [Google Scholar] [CrossRef]
- Wang, K.; Wu, M.; Sun, Y.; Shi, X.; Sun, A.; Zhang, P. Resource abundance, industrial structure, and regional carbon emissions efficiency in China. Resour. Policy 2019, 60, 203–214. [Google Scholar] [CrossRef]
- Xu, S.-C.; He, Z.-X.; Long, R.-Y. Factors that influence carbon emissions due to energy consumption in China: Decomposition analysis using LMDI. Appl. Energy 2014, 127, 182–193. [Google Scholar] [CrossRef]
- Zhong, J. Biased Technical Change, Factor Substitution, and Carbon Emissions Efficiency in China. Sustainability 2019, 11, 955. [Google Scholar] [CrossRef] [Green Version]
- Wang, S.; Zhang, L.; Dang, J. Provincial Carbon Emissions Efficiency and Its Influencing Factors in China. Sustainability 2019, 11, 2355. [Google Scholar] [CrossRef] [Green Version]
- Gao, P.; Yue, S.; Chen, H. Carbon emission efficiency of China’s industry sectors: From the perspective of embodied carbon emissions. J. Clean. Prod. 2021, 283, 124655. [Google Scholar] [CrossRef]
- Cheng, Z.; Li, L.; Liu, J.; Zhang, H. Total-factor carbon emission efficiency of China’s provincial industrial sector and its dynamic evolution. Renew. Sustain. Energy Rev. 2018, 94, 330–339. [Google Scholar] [CrossRef]
- Zhang, C.; Chen, P. Industrialization, urbanization, and carbon emission efficiency of Yangtze River Economic Belt-empirical analysis based on stochastic frontier model. Environ. Sci. Pollut. Res. 2021. [Google Scholar] [CrossRef] [PubMed]
- Jin, T.; Kim, J. A comparative study of energy and carbon efficiency for emerging countries using panel stochastic frontier analysis. Sci. Rep. 2019, 9, 6647. [Google Scholar] [CrossRef]
- Wang, L.; Chen, Z.; Ma, D.; Zhao, P. Measuring Carbon Emissions Performance in 123 Countries: Application of Minimum Distance to the Strong Efficiency Frontier Analysis. Sustainability 2013, 5, 5319–5332. [Google Scholar] [CrossRef] [Green Version]
- Yan, D.; Lei, Y.; Li, L.; Song, W. Carbon emission efficiency and spatial clustering analyses in China’s thermal power industry: Evidence from the provincial level. J. Clean. Prod. 2017, 156, 518–527. [Google Scholar] [CrossRef]
- Grigore, R.; Capat, C.; Hazi, A.; Hazi, G. Eco-efficiency indicators in the evaluation of environmental performance of thermal power plants. Environ. Eng. Manag. J. 2016, 15, 143–149. [Google Scholar] [CrossRef]
- Wang, X.H.; Li, G. Calculation and policy responses of thermal power carbon emissions in 1995–2015 in Shaanxi province, China. Appl. Ecol. Environ. Res. 2019, 17, 8435–8448. [Google Scholar] [CrossRef]
- Wu, C.; Oh, K.; Long, X.; Zhang, J. Effect of installed capacity size on environmental efficiency across 528 thermal power stations in North China. Environ. Sci. Pollut. Res. 2019, 26, 29822–29833. [Google Scholar] [CrossRef] [PubMed]
- Zhu, J.; Sun, H.; Zhou, D.; Peng, L.; Sun, C. Carbon emission efficiency of thermal power in different regions of China and spatial correlations. Mitig. Adapt. Strateg. Glob. Chang. 2020, 25, 1221–1242. [Google Scholar] [CrossRef]
- Zhou, D.; Zhang, X.; Wang, X. Research on coupling degree and coupling path between China’s carbon emission efficiency and industrial structure upgrading. Environ. Sci. Pollut. Res. 2020, 27, 25149–25162. [Google Scholar] [CrossRef]
- Chen, J.; Li, Z.; Dong, Y.; Song, M.; Shahbaz, M.; Xie, Q. Coupling coordination between carbon emissions and the eco-environment in China. J. Clean. Prod. 2020, 276, 123848. [Google Scholar] [CrossRef]
- Shen, L.; Huang, Y.; Huang, Z.; Lou, Y.; Ye, G.; Wong, I.S. Improved coupling analysis on the coordination between socio-economy and carbon emission. Ecol. Indic. 2018, 94, 357–366. [Google Scholar] [CrossRef]
- Song, Q.; Zhou, N.; Liu, T.; Siehr, S.A.; Qi, Y. Investigation of a “coupling model” of coordination between low-carbon development and urbanization in China. Energy Policy 2018, 121, 346–354. [Google Scholar] [CrossRef] [Green Version]
- Lu, C.; Wang, D.; Li, H.; Cheng, W.; Tang, X.; Liu, W. Measurement of the Degree of Coordination in Regard to Carbon Emissions, Economic Development, and Environmental Protection in China. Appl. Sci. 2021, 11, 1750. [Google Scholar] [CrossRef]
- Yan, Q.; Wang, Y.; Li, Z.; Baležentis, T.; Streimikiene, D. Coordinated development of thermal power generation in Beijing-Tianjin-Hebei region: Evidence from decomposition and scenario analysis for carbon dioxide emission. J. Clean. Prod. 2019, 232, 1402–1417. [Google Scholar] [CrossRef]
- Chai, J.; Zhang, L.; Yang, M.; Nie, Q.; Nie, L. Investigation on the Coupling Coordination Relationship between Electric Power Green Development and Ecological Civilization Construction in China: A Case Study of Beijing. Sustainability 2020, 12, 8845. [Google Scholar] [CrossRef]
- Li, W.W.; Yi,, P.T. Assessment of city sustainability-Coupling coordinated development among economy, society and environment. J. Clean. Prod. 2020, 256, 120453. [Google Scholar] [CrossRef]
- Hou, C.; Chen, H.; Long, R. Coupling and coordination of China’s economy, ecological environment and health from a green production perspective. Int. J. Environ. Sci. Technol. 2021. [Google Scholar] [CrossRef]
- Wang, P.; Qi, M.; Liang, Y.; Ling, X.; Song, Y. Examining the Relationship between Environmentally Friendly Land Use and Rural Revitalization Using a Coupling Analysis: A Case Study of Hainan Province, China. Sustainability 2019, 11, 6266. [Google Scholar] [CrossRef] [Green Version]
- Andor, M.; Hesse, F. The StoNED age: The departure into a new era of efficiency analysis? A monte carlo comparison of StoNED and the “oldies” (SFA and DEA). J. Product. Anal. 2014, 41, 85–109. [Google Scholar] [CrossRef] [Green Version]
- Aldamak, A.; Zolfaghari, S. Review of efficiency ranking methods in data envelopment analysis. Measurement 2017, 106, 161–172. [Google Scholar] [CrossRef]
- Cheng, M.; Sun, J.; Bian, J. Reassessment of the DEA Efficient DMUs. In Proceedings of the 10th Euro-Asia Conference on Environment and Corporate Social Responsibility—Tourism, Society and Education Session, Berlin, Germany, 29–30 August 2014; pp. 89–94. [Google Scholar]
- Baten, M.A.; Kasim, M.M.; Rahman, M.M. Cost and Profit Efficiency of Banks: Stochastic Frontier Analysis vs Data Envelopment Analysis. Asia Pac. J. Bus. 2015, 6, 1–16. [Google Scholar]
- Chen, C.; Ren, J.; Tang, L.; Liu, H. Additive integer-valued data envelopment analysis with missing data: A multi-criteria evaluation approach. PLoS ONE 2020, 15, e0234247. [Google Scholar] [CrossRef]
- Malakhov, D.; Pilnik, N. Methods of Estimating of the Efficiency in Stochastic Frontier Models. HSE Econ. J. 2013, 17, 660–686. [Google Scholar]
- Lee, D.; Kim, K.; Choe, C. An analysis of the impact of unionization on efficiency: Evidence from a meta-frontier analysis. Appl. Econ. Lett. 2017, 24, 575–578. [Google Scholar] [CrossRef]
- Wanke, P.; Tsionas, M.G.; Chen, Z.; Antunes, J.J.M. Dynamic network DEA and SFA models for accounting and financial indicators with an analysis of super-efficiency in stochastic frontiers: An efficiency comparison in OECD banking. Int. Rev. Econ. Financ. 2020, 69, 456–468. [Google Scholar] [CrossRef]
- Aigner, D.; Lovell, C.A.K.; Schmidt, P. Formulation and estimation of stochastic frontier production function models. J. Econom. 1977, 6, 21–37. [Google Scholar] [CrossRef]
- Meeusen, W.; van Den Broeck, J. Efficiency estimation from cobb-douglas production functions with composed error. Int. Econ. Rev. 1977, 18, 435–444. [Google Scholar] [CrossRef]
- Battese, G.E.; Coelli, T.J. Frontier production functions, technical efficiency and panel data: With application to paddy farmers in India. J. Product. Anal. 1992, 3, 153–169. [Google Scholar] [CrossRef]
- Paustian, K.; Ravindranath, N.H.; Amstel, A.V. 2006 IPCC Guidelines for National Greenhouse Gas Inventories; International Panel on Climate Change: Geneva, Switzerland, 2006. [Google Scholar]
- Statistics Bureau of the People’s Republic of China. China Industrial Statistical Yearbook, 2009–2018. Available online: http://www.stats.gov.cn/ (accessed on 26 May 2021).
- Statistics Bureau of the People’s Republic of China. Provincial Greenhouse Gas Inventory Compilation Guidelines. Available online: http://www.stats.gov.cn/ (accessed on 26 May 2021).
- Statistics Bureau of the People’s Republic of China. China Statistical Yearbook, 2009–2018. Available online: http://www.stats.gov.cn/ (accessed on 26 May 2021).
- Statistics Bureau of the People’s Republic of China. China Electric Power Statistical Yearbook, 2009–2018. Available online: http://www.stats.gov.cn/ (accessed on 26 May 2021).
- Statistics Bureau of the People’s Republic of China. China Energy Statistical Yearbook, 2009–2018. Available online: http://www.stats.gov.cn/ (accessed on 26 May 2021).
Publisher’s Note: MDPI stays neutral with regard to jurisdictional claims in published maps and institutional affiliations. |
© 2021 by the authors. Licensee MDPI, Basel, Switzerland. This article is an open access article distributed under the terms and conditions of the Creative Commons Attribution (CC BY) license (https://creativecommons.org/licenses/by/4.0/).