Article

Does Business Group Matter for the Relationship between Green Innovation and Financial Performance? Evidence from Chinese Listed Companies

School of Management, Zhejiang University of Technology, Hangzhou 310023, China
*
Author to whom correspondence should be addressed.
Sustainability 2021, 13(23), 13204; https://doi.org/10.3390/su132313204
Submission received: 13 October 2021 / Revised: 11 November 2021 / Accepted: 22 November 2021 / Published: 29 November 2021
(This article belongs to the Special Issue Business Performance and Sustainable Innovation Strategies)

Abstract

:
Green innovation has been an important approach for firms to achieve sustainable development in recent years; however, empirical studies on the relationship between green innovation and corporate performance have delivered mixed results. In particular, business groups (BG), which are a critical organizational form in many economies and are proven to have unique advantages for conducting green innovation, have attracted less scholarly attention. Therefore, in this study, we adopt the perspective of a business group and investigate how green innovation by BG-affiliated firms affects their financial performance, and we also explore the moderating effect of BG’s internal supply chain partnership. Based on a sample of 202 listed manufacturing enterprises in China from 2013 and 2017, the research results show that green innovation significantly improves the financial performance of firms, and this positive effect is more prominent in BG-affiliated firms than in non-BG firms. Further research found that BG-affiliated firms’ supply chain (suppliers and customers) concentration and trust positively moderate the relationship between green innovation and financial performance. This research concerns the particularity of business groups’ green innovation practices in China, which not only contributes to the research on the effect of BG’s green innovation on corporate performance in an emerging market context but also deepens our understanding of the role of its internal supply chain partnership from the perspective of concentration and trust.

1. Introduction

Recent years have witnessed an increase in environmental pollution, land deterioration, and global warming, which has activated people’s desire for a greener and more sustainable development mode. Against this backdrop, green innovation has attracted much attention from scholars, governments, and practitioners. Some studies suggest that green innovation can effectively improve a firm’s performance [1], and the returns generated by green innovation can neutralize the cost of conformance to environmental regulations [2]. Others find that green innovation has no direct or significant impact on a firm’s financial performance. For instance, Olson et al. (2013) revealed that hybrid electric vehicles (green products) did not produce better financial performance than traditional vehicles [3].
The implementation of green innovation is characterized by huge investment, long ROI cycles, myriads of uncertain factors, and typically leads to unsatisfactory results. Despite the number of extant studies discussing the relationship between green innovation and corporate performance, the effect of green innovation on a firm’s financial performance remains inconsistent [4,5,6]. One possible reason is that most extant studies are conducted from a unitary perspective, but green innovation is a complicated behavior, and usually requires an all-round analysis from multiple theoretical views. In addition, existing studies have focused more on examining the effect of green innovation in the context of developed countries [7], but enterprises in emerging economies (e.g., China) encounter obvious differences in areas such as indigenous innovation, resource allocation, and green development compared to advanced economies. The results of green innovation implemented by enterprises in developed countries may not be available for enterprises in emerging markets.
The business group (BG) is an important form of economic organization and plays an irreplaceable role in many economies, especially emerging economies [8,9]. Compared with non-BG firms, BG-affiliated firms not only have higher scale effects and opportunities to capture diversified resources within the business group [10] but also possess greater organizational advantages and cost advantages in facilitating firms’ green innovation and economic growth. Additionally, the implementation of green innovation requires high coordination between procurement, production, and consumption and the full participation of suppliers and customers. Research has found that the supply chain is responsible for 80% of total carbon emissions, except for the focal company [11]. However, most existing studies on green innovation are restricted to the enterprise itself. They neglect the significance and particularity of BG-affiliated firms in green innovation and the role of supply chain partnership within the business group.
To fill in the gaps and unpack the mixed results in the literature, this study investigates the effect of green innovation on corporate financial performance and differentiates BG-affiliated firms and non-BG firms to explore how business groups matter for green innovation practices. Ray and Chaudhuri (2018) demonstrated that business group affiliation has a positive effect on a firm’s sustainable development. However, the extent to which BG-affiliated firms’ green innovation contributes to financial performance remains unexplored [8]. Moreover, this research also investigates the moderating role of BG’s internal supply chain partnership from the perspective of the concentration and trust of both suppliers and customers. Supply chain management has been found to be important for business group affiliation and capability building [12]. We empirically test our hypotheses using a sample of Chinese manufacturing enterprises. The Chinese context is appropriate as it is the largest emerging economy, and the Chinese government has attached high importance to green innovation practices. In addition, manufacturing enterprises are typically involved in green production and innovation, which have a significant influence on their financial performance and sustainable development.
Overall, this study makes two main contributions to the literature. First, unlike existing research on green innovation practices in developed countries, this study takes a sample of Chinese enterprises and explores the effect of BG’s green innovation on financial performance, which extends the research on green innovation to the emerging economies context. Second, this study takes BG’s internal supply chain partnership into account and creatively investigates the moderating role of concentration and trust of suppliers and customers, which contributes to BG’s green innovation research and deepens our understanding of supply chain partnership management.

2. Theoretical Analysis and Hypotheses Development

2.1. Relationship between Green Innovation and Corporate Financial Performance

As Hart (1995) pointed out, enterprises can develop unique competitive advantages by properly coping with their relationship with the natural environment [4]. Enterprises that positively implement environmental management strategies can obtain various valuable resources in the process and apply them to their own organizational ability and competitive advantages [13]. Lee and Min (2015) found that when conducting green innovation, enterprises can better optimize resource allocation and reduce energy consumption, which ultimately enhances corporate financial performance [14].
With the advancement of ecological awareness among people, enterprises in emerging markets are passionate about executing environmental reform strategies. Prior studies have demonstrated that emerging market countries pay special attention to the development of innovative technologies and the spread of new technologies to realize economic development by resolving key ecological problems [15]. Zhu et al. (2012) examined the green practices of Chinese manufacturing enterprises and suggested that green innovation helps enterprises reduce environmental pollution and lower costs by cutting energy and resource consumption, which increases corporate financial benefits creating a “win-win” situation in which environmental protection and economic development go hand in hand [16]. Ray and Chaudhuri (2018) selected a sample of business group affiliations in India, revealing that BG-affiliated companies are more likely to develop environmental and social sustainability strategies than non-BG companies. At the same time, in view of the underdeveloped market and institutions in India, social proximity and embeddedness motivate BG-affiliated companies to take the responsibility to think and act to improve the community and society while carrying out normal business activities [8].
Specifically, the positive impact of green innovation on a firm’s financial performance is as follows. The implementation of green innovation helps firms integrate the concept of environmental protection into the product design and manufacturing process, which strengthens the differentiation advantage and enhances competitiveness [17]. If a firm engaged in green innovation was a pioneer in the industry, it would perform better and develop new markets due to first-mover advantages. Moreover, firms practicing green innovation would produce less pollutants, elevate their corporate image and reputation, and could also avoid high litigation costs and penalties arising from violations of relevant environmental regulations [18]. To this end, we propose the following:
Hypothesis 1 (H1).
Green innovation has a positive impact on corporate financial performance.

2.2. Impact of Green Innovation Carried out by BG-Affiliated Firms and Non-BG Firms on Financial Performance

Green innovation is a high-risk activity that is subjected to a long ROI cycle and requires a higher degree of professional knowledge and capital investment. Compared with non-BG firms, BG-affiliated firms have more advantages in facilitating green innovation.
First, BG-affiliated firms are more likely to acquire internal and external resources, secure financial support for their innovation practices, and overcome market defects [19,20]. Second, BG’s internal labor market helps its affiliated firms reduce the costs of talent recruitment and employee training and can exchange new ideas and experiential knowledge at a lower transaction cost. Such mutual communication and cooperation greatly promote R&D efficiency, thereby enhancing innovation performance [21]. Third, based on the knowledge spillover effect, BG-affiliated firms can enjoy innovation outcomes and achievements conducted by other firms in the same business group and obtain more valuable resources and technologies from BG partner companies [19]. Finally, business groups are typically equipped with specialized intermediaries that are capable of enhancing the innovation competency of BG-affiliated firms and enable them to gain the necessary resources and knowledge for innovation [22]. In addition, BG-affiliated firms have more advantages in the reduction of uncertainties, contract execution, and opportunity identification than non-BG firms [23]. As mentioned above, a firm’s green innovation has high potential to promote financial performance; thus, we propose the following:
Hypothesis 2 (H2).
BG-affiliated firms’ green innovation can better promote a firm’s financial Performance than non-BG firms.

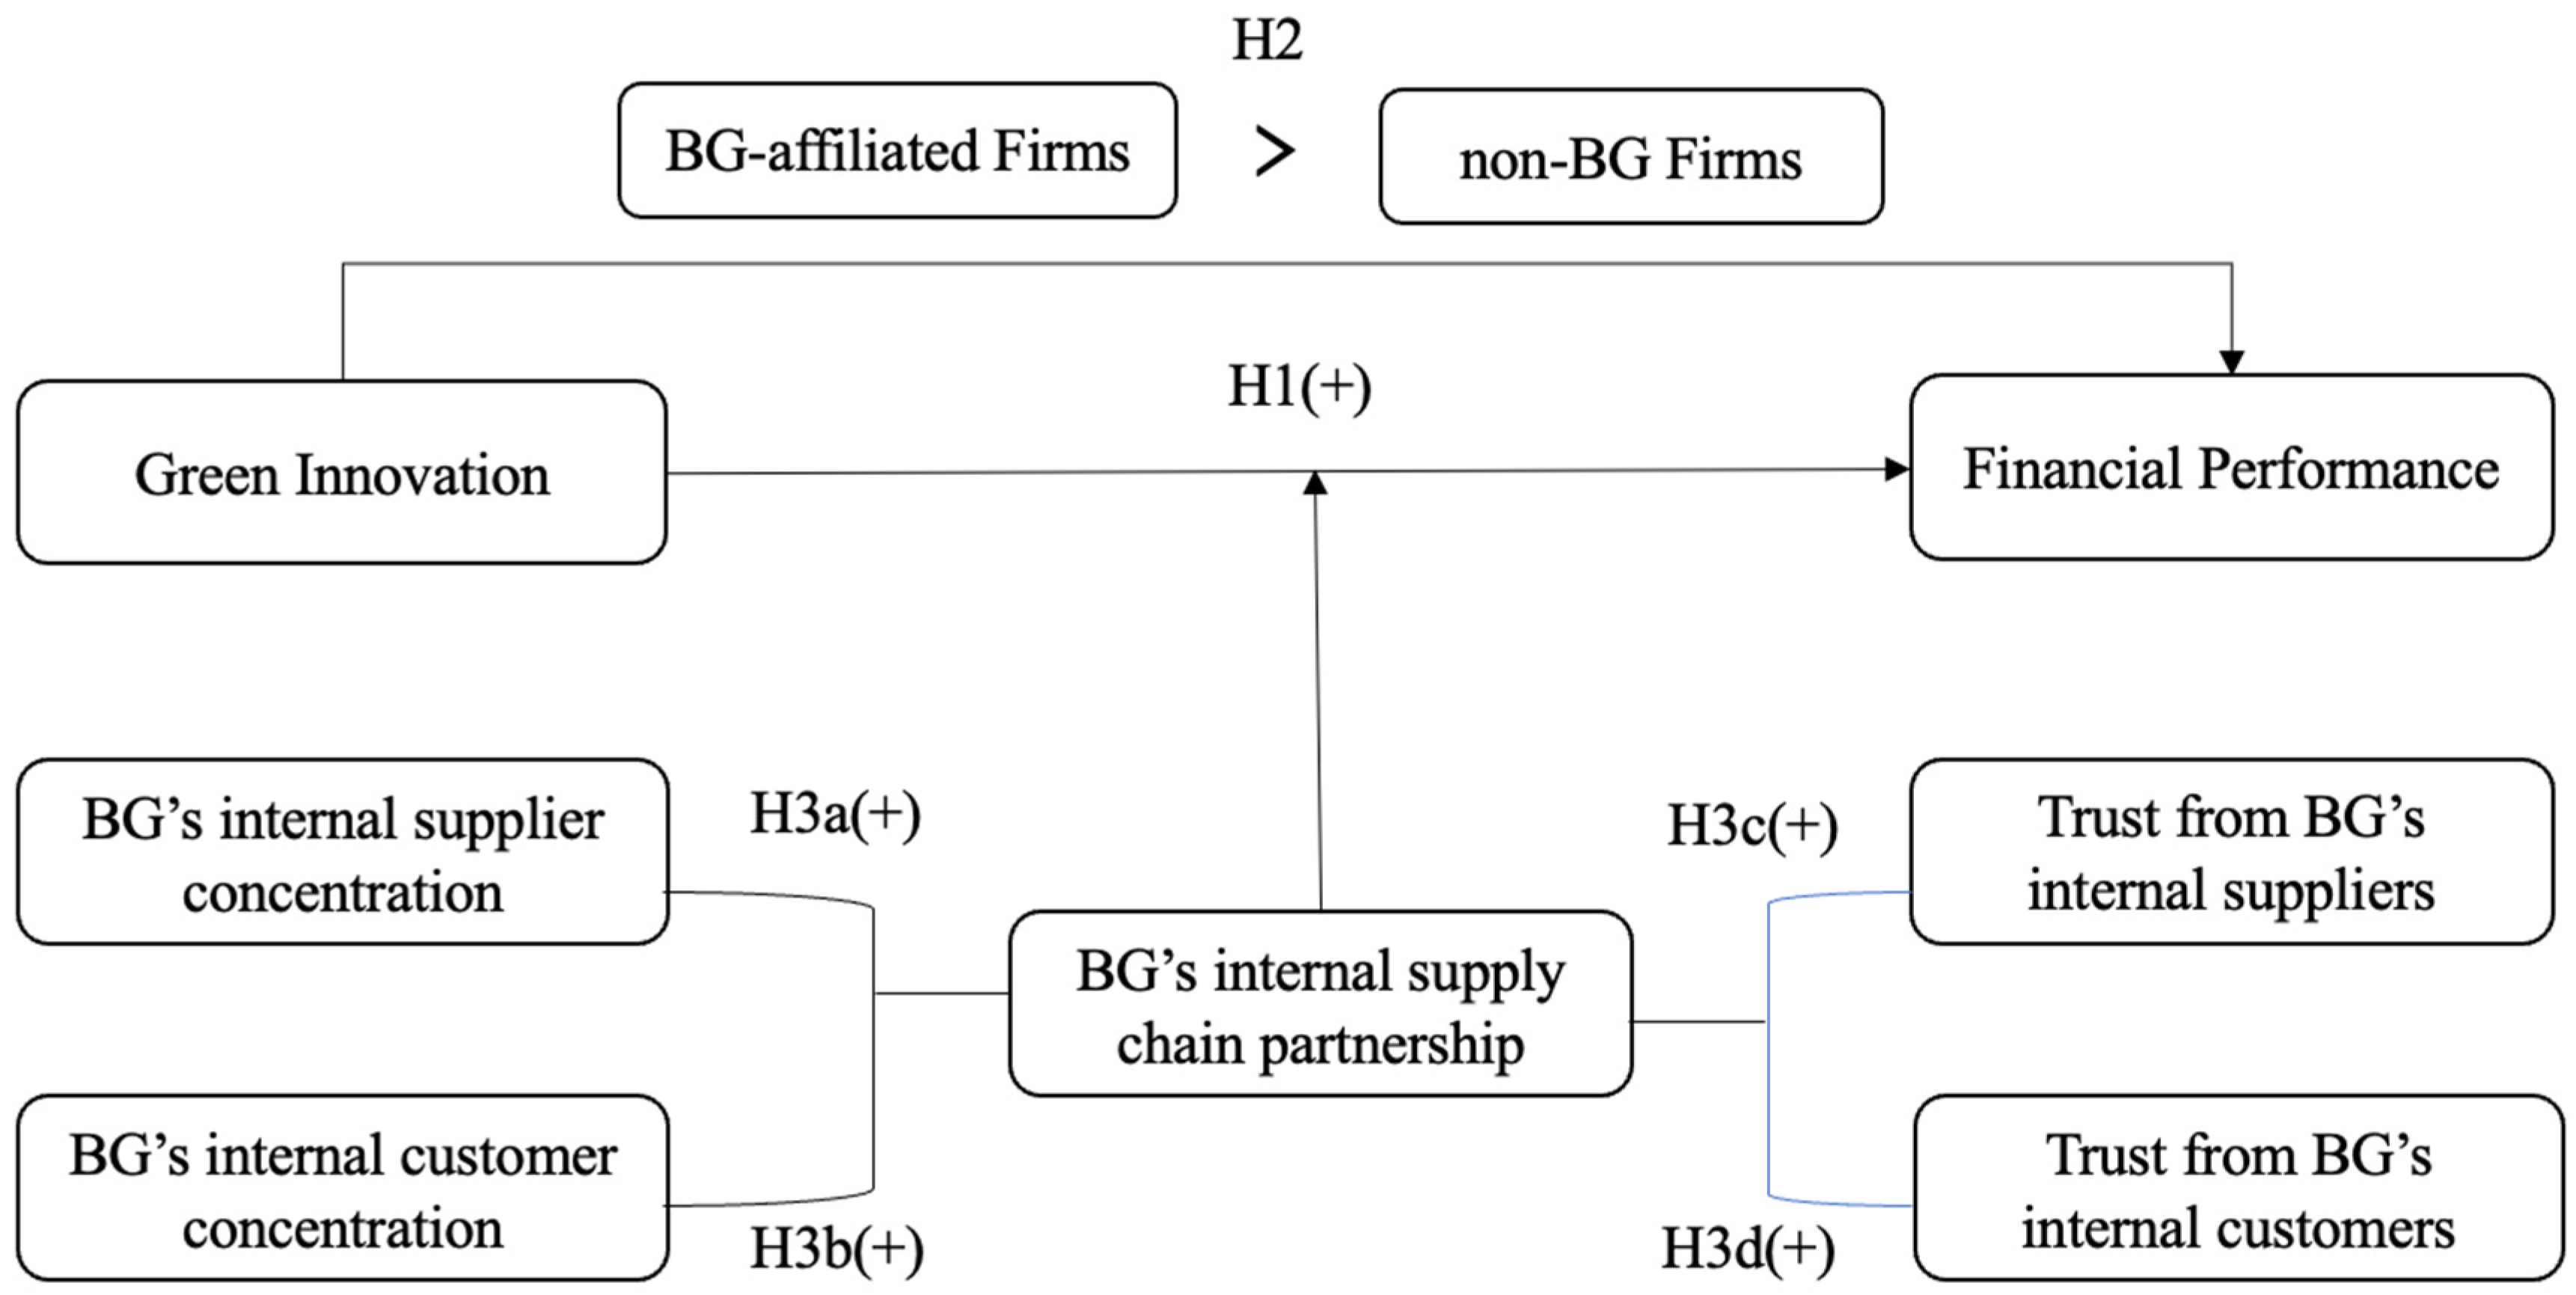
2.3. The Moderating Role of BG’s Internal Supply Chain Partnership

BG’s internal supply chain partnership is particularly advantageous for several reasons. On the one hand, BGs’ affiliated firms interact frequently with their internal supply chain partners. The established relationship with supply chain partners provides opportunities for BG-affiliated firms to obtain more diversified and high-quality technical knowledge [24]. On the other hand, suppliers, distributors, and other specialized intermediaries within business groups provide BG-affiliated firms with complementary resources, techniques, and marketing channels, which is beneficial to firms’ competitive advantages [25]. Moreover, considering the relatively weak market infrastructure in emerging economies, BG’s internal supply chain partnership and network structure are more important for firms’ innovation and economic development than external supply chain partnerships [22,26].
Consistent with existing studies [27,28,29,30], this study divided supply chain partnerships based on two perspectives: concentration and trust. Concentration can better reflect partnerships among supply chains, as supply chain partnerships are subject to dynamic changes in the quantity of enterprises in transactions with major suppliers or customers [31]. Similarly, trust plays a fundamental role in forming and promoting supply chain partnerships [27] and has a significant impact on supply chain management [32].
With regard to supply chain concentration, it moderates the effect of BG-affiliated firms’ green innovation on the financial performance of firms in three ways. First, the more transactions made by BG-affiliated firms with supply chain partners within the same business group, the closer the relationship and higher trust they achieve, in which they can effectively simplify transaction procedures and reduce transaction costs [33]. Second, within the business group, its affiliated firms and internal supply chain partners share the same production system and innovation system [34], and their specific knowledge and advanced technology would add up to strengthen the innovation [35].
Third, BG creates a stable platform for mutual learning and exchange, and the BG headquarters play a central role in coordinating the internal supply chain partnership [36]. When conducting green innovation, BG-affiliated firms are not only required to be familiar with their production system but also understand the situation of their supplier and customer development. A BG, as a network-based organization form, could guarantee effective learning and knowledge sharing among its affiliated members.
Taken together, higher BG supply chain concentration can stimulate more effective learning and knowledge exchange, facilitate resource sharing and technology transfer among BG members, and enhance overall innovation efficiency [33]. Thus, we suggest that the higher the concentration of a BG’s internal suppliers and customers, the better the financial performance achieved by BG-affiliated firms through green innovation. We propose the following:
Hypothesis 3 (H3a).
ABG’s internal supplier concentration positively moderates the relationship between BG-affiliated firms’ green innovation and financial performance.
Hypothesis 3 (H3b).
A BG’s internal customer concentration positively moderates the relationship between BG-affiliated firms’ green innovation and financial performance.
Trust plays an important role in the internal supply chain partnership in the BG. Higher trust between BG-affiliated firms and supply chain partners helps promote collaborative innovation and resource sharing. On the one hand, BG-affiliated firms that have attained trust from suppliers in the same BG could, to some extent, delay the goods payment that can be available for investing in green innovation and relieving financing constraints. On the other hand, developing trust with BG’s internal suppliers and customers could reduce the risk of capital occupation and deliberate payment delays [37]. In this regard, the closer the relationship and higher trust between BG-affiliated firms and BG’s internal supply chain partners, the more likely they are to expand the demand for green products and services, which can further enhance financial performance [37]. We propose the following:
Hypothesis 3 (H3c).
Trust obtained from a BG’s internal suppliers positively moderates the relationship between BG-affiliated firms’ green innovation and financial performance.
Hypothesis 3 (H3d).
Trust obtained from a BG’s internal customers positively moderates the relationship between BG-affiliated firms’ green innovation and financial performance.
The research framework of this paper is shown in Figure 1.

3. Methodology

3.1. Sample and Data Collection

We used Chinese listed manufacturing enterprises in 2013 and 2017 as the research samples. The Chinese sample is advantageous for several reasons: First, the Chinese government attaches great importance to green innovation practices and sustainable development. The report of the 19th National Congress of the Communist Party of China has declared “adhering to the harmonious coexistence between man and nature” as the basic strategy; the Chinese government also developed many green policies, such as the Law on the Prevention and Control of Atmospheric Pollution and Solid Waste Pollution, etc. Second, Chinese enterprises made great efforts for green innovation. Data from the State Intellectual Property Office (SIPO) show that the number of green patent applications in China increased from 35,000 to 75,000 from 2013 to 2017. Finally, the Chinese context provides a great variety of business groups, which allows us to statistically detect the hypothesized effects.
Figure 2 presents the changes in Chinese green patent applications, and the results show that the growth rate of green patent applications has increased rapidly over the past few years and peaked at 30.1% in 2015, indicating that many Chinese enterprises gave importance to green production and green innovation. The results also show that Chinese economic growth had less impact on the increase in green innovation patent applications, which eliminated the effect of national economic development.
We further identify BG-affiliated firms based on the shareholding of the largest shareholder disclosed in the annual report (belonging to the same controlling body or not) and match them with an equivalent number of non-BG firms. Data on corporate financial performance and supply chain partnership were collected from the CSMAR database. The China Stock Market and Accounting Research Database (CSMAR) is a database developed by Guotai’an in the fields of economy and finance and has been widely used in Chinese management studies. We collected patent data of sample companies from the National Intellectual Property Administration and identified and counted the number of green patents according to the IPC Green Inventor.
After deleting *ST companies and samples with missing data and no green patents, we finally obtained 1010 observations (including 505 BG-affiliated firms and non-BG firms) from 202 listed companies. We used Stata16.0 in our data analysis and hypothesis testing (*ST (Special Treatment) means that the company suffer losses for more than three consecutive years, and is at a risk of delisting).
The industry distribution of the research sample is shown in Table 1; it is based on the guidelines for industry classification of listed companies (CSRC). Among them, computer communications and other electronic equipment manufacturing ranked first, with a proportion of 18.82%, followed by electrical machinery manufacturing.

3.2. Variable Measurement

Dependent variable. ROA was adopted to measure corporate financial performance in this study. ROE is another main indicator for performance measurement, but it is easily manipulated and varies with accounting policy changes. By comparison, ROA is more stable and reliable and is a representative indicator of performance measures in green innovation literature [38].
Independent variable. In this study, green innovation is measured as the number of green patents (GPT). Green patents include inventions, utility models, and design patents related to green technology. Green technology refers to technologies for improving energy efficiency, preventing and controlling pollution, and conserving resources. Green technology mainly focuses on energy conservation and emission reduction, pollution control and treatment, and recycling technologies. Patent data are widely used to measure a firm’s innovation, as they can objectively reflect the firm’s innovation level and are easy to acquire [39]. Among green patents, design patents have a lower innovation level; they adopt the Locarno Classification, which differs from the invention and utility model that adopted the International Patent Classification (IPC). To ensure data consistently and objectively reflect a firm’s green innovation level, this study measures green innovation by matching the IPC numbers of both inventions and the utility model with the IPC Green Inventory and counts the number of green patents.
Moderating variable. The BG’s internal supply chain partnership is presented as concentration and trust. Related party transactions involve transactions conducted by the company with its subsidiaries, parent company, and other subsidiaries under the control of the same parent company. For the concentration, we used the proportion of purchase amount in the total purchase amount in the related party transactions as measurement of supplier concentration (GSC), and the proportion of sales in total sales in the related party transactions was used to measure customer concentration (GCC).
With regard to trust, we used the proportion of the sum of accounts payable and bills payable in the operating costs in the related transactions to measure supplier trust (GST) and used the proportion of the sum of accounts receivable and bills receivable in operating revenue in the related transactions to measure customer trust (GCT).
Control variable. Corporate financial performance can be affected by various factors. Based on previous studies, we included firm size (Size), firm age (Age), capital structure (Lev), asset operation ability (Tat), ownership type (P), equity concentration (Top1), and R&D investment (R&D) as control variables, and Tobin’s Q (Q) to control for firms’ market performance. Table 2 summarizes the variables and their measures.

3.3. Modeling

To examine the impact of enterprises’ green innovation on financial performance, the following regression model is established. We further divided the samples into two sub-samples, BG-affiliated firms and non-BG firms, for comparison:
R O A i t = α 0 + α 1 G P T i t + α n C o n t r o l s + ε i t
To examine the moderating role of the business group’s internal supply chain partnership, the following regression model is established:
R O A i t = α 0 + α 1 G P T i t + α 2 G S C i t + α 3 G P T i t × G S C i t + α n C o n t r o l s + ε i t
R O A i t = α 0 + α 1 G P T i t + α 2 G C C i t + α 3 G P T i t × G C C i t + α n C o n t r o l s + ε i t
R O A i t = α 0 + α 1 G P T i t + α 2 G S T i t + α 3 G P T i t × G S T i t + α n C o n t r o l s + ε i t
R O A i t = α 0 + α 1 G P T i t + α 2 G C T i t + α 3 G P T i t × G C T i t + α n C o n t r o l s + ε i t

4. Results

Table 3 presents the descriptive statistics of all variables. In the overall sample, the maximum ROA is 0.499, the minimum is −0.560, and the standard deviation is 0.059, indicating a large gap in the financial performance of Chinese manufacturing enterprises. The average value of green innovation was approximately 12. Furthermore, the average value of ROA in BG-affiliated firms is 0.044 and 0.038 in non-BG firms, suggesting that BG-affiliated firms perform better than non-BG firms. In light of green innovation, the average of green innovation patents obtained by BG-affiliated firms (21) is also higher than that achieved by non-group firms.
From the perspective of the BG’s internal supply chain partnership, the average supplier and customer concentration are both 3.4%. Trust acquired from BG’s internal suppliers and customers in BG-affiliated firms are 2.1% and 3.5%, respectively, indicating that the trust of BG-affiliated firms obtained from a BG’s supply chain partners remains relatively low.
The results in Table 4 show that the correlation coefficient of each variable has a value under 0.6, indicating that multicollinearity is not a problem in our research model.

4.1. Regression Results

The Hausman test is adopted to judge whether a fixed or random effect can be applied. The results show that the p-value of all research models is less than the 5% significance level. Thus, we used a fixed-effect model in our analysis. We also standardized all variables to avoid any deviations caused by different data dimensions and eliminate the multicollinearity problem.
Table 5 shows the effect of green innovation on a firm’s financial performance. The coefficient of green innovation in Model 1 is 0.114 with a p-value less than 0.05, indicating that a firm’s green innovation has a positive impact on its financial performance. This result supports our argument that the implementation of green innovation could strengthen a firm’s differentiation advantage and improve competitiveness [17]; it could also enable firms to produce less pollution in the production process and avoid high penalties for the violation of environmental regulations [18]. Therefore, H1 was supported.
Model 2a and Model 2b in Table 4 test the performance implications for green innovation in BG-affiliated and non-BG firms. The results show that the coefficient of green innovation in BG-affiliated firms (0.142, p < 0.01) is higher than that in non-BG firms (0.094, p < 0.1), indicating that compared with non-BG firms, BG-affiliated firms could achieve better financial performance through green innovation. Thus, H2 is also supported.
Table 6 reports on the moderating effects of BG’s internal supply chain partnership. As shown in Model 3a and Model 3b, the coefficient of the interaction term of GPT with GSC and GCC are 0.198 and 0.075, respectively, at the significance level of 5%. These results imply that a higher supplier and customer concentration within the business group positively moderates the effect of green innovation achieved by BG-affiliated firms on their financial performance. H3a and H3b are thus supported.
In addition, supply chain partnership trust has a moderating effect. The results showed that the coefficient of GST × GPT in Model 3c was 0.027 (p < 0.05) and that of GCT × GPT in Model 3d was 0.151 (p < 0.05). As expected, establishing higher trust and a closer relationship with BG’s internal supply chain partners (both suppliers and customers) would promote cooperation and enhance financial performance through green innovation. Thus, H3c and H3d were also supported.

4.2. Robustness Test

Table 7 presents the robustness tests. We alternatively measured corporate financial performance by using the assets’ main business profit margin. The calculation is as follows:
The assets’ main business profit ratio= [(total operating revenue-total operating cost)/total assets] × 100% (6).
The research results in Table 7 and Table 8 show that the conclusions of our analysis are robust.

5. Conclusions and Discussion

Does the business group matter for green innovation and corporate financial performance? In this study, we examined 202 Chinese manufacturing enterprises in 2013 and 2017 as the research sample, investigated the effect of the firms’ green innovation on their financial performance, and explored how BG-affiliated firms affect financial performance. Based on the perspective of BG’s internal supply chain partnership, we further examined the moderating role of BG’s supply chain concentration and trust in the firm’s green innovation-financial performance relationship. This study reveals some important findings.
First, the green innovation of Chinese enterprises has a positive impact on their financial performance. This effect is more significant in BG-affiliated firms than in non-BG firms. Firms that conduct green innovation are more likely to gain competitive advantage and achieve the “win-win” effect of economic development and environmental improvement. In particular, compared with non-BG firms, BG-affiliated firms have a higher awareness of environmental protection and are more likely to implement sustainable development strategies [8]. In business groups, the high efficiency of resource allocation, combined with the sharing of knowledge, information, and technology among BG-affiliated firms, can greatly enhance a firm’s financial performance and competitive advantages [40]. Moreover, through embedding in BG’s internal supply chain network, BG-affiliated firms promote resource accumulation and reduce external uncertainties [19], which allows BG-affiliated firms to obtain more valuable innovative resources and increase green innovation capability, and ultimately, promote firm performance and sustainable development.
Our findings can be extended to other emerging market contexts that also face challenges in balancing the relationship between environmental protection and economic growth, such as India [8]. Our research reveals that firms engaging in green innovation have a positive effect on performance improvement, especially in the business group. This result provides a useful implication for other emerging market enterprises to carefully implement green innovation practices and value the important role of business groups in facilitating its affiliated firms’ achievement of sustainable development.
Second, supply chain concentration and trust within the business group play a positive moderating role in the relationship between BG-affiliated firms’ green innovation and financial performance. BG-affiliated firms that make frequent contacts and establish trust with BG’s internal supply chain partners can reduce transaction costs and promote the flow of information, funds, and technology. In this vein, the closer the relationship of a BG’s internal supply chain partnership (i.e., higher supply chain concentration and trust), the better the financial performance achieved by BG-affiliated firms.
This study focuses on the particularity and importance of a BG’s green innovation in a firm’s financial performance and also contributes to the research on performance implications for innovation development in an emerging market context [41].

5.1. Research Implications

Overall, the contributions of this study are as follows. First, unlike previous studies that focused on developed countries, this study examines the impact of green innovation on corporate financial performance in an emerging market context (i.e., China), which not only deepens our understanding of the role of green innovation in dealing with the dilemma between environmental protection and economic development but also provides empirical evidence to encourage the implementation of green innovation in developing countries. The findings about the important role of BG-affiliated firms’ green innovation in enhancing financial performance also contributed to business strategy and environmental research [42].
Second, regarding the perspective of supply chain partnership, this study divided it into two dimensions of supply chain concentration and supply chain trust and established a theoretical framework for research on green innovation, supply chain partnership, and financial performance. By emphasizing the positive moderating role of a BG’s supply chain internal partnership, this study not only contributes to supply chain management research but provides evidence for the fact that better and more green innovation can be achieved by building strong relationships with BG suppliers and customers.

5.2. Practical Implications

This study has considerable implications for practitioners. On the one hand, corporate managers should recognize the importance of green innovation in promoting financial performance and sustainable development. In addition, enterprises should integrate green innovation strategies into supply chain management and better coordinate the relationships among suppliers, customers, and other stakeholders. On the other hand, business groups can better promote resource allocation and provide financial support. Policy makers should attach importance to the organization form of business group for achieving “win-win” of environmental protection and economic development. In addition, BG-affiliated firms should take advantage of the group’s resources and promote green innovation.
Second, a firm’s collaborative innovation is easier to succeed if it has a closer relationship with supply chain partners, including suppliers and customers. In this vein, BG-affiliated firms should improve their relationship with supply chain partners within the business group and strengthen their cooperation and trust. Moreover, BG-affiliated firms could establish green innovation alliances and improve cooperation mechanisms to promote green innovation performance.
Finally, since BG-affiliated firms’ green innovation could better promote financial performance than non-BG firms, it may be advantageous for small and medium-sized enterprises (SMEs) to participate in business groups to form an internal supply chain or cooperate with BG-affiliated firms to enjoy the outflow effects of their green innovation practice, which could, to some extent, help enhance SMEs’ green innovation capability and, ultimately, promote their corporate financial performance [43].

5.3. Limitations and Future Research Directions

Like any other study, this study has some limitations that provide opportunities for future research. First, green innovation is a complex activity; this study only measures this variable from the perspective of green patents, and further research could seek more comprehensive and objective measures to reflect the real effect of green innovation. In addition, this paper only describes supply chain partnerships by adopting two aspects of concentration and trust: more supply chain partnerships, such as network cooperation, could be incorporated in future research.
Second, considering data availability, this study only selected listed manufacturing enterprises in China. The inclusion of more unlisted companies and other emerging market enterprises could extend both our theoretical development and empirical design. In addition, this study found the important role of business groups in green innovation practice, and future research could have a finer-grained understanding of the role of BG type and the headquarters–subsidiary relationship in promoting green innovation.
Finally, our research data were only collected until 2017, considering that the COVID-19 pandemic also has a potential impact on economic development and corporate decision making [44]. Future research could incorporate the influence of the COVID-19 pandemic and explore how the relationship between business groups, green innovation, and financial performance evolve with external changes and how BG-affiliated firms improve their green innovation production and business model to achieve sustainable development.

Author Contributions

Conceptualization, Q.X. and Z.X.; methodology, L.X.; writing—original draft preparation, L.X.; writing—review and editing, M.J. and Z.X. All authors have read and agreed to the published version of the manuscript.

Funding

We are grateful for the funding support of Zhejiang social science planning project (Project No. 17ndjc229yb) and the Natural Science Foundation of Zhejiang Province (Project No. LQ22G020007).

Conflicts of Interest

The authors declare no conflict of interest.

References

  1. Hkc, A.; Rwyy, B.; Jing, D.A.; Ming, K. The moderating effect of environmental dynamism on green product innovation and performance. Int. J. Prod. Econ. 2016, 181, 384–391. [Google Scholar] [CrossRef]
  2. Porter, M.E.; Linde, C. Toward a new conception of the environment-competitiveness relationship. J. Econ. Perspect. 1995, 9, 97–118. [Google Scholar] [CrossRef]
  3. Olson, E.L. Perspective: The green innovation value chain: A tool for evaluating the diffusion prospects of green products. J. Prod. Innov. Manag. 2013, 30, 782–793. [Google Scholar] [CrossRef]
  4. Hart, S.L.; Dowell, G. Invited editorial: A natural-resource-based view of the firm: Fifteen years after. J. Manag. 2011, 37, 1464–1479. [Google Scholar] [CrossRef]
  5. Link, S.; Naveh, E. Standardization and discretion: Does the environmental standard iso 14001 lead to performance benefits? IEEE Trans. Eng. Manag. 2006, 53, 508–519. [Google Scholar] [CrossRef]
  6. Stucki, T. Which firms benefit from investments in green energy technologies?—The effect of energy costs. Res. Policy 2019, 48, 546–555. [Google Scholar] [CrossRef]
  7. He, F.; Miao, X.; Wong, C.W.Y.; Lee, S. Contemporary corporate eco-innovation research: A systematic review. J. Clean. Prod. 2018, 174, 502–526. [Google Scholar] [CrossRef]
  8. Ray, S.; Chaudhuri, B.R. Business Group Affiliation and Corporate Sustainability Strategies of Firms: An Investigation of Firms in India. J. Bus. Ethics 2018, 153, 955–976. [Google Scholar] [CrossRef]
  9. Khanna, T.; Yafeh, Y. Business groups in emerging markets: Paragons or parasites? J. Econ. Lit. 2007, 45, 331–372. [Google Scholar] [CrossRef] [Green Version]
  10. Guzzini, E.; Iacobucci, D. Business Group Affiliation and R&D. Ind. Innov. 2014, 21, 20–42. [Google Scholar] [CrossRef]
  11. Zimon, D.; Tyan, J.; Sroufe, R. Implementing sustainable supply chain management: Reactive, cooperative, and dynamic models. Sustainability 2019, 11, 7227. [Google Scholar] [CrossRef] [Green Version]
  12. Heim, S. Capability building and functions of SMEs in business groups: A case study of Toyota’s supply chain. Int. J. Automot. Technol. Manag. 2013, 13, 338–353. [Google Scholar] [CrossRef]
  13. Chan, R. Does the natural-resource-based view of the firm apply in an emerging economy? A survey of foreign invested enterprises in china. J. Manag. Stud. 2005, 42, 625–672. [Google Scholar] [CrossRef]
  14. Lee, K.H.; Min, B. Green R&D for eco-innovation and its impact on carbon emissions and firm performance. J. Clean. Prod. 2015, 108, 534–542. [Google Scholar] [CrossRef] [Green Version]
  15. Pataki, G. Ecological modernization as a paradigm of corporate sustainability. Sustain. Dev. 2009, 17, 82–91. [Google Scholar] [CrossRef]
  16. Zhu, Q.; Sarkis, J.; Lai, K.H. Green supply chain management innovation diffusion and its relationship to organizational improvement: An ecological modernization perspective. J. Eng. Technol. Manag. 2012, 29, 168–185. [Google Scholar] [CrossRef]
  17. Chen, Y.S. The driver of green innovation and green image—Green core competence. J. Bus. Ethics 2008, 81, 531–543. [Google Scholar] [CrossRef]
  18. Ma, Y.; Hou, G.; Xin, B. Green process innovation and innovation benefit: The mediating effect of firm image. Sustainability 2017, 9, 1778. [Google Scholar] [CrossRef] [Green Version]
  19. Belenzon, S.; Berkovitz, T. Innovation in business groups. Manag. Sci. 2010, 56, 519–535. [Google Scholar] [CrossRef] [Green Version]
  20. Lou, Z.K.; Chen, S.Y.; Jia, Y.Y.; Yu, X.Y. Business Group Affiliation and R&D Investment: Evidence from China. Emerg. Mark. Financ. Trade 2019, 57, 2307–2322. [Google Scholar] [CrossRef]
  21. Komera, S.; Lukose, P.J.; Sasidharan, S. Does business group affiliation encourage R&D activities? Evidence from india. Asia Pac. J. Manag. 2018, 35, 887–917. [Google Scholar] [CrossRef]
  22. Mahmood, I.P.; Zhu, H.J.; Zajac, E.J. Where can capabilities come from? Network ties and capability acquisition in business groups. Strateg. Manag. J. 2011, 32, 820–848. [Google Scholar] [CrossRef]
  23. Mark, G. 19. Business Groups and Social Organization. In The Handbook of Economic Sociology, 2nd ed.; Smelser, N.J., Swedberg, R., Eds.; Princeton University Press: Princeton, NJ, USA, 2010. [Google Scholar] [CrossRef] [Green Version]
  24. Chang, S.J.; Hong, J. Economic performance of group-affiliated companies in korea: Intragroup resource sharing and internal business transactions. Acad. Manag. J. 2000, 43, 429–448. [Google Scholar] [CrossRef]
  25. Mahmood, I.P.; Mitchell, W. Two Faces: Effects of Business Groups on Innovation in Emerging Economies. Manag. Sci. 2004, 50, 1348–1365. [Google Scholar] [CrossRef] [Green Version]
  26. Mahmood, I.; Chung, C.N.; Mitchell, W. The Evolving Impact of Combinatorial Opportunities and Exhaustion on Innovation by Business Groups as Market Development Increases: The Case of Taiwan. Manag. Sci. 2013, 59, 1142–1161. [Google Scholar] [CrossRef] [Green Version]
  27. Ireland, R.D.; Webb, J.W. A multi-theoretic perspective on trust and power in strategic supply chains. J. Oper. Manag. 2007, 25, 482–497. [Google Scholar] [CrossRef]
  28. Wei, C.; Zhang, X. Supply Chain Partnership, Knowledge Trading and Cooperative Performance: An Empirical Study Based on Chinese Manufacturing Enterprises. Stud. Sci. Sci. 2011, 29, 1865–1874. [Google Scholar] [CrossRef]
  29. Beheshti, H.M.; Oghazi, P.; Mostaghel, R.; Hultman, M. Supply chain integration and firm performance: An empirical study of swedish manufacturing firms. Compet. Rev. 2014, 24, 120. [Google Scholar] [CrossRef]
  30. Ku, E.C.S.; Wu, W.C.; Chen, Y.J. The relationships among supply chain partnerships, customer orientation, and operational performance: The effect of flexibility. Inf. Syst. E-Bus. Manag. 2016, 14, 415–441. [Google Scholar] [CrossRef]
  31. Lanier, D., Jr.; Wempe, W.F.; Zacharia, Z.G. Concentrated supply chain membership and financial performance: Chain- and firm-level perspectives. Oper. Res. 2010, 28, 1–16. [Google Scholar] [CrossRef]
  32. Jung, C.-H. The effects of factors of partnership between suppliers and buyers toward on collaboration and supply chain performance. J. Korea Acad. Coop. Soc. 2012, 13, 2921–2929. [Google Scholar]
  33. He, J.; Mao, X.; Rui, O.M.; Zha, X. Business groups in China. J. Corp. Financ. 2013, 22, 166–192. [Google Scholar] [CrossRef] [Green Version]
  34. Zhang, Y.L.; Cantwell, J. Exploration and exploitation: The different impacts of two types of Japanese business group network on firm innovation and global learning. Asian Bus. Manag. 2011, 10, 151–181. [Google Scholar] [CrossRef]
  35. Roy, S.; Sivakumar, K.; Wilkinson, I.F. Innovation generation in supply chain relationships: A conceptual model and research propositions. J. Acad. Mark. Sci. 2004, 32, 61–79. [Google Scholar] [CrossRef]
  36. Hsieh, T.J.; Yeh, R.S.; Chen, Y.J. Business group characteristics and affiliated firm innovation: The case of Taiwan. Ind. Mark. Manag. 2010, 39, 560–570. [Google Scholar] [CrossRef]
  37. Martinez-sola, C.; Garcia-teruel, P.J.; Martinez-solano, P. Trade credit and SME profitability. Small Bus. Econ. 2014, 42, 561–577. [Google Scholar] [CrossRef]
  38. Aguilera-Caracuel, J.; Ortiz-de-Mandojana, N. Green Innovation and Financial Performance: An Institutional Approach. Organ. Environ. 2013, 26, 365–385. [Google Scholar] [CrossRef]
  39. Acs, Z.J.; Anselin, L.; Varga, A. Patents and innovation counts as measures of regional production of new knowledge. Res. Policy 2002, 31, 1069–1085. [Google Scholar] [CrossRef]
  40. Choi, Y.K.; Han, S.H.; Kwon, Y. CSR activities and internal capital markets: Evidence from Korean business groups. Pac. Basin Financ. J. 2019, 55, 283–298. [Google Scholar] [CrossRef]
  41. Xie, Z.; Wang, J.; Miao, L. Big data and emerging market firms’ innovation in an open economy: The diversification strategy perspective. Technol. Forecast. Soc. Chang. 2021, 173, 121091. [Google Scholar] [CrossRef]
  42. Kumar, S.; Sureka, R.; Lim, W.M.; Mangla, S.K.; Goyal, N. What do we know about business strategy and environmental research? Insights from Business Strategy and the Environment. Bus. Strategy Environ. 2021. [Google Scholar] [CrossRef]
  43. Tang, Z.; Tang, J. The impact of competitors: Firm power divergence on Chinese SMEs’ environmental and financial performance. J. Bus. Ethics 2016, 136, 147–165. [Google Scholar] [CrossRef]
  44. Lim, W.M. History, lessons, and ways forward from the COVID-19 pandemic. Int. J. Qual. Innov. 2021, 5, 101–108. [Google Scholar]
Figure 1. Research framework.
Sustainability 13 13204 g001
Figure 2. Growth rate of Chinese green patent applications and GDP growth rate during 2013–2017.
Sustainability 13 13204 g002
Table 1. Industry distribution of sample companies.
Industry NamePercentage %
Wine, beverage, and refined tea manufacturing 0.99
Textile industry0.99
Woodworking and wood, bamboo, vine, grass0.99
Paper and paper products1.98
Petroleum processing, coking, and nuclear fuel processing industry0.99
Chemical raw materials and chemical manufacturing5.94
Medical manufacturing2.97
Chemical fiber manufacturing1.98
Rubber and plastic products2.97
Non-metal mineral products industry2.97
Non-ferrous metal smelting and calendering4.95
Metalwork3.96
General equipment manufacturing6.93
Special equipment manufacturing13.86
Automotive manufacturing8.91
Railway, ship, aerospace, and other transport equipment manufacturing2.97
Electrical machinery manufacturing15.84
Computer, communications, and other electronic equipment manufacturing18.82
Abandoned resource comprehensive utilization0.99
Table 2. Definition of variables.
TypeVariable NameVariable SymbolDefinition and Measurement
Dependent VariableFinancial PerformanceROANet Profit/[(The Assets’ Total Closing Balance + The Assets’ Total Opening Balance)/2]
Independent VariableGreen InnovationGPTQuantity of Green Patents Applied
Moderating VariableBusiness Group’s Internal Supplier ConcentrationGSCPurchase Amount in Related Transactions/Total Purchase Amount
Business Group’s Internal Customer ConcentrationGCCSales Volume in Related Transactions/Total Sales Volume
Trust Acquired from Supplier within the Business GroupGST(Accounts Payable and Bills Payable in Related Transactions)/
Operating Cost
Trust Given to Customer within the Business GroupGCT(Accounts Payable and Bills Payable in Related Transactions)/
Operating Revenue
Control VariableFirm SizeSizeLn (Total Assets)
Firm AgeAgeLn (The number of years since establishment + 1)
Capital StructureLevTotal Liabilities/Total Assets
Assets Operation AbilityTatMain Operating Income/Total Assets
Ownership TypePOwnership Nature: set equal to one if it is state-owned enterprise, and zero otherwise
Equity ConcentrationTop1Shareholding proportion of the firm’s largest shareholder
R&D InvestmentR&DR&D investment/operating revenue
Tobin’s QQTobin’s Q
Table 3. Descriptive statistics.
Overall SamplesSamples of BG-Affiliated Firms Samples of Non-BG Firms
VariableMeanSDMinMaxMeanSDMinMaxMeanSDMinMax
ROA0.0410.059−0.5600.4990.0440.054−0.1110.3080.0380.062−0.5600.499
GPT11.91257.3220.000921.00021.09379.8190.000921.0002.7316.1680.00069.000
Size22.4301.25019.88527.30723.0671.26620.53727.30721.7920.84419.88524.216
Age16.6445.0785.00037.00018.0795.1446.00037.00015.2714.5875.00029.000
Lev0.4330.1830.0201.2800.4880.1740.0780.8570.3780.1740.0201.280
Tat0.6290.3260.0683.1100.6890.3330.1182.3150.5690.3080.0683.110
State0.2850.4520.0001.0000.5600.4970.0001.0000.0100.0990.0001.000
Top10.3060.1400.0420.7880.3540.1440.0720.7880.2590.1170.0420.729
R&D0.0470.0350.0010.58250.0420.0240.0010.2010.0520.0420.0010.583
Q2.2871.3600.84013.2402.0051.1930.84011.2562.5681.4570.92913.240
GSC0.0340.0780.0000.649
GCC0.0340.0860.0000.855
GST0.0210.0740.0000.773
GCT0.0350.1150.0000.892
Table 4. Correlation coefficient matrix.
VariableROAGPTSizeAgeLevTatStateTop1R&DQ
ROA1.000
GPT0.0421.000
Size0.0590.3401.000
Age−0.0180.1720.2081.000
Lev−0.2890.1380.5530.1011.000
Tat0.170−0.0150.1760.0740.1801.000
State−0.0800.1640.4620.2980.3010.1451.000
Top10.183−0.0990.193−0.0650.0650.1540.3111.000
R&D0.0880.026−0.1850.061−0.269−0.284−0.166−0.1161.000
Q0.254−0.083−0.394−0.067−0.396−0.037−0.220−0.1150.2271.000
Table 5. Regression results of green innovation, business group, and financial performance.
VariableOverall SamplersBG-Affiliated FirmsNon-BG Firms
Model 1Model 2aModel 2b
GPT0.114 **
(2.45)
0.142 ***
(3.37)
0.094 *
(1.69)
Size0.270 **
(2.30)
0.148
(1.24)
0.240 *
(1.88)
Age−0.389 ***
(−3.44)
−0.189 *
(−1.80)
−0.477 ***
(−2.72)
Lev−0.240 ***
(−4.11)
−0.041
(−0.64)
−0.280 ***
(−3.23)
Tat0.336 ***
(5.50)
0.390 ***
(5.81)
0.301 ***
(3.33)
State−0.363 **
(−2.38)
−0.027
(−0.15)
−0.113 **
(−2.23)
Top10.017
(0.20)
−0.135
(−1.61)
0.127
(1.03)
R&D−0.063
(−1.57)
−0.064
(−1.33)
−0.052
(−0.82)
Q0.189 ***
(5.58)
0.137 ***
(3.81)
0.227 ***
(4.41)
Number1010505505
R20.1100.1340.131
Note: The numbers in parentheses are T-values. * p < 0.10, ** p < 0.05, and *** p < 0.01.
Table 6. Regression results of green innovation, supply chain partnership, and financial performance.
VariableModel 3aModel 3bModel 3cModel 3d
GPT0.139 ***
(3.32)
0.098 **
(2.04)
0.143 ***
(3.43)
0.115 ***
(2.63)
Size0.204 *
(1.71)
0.149
(1.24)
0.145
(1.22)
0.162
(1.36)
Age−0.205 *
(−1.96)
−0.184 *
(−1.75)
−0.155
(−1.47)
−0.195 *
(−1.85)
Lev−0.058
(−0.91)
−0.044
(−0.69)
−0.048
(−0.76)
−0.042
(-0.66)
Tat0.399 ***
(5.98)
0.393 ***
(5.87)
0.396 ***
(5.94)
0.386 ***
(5.76)
State−0.019
(−0.11)
−0.021
(−0.12)
−0.033
(−0.18)
−0.021
(−0.11)
Top1−0.094
(−1.10)
−0.144 *
(−1.72)
−0.126
(−1.51)
−0.134
(−1.61)
R&D−0.063
(−1.34)
−0.063
(−1.32)
−0.065
(−1.36)
−0.057
(−1.20)
Q0.140 ***
(3.92)
0.142 ***
(3.93)
0.142 ***
(3.97)
0.138 ***
(3.84)
GSC−0.033
(−0.88)
GSC × GPT0.198 **
(2.39)
GCC −0.023
(−0.77)
GCC × GPT 0.075 **
(1.97)
GST −0.102 ***
(−2.86)
GST × GPT 0.027 **
(1.99)
GCT 0.047
(1.07)
GCT × GPT 0.151 **
(2.07)
Number505505505505
R20.1540.1460.1530.144
Note: The numbers in parentheses are T-values. * p < 0.10, ** p < 0.05, and *** p < 0.01.
Table 7. Robustness test (I).
VariableModel 4Model 5aModel 5b
GPT0.114 **
(2.45)
0.077 *
(0.96)
0.212 ***
(4.20)
Size0.270 **
(2.30)
0.231 **
(2.23)
0.114
(0.80)
Age−0.389 ***
(−3.44)
−0.504 ***
(−3.55)
−0.132
(−1.05)
Lev−0.240 ***
(−4.11)
−0.380 ***
(−5.41)
−0.070
(−0.92)
Tat0.336 ***
(5.50)
0.071
(0.96)
0.434 ***
(5.40)
State−0.363 **
(−2.38)
−0.124 ***
(−3.02)
−0.009
(−0.04)
Top10.017
(0.20)
0.220 **
(2.19)
−0.034
(−0.34)
R&D−0.063
(−1.57)
−0.004
(−0.08)
−0.054
(−0.95)
Q0.189 ***
(5.58)
0.150 ***
(3.60)
0.127 ***
(2.94)
Number1010505505
R20.1100.1860.122
Note: Any coefficient’s T-value is stated in brackets. * p < 0.10, ** p < 0.05, *** p < 0.01.
Table 8. Robustness test (II).
VariableModel 6aModel 6bModel 6cModel 6d
GPT0.208 ***
(4.22)
0.077 *
(1.72)
0.206 ***
(4.61)
0.162 ***
(3.12)
Size0.214
(1.52)
0.126 **
(1.98)
0.125
(0.99)
0.139
(0.99)
Age−0.156
(−1.26)
−0.116 **
(−2.05)
−0.103
(−0.91)
−0.131
(−1.06)
Lev−0.114
(−1.51)
−0.208 ***
(−4.04)
−0.047
(−0.70)
−0.065
(−0.87)
Tat0.443 ***
(5.63)
0.293 ***
(5.85)
0.443 ***
(6.22)
0.428 ***
(5.41)
State0.006
(0.03)
−0.132 *
(−1.95)
−0.023
(−0.12)
−0.002
(−0.01)
Top10.053
(0.53)
0.062
(1.09)
−0.023
(−0.26)
−0.037
(−0.38)
R&D−0.057
(−1.02)
0.012
(0.27)
−0.062
(−1.21)
−0.048
(−0.85)
Q0.131 ***
(3.12)
0.195 ***
(5.65)
0.136 ***
(3.55)
0.127 ***
(3.00)
GSC−0.108 **
(−2.48)
GSC × GPT0.265 ***
(2.70)
GCC −0.023
(−0.66)
GCC × GPT 0.173 ***
(3.83)
GST −0.108 ***
(−2.85)
GST × GPT 0.147 ***
(10.23)
GCT −0.011
(−0.20)
GCT × GPT 0.306 ***
(3.57)
Number505505505505
R20.1660.1590.3140.153
Note: Any coefficient’s T-value is stated in brackets. * p < 0.10, ** p < 0.05, *** p < 0.01.
Publisher’s Note: MDPI stays neutral with regard to jurisdictional claims in published maps and institutional affiliations.

