Article

Modeling and Simulation of Exit Selection Behavior in Pedestrian Evacuation Based on Information Perception and Transmission

Institute of Urban System Engineering, Beijing Academy of Science and Technology, Beijing 100035, China
*
Author to whom correspondence should be addressed.
Sustainability 2021, 13(23), 13194; https://doi.org/10.3390/su132313194
Submission received: 25 October 2021 / Revised: 17 November 2021 / Accepted: 22 November 2021 / Published: 29 November 2021

Abstract

:
This paper aims to present an improved evacuation model, which is capable of simulating individual exit selection behavior based on the acquisition and processing of information, especially in dangerous and unfamiliar environments. Firstly, an evacuation model was improved by the introduction of a floor field of gas concentration and an exit selection model, considering the congestion avoidance and danger avoidance behavior. Secondly, the process of information perception and transmission was studied and introduced into the model with a set of rules. Finally, real experiments in a simple double-exit room were conducted for model validation and parameter setting, and simulation experiments in scenarios with an unknown hazard or unknown exits were conducted to confirm the necessity and rationality of introducing information perception and transmission. The simulation results show that, with the increase in perception distance or trust extent, the pedestrian safety increases. The critical values of perception distance or trust extent, below which some people cannot acquire any new information, vary depending on the pedestrian density. When the density is high, the influence of perception distance or trust extent reduces, and the probability of reselecting an exit increases, which causes the safety of pedestrians to decrease.

1. Introduction

Rapid and safe evacuation in emergencies is an important goal of safety planning and emergency management in densely populated places in cities. The egress process is determined by a series of decisions made by the individuals involved, and exit selection is one of the most important decisions to be made. There are many factors influencing the exit selection behavior, including physical, cognitive, motivational and social factors. Apparently, the spatial distance is a basic factor and has been considered in most evacuation models. However, when the density is large enough (Fang et al., 2010 [1] and Aik, 2011 [2]), or with cooperative behavior (Heliövaara et al., 2012 [3]), pedestrians may select a distance exit. Shi et al. (2009) [4] found that the percentages of subjects who chose familiar exits, chose the nearest exit, were directed to an exit by staff or followed others accounted for 19.5%, 50.1%, 25.2% and 5.2%, respectively. Bode and Codling (2013) [5] found that there was no inherent preference for familiar routes, and subjects were less likely to avoid a congested exit by changing their original decision under a stress-inducing treatment. There is no unified conclusion of the exit selection preference by considering a number of factors. This paper focuses on the perceptional and cognitive aspects of exit selection.
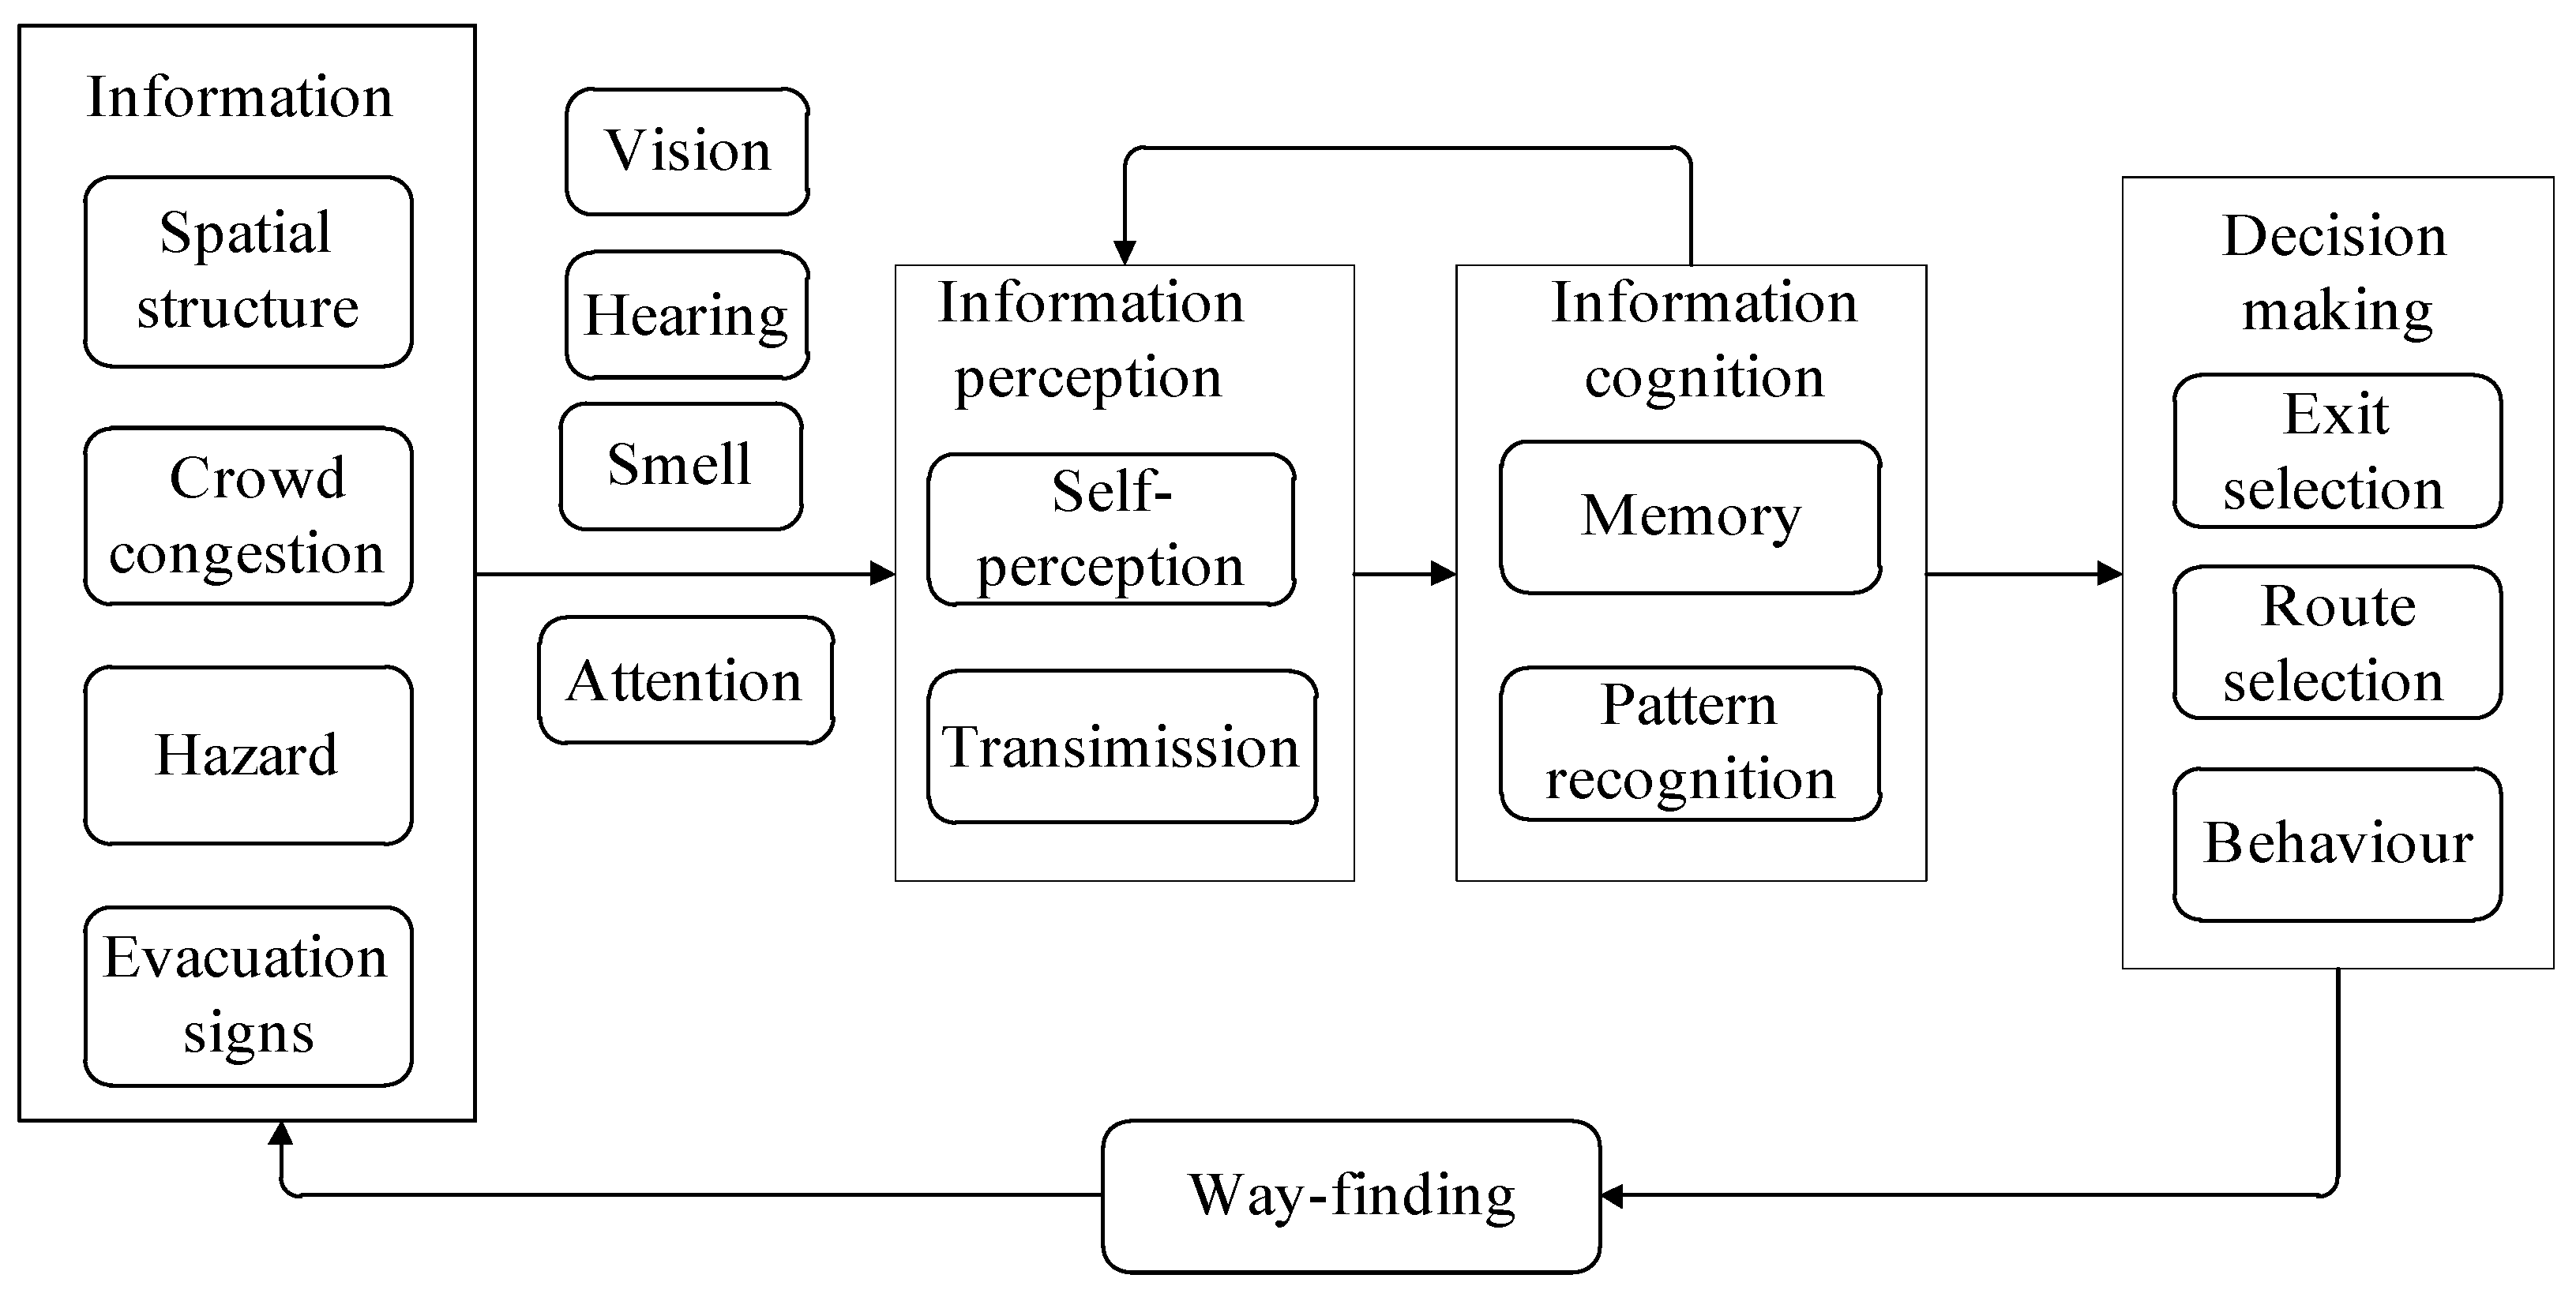
In the process of emergency evacuation, the exit and path selection decisions made by pedestrians are based on an analysis of evacuation environment information. Environmental information is obtained according to two aspects. This information comes from the knowledge and experience accumulated in people’s daily life. It constitutes the different cognitive degrees individuals have of the building’s spatial structure, so the information is related to individual familiarity. Additionally, information can be gained from the information on accident hazards and escape paths that is perceived or received during the evacuation process, which can be obtained through self-perception, other pedestrians’ transmission or evacuation sign transmission. Existing evacuation studies and models usually assume that pedestrians have complete exit information. However, in unfamiliar buildings with a complex structure or scenes with accident risks, pedestrians often need to obtain spatial information and danger information through perception and interaction to make decisions on exit and path selection. Therefore, it is necessary to study the perception, processing and transmission of information in the process of evacuation.
The information transmission models between evacuees can be summarized in the following three ways: (1) Information is transmitted through direct contact. Henein (2008) [6] assumed that a pedestrian will exchange spatial information when encountering another pedestrian during the evacuation process; therefore, an evacuation model is proposed in which information transmission is expressed through a pushing force. Henein and White (2010) [7] redefined a set of static fields, rather than the sole static field of the floor field model, and added an integer index called the view-selector into the set of static fields to support heterogeneous crowds with different levels of knowledge of the space. Fu, Song and Lo (2017) [8] also considered that pedestrians located near the source of danger will receive the information first, and then their Moore neighbors will be informed. (2) Information is provided by sounds or actions at a certain distance. Liu (2010) [9] presents a multi-information map to show that pedestrians are not only affected by cells in the neighborhood but also can receive information from cells at a certain distance. Zou and Chen (2020) [10] presented an evacuation method consisting of four main parts: the gas dispersion model, the information diffusion model, the emotion contagion model and the modified social force model. The agents become aware of the risk when they are harmed by toxic gas, notified by nearby authority figures or informed by other common agents. (3) Information perception is an accumulative process. Dong, Liu and Bian (2011) [11] described a behavior control structure that adopts the layered architecture of Perceptual-Control-Motion, and defined a dicideFactor, which is related to the times that the agent receives information from other information sources. When the dicideFactor is greater than a critical value, the agent transforms from free movement to directional movement and becomes a new information source. Wang et al. (2015) [12] introduced the information particle number to express the information’s effect. A pedestrian receives information when his location contains information particles released by an evacuation assistant. Han and Liu (2017) [13] modified the driving force in the social force model using the information transmission mechanism. When information is spread by one pedestrian, one is added to the information number. When information spreads further, pedestrians depend more on their neighbors, who provide the exit information needed to escape.
The information perception process includes discovery, accumulation and transmission. Existing studies have analyzed the correlation between the information perception state and evacuation behavior pattern, but they have not specifically discussed the conditions that trigger information perception and the mechanism of information transmission. In these studies, spatial information perception has been emphasized, with less consideration given to the perception process of accident risk information. Taking the gas leakage of dangerous chemicals as the accident scene, this paper analyzes the influence of both crowd distribution and toxic gas distribution on individual exit selection and establishes the evacuation exit selection model; it studies the process of pedestrians’ information perception and transmission and puts forward the perception rules of spatial information and hazard information; it also establishes an evacuation model under the scene of a toxic gas accident by combining the toxic gas diffusion model and the toxic load calculation method. The exit selection model is introduced into the extended evacuation model for crowd evacuation simulation. The simulated evacuation results in different modes being compared, and the influences of perception distance and the extent of trust on evacuation results are analyzed.

2. Analysis of Information Perception Process

The summary of an information cognition model in the process of an emergency evacuation based on information processing theory is shown in Figure 1. The contents and ways of perceiving evacuation information are shown in Table 1. There are three kinds of occupant exit knowledge (OEK) sources and occupant gas knowledge (OGK). One is based on evacuees’ familiarity with the spatial structure. They store the information for one or more exits in their memory. Second, evacuees perceive exit information or toxic gas information by sight, hearing or smell. Third, the exit information or toxic gas information is transmitted from others to evacuees.

3. Evacuation Dynamics Model

3.1. Pedestrian Evacuation Model Considering the Spread of Toxic Gas Hazards

In this work, a two-dimensional Cellular Automata (CA) model was used to simulate the evacuee tracks. The indoor space was divided into L × W cellular grids, and the corresponding space of each cell was 0.5 m × 0.5 m, with the values of 1 (nobody) or 0 (occupied). Pedestrian direction selection was determined by the static floor field (SFF) [14,15]. Considering pedestrians’ danger avoidance behavior, the gas concentration floor field (CFF) was added to indicate the concentration distribution after the release of toxic gas. Therefore, the transition probability of the location ( x , y ) chosen by the evacuees can be expressed as
P ( x , y ) exp ( k S S ( x , y ) k ) exp ( k C C ( x , y ) )
in which, S ( x , y ) k is the shortest route distance from the cellular location ( x , y ) to the exit k, C ( x , y ) is the toxic gas concentration at the cellular location ( x , y ) and parameters k S and k C represent the pedestrians’ mastery of the escape route and toxic gas distribution, respectively.
To show the gas diffusion, it is assumed that toxic gas comes from the ground fixed location, releasing a steady stream of gas, and the Pasquill-Gifford Gaussian Plume Model is adopted to calculate the steady-state concentration of gas
C ( x , y , z ) = Q π u σ y σ z exp [ 1 2 ( ( y y 0 ) 2 σ y 2 + ( z z 0 ) 2 σ z 2 ) ]
in which, C ( x , y , z ) is the concentration at the location ( x , y , z ) , and its unit is mg/m3; Q is the leakage of source intensity, and its unit is mg/s; ( x 0 , y 0 , z 0 ) is the location of the leakage source, and its unit is m; σ x ,   σ y and σ z are diffusion coefficients of downwind, crosswind and vertical wind direction, respectively; u is the average wind speed, and its unit is m/s.
According to the concept of toxic load put forward by the UK Health and Safety Executive (HSE), the toxic load is a function of toxic substance concentration and the exposure time TL = l · C n · T m . TL is the value of the toxic load; l is the coefficient related to the dose of toxic gas; C is the toxic gas concentration and its unit is g/m3; T is the exposure time and its unit is min; n and m are correction coefficients. Taking chlorine gas as an example, l = n = m = 1 , the expression of pedestrian i toxic load is as follows
TL i = t = 1 T i C i t · t
CA is a discrete model and t is an updated time step, so C i t is the gas concentration of pedestrian i ’s location at time step t , and T i is the total time steps that pedestrian i has moved. The lethal dose of chlorine is 6.4 (g · min)/m3, the dose of serious injury is 3.2 (g · min)/m3 and the dose of minor injury is 0.48 (g · min)/m3 [16].

3.2. Exit Selection Model Considering Congestion and Danger Avoidance

According to the existing exit selection model, there are two ways to introduce exit selection behavior in an evacuation simulation. One is defining the exit categories and preferences. For example, software FDS + EVAC divided the exits to eight preference groups according to visibility, familiarity and disturbing conditions. However, the exit categories mentioned above are not mutually exclusive. It is possible for one exit to belong to multiple types. The other way is by improving the behavioral rules in the evacuation model. For example, software VISWALK and buildingEXODUS consider the congestion around the exits according to the delay time distribution and flow rate of the exits, respectively. The density around the exit was defined by various ways in different models. However, there is no evidence for which way is better and the rule for exit reselection in the process of evacuation is not clear. In order to solve these problems, an exit choice model and procedure are presented in our previous work (Liu et al., 2021 [17]). Based on this, the expressions of toxic gas diffusion and information perception are further introduced in this paper.
The influencing factors of exit selection behavior were analyzed from the perspective of time pressure and space pressure. The pressure related to time can be divided into two parts: free walking time and waiting time. The former is affected by the distance from the pedestrians’ location to the exits and walking speed, while the latter is affected by the number of people in line, exit width and exit flow rate. The pressure related to space mainly comes from the harm from gas diffusion, which is affected by the location, concentration and wind direction.
The exit selection model is based on the multinomial Logit discrete choice model, which is usually used to model decision makers’ choices among a set of alternatives, and the utility function is constructed according to the individual estimated evacuation time and the distance from the pedestrians’ location to the gas source. It is assumed that there are K exits in the building and pedestrians have already acquired the information of K′ exits ( K K ). The probability that pedestrian i (location ( i x , i y ) ) chooses exit k at time t is calculated by the following formula
P ik t = exp ( θ i k T ik t ) l = 1 K exp ( θ i l T il t )
in which, θ i k = 1 / δ i s k is a constant, and δ i s k represents the preference level of pedestrian to an exit type s k . The exits can be classified into different types; for example, exits that are used for circulation and emergency exits with signage (normally not used for circulation), or upwind exits and downwind exits (when there is a fire or leakage).
The utility function T ik t is defined as
T ik t = { TF ik t + α i · TW ik t + β i · DG k , if       Q ik t > Pa i       and       OGK i = 1 TF ik t + α i · TW ik t , if       Q ik t > Pa i       and       OGK i = 0 TF ik t + β i · DG k , if       Q ik t Pa i       and       OGK i = 1 TF ik t , if       Q ik t Pa i       and       OGK i = 0
Coefficient α i is the impatient level, α i = Pa * / Pa i ; β i is the degree of danger exclusion. Q ik t = N ik t / ( f k · w k ) is the estimated waiting time, and Pa i is the patience time of pedestrian i . When OGK i is 1, this means that pedestrian i has the information on the toxic gas source; otherwise, it is 0.
Walking time factor in utility function: TF ik t = d ik t l = 1 K d il t
Waiting time factor in utility function: TW ik t = Q ik t l = 1 K Q il t
Toxic gas source factor in utility function: DG k = d kg t l = 1 K d lg t
Among these, d ik t is the distance from pedestrian i to exit k at time t , which is calculated from the static field value of exit k ; d kg t is the minimum distance from the toxic gas source location g to the exit k at time t ; N ik t is the number of people in the counting area of pedestrian i towards exit k at time t; f k is the unit flow rate of exit k , and w k is the exit width. The study of the counting area can be found in our previous work [17]. The counting area is defined as the region enclosed by a visual boundary and equipotential curve (equal value of static floor field to an exit) of the decision maker.

3.3. Perception Rules of OEK and OGK

3.3.1. The Update of OGK

Assuming that no one knows that a gas leak will occur in the initial state, we can find the OGK i = 0 of all pedestrians. In the following two conditions, pedestrian i can acquire danger information during the evacuation process: the first is self-perception, where the pedestrian’s location is within the injury area of the toxic gas concentration, or the toxic gas source and affected persons are within the visual range of the pedestrian, according to the principle of “seeing is believing”; the second is other pedestrians sharing toxic gas source information within the pedestrians’ range of perception. Therefore, there are four conditions for OGK i = 0 1 :
  • The toxic load of pedestrian i reaches the dose levels that cause injury;
  • The visual perception range of pedestrian i contains the toxic gas source;
  • The visual perception range of pedestrian i contains dead people;
  • The auditory perception range of pedestrian i contains another pedestrian j with OGK j = 1 , and the number of pedestrian j is higher than N trust .

3.3.2. The Update of OEK

It is assumed that pedestrians know of at least one exit: the one through which they entered the room. Therefore, the OEK ik = 1 of all pedestrians, with at least one exit, k. In the following two conditions, pedestrian i can acquire exit information during the evacuation process: one is self-perception, with an unknown exit within the visual field of pedestrian i; the other is transmission of information from others in the visual field of pedestrian i, where the target exits selected by other pedestrians are unknown to pedestrian i. Therefore, there are two conditions for the rule setting of OEK ik = 0 1 :
  • The visual perception range of pedestrian i shows unknown exit K′;
  • In the visual perception range of pedestrian i, there is another pedestrian j, whose escape direction to exit K′ is different from pedestrian i’s, and the number of pedestrian j is higher than N trust .
The extent of trust is expressed by the reciprocal of N trust . N trust indicates the number of people reached within the visual or auditory range when pedestrians are willing to trust the information they receive.

4. Simulation and Discussion

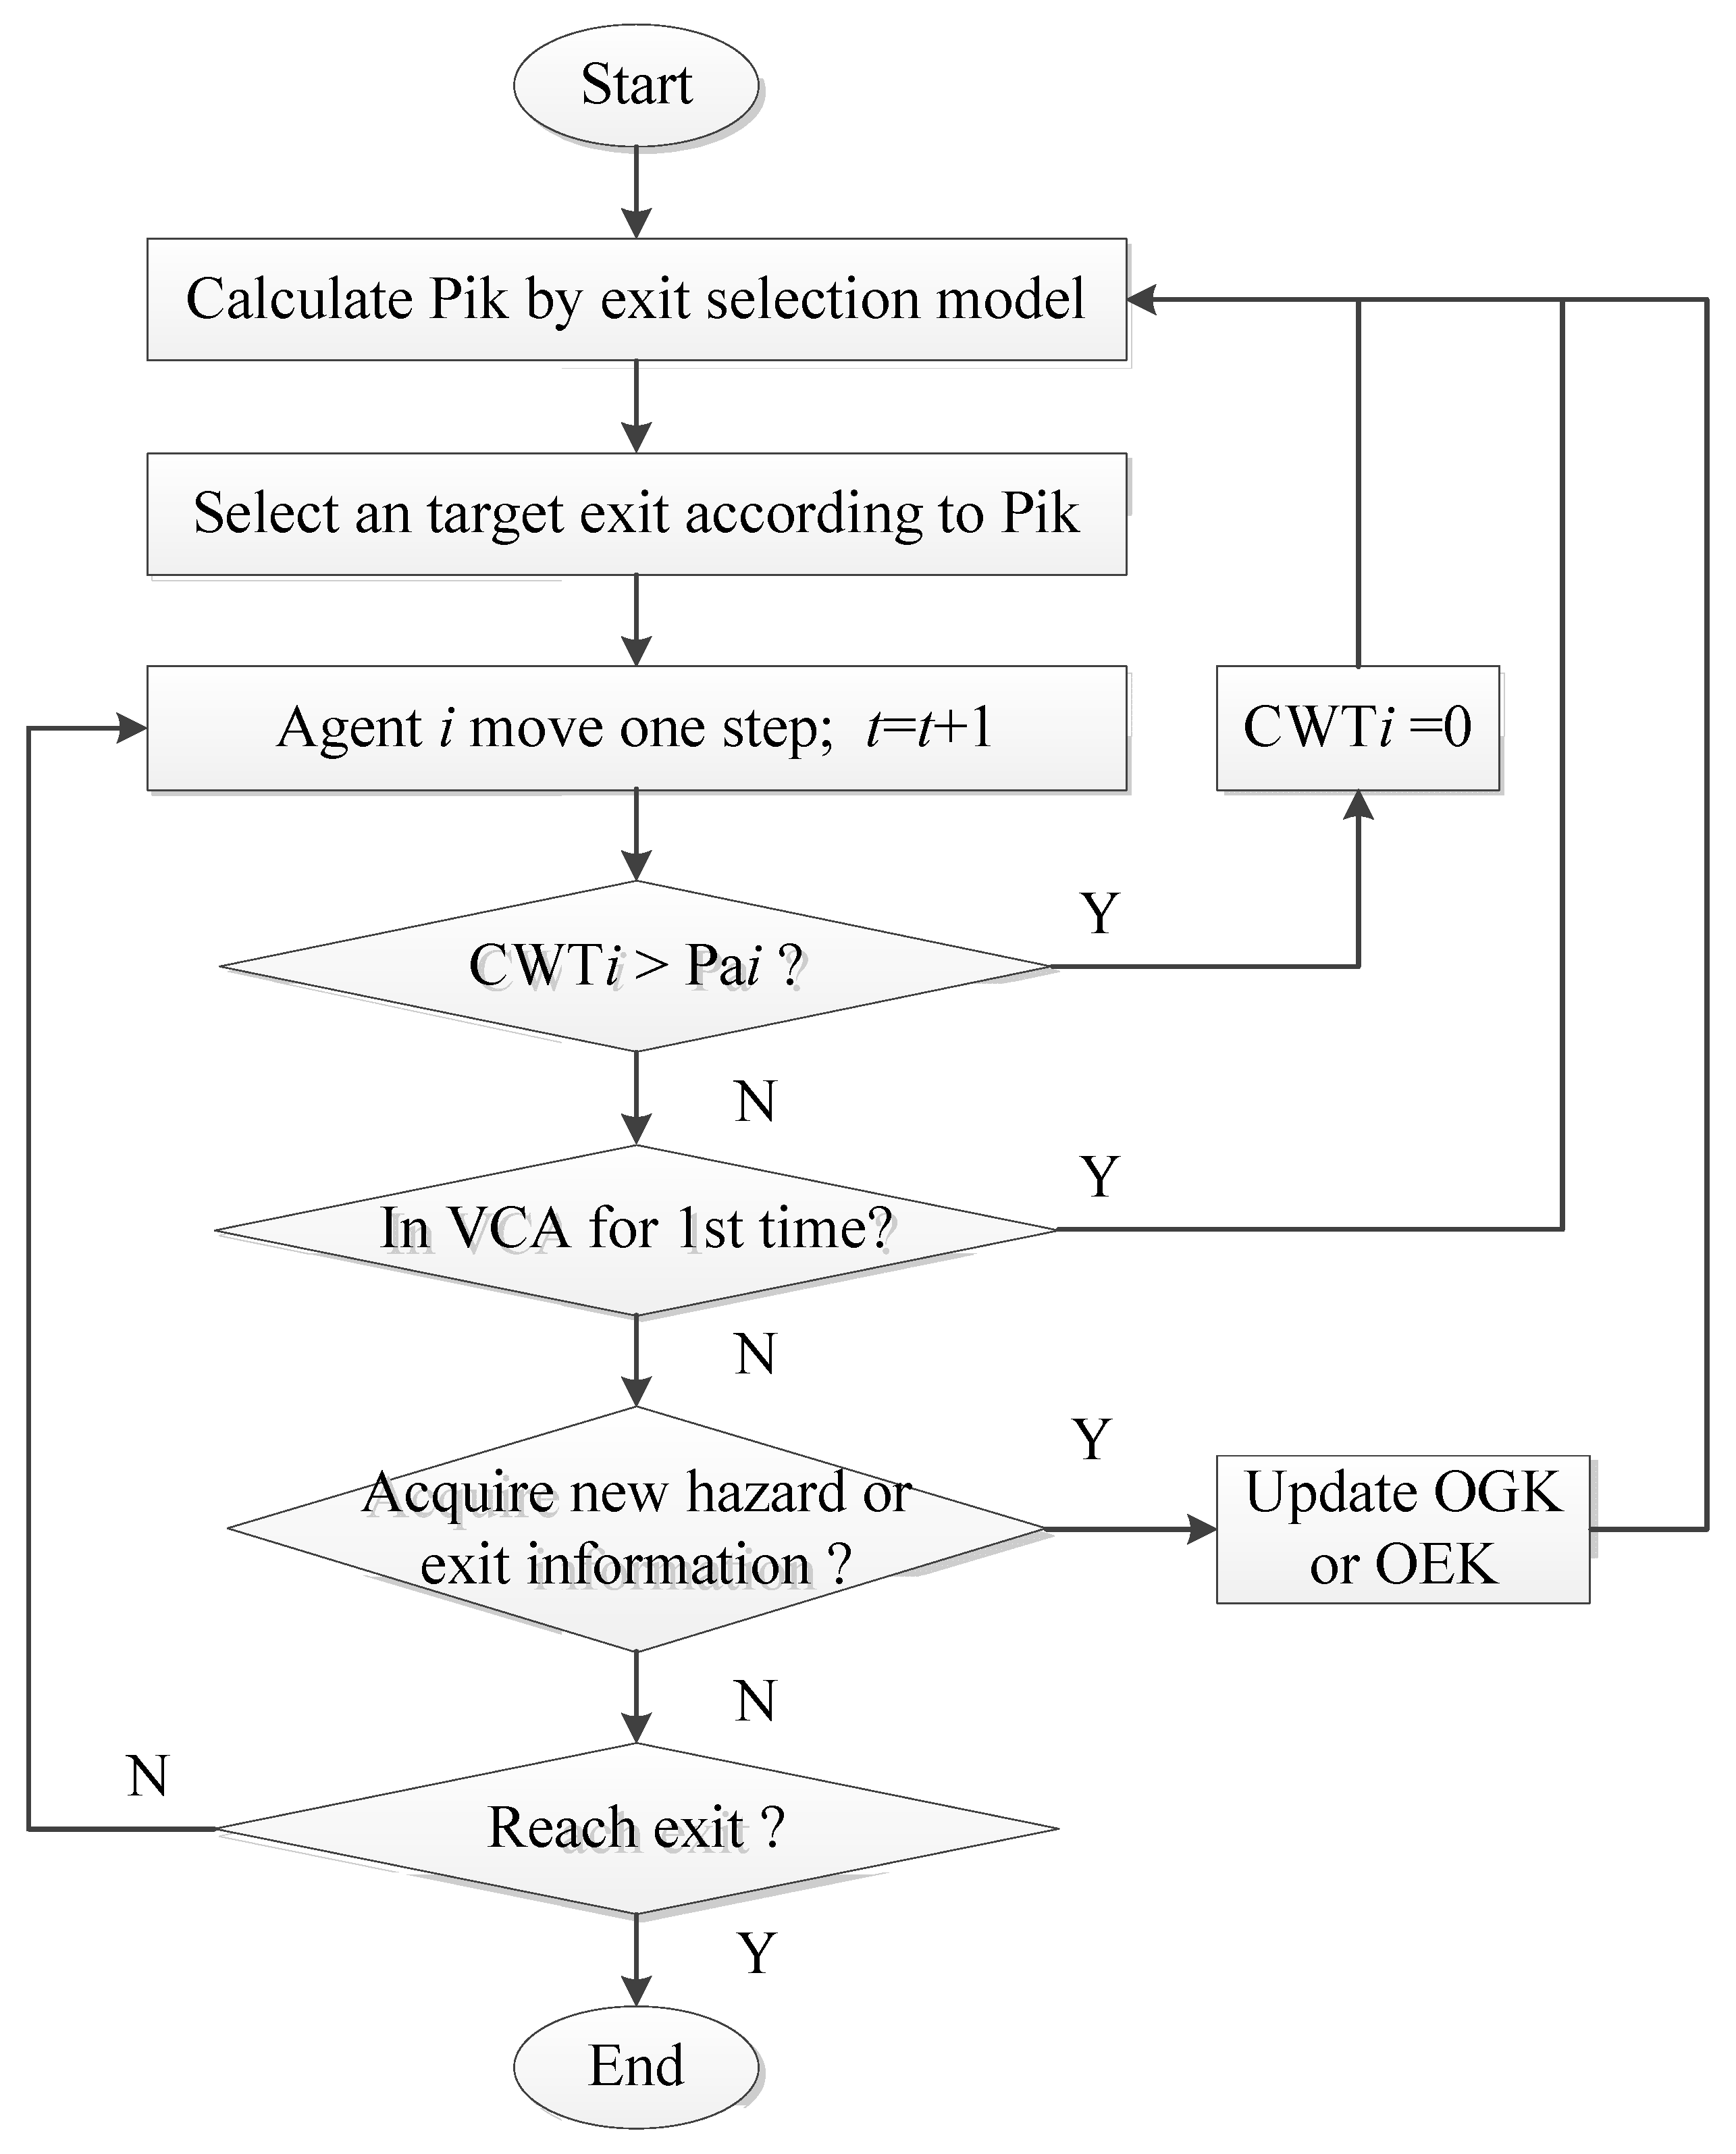
4.1. Simulation Procedure

The evacuation simulation procedure of an individual is shown in Figure 2. VCA k is the visibility catchment area of exit k . It is assumed to be a circle and its radius is equal to the visual perception distance of pedestrians. CWT is the cumulative waiting time and CWT is reset to 0 when the patience time of the pedestrian is exhausted ( CWT > Pa ).
Step 1: Initialize the pedestrians’ location, and all pedestrians determine the initial target exit according to the exit selection model.
Step 2: Dynamically update the pedestrians’ location according to the pedestrian evacuation model. In this process, pedestrians will reselect the target exit according to the exit selection model according to the following reasons. First, pedestrians enter the visibility catchment area of an exit for the first time; second, the pedestrian grows impatient, CWT > Pa ; thirdly, pedestrians acquire the toxic gas source information, that is, OGK i changes from 0 to 1; finally, pedestrians acquire new exit information, that is, OGK i changes from 0 to 1.
Step 3: Update the locations of all pedestrians, namely, update the cells’ state. When the toxic load of a pedestrian exceeds the lethal dose, the pedestrian is regarded as dead, and the location of the pedestrian will not change. Pedestrians arriving at the exit will be removed from the system. When all living pedestrians leave the evacuation space, the simulation ends. Otherwise, return to Step 2.

4.2. Parameter Setting of Evacuation Model

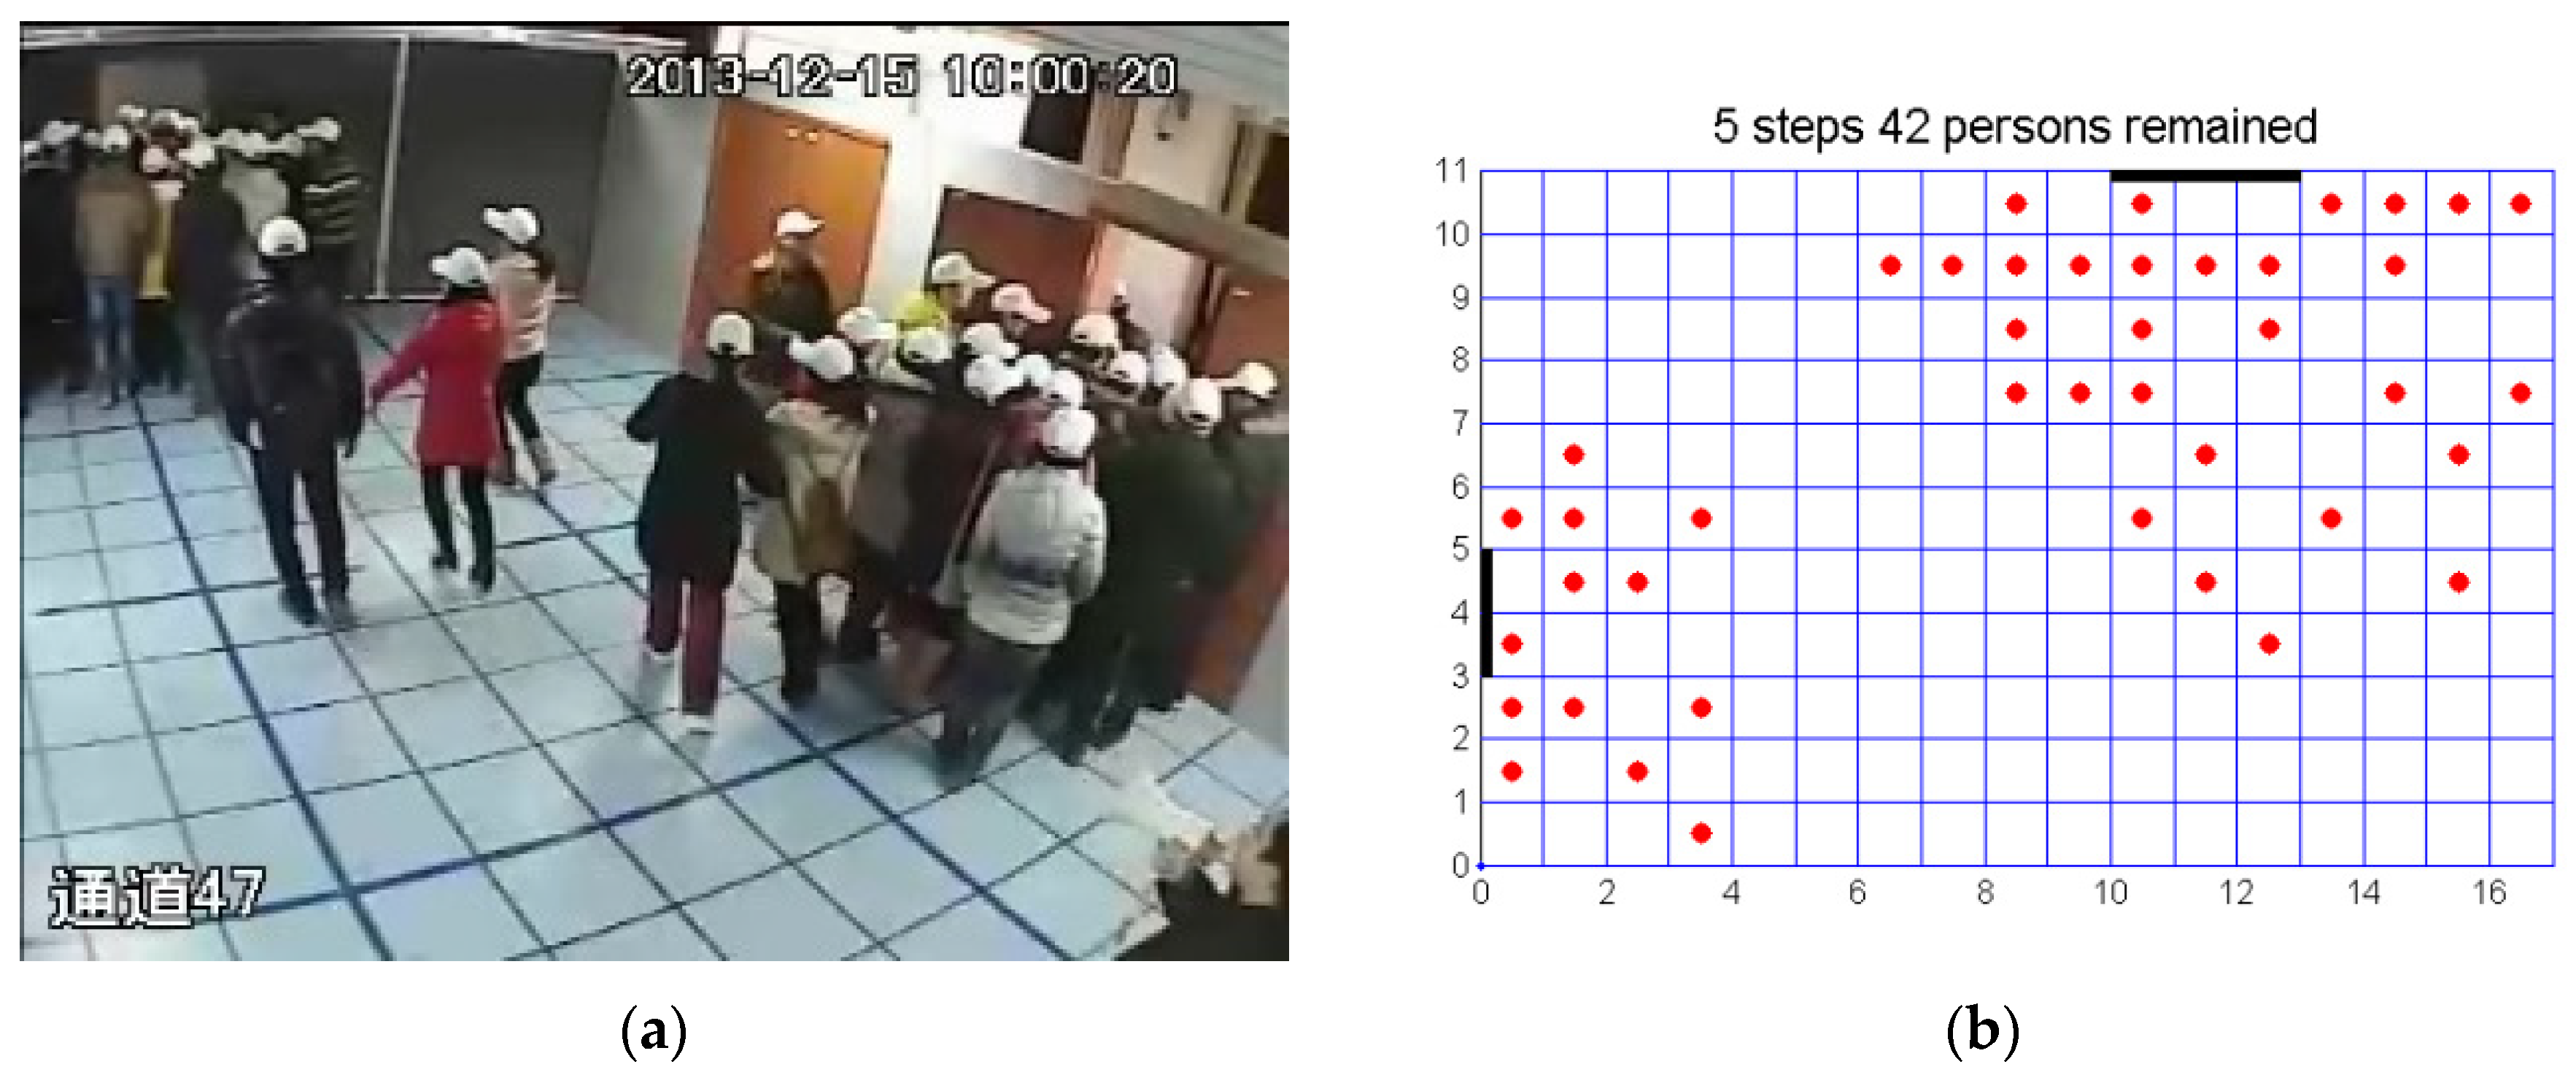
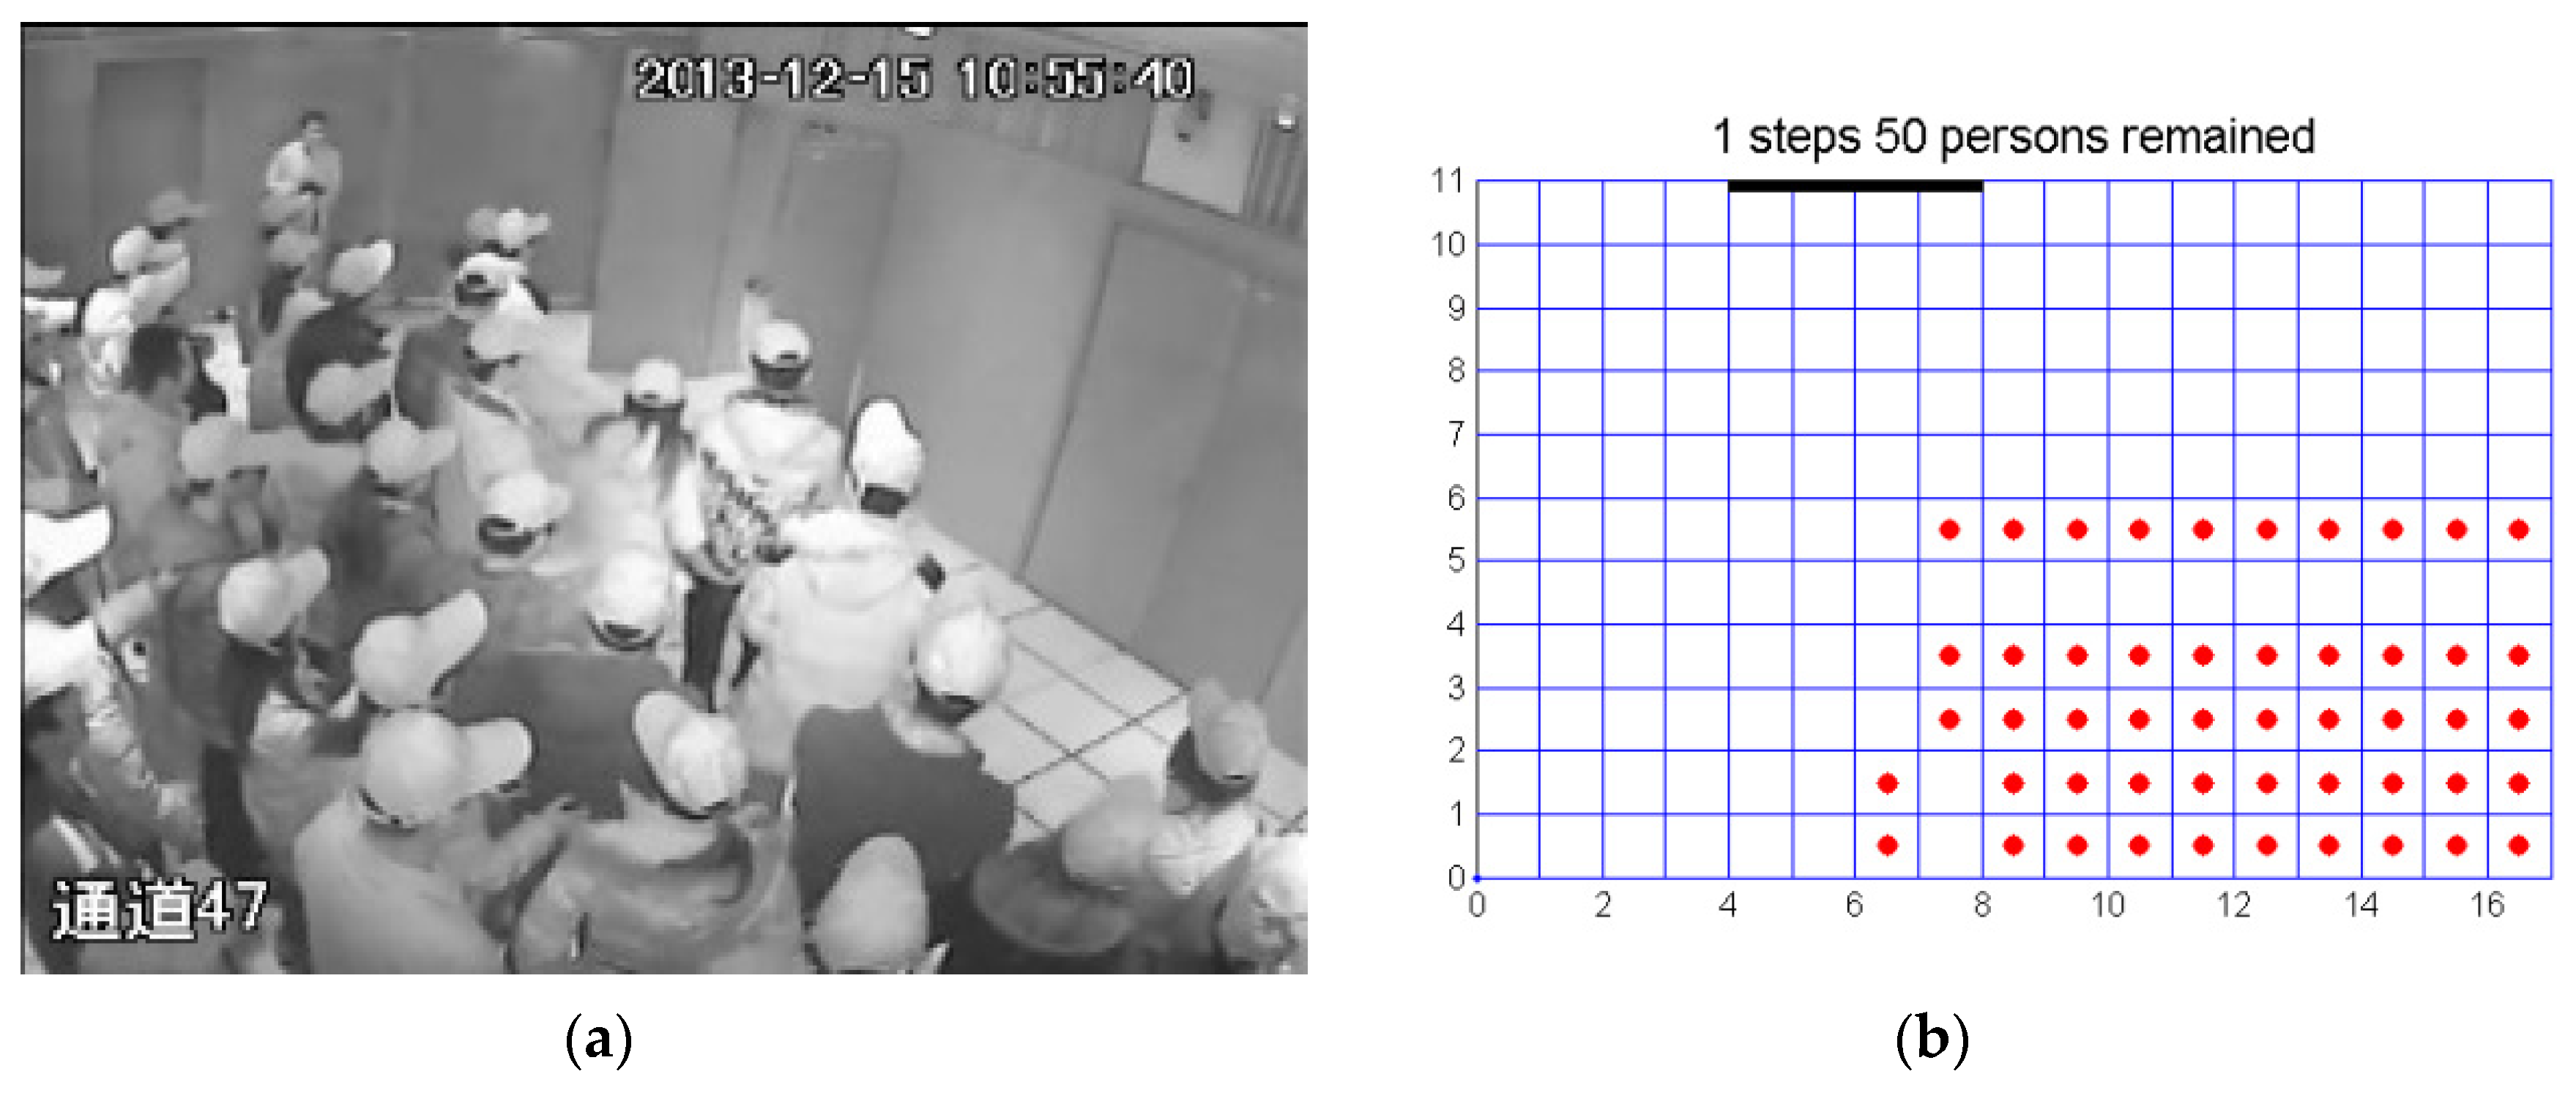
Some experiments were carried out to validate the evacuation model and parameter setting. There was a room with three doors. The area of the room was 8.5 m × 5.5 m. There were 50 evacuees. The volunteers were undergraduate students (adult). The environment was controlled by turning the lights on/off and opening/closing the different doors. The dynamic evacuation processes were recorded by a 3 × 5 camera array on the ceiling that was perpendicular to the ground. Two scenarios were considered: Scenario 1, where the lights were turned on and two doors were opened, as shown in Figure 3. The initial positions of evacuees were randomly distributed; Scenario 2, where the lights were turned off and only one door was opened, and the evacuees were initially gathered far from the door, as shown in Figure 4.
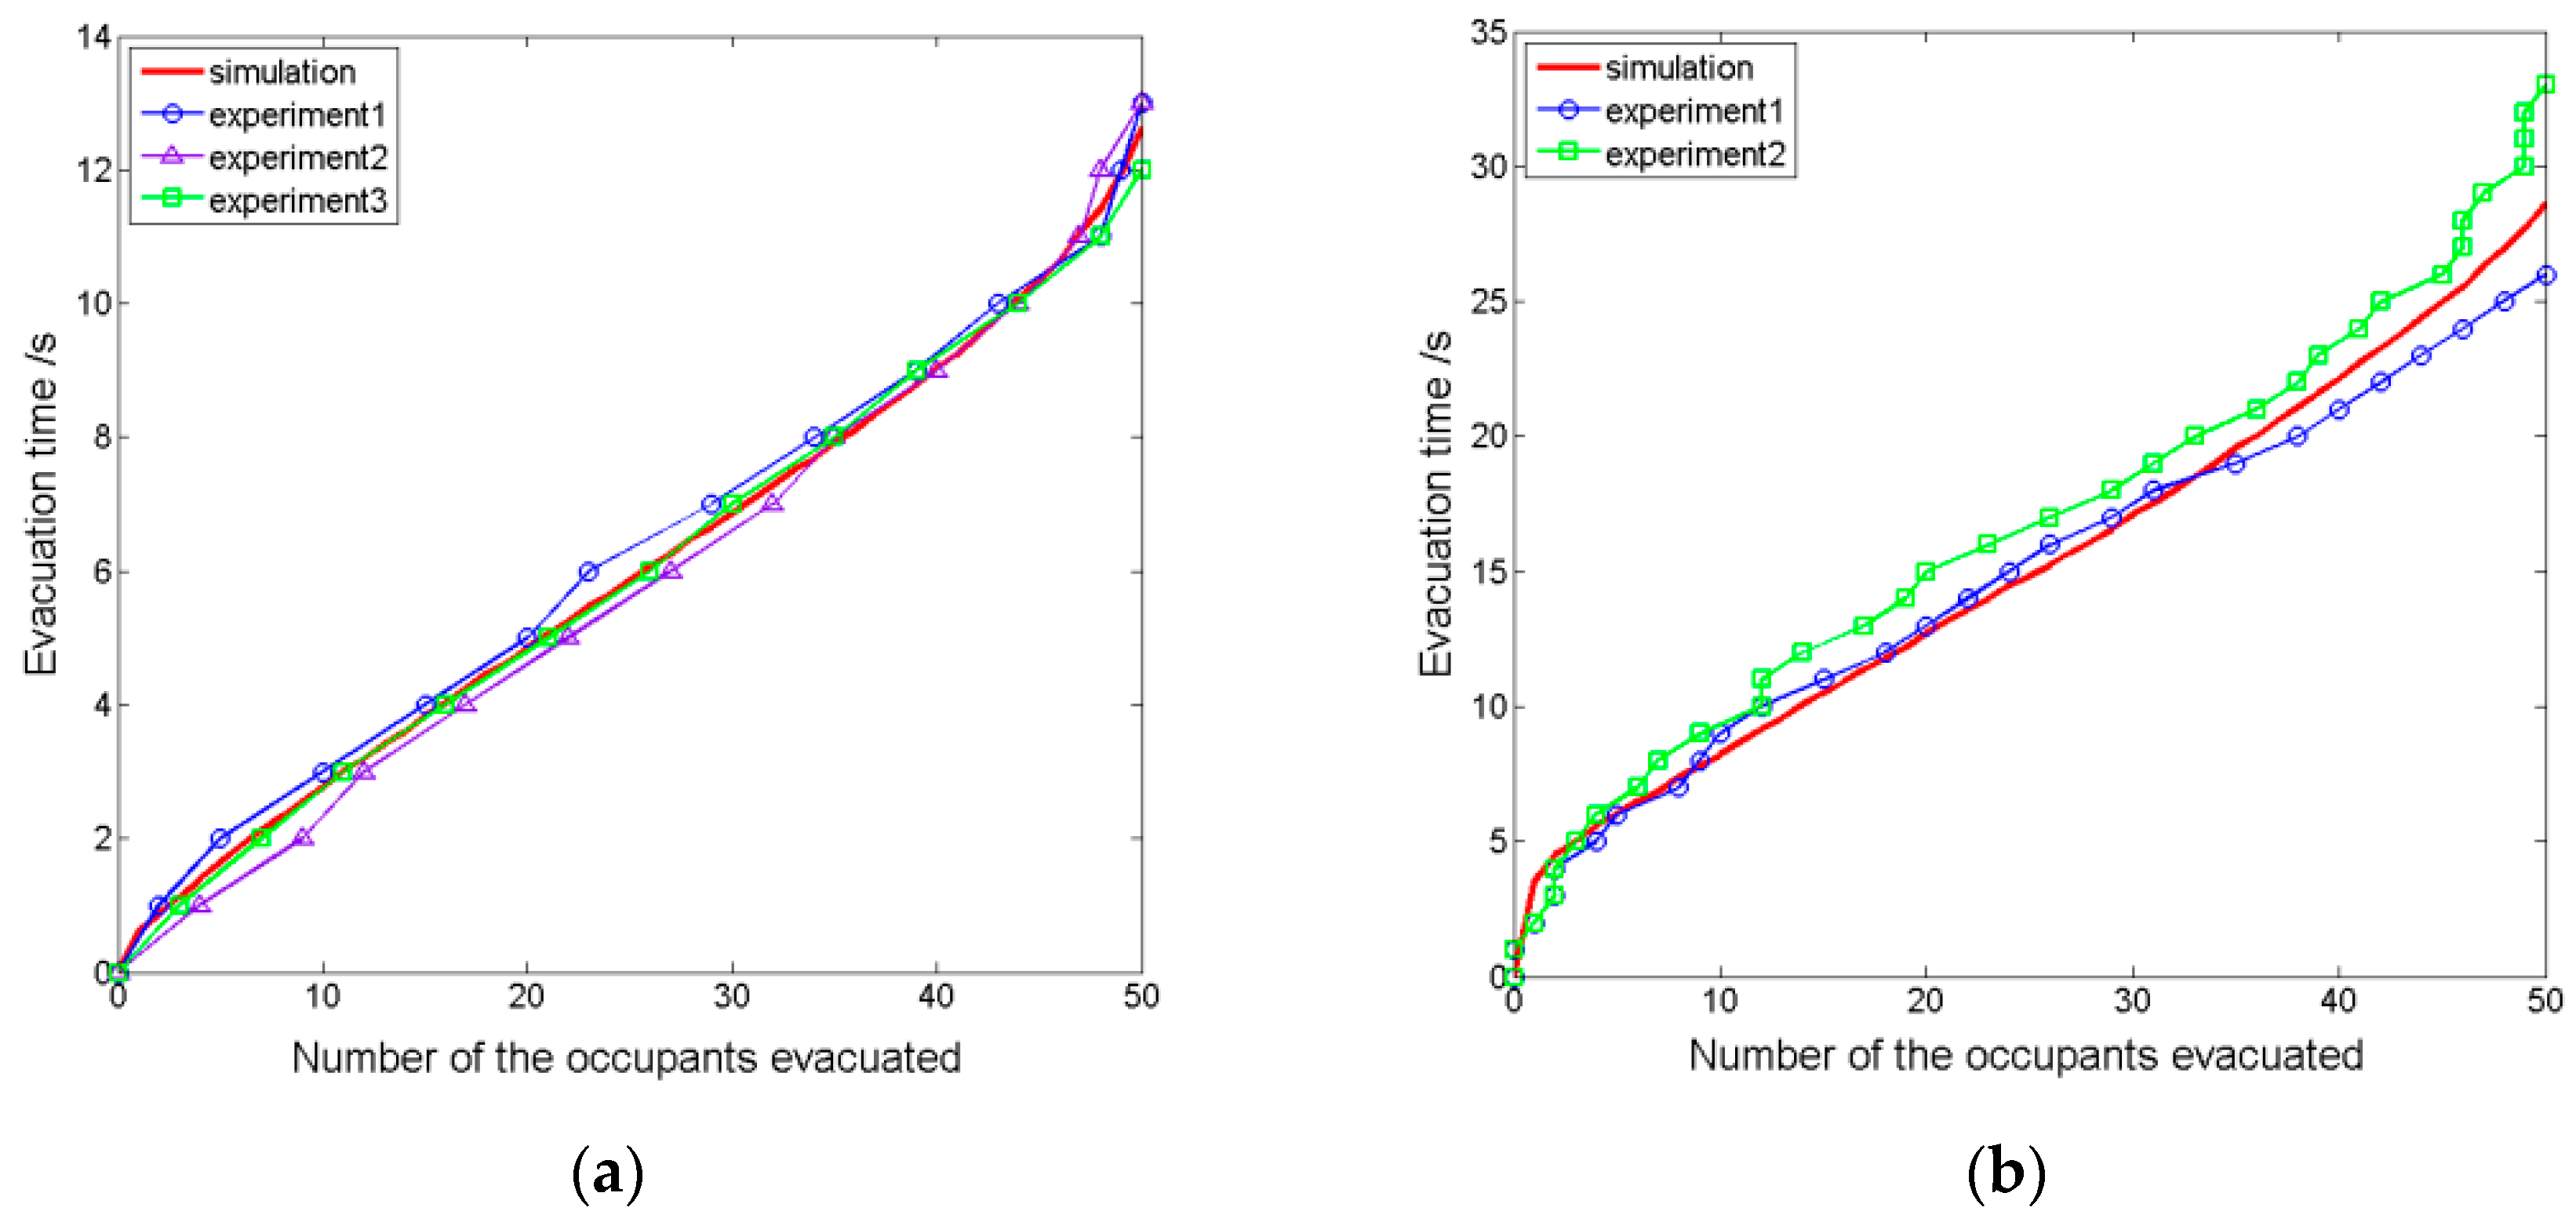
The average simulated evacuation time was calculated over 300 runs. The results of the experiments and simulations fit well, as shown in Figure 5, indicating the validity of the evacuation model. In scenario 1, k S was set to 10 and f was obtained to 1.92 persons/m/s for simulation. In scenario 2, k S was set to 5 and f was obtained to 1.75 persons/m/s for simulation. Therefore, k S = 5 and f k = 1.75 persons/m/s were used in the following simulations of low visibility.

4.3. Comparison of Simulation Results in Different Scenarios

A double-exit hall with a space size of 50 × 50 cellular grids was taken as the evacuation space, and the two exits were located on two opposite walls. The exit width was one cell, that is, w k = 0.5   m . VCA radius was 5 m, and the average patience time of pedestrians was Pa * = 10   s . k s = 5 ; f = 1.75 person/m/s; pedestrian speed was 1 m/s, and, in every time step, pedestrians moved one cell, so every time step took 0.5 m ÷ 1 m/s = 0.5 s. The visual perception radius was 5 m, the auditory perception was 2.5 m, and the number of trusted people was N trust = 5 . The wind direction was from exit 1 to exit 2. People tended to escape in the direction upwind of the gas diffusion, so δ 1 is set to be 0.8 while δ 2 is set to be 0.2. For all the pedestrians, α = β = 1 . Two evacuation scenarios were set up. In scenario 1, all pedestrians knew the information of the two exits, but were not aware of the existence of toxic gas. In scenario 2, all pedestrians were initially unaware of the toxic gas, as well as the existence of exit 1.
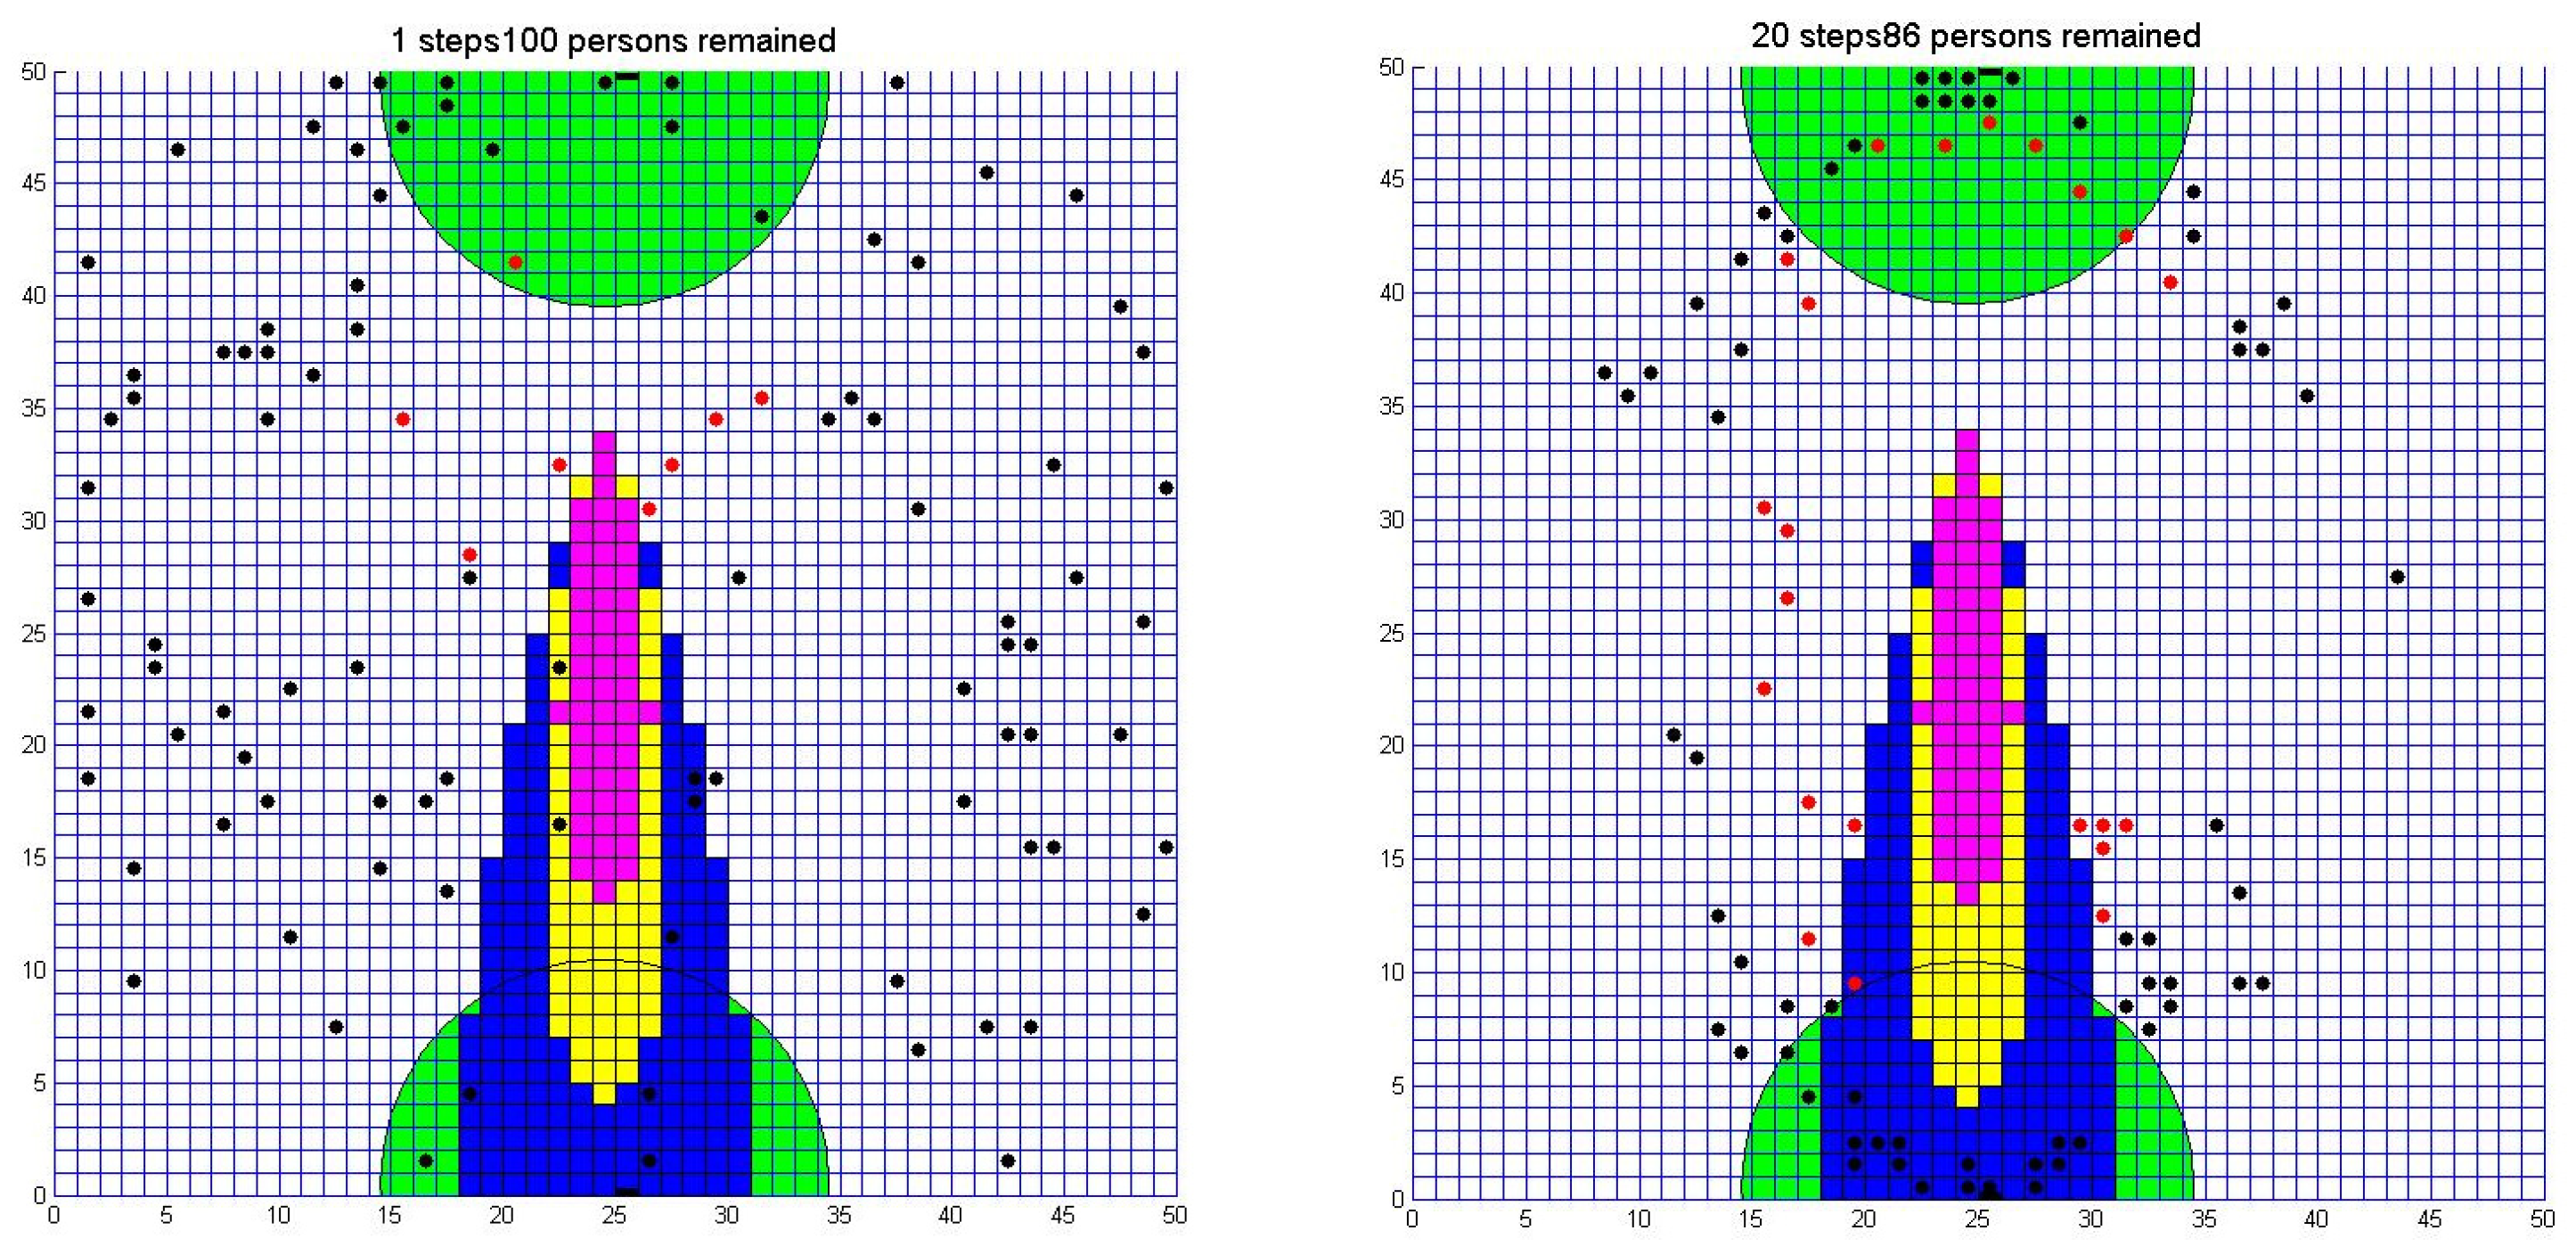
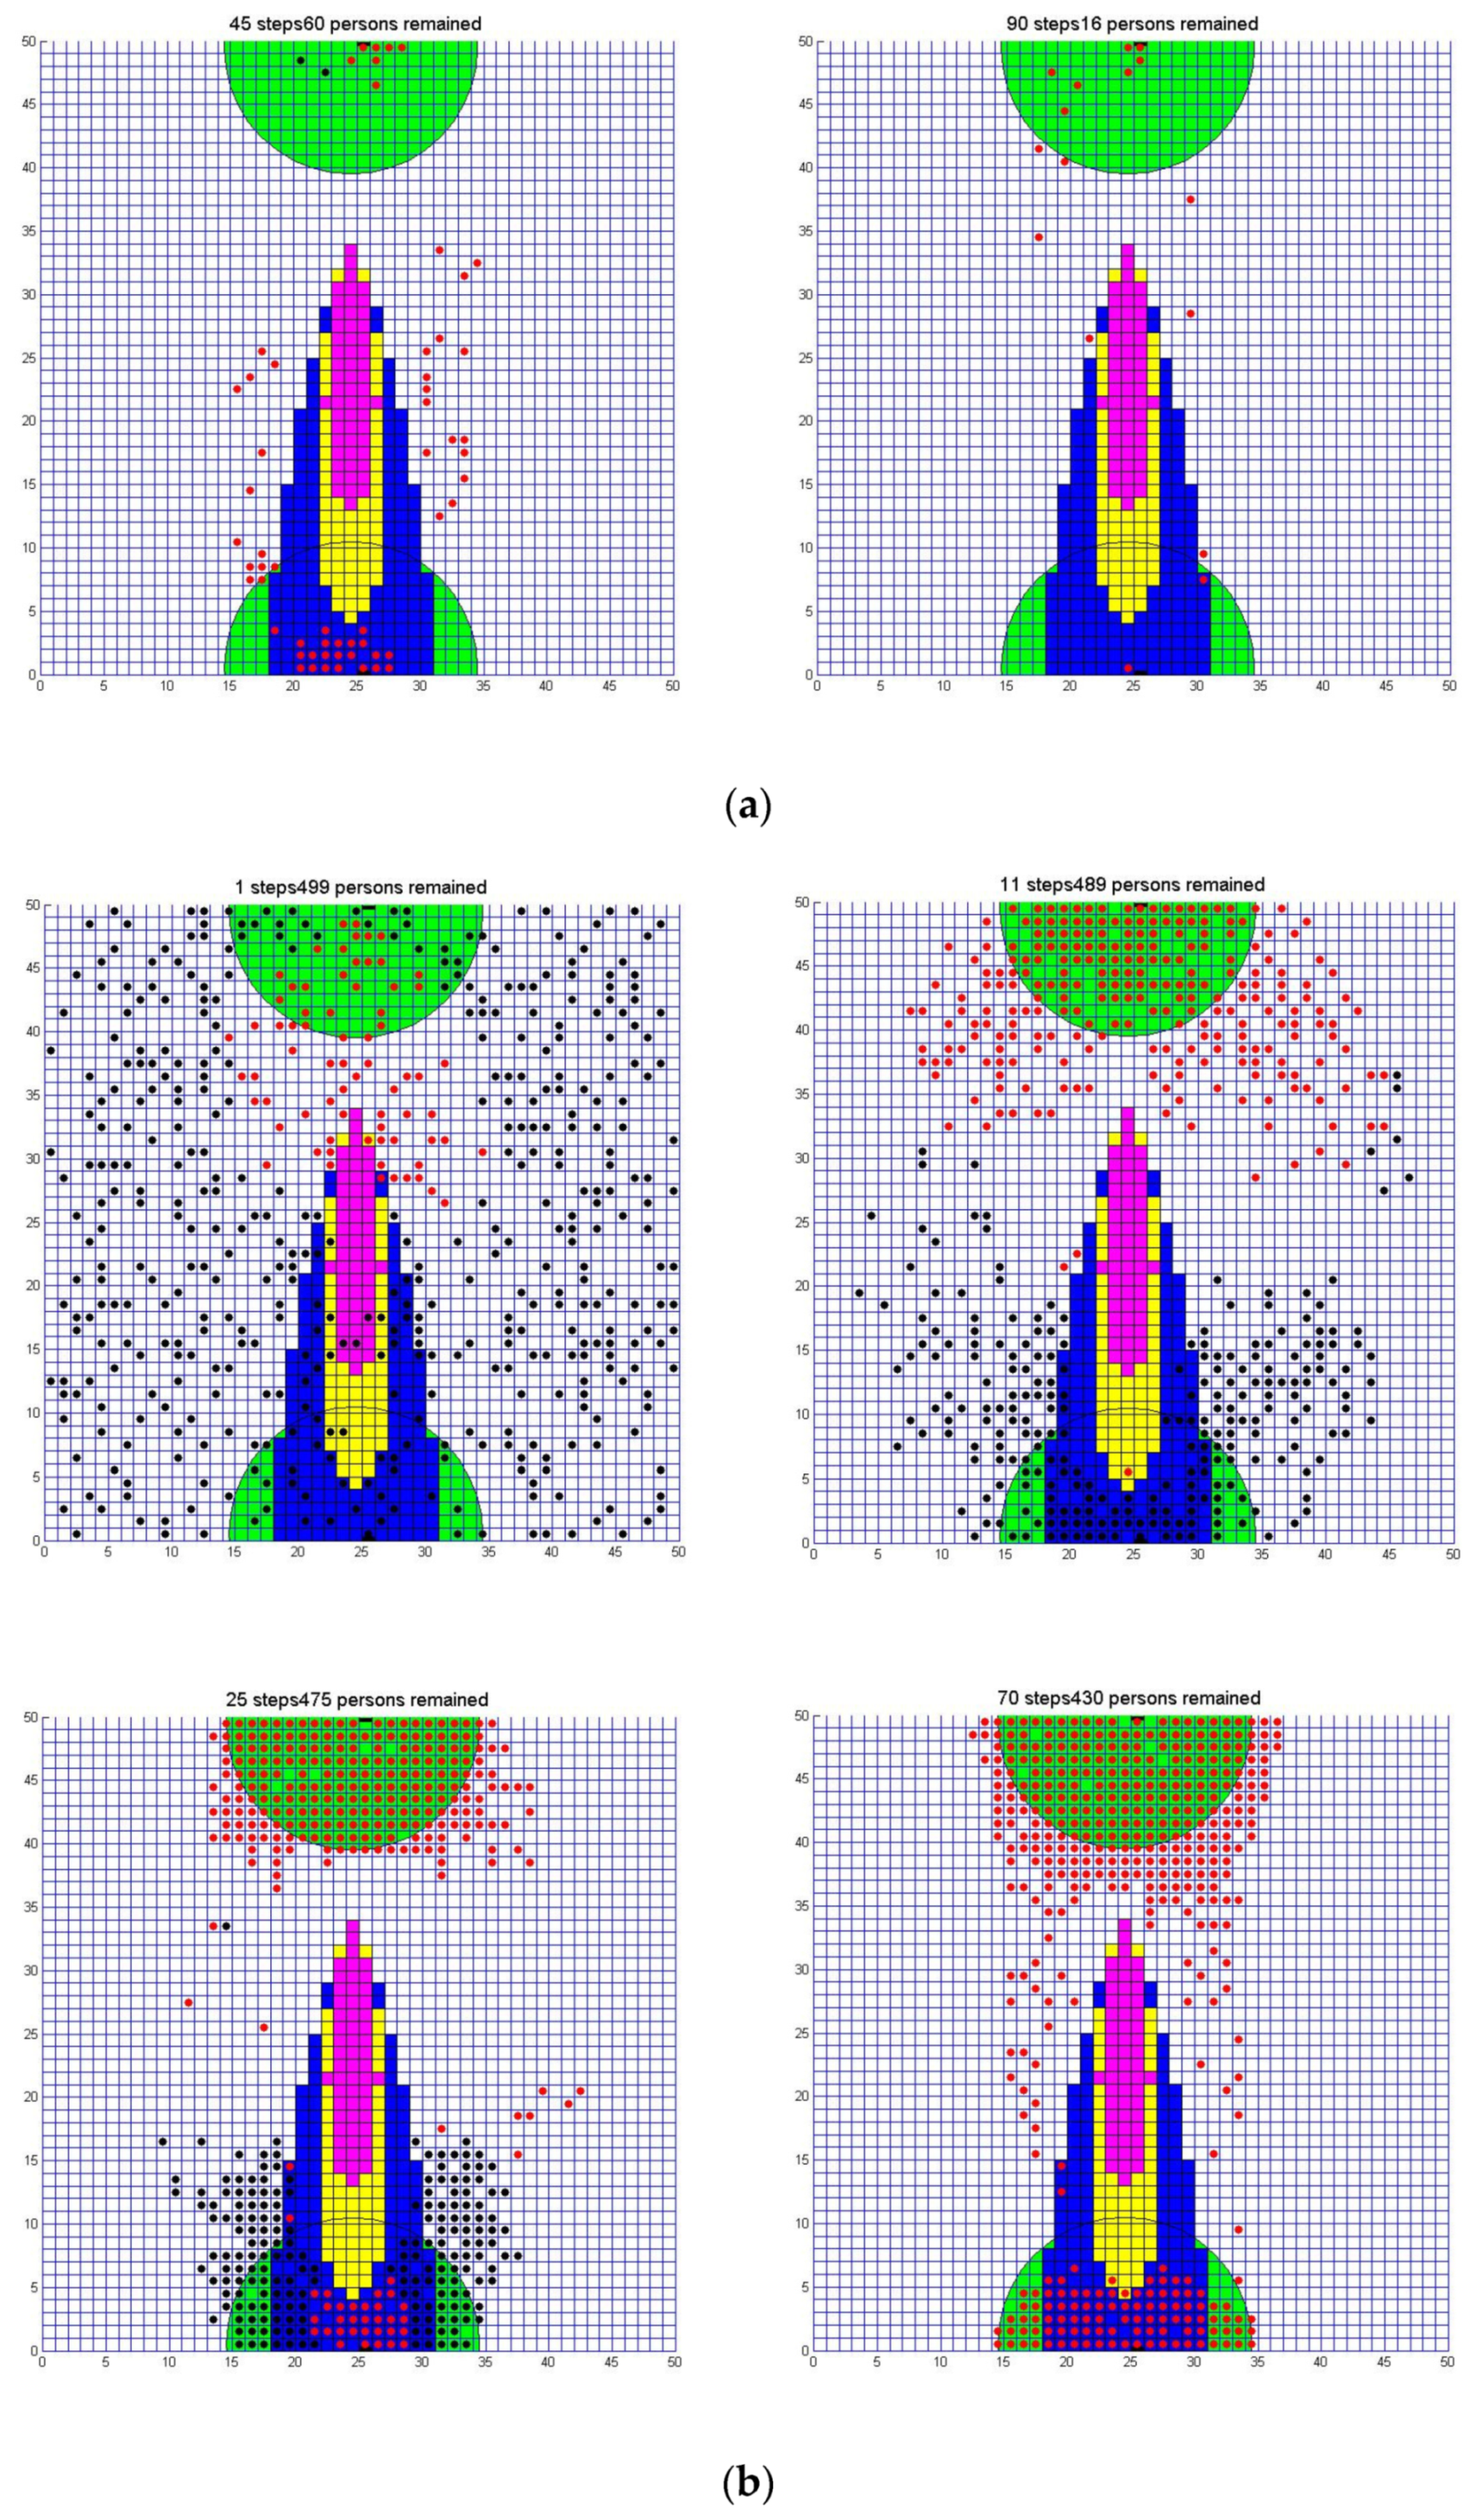
Figure 6 shows the process by which pedestrians acquired the toxic gas source information, through information perception and transmission in scenario 1. When the initial number of people was 100, although exit 1 was safer and in the upwind direction, most pedestrians who saw the toxic gas source chose exit 2. This is because the gas source was located close to exit 1 and the crowd density in the direction of exit 2 was low. As pedestrians gathered near exit 2, more pedestrians received danger information by information transmission and, therefore, may have chosen exit 1 for congestion and danger avoidance. When the initial number of people was 500, although the gas source was located close to exit 1, most pedestrians who saw the toxic gas source chose exit 1 due to the density of the crowd in the direction of exit 2. As a large number of pedestrians gathered near exit 2, more pedestrians blocked at exit 2 perceived danger information when their toxic load reached the injury dose; therefore, these pedestrians may reselect their target exit.
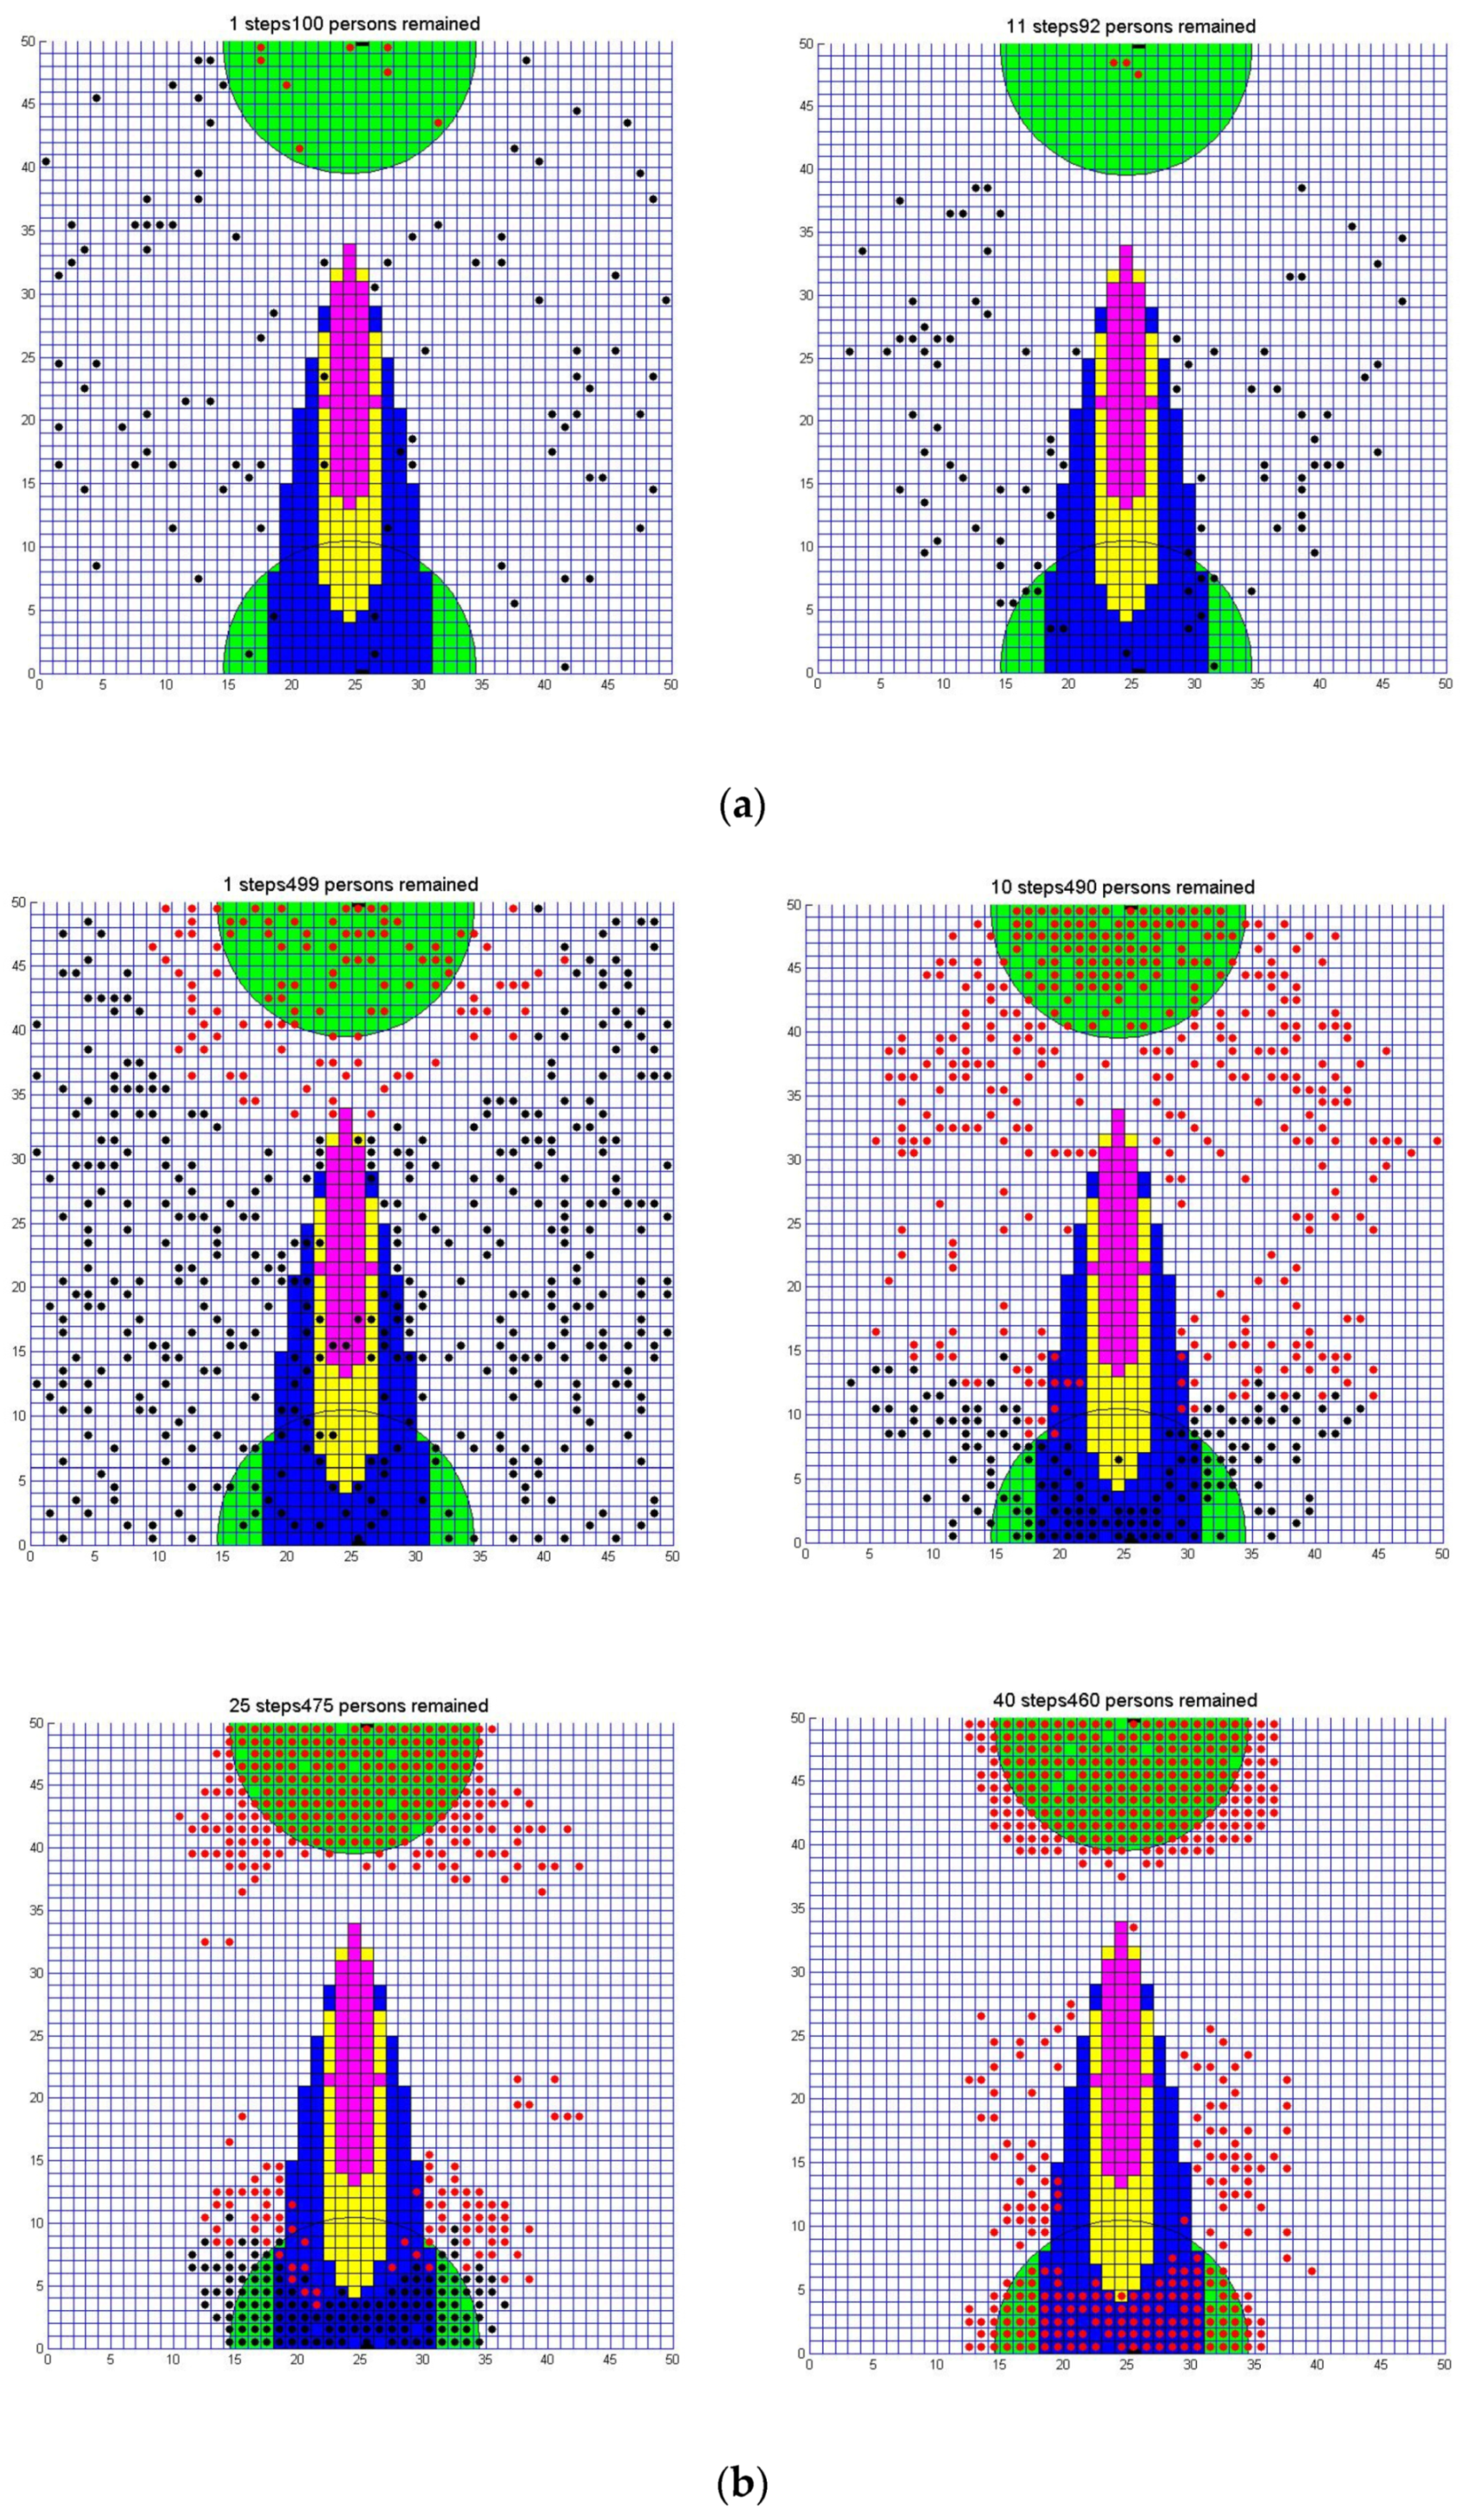
Figure 7 shows the process by which pedestrians acquired exit location information, through information perception and transmission in scenario 2. When the initial number of people was 100, the crowd density was low, so most people had no information about exit 1 except for the exits in the range of view. They can only choose exit 2 to escape. When the initial number of people was 500, the crowd density was high, and exit information was quickly transmitted. When the exit reselection condition was triggered, many people chose exit 1 in the upwind direction to escape.
According to the phenomenon of evacuation processes shown in Figure 6 and Figure 7, the advantages of the presented model are proved from the following aspects: (1) Pedestrians can receive information at a certain perception distance to an exit or a source of danger compared with [6,7], which applied a pushing force. (2) Pedestrians can receive danger information not only when they see an emergency has occurred [11] but also when their toxic load reaches the injury dose, as shown in Figure 6b. (3) The extent of trust is introduced to express the information selection and accumulation instead of immediately reserving information or adding 1 to the information number when communicating [13].

4.4. Influence of Perception Distance on Evacuation Results

4.4.1. Hearing Distance

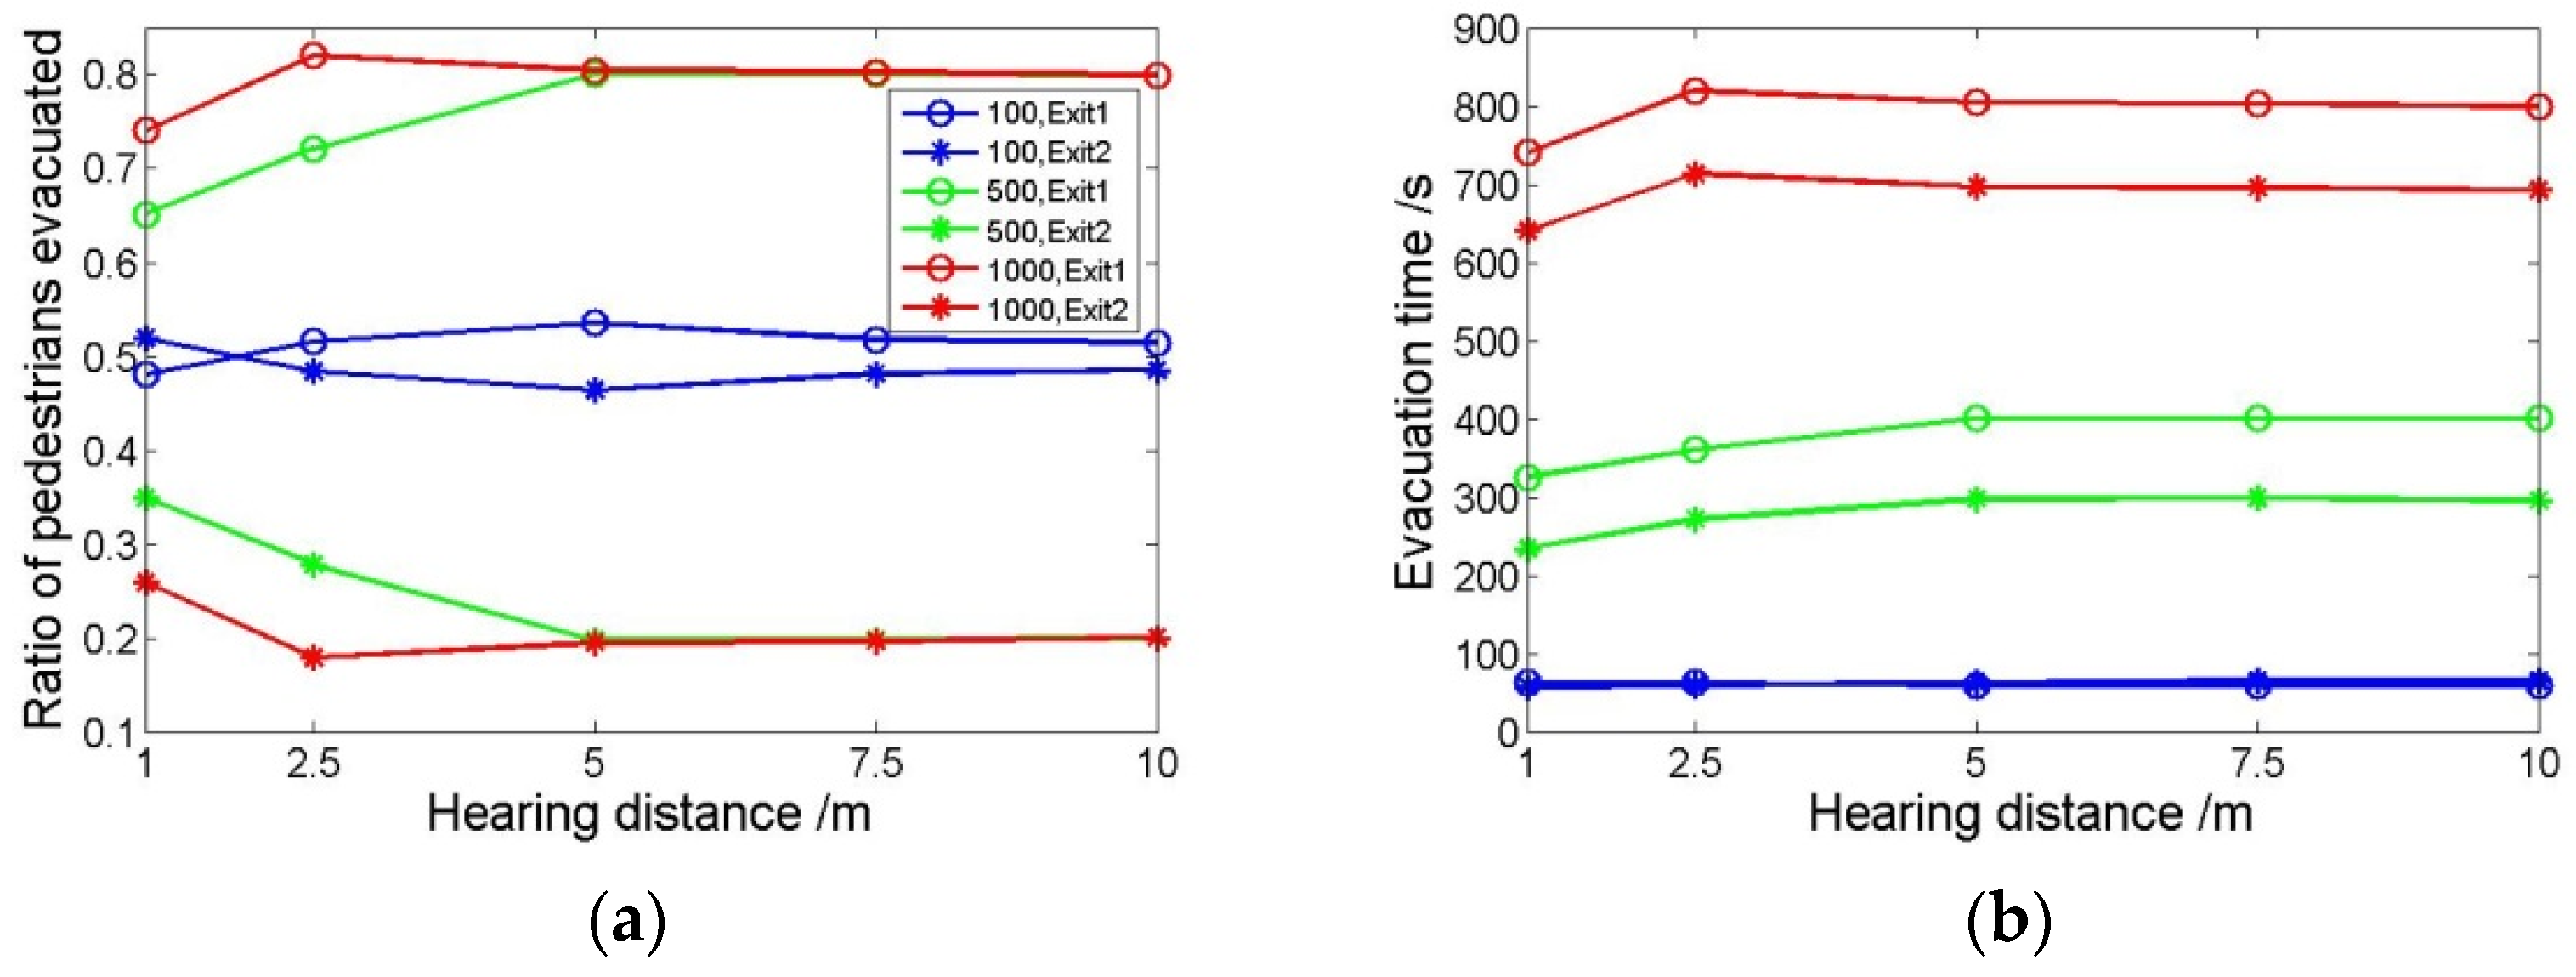
In scenario 1, different hearing distances are set at 1 m, 2.5 m, 5 m, 7.5 m and 10 m, respectively, and the evacuation results are shown in Figure 8. This shows the ratio of people and evacuation time passing through two exits when the initial number of people is 100, 500 and 1000, respectively. It can be seen from Figure 8a that with the increase in hearing distance, the proportion of people passing through exit 1 first increases and then remains steady or decreases slightly, while the proportion of people passing through exit 2 first decreases and then remains steady or slightly increases. The number of people and time of passing through exit 1 increases because people with a large hearing distance can acquire OGK faster and choose the exit in the upwind direction. It can be seen from Figure 8b that the evacuation time for exit 1 and exit 2 first rises and then remains steady or slightly decreases when the number of people reached 500 and 1000. This is mainly because people choose exit 1 in the upwind direction more quickly, resulting in a long congestion time and evacuation time. People with a long congestion time return to exit 2, so the final evacuation time of exit 2 also increases. 
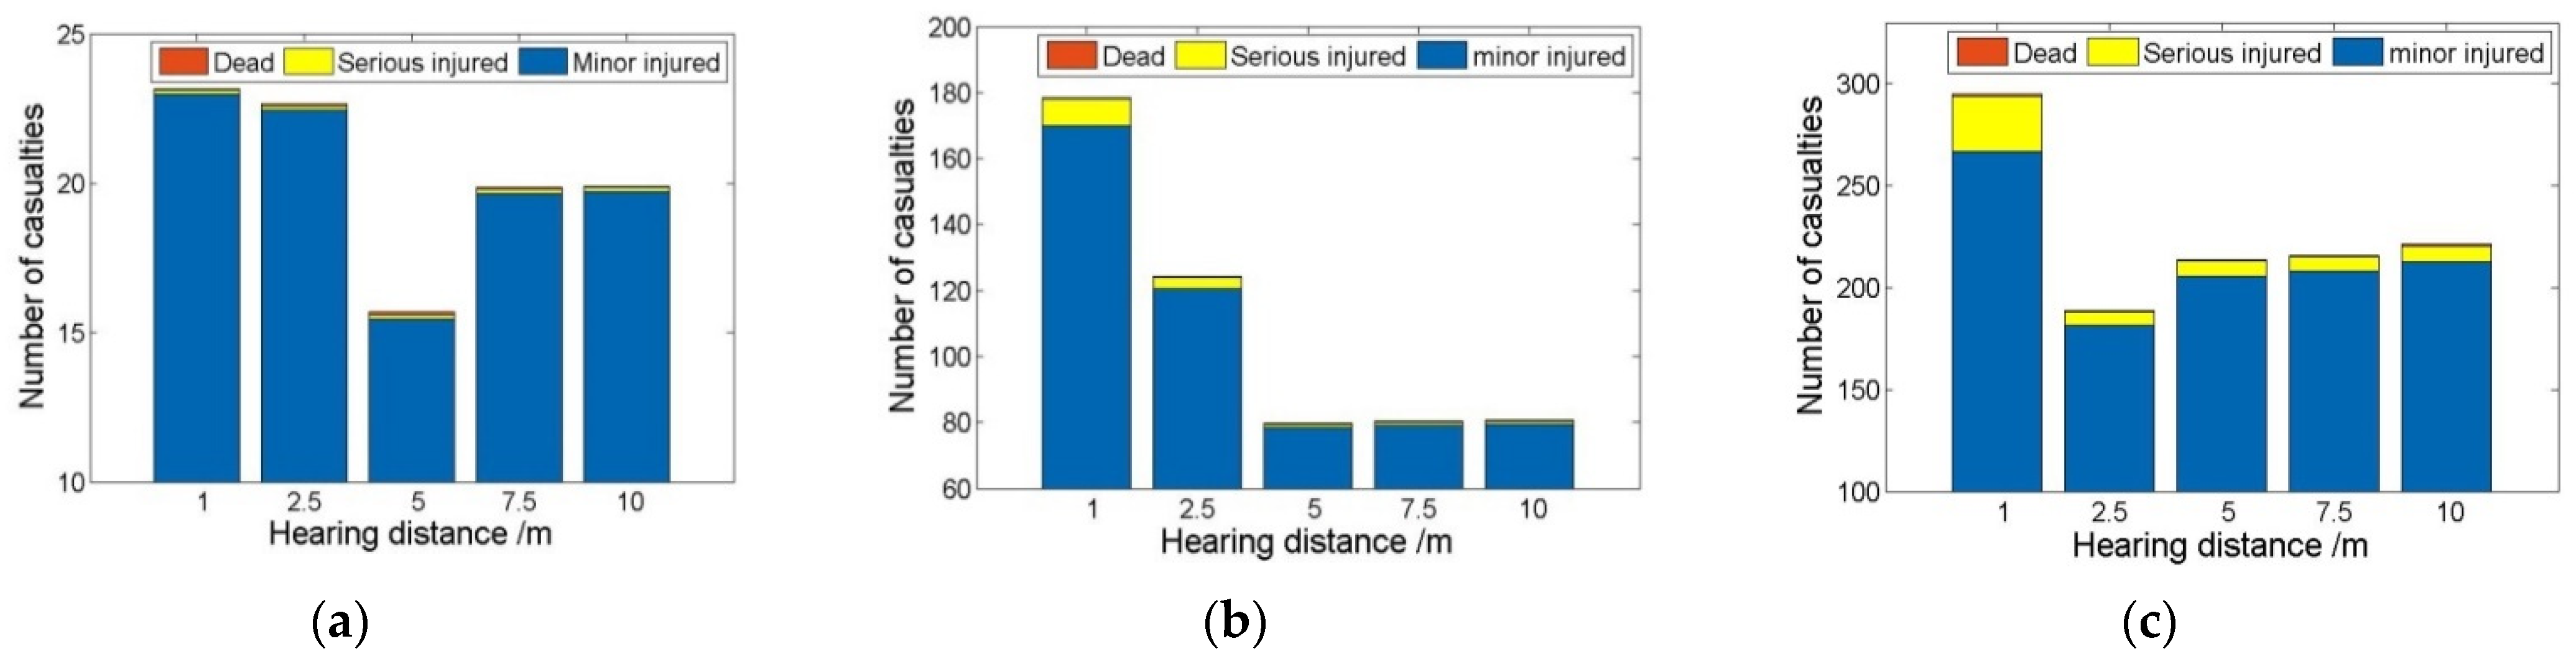
Figure 9 shows the number of people with minor injuries, serious injuries and deaths, which is opposite to the evacuation time trend. The longer the evacuation time, the smaller the number of casualties. The figure shows that a large hearing distance can spread toxic gas information more quickly, which increases the evacuation time, but improves the safety of evacuees.

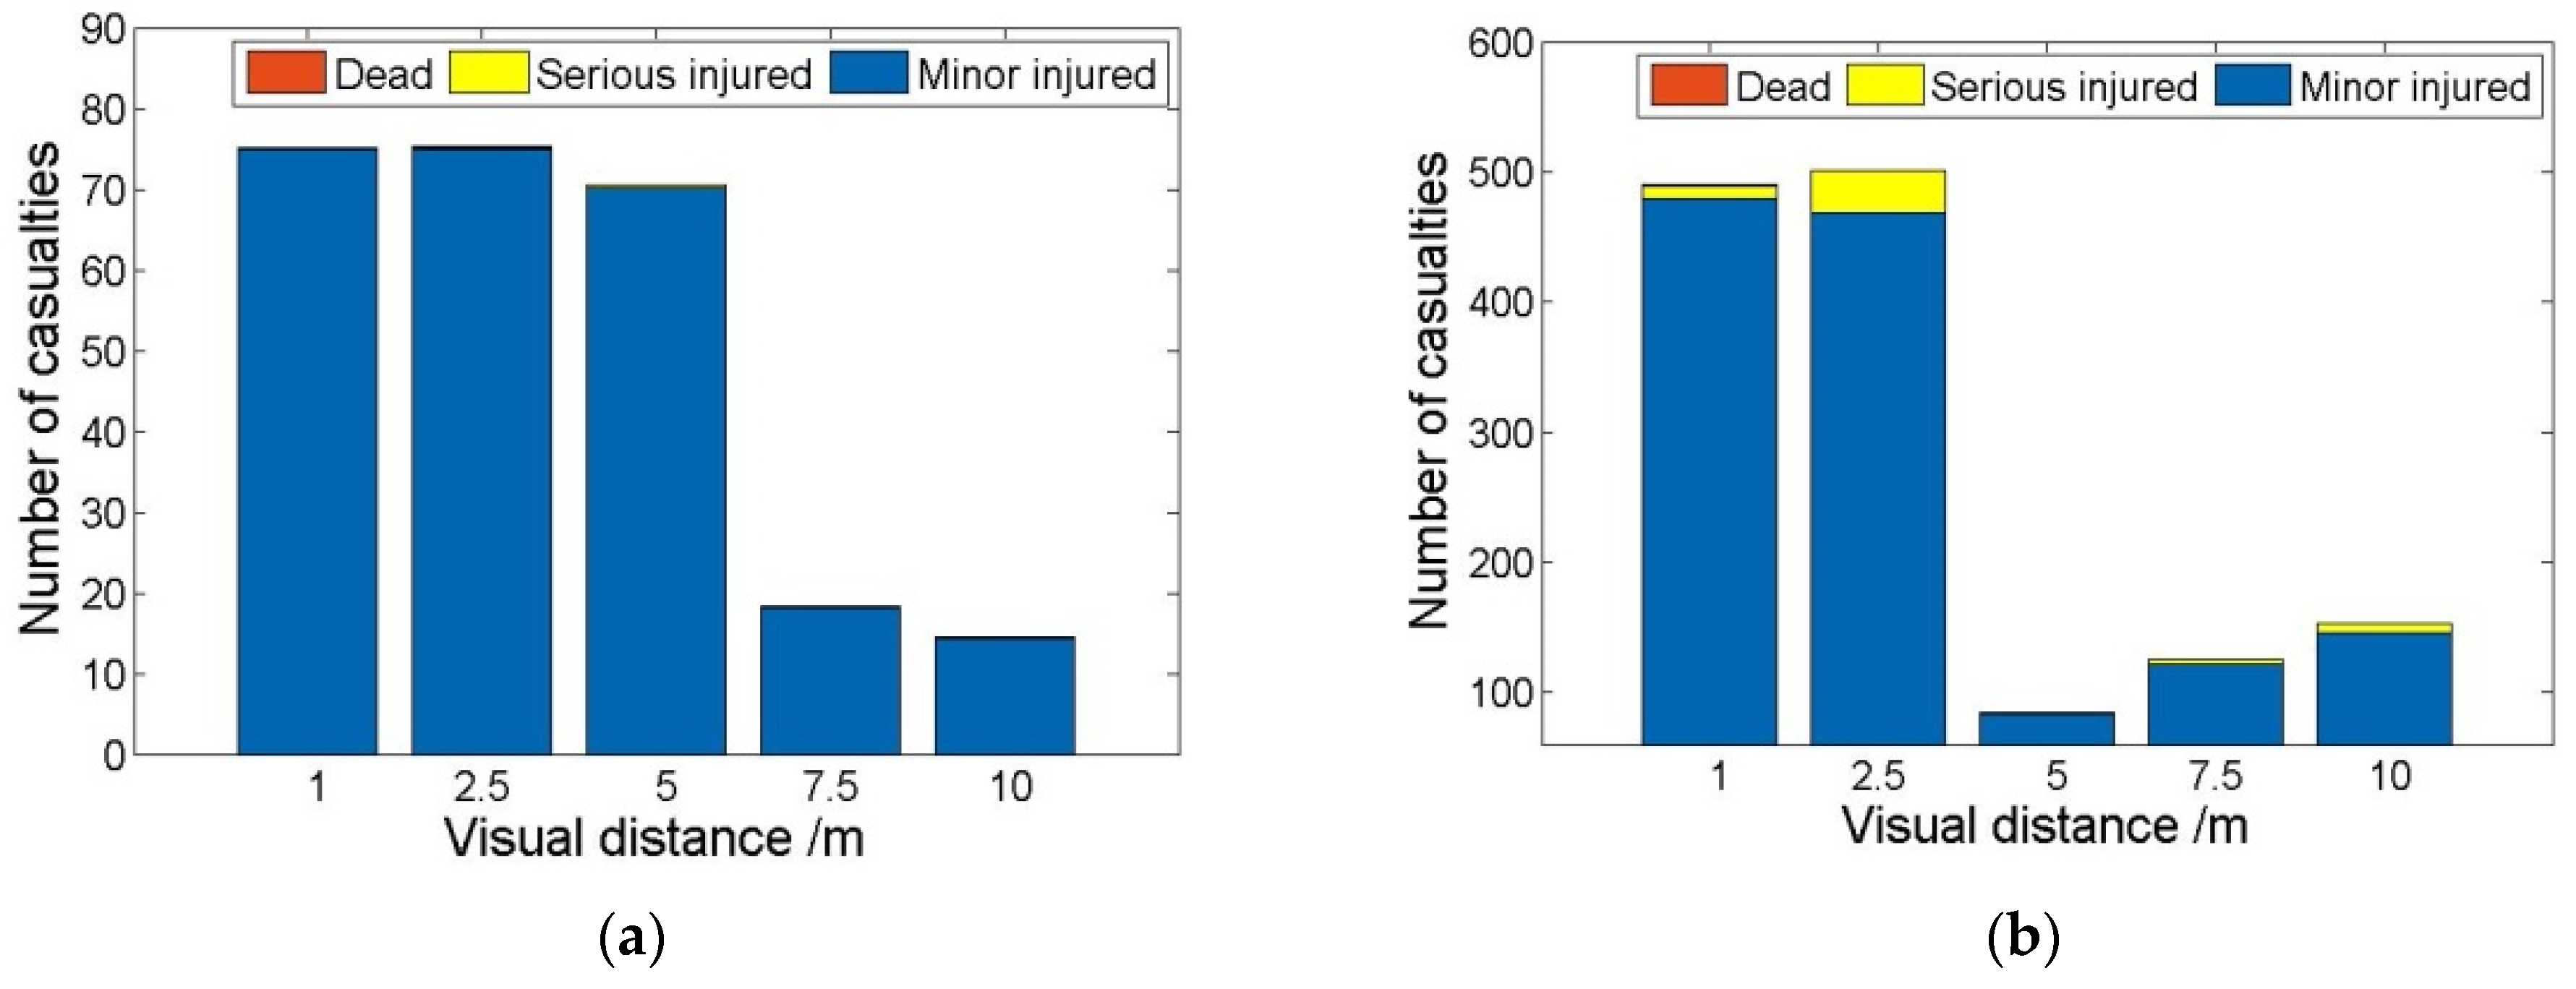
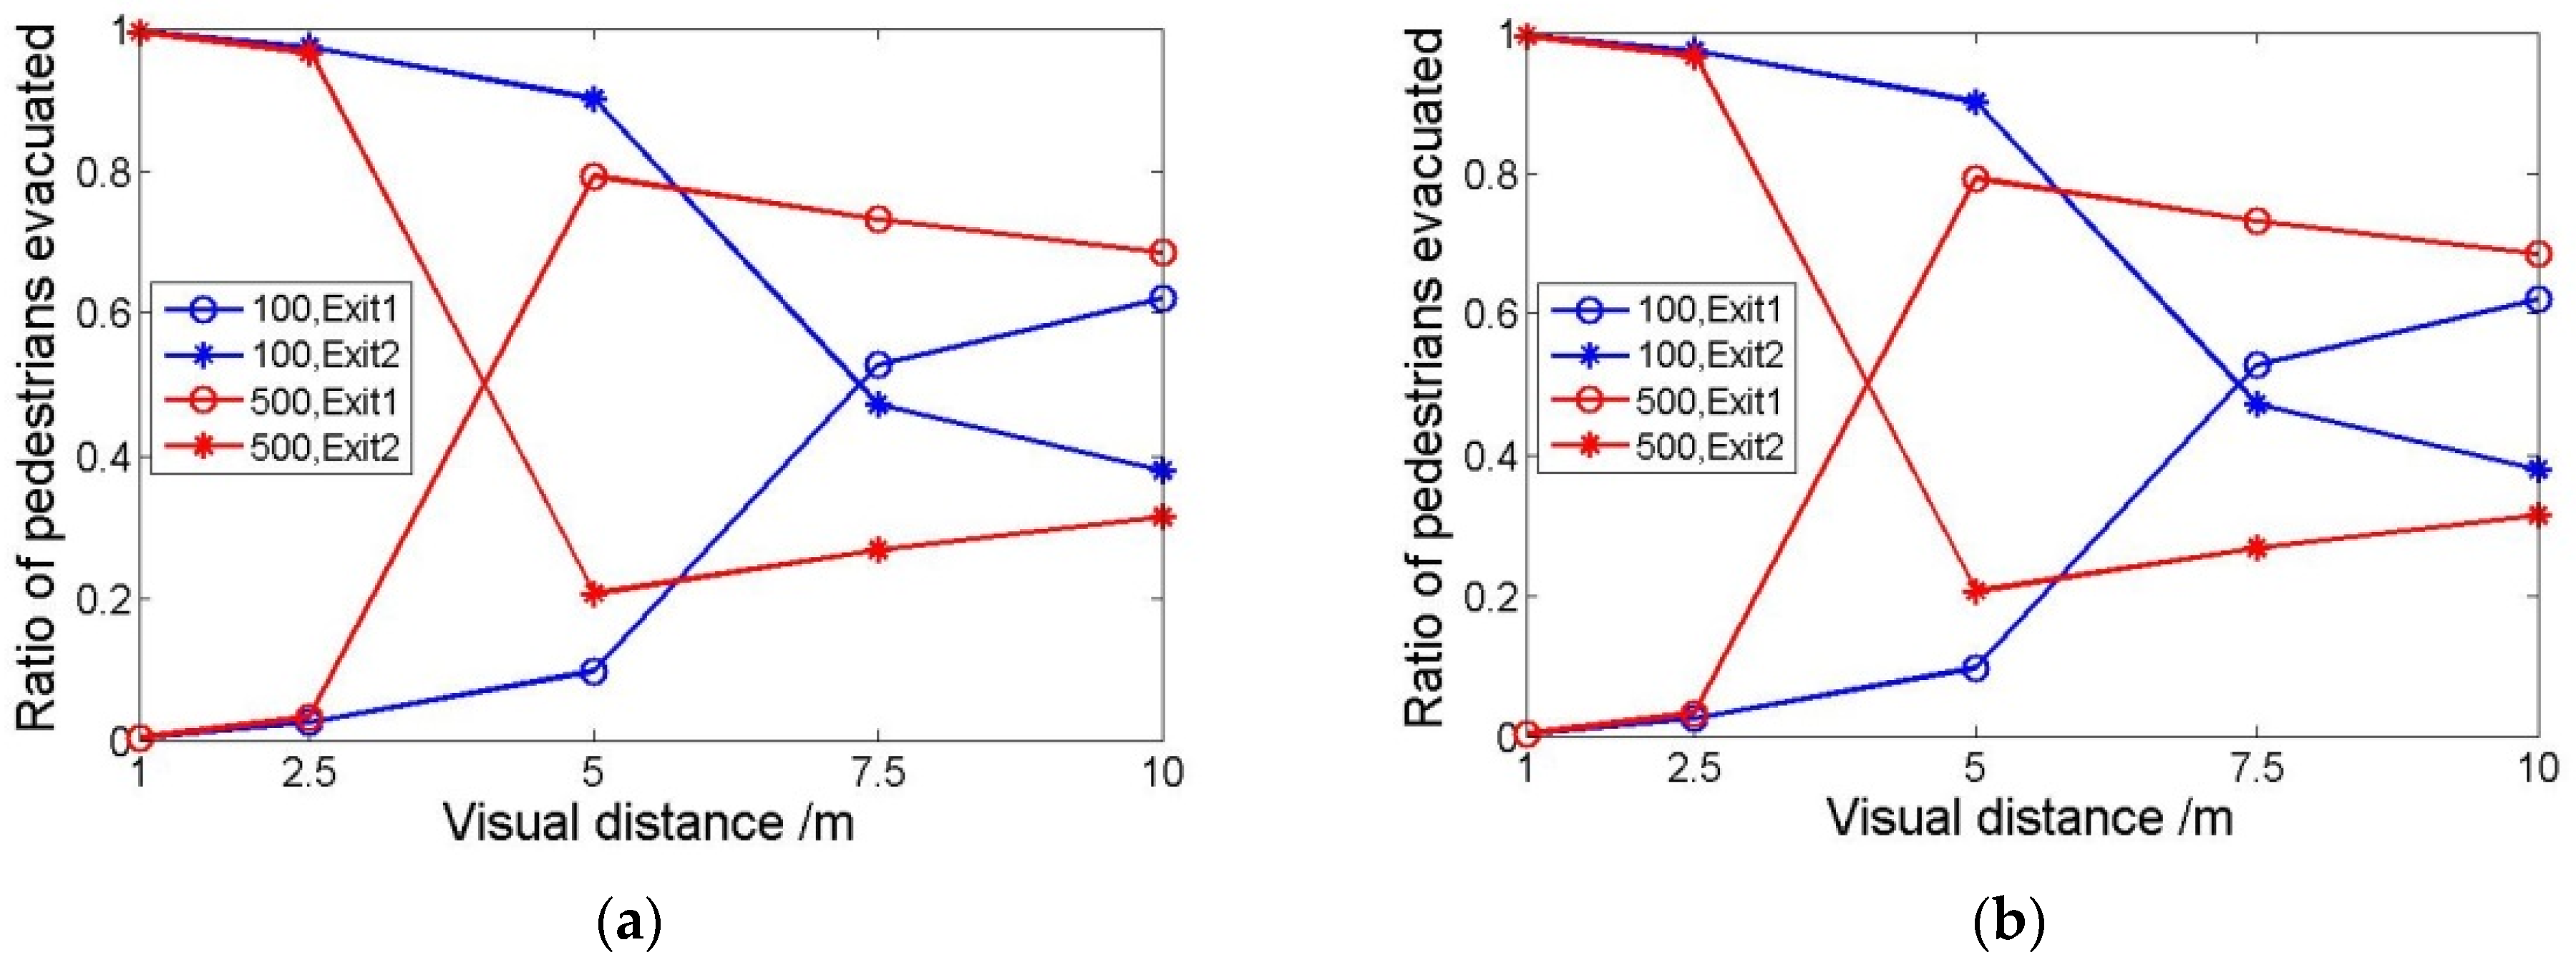
4.4.2. Visual Distance

In scenario 1, different visual distances are set as 1 m, 2.5 m, 5 m, 7.5 m and 10 m, respectively, and the evacuation results are shown in Figure 10. This shows the ratio of people and evacuation time for passing through two exits when the initial number of people was 100 and 500, respectively. With the increase in visual distance, more people acquire information regarding exit 1. The proportion of people passing through exit 1 increased, which diverted people from exit 2, so the total evacuation time decreased. When the crowd density was relatively high (500 people), the proportion of people passing through exit 1 increased more quickly due to the increase in information transmission. When the initial number of people was 500, the proportion of people passing through exit 1 first increased and then decreased. This is mainly because the counting area is related to visual distance, which affects people’s estimation of the number of people on the exit route. When the visual distance is larger, people near exit 1 may see more congested people, so they may change their choice and return to exit 2.
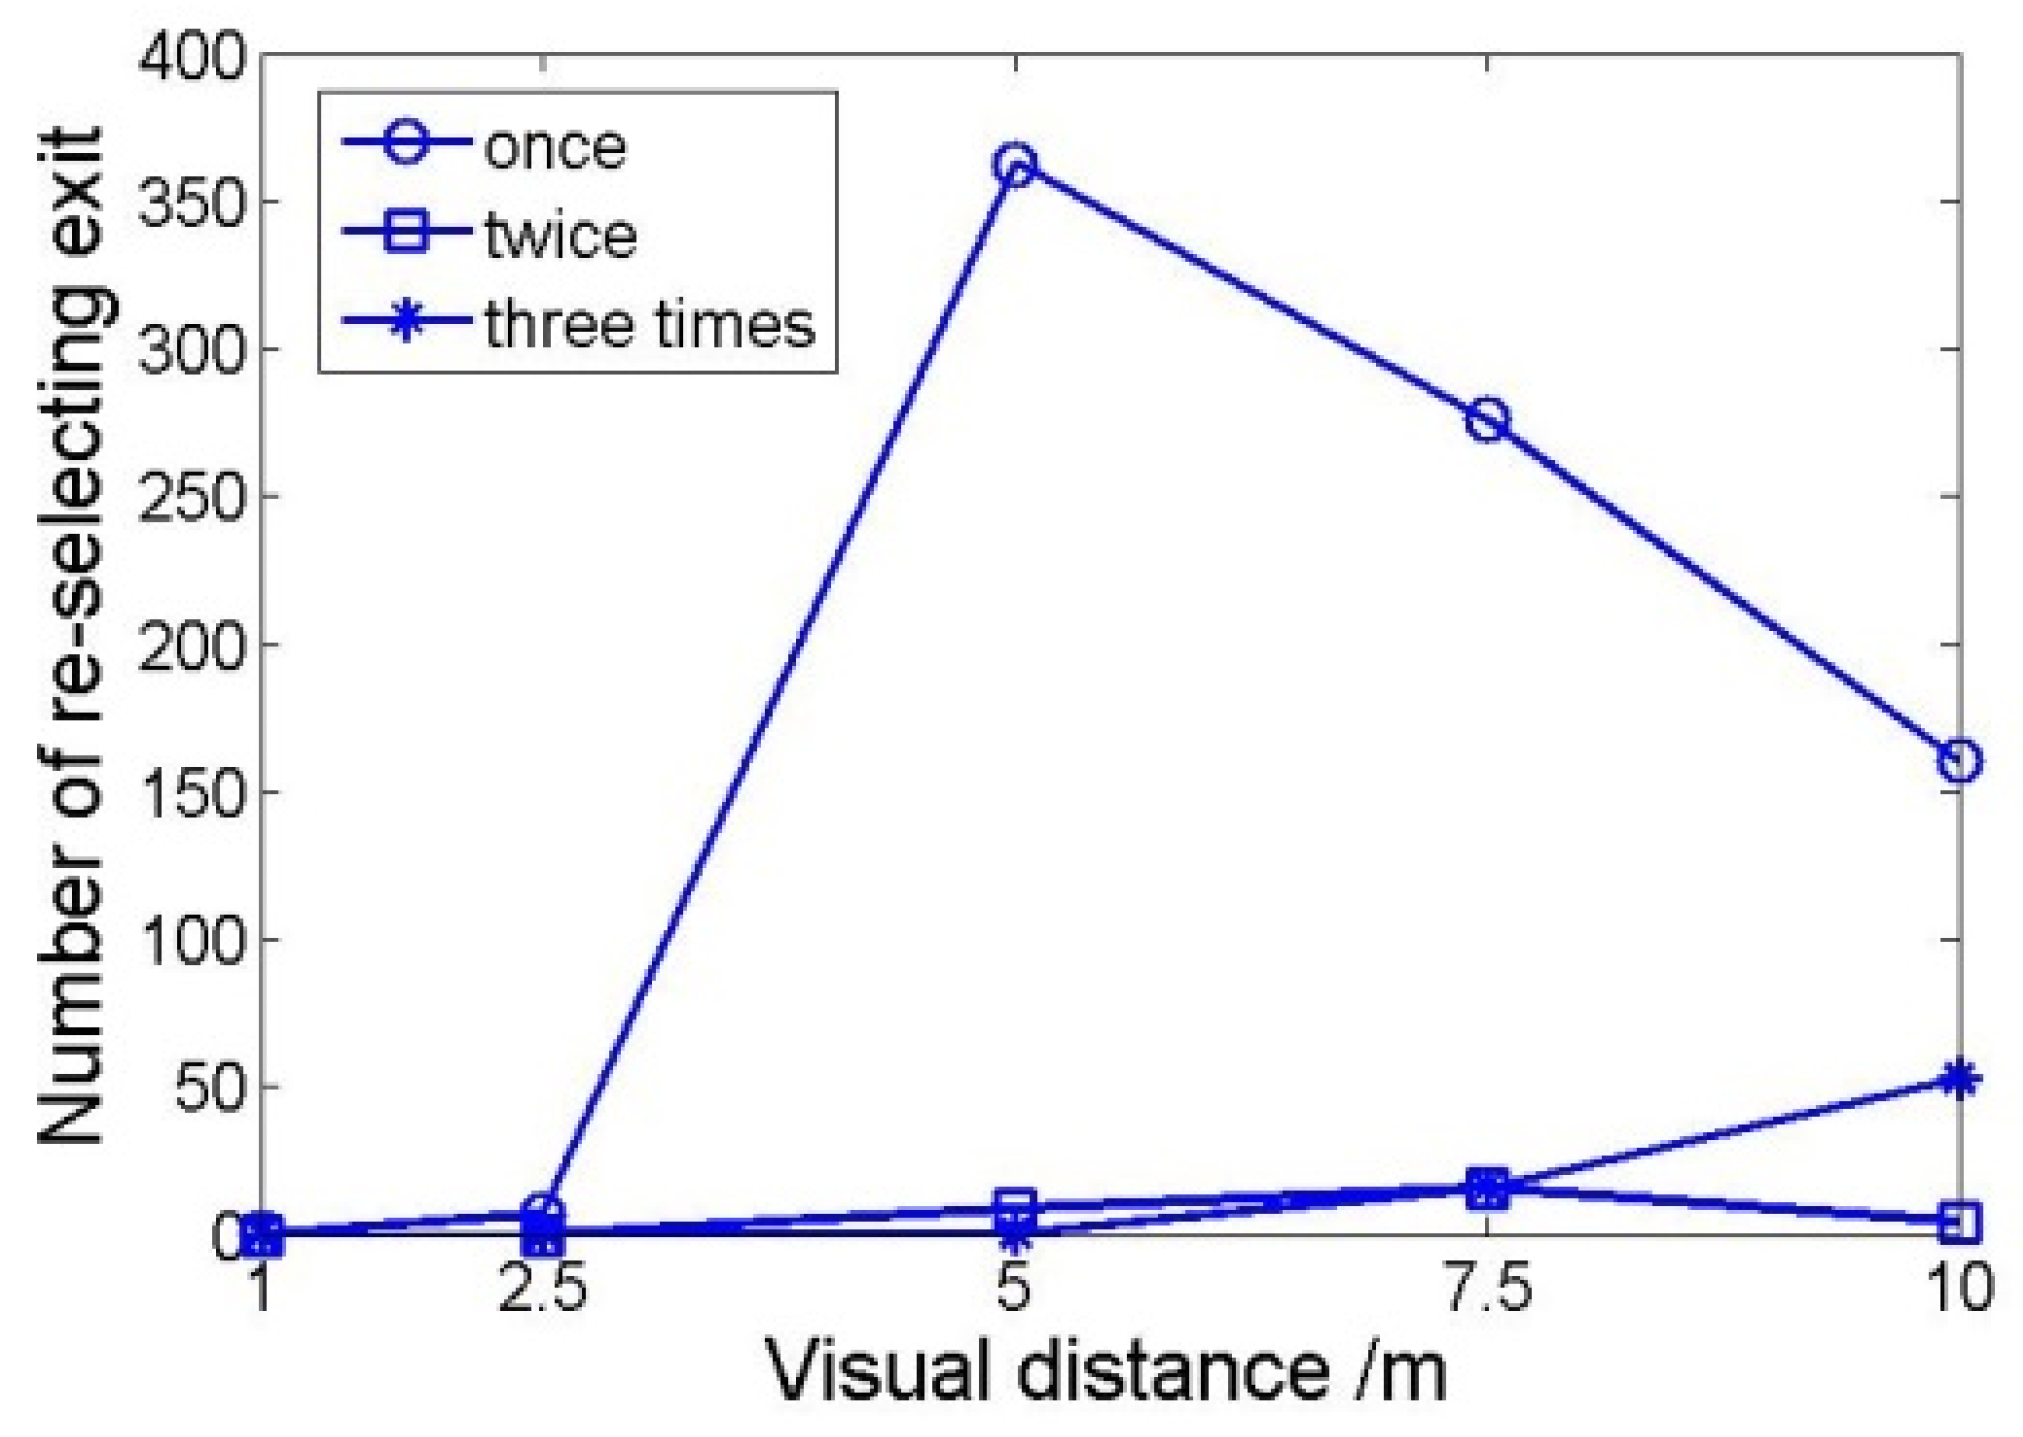
As shown in Figure 11, when the visual distance is 5 m, the number of people who change the target exit only once is highest, that is, people do not change their choice of exit after choosing exit 1. Although this increases the evacuation time of exit 1, it improves the safety of evacuees. When the visual distance is larger than 5 m, although the overall evacuation time is reduced, the number of casualties increases because some people wander and return to exit 2 (as shown in Figure 12b).

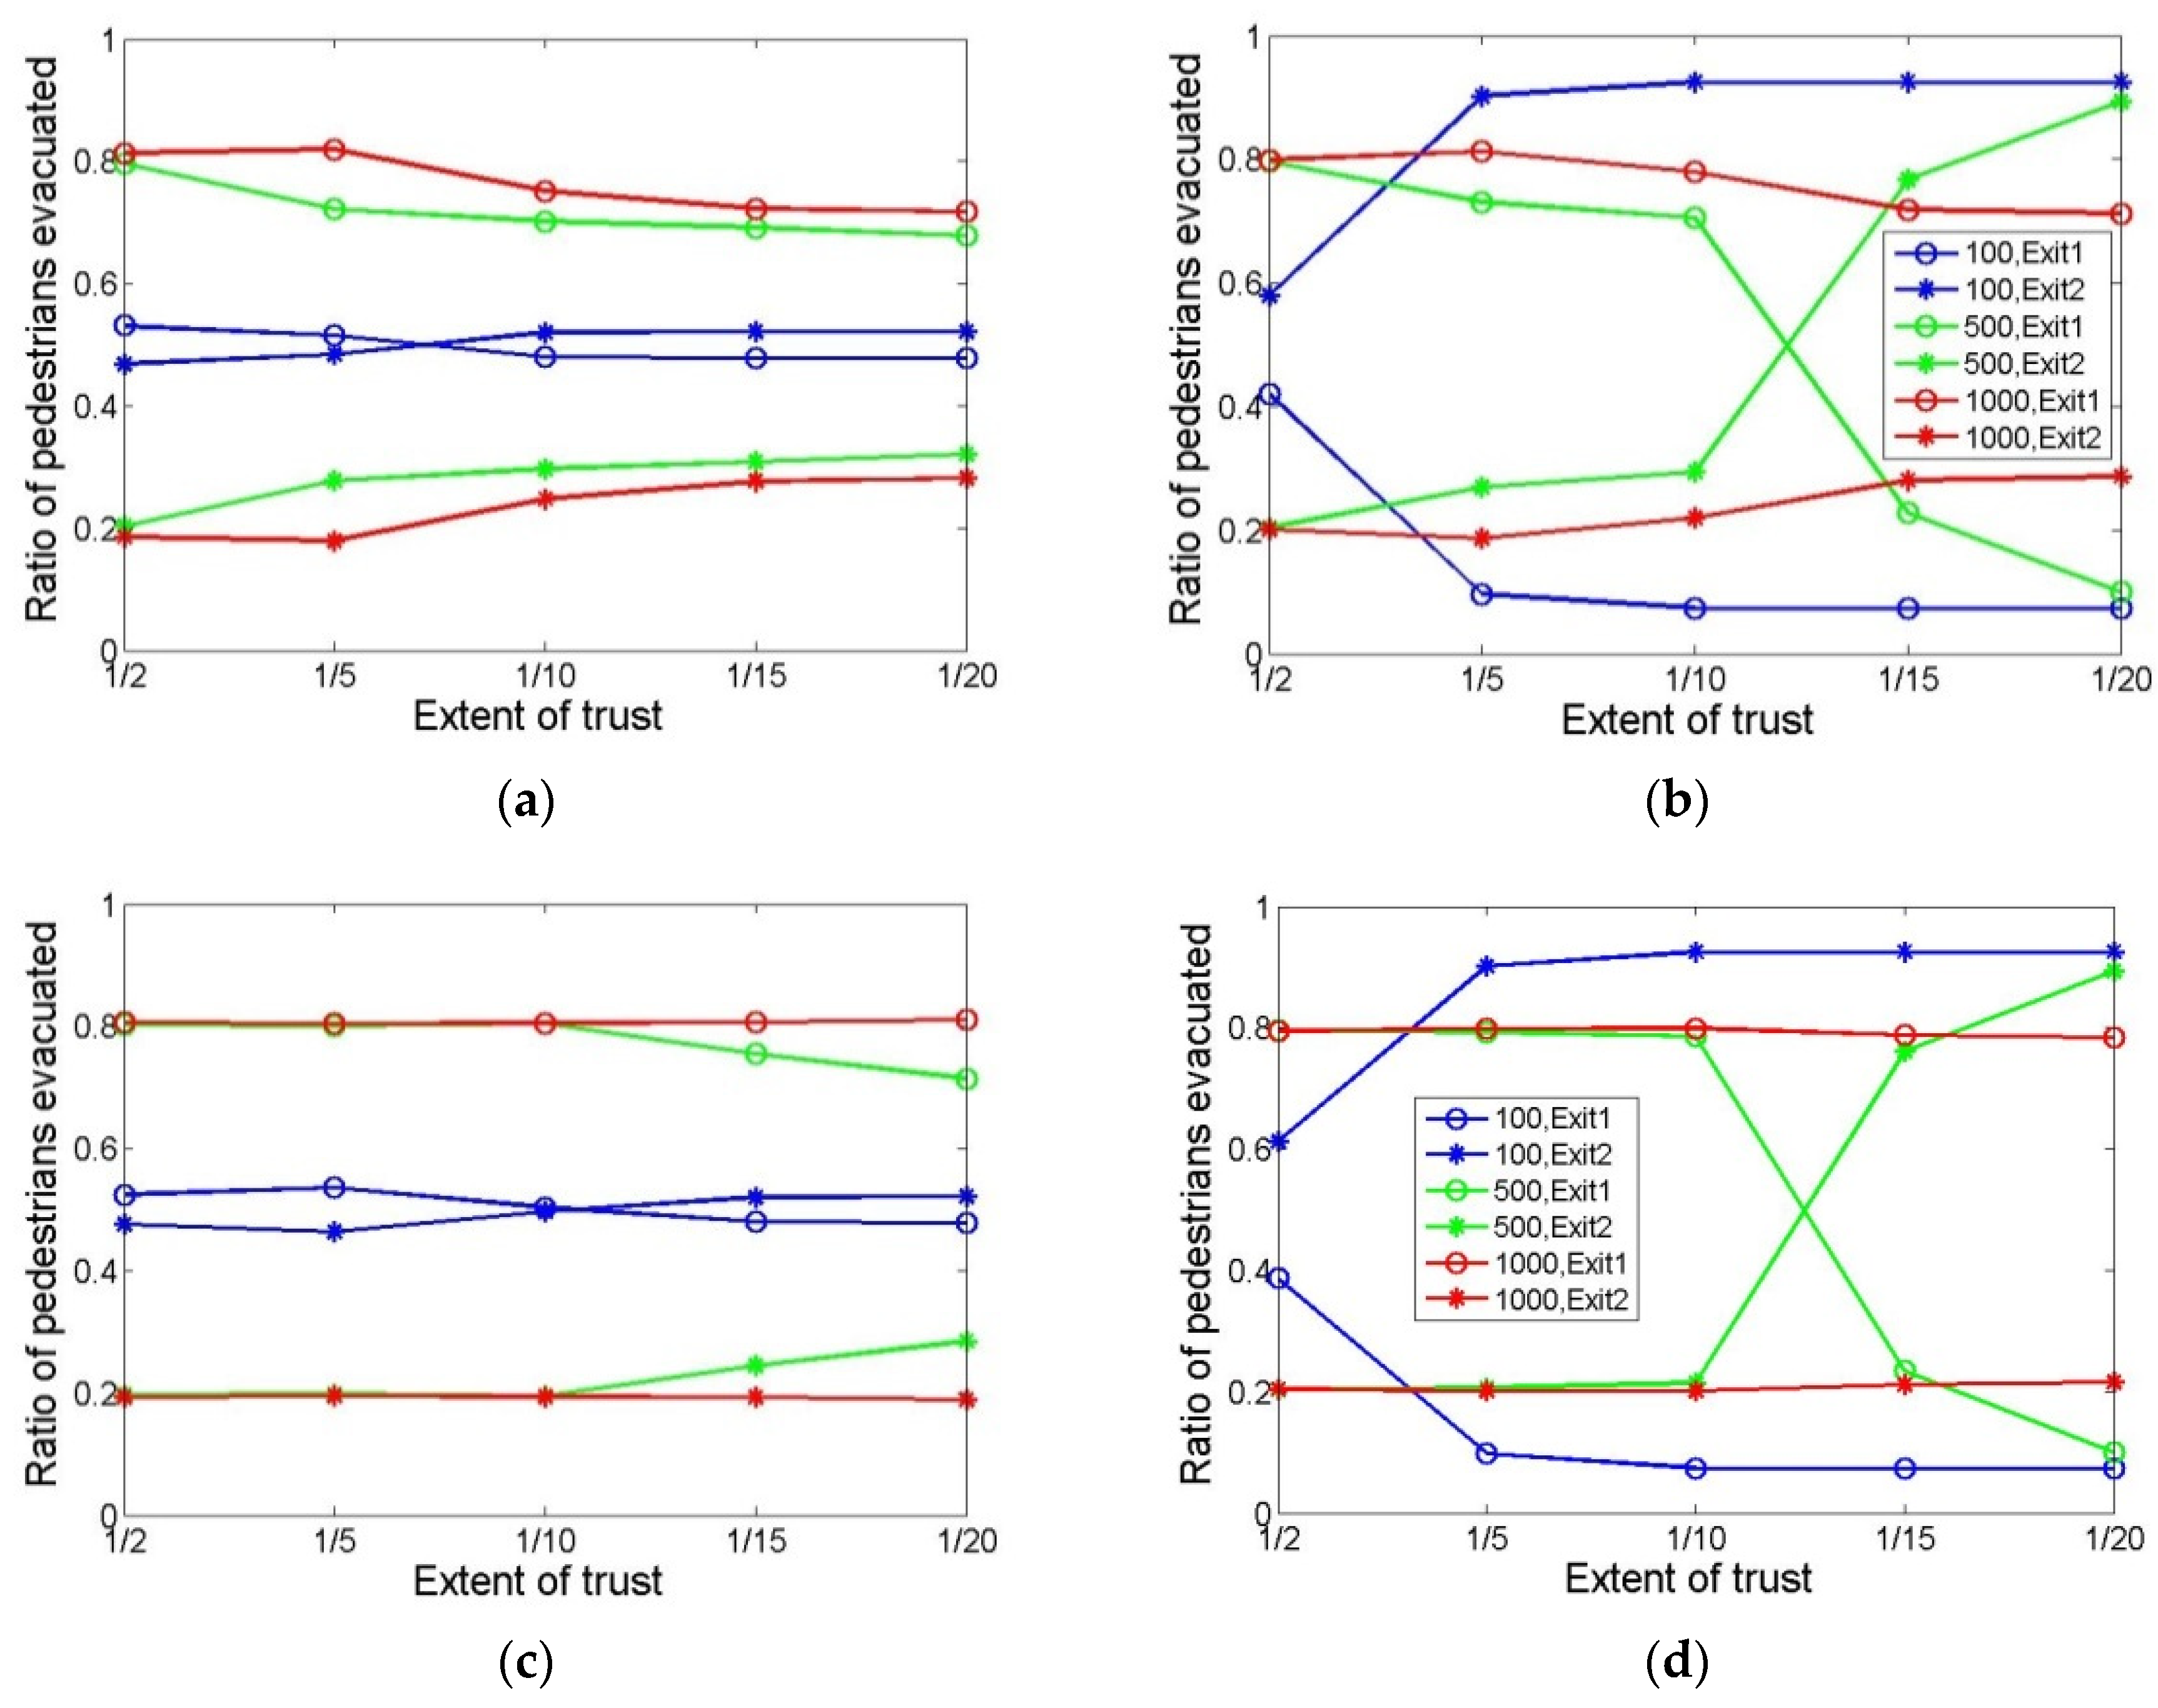
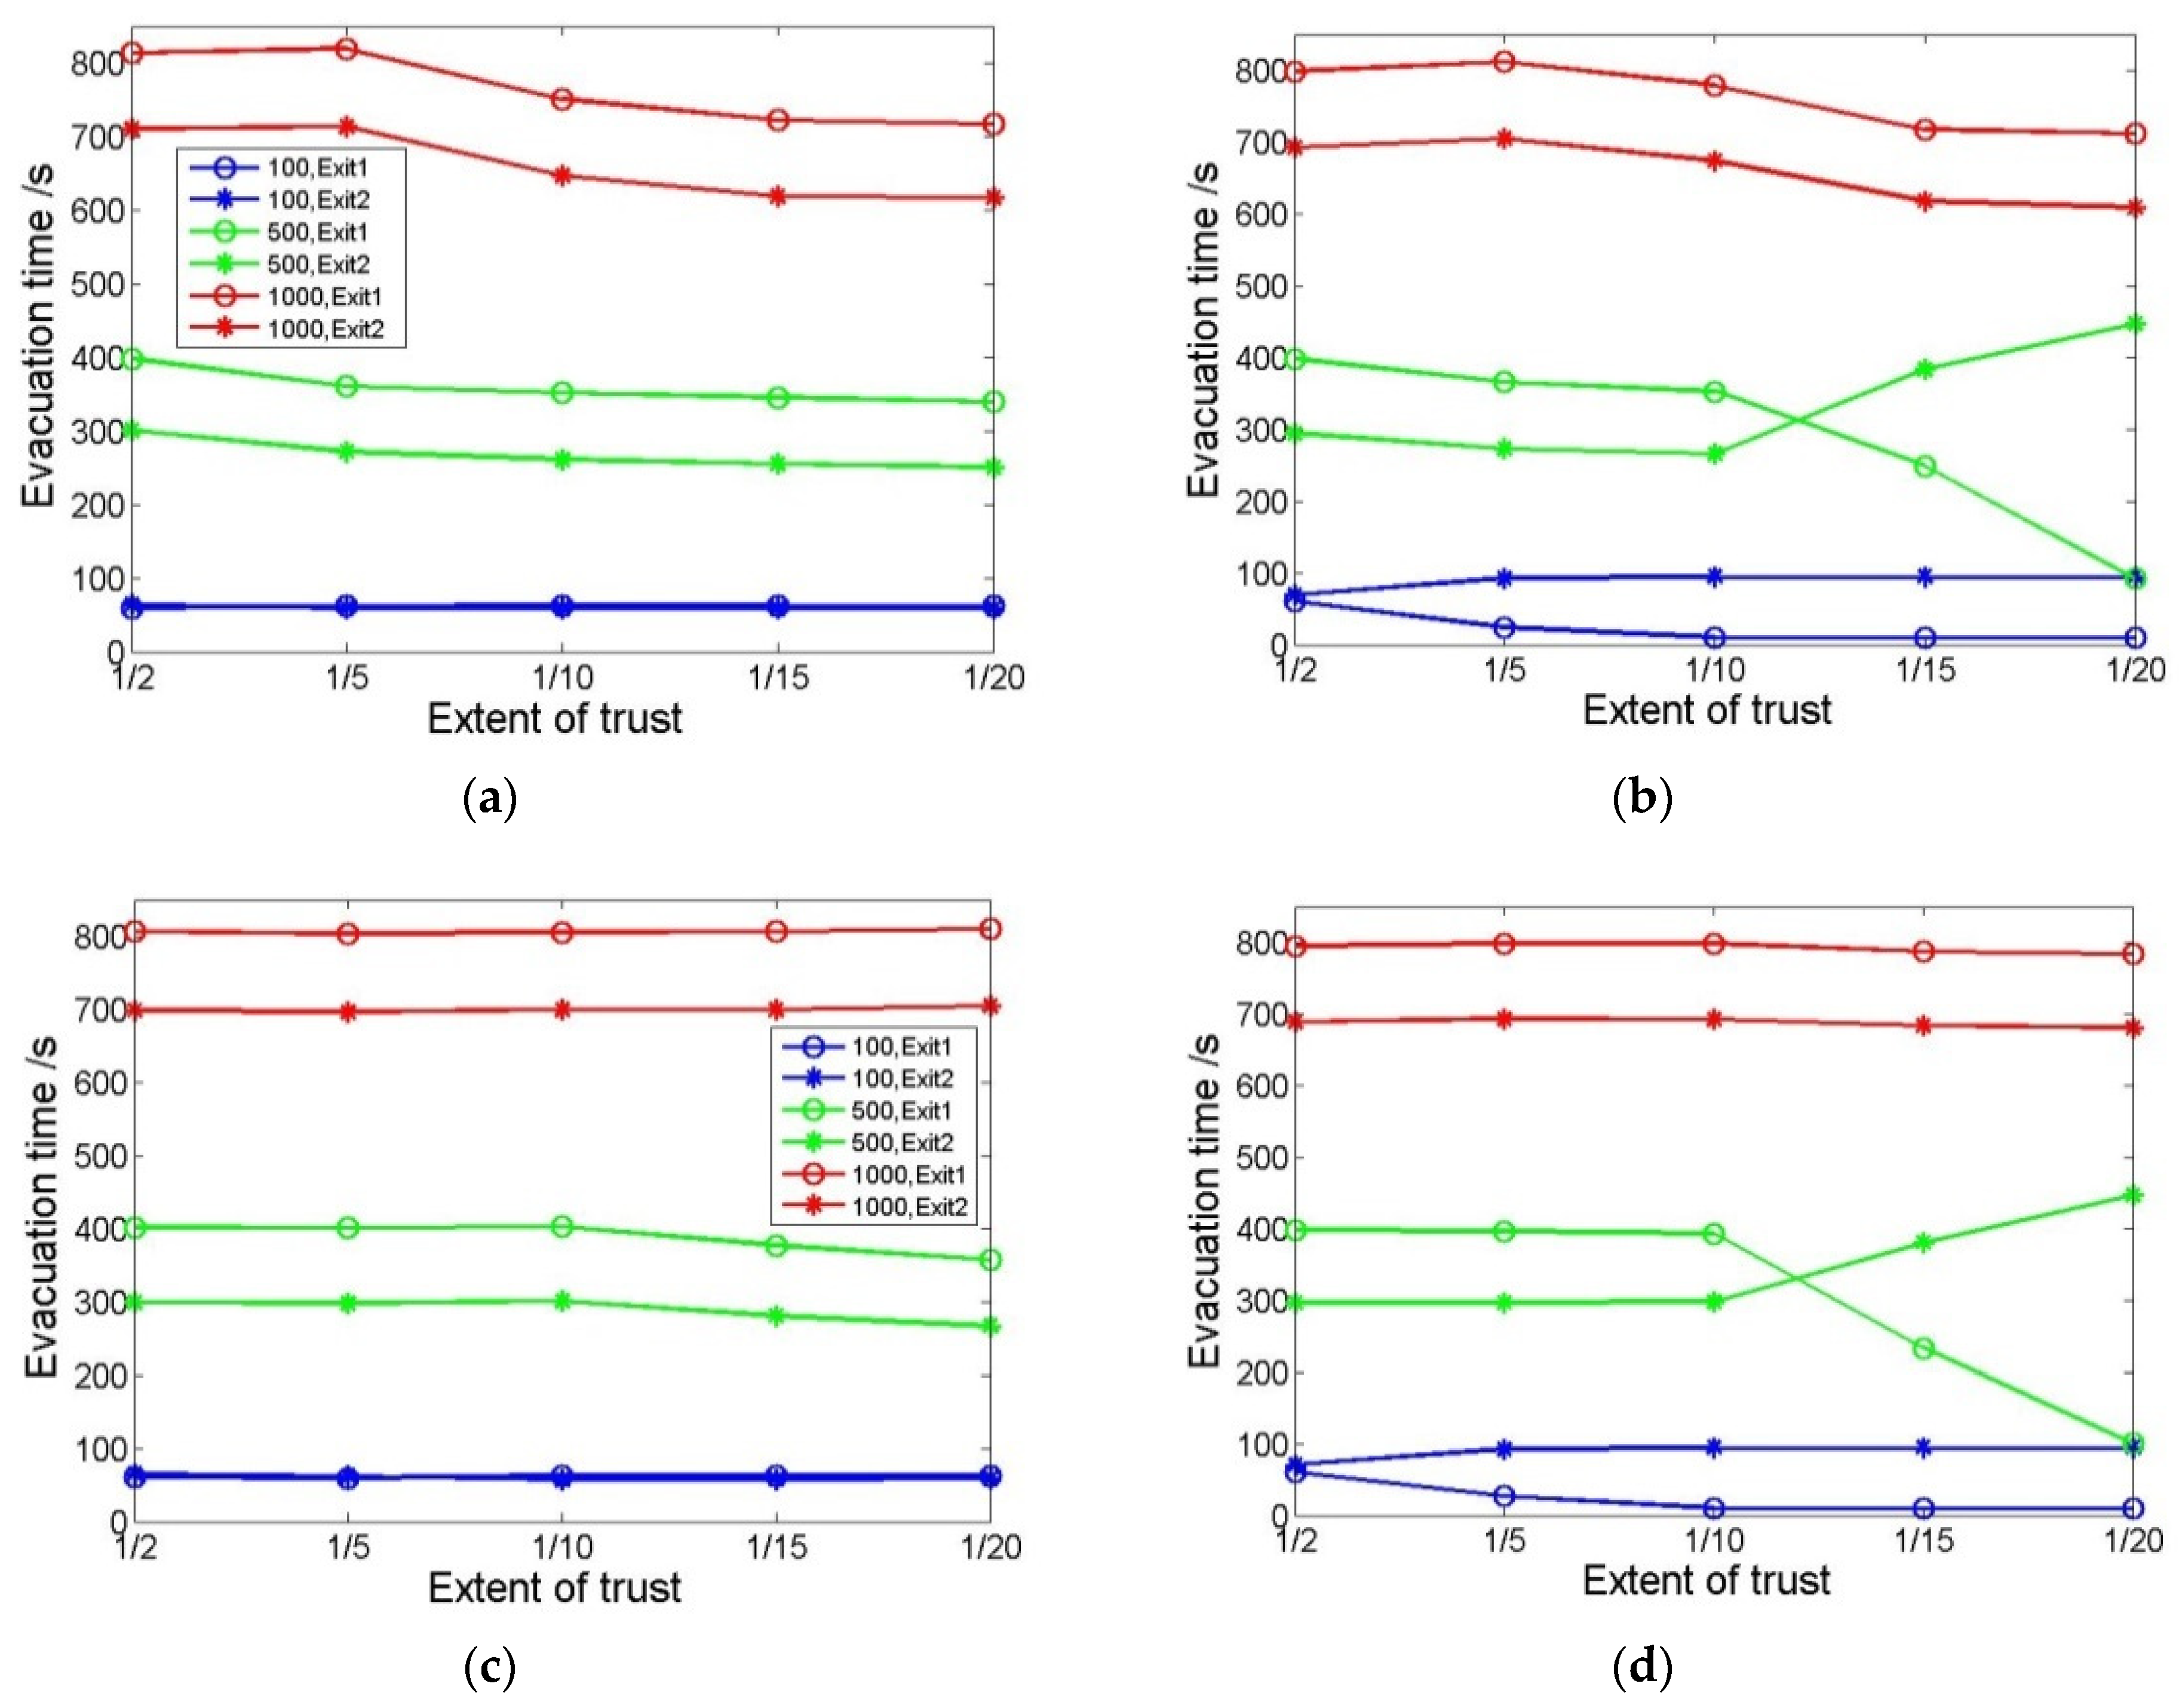
4.5. Influence of Extent of Trust on Evacuation Results

N trust was set as 2, 5, 10, 15 and 20 people, respectively, and the evacuation results are shown in Figure 13 and Figure 14. They both show the ratio of the number of people and the evacuation time of two exits in scenario 1 and scenario 2, when the initial number of people was 100, 500 and 1000, respectively. As shown in Figure 13a,c and Figure 14a,c, in scenario 1, when the hearing distance is small, with the decrease in the extent of trust, the number of people who obtain toxic gas source information decreases. The number of people passing through exit 1 in the upper direction and the evacuation time both decrease. As shown in 
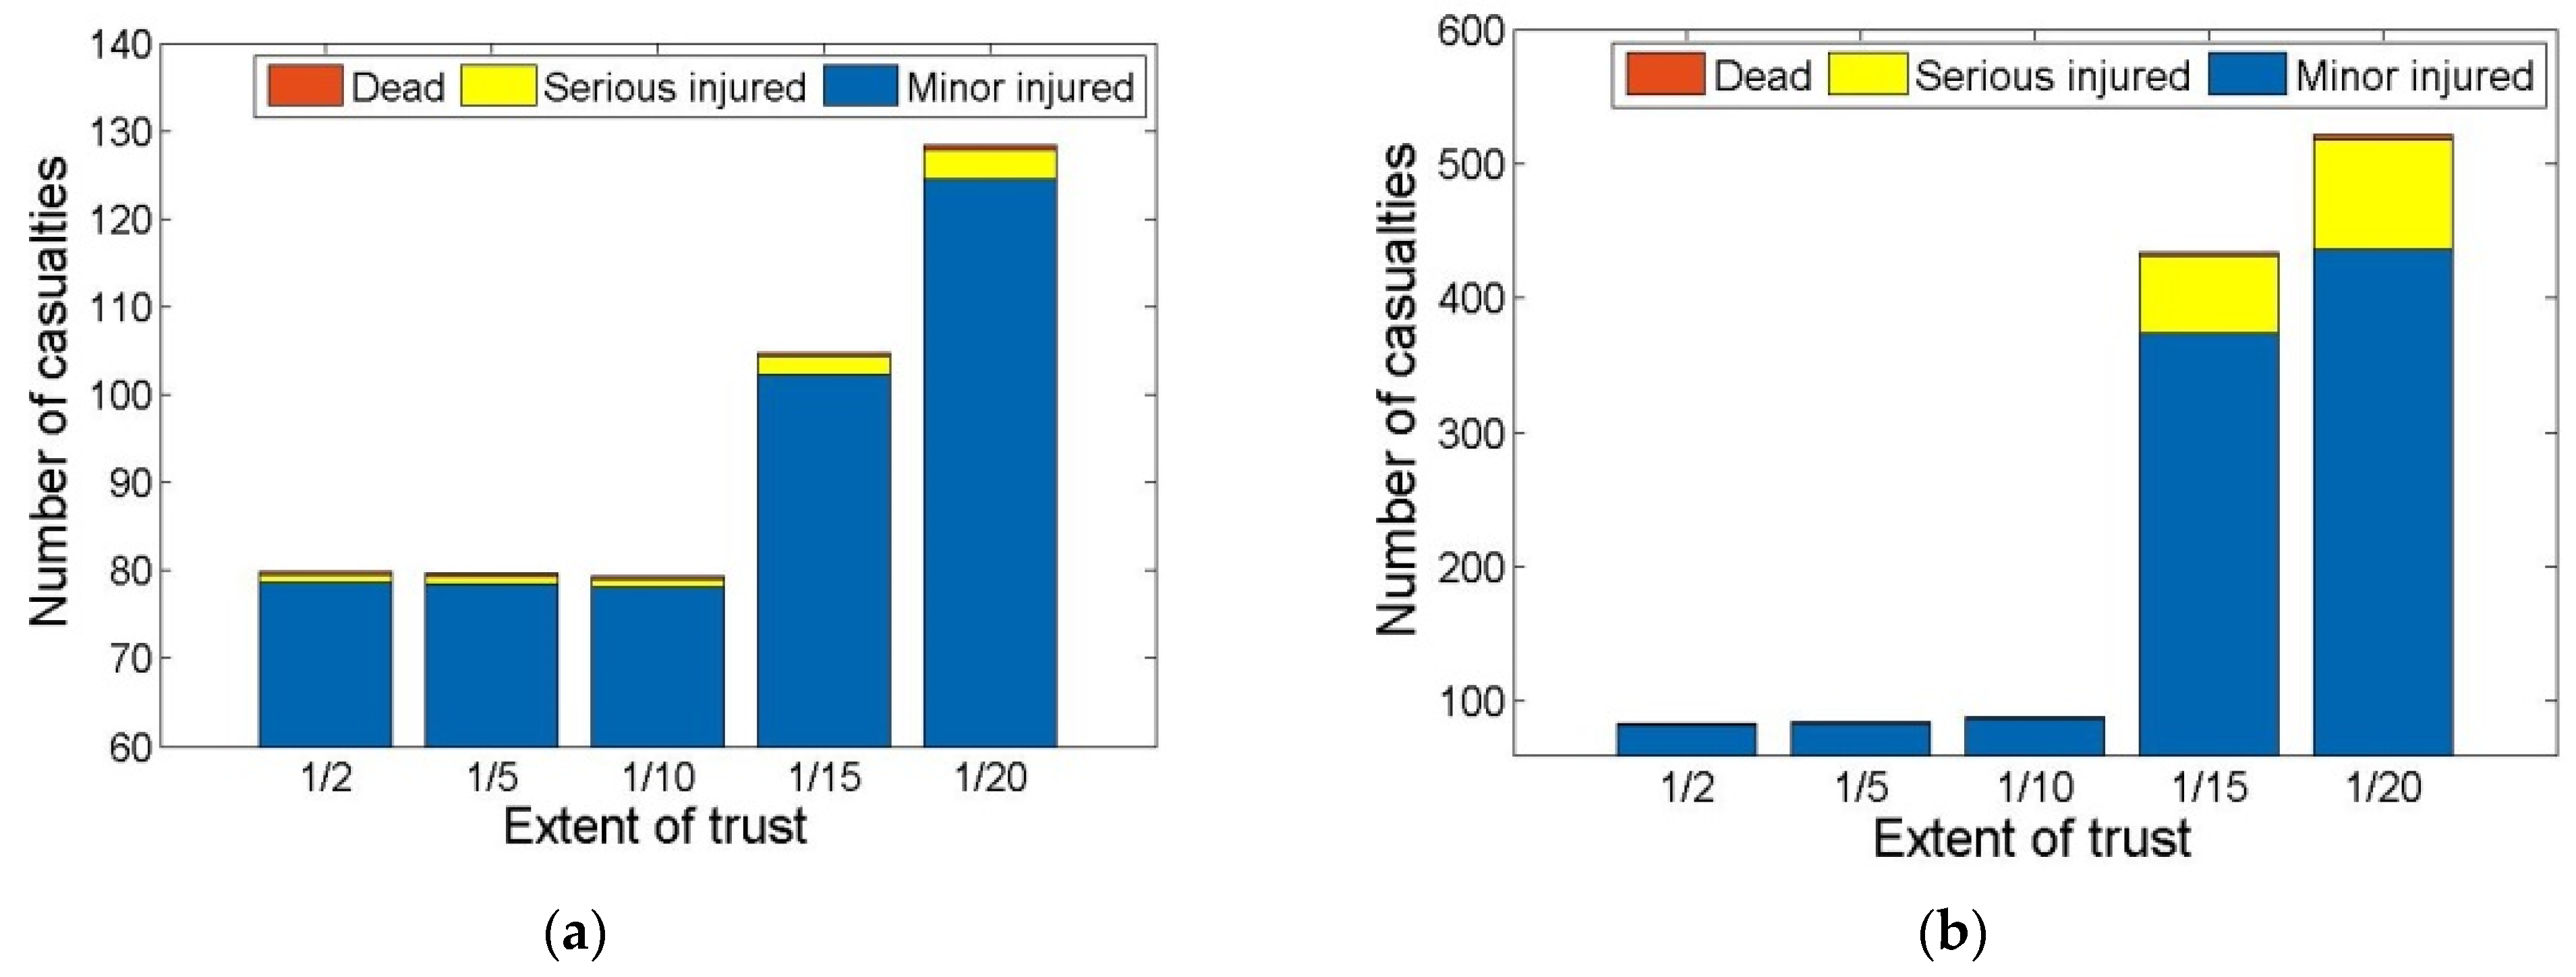
Figure 15a, although the evacuation time is reduced, the number of people passing through exit 1 in the upper direction is reduced and the number of casualties is increased. When the hearing distance is large and the crowd density is high, the extent of trust has little effect because there are always enough people within hearing range. Considering that the environment is noisy and hearing ability is weakened when there are many people, the evacuation results within a small hearing distance are more reliable, so the evacuation time is longer when the extent of trust is high but people’s safety is higher.
As shown in Figures Figure 13b,d and Figure 14b,d, in scenario 2, not everyone knows the exit 1 information in the initial state, and the changing trend in the number of people is similar to that of scenario 1. However, when the number of people is 100 or 500, the range of change is greater, and there is a critical value (for example, when the number of people is 100 and the extent of trust is less than 1/5, or when the number of people is 500 and the extent of trust is less than 1/10) below which some people cannot always acquire the information on exit 1; therefore, they can only escape from exit 2 in the downwind direction, with a high concentration of toxic gas.

5. Conclusions

Information perception and transmission play an important role for way-finding and exit selection in pedestrian evacuation, especially in dangerous and unfamiliar environments. In order to simulate the information-inducing behavior, a set of rules are introduced for improving the evacuation dynamics model and exit choice model. Compared with the existing models, the improved model is able to express information discovery and transmission by various ways including sight, hearing and physical injuries, at a certain perception distance besides direct contact, and express information accumulation and selection by introducing the extent of trust. The simulation results of pedestrian evacuation show the following:
  • The increase in perception distance allows people to more quickly acquire danger information and exit information. In the case of toxic gas diffusion, although the evacuation time increases, the number of casualties decreases, so that the safety of pedestrians is improved. The increase in pedestrian density makes it easier to transmit information among pedestrians, but it also results in the faster formation of congestion, which causes more people to wander between different exits and be injured. Therefore, when the density is high, it is necessary for guides to stop pedestrians from reselecting the target exit.
  • When the extent of trust increases, the number of people who acquire danger information and exit information increases. When the perception distance is small, as in the case of toxic gas diffusion, although the evacuation time increases, the degree of casualties decreases so that the safety of pedestrians is improved. When the perception distance is large and the density is high, the extent of trust has little effect. In scenarios with unknown exits, there are different critical values of trust for different densities, which makes it impossible for some pedestrians to acquire information about unknown exits, resulting in an increase in evacuation time and the number of casualties. Therefore, it is helpful for the evacuees to observe their surroundings and communicate with others to obtain more useful information.
For future work, the setting of parameters in the exit choice model will be studied according to the questionnaire and video analysis from real experiments.

Author Contributions

Conceptualization, M.L.; methodology, M.L.; software, M.L. and W.Z.; validation, Y.W. and J.Z.; formal analysis, M.L.; investigation, Y.W.; resources, W.Z.; data curation, J.Z.; writing—original draft preparation, M.L.; writing—review and editing, W.Z. and Y.W.; visualization, M.L.; supervision, W.Z.; project administration, J.Z.; funding acquisition, M.L. All authors have read and agreed to the published version of the manuscript.

Funding

This research was funded by the Beijing Natural Science Foundation, grant number 9192009.

Institutional Review Board Statement

Ethical review and approval were waived for this study, due to there was no medical experiment and no physical or psychological effect on the subjects.

Informed Consent Statement

Informed consent was obtained from all subjects involved in the study.

Conflicts of Interest

The authors declare no conflict of interest.

References

  1. Fang, Z.M.; Song, W.G.; Zhang, J.; Wu, H. Experiment and modeling of exit-selecting behaviors during a building evacuation. Phys. A Stat. Mech. Its Appl. 2010, 389, 815–824. [Google Scholar] [CrossRef]
  2. Aik, L.E. Exit-selection behaviors during a classroom evacuation. Int. J. Phys. Sci. 2011, 6, 3218–3231. [Google Scholar]
  3. Heliövaara, S.; Kuusinen, J.; Rinne, T.; Korhonen, T.; Ehtamo, H. Pedestrian behavior and exit selection in evacuation of a corridor—An experimental study. Saf. Sci. 2012, 50, 221–227. [Google Scholar] [CrossRef]
  4. Shi, L.; Xie, Q.; Cheng, X.; Chen, L.; Zhou, Y.; Zhang, R. Developing a database for emergency evacuation model. Build. Environ. 2009, 44, 1724–1729. [Google Scholar] [CrossRef]
  5. Bode, N.W.F.; Codling, E.A. Human exit route choice in virtual crowd evacuations. Anim. Behav. 2013, 86, 347–358. [Google Scholar] [CrossRef]
  6. Henein, C.M. Crowds are Made of People: Human Factors in Microscopic Crowd Models; Carleton University: Ottawa, ON, Canada, 2008. [Google Scholar]
  7. Henein, C.M.; White, T. Microscopic information processing and communication in crowd dynamics. Phys. A Stat. Mech. Its Appl. 2010, 389, 4636–4653. [Google Scholar] [CrossRef]
  8. Fu, L.B.; Song, W.G.; Lo, S.M. A fuzzy-theory-based method for studying the effect of information transmission on nonlinear crowd dispersion dynamics. Commun. Nonlinear Sci. Numer. Simul. 2017, 42, 682–698. [Google Scholar] [CrossRef]
  9. Liu, S.B. Experiment and Simulation of Individual and Crowd Evacuation Behaviors; (In Chinese). University of Science and Technology of China: Beijing, China, 2010. [Google Scholar]
  10. Zou, Q.; Chen, S. Simulation of Crowd Evacuation under Toxic Gas Incident Considering Emotion Contagion and Information Transmission. J. Comput. Civ. Eng. 2020, 34, 507–525. [Google Scholar] [CrossRef]
  11. Dong, T.; Liu, Y.; Bian, L. A Behavior Model Based on Information Transmission for Crowd Simulation. In Transactions on Edutainment VI; LNCS; Springer: Berlin/Heidelberg, Germany, 2011; Volume 6758, pp. 89–98. [Google Scholar]
  12. Wang, X.L.; Guo, W.; Cheng, Y.; Zheng, X.P. Understanding the centripetal effect and evacuation efficiency of evacuation assistants: Using the extended dynamic communication field model. Saf. Sci. 2015, 74, 150–159. [Google Scholar] [CrossRef]
  13. Han, Y.; Liu, H. Modified social force model based on information transmission toward crowd evacuation simulation. Phys. A Statal Mech. Its Appl. 2016, 469, 499–509. [Google Scholar] [CrossRef]
  14. Burstedde, C.; Klauck, K.; Schadschneider, A.; Zittartz, J. Simulation of pedestrian dynamics using a two-dimensional cellular automaton. Phys. A Stat. Mech. Its Appl. 2001, 295, 507–525. [Google Scholar] [CrossRef] [Green Version]
  15. Kirchner, A.; Schadschneider, A. Simulation of evacuation processes using a bionics-inspired cellular automaton model for pedestrian dynamics. Phys. A Stat. Mech. Its Appl. 2002, 312, 260–276. [Google Scholar] [CrossRef] [Green Version]
  16. Du, J.K. Analysis on the Leaking Process of Toxic Gases from Chemical Accidents and Determination of the Risky Area. China Saf. Sci. J. 2002, 12, 55–59. (In Chinese) [Google Scholar]
  17. Liu, M.; Wang, Y.; Zhu, W.; Yin, M.; Zheng, J. Simulation of Exit Choice Behaviour in Evacuation Considering the Obstacles and Pedestrian Distribution. In Proceedings of the IEEE 12th International Conference on Software Engineering and Service Science (ICSESS), Beijing, China, 20–22 August 2021; pp. 228–234. [Google Scholar]
Figure 1. Information cognition process in emergency evacuation.
Sustainability 13 13194 g001
Figure 2. Flow chart of exit choice for one pedestrian.
Sustainability 13 13194 g002
Figure 3. Snapshot of the real and simulated evacuation in scenario 1. (a) Experimental scenario; (b) Simulated scenario.
Sustainability 13 13194 g003
Figure 4. Snapshot of the real and simulated evacuation in scenario 2. (a) Experimental scenario; (b) Simulated scenario.
Sustainability 13 13194 g004
Figure 5. Comparison of the results of experiments and simulations. (a) Scenario 1; (b) Scenario 2.
Sustainability 13 13194 g005
Figure 6. Evacuation process when the toxic gas information is unknown at the start (Black represents people whose OGK = 0, and red represents people whose OGK = 1). (a) 100 people; (b) 500 people.
Sustainability 13 13194 g006aSustainability 13 13194 g006b
Figure 7. Evacuation process when the information of both OGK and exit 1 are unknown at the start (Black represents people whose OEK = 0, and red represents people whose OEK = 1). (a) 100 people; (b) 500 people.
Sustainability 13 13194 g007
Figure 8. Ratio of pedestrians evacuated and evacuation time of two exits under different hearing distances. (a) Ratio of pedestrians evacuated; (b) Evacuation time.
Sustainability 13 13194 g008
Figure 9. The comparison of number of casualties under different hearing distances. (a) 100 people; (b) 500 people; (c) 1000 people.
Sustainability 13 13194 g009
Figure 10. Ratio of pedestrians evacuated and evacuation time of two exits under different visual distances. (a) Ratio of pedestrians evacuated; (b) Evacuation time.
Sustainability 13 13194 g010
Figure 11. The number of people who changed the exit once, twice and three times under different visual distances (500 people).
Sustainability 13 13194 g011
Figure 12. The comparison of number of casualties under different visual distances. (a) 100 people; (b) 500 people.
Sustainability 13 13194 g012
Figure 13. Ratio of pedestrians evacuated via two exits under different extent of trust. (a) In scenario 1, hearing distance is 2.5 m; (b) In scenario 2, hearing distance is 2.5 m; (c) In scenario 1, hearing distance is 5 m; (d) In scenario 2, hearing distance is 5 m.
Sustainability 13 13194 g013
Figure 14. Evacuation time of two exits under different extents of trust. (a) In scenario 1, hearing distance is 2.5 m; (b) In scenario 2, hearing distance is 2.5 m; (c) In scenario 1, hearing distance is 5 m; (d) In scenario 2, hearing distance is 5 m.
Sustainability 13 13194 g014
Figure 15. Number of casualties under different extent of trust (500 people). (a) In scenario 1, hearing distance is 5 m; (b) In scenario 2, hearing distance is 5 m.
Sustainability 13 13194 g015
Table 1. The information types and perceptual ways of evacuation information.
Information TypesInformation ContentsStatic/
Dynamic
Perceptual Ways
Spatial structure informationLocation and width of exitsStaticSelf-perception, information transmission
Location of obstacles and wallsStaticSelf-perception
Location of individualsDynamicSelf-perception
Crowd congestion informationLocation and density of crowdDynamicSelf-perception
Evacuation sign informationLocation of evacuation signsStaticSelf-perception
Location of evacuation assistantsDynamicSelf-perception
Hazard information
(e.g., Toxic gas)
Location of gas leakage sourceStaticSelf-perception, information transmission
Concentration of toxic gas, direction of windDynamicSelf-perception
Location and number of the deadDynamicSelf-perception
Publisher’s Note: MDPI stays neutral with regard to jurisdictional claims in published maps and institutional affiliations.

