Abstract
Traditional orchards received little attention in ecology. In order to enhance the ecological function of traditional pear orchard, it is an effective strategy to co-plant the ornamental green manure (GM) under the pear forest. In this study, two kinds of GM, i.e., Astragalus sinicus L. (AS) and Lathyrus cicera L. (LC), were co-planted in pear tree orchard to elevate its landscape benefits of spatiotemporal distribution of flowers, the nutrient benefits and oxygen production. The results showed that the flower height of AS and LC arrange between 20~30 cm, and the flowering period covers the March. LC has a large number of flowers, a small area of single flower, and high yield of fresh grass. AS has a small number of flowers, a large area of single flower, and low yield of a single fresh grass. Among them, 35% AS + 65% LC and 50% AS + 50% LC are more suitable in achieving the well tourism value and potential good production of pear orchard. Nutrient accumulation, total carbon fixation and oxygen production, flower number of 35% AS + 65% LC are larger than other treatments, while the flower period of 50% AS + 50% LC is longest. This study proposed a “win-win” GM planting strategy for sustainable orchard development, by enhancing ecology functions and the landscaped value of the traditional fruit orchard.
1. Introduction
Pears are one of the most common types of fruit trees cultivated in both northern and southern China [1]. Pear yield and fruit quality are mainly dependent on cultivar, pollination, fertilization, and irrigation [2,3]. Currently, many orchard owners prefer high yield to good quality, and they prefer chemical fertilizer to organic products, which leads to many problems, such as soil acidification [4], decreasing fruit quality [5], and increasing the emission of greenhouse gas [6].
Green manure (GM) (e.g., Lolium perenne L. [7], Trifolium repens L. [8], Vulpia myuros L. [9], Vigna sinensis L. [10], AstragalusSinicus L. [11]) is a soil conservationist practice which can enhance soil fertility and organic matter, and serve as a nitrogen source and a “carbon stabilizer” [12]. For example, Ding et al. (2021) described that the intercropping with three green manure crops favored the crop nutrient uptake [13]. Lee et al. (2021) also confirmed that incorporation of one kind of GMs, called hairy vetch, increased soil carbon sequestration [14], and Zhou et al. (2020) stated that the co-incorporation of rice straw and leguminous green manure increased soil available nitrogen and reduce carbon and nitrogen loss [15]. Wang et al. (2015) reported that terraced nectarine orchard planted with a kind of green manures, named A. pintoi, can sequester soil organic carbon in subtropical China [16]. In addition, it has been reported that GM can maintain or increase the planting growth and the crop yield. Planting GM can form dense grass layer, inhibit weed seed germination, and reduce water runoff by increasing soil coverage area and decreasing sediment erosion [17]. Application of GM can reduce some negative effects caused by chemical and organic fertilizers, and it has potential benefits in enhancing the soil physical structure, preserving its moisture content, increasing its water permeability, and enhancing the carbon sequestration [18,19]. GM can also play an important role in the air purification and sustainable development of the ecosystem. They absorb CO2 and release O2 through photosynthesis, maintain the dynamic balance of CO2 and O2 in the atmosphere, and play a certain role in alleviating a series of problems such as global warming [20]. Meanwhile, a certain ornamental value due to their relatively long flowering stage and colorful flowers has been reported, and thus played a critical role in enhancing the orchard ecology.
As we know, there is plenty of room under the pear tree canopy, which can be utilized to improve the orchard ornamental value [21] and carbon sequestration in orchards [22]. Besides, the flowering period of pear is in March, but the flowering period is short at only 8 days. It is noteworthy that a relatively long flowering stage and colorful flowers played a critical role in enhancing the orchard ecology and certain ornamental value. Two typical GM, i.e., Astragalus sinicus L. (AS) [23] and Lathyrus sativus L. (LS) [24], are with low plant height and long flowering period in March, without vines and have shallow root layer, and thus are suitable for planting under a pear tree umbrella. In addition, the AS and LS have different flower characteristics and good ornamental, and therefore, the combined planting of AS and LS under the pear tree umbrella for improving the ornamental value of the pristine pear orchard is worth exploring [25,26]. Specifically, AS and LS planted under pear trees can form a three-dimensional landscape with pear flowers, enrich the ornamental colors of pear orchards, and extend the ornamental time of pear orchards.
Therefore, this study investigated whether the combined cultivation of LS and AS in pear orchard can increase the landscape value and ecological functions of pristine pear orchard by evaluating the visually spatial and temporal distribution, nutrient efficiency and carbon fixation, and oxygen production in a new pear orchard system. Thus, the overall aim of this study was to seek an appropriated GM combination of AS and LC for enhancing the ornamental value and carbon sequestration of a pear orchard.
2. Materials and Methods
2.1. Site Description and Experiment Design
The experiment was carried out at the pear garden (105°42′11″ E, 26°16′20″ N) in Huangtong Street Office, Puding County, Anshun City, Guizhou Province, in 2019. The experiment site was located in the west of the central part, with an altitude of 1249 m in Guizhou Province. The climate of the experiment site belongs to the humid subtropical monsoon climate with obvious monsoon alternation, and the annual climate is mild, with an average annual temperature of 15.1 °C. The average annual sunshine duration is 1164.9 h, the frost-free period is 301 days, and the average annual precipitation is 1378.2 mm. The tested soil is yellow soil, and the mechanical composition is mainly silt. The soil pH value: 6.15, total nitrogen 0.21%, total phosphorus 0.12%, total potassium 0.76%, available phosphorus 19.90 mg/Kg, rapidly available potassium 62.50 mg/Kg, alkali-hydrolyzable nitrogen 147.35 mg/Kg, slow-available potassium 199.33 mg/Kg, organic matter 31.67 g/Kg.
The Astragalus sinicus L. (AS) and Lathyrus cicera L. (LC) were provided by Nanchong Test Station of National Green Fertilizer Industry System. In total, five treatments were set and shown in Table 1. Each treatment has three plots which were randomly arranged. The plot area was 8 m2 (2 m × 4 m), sown in September, drilled, and grown without any fertilizer.

Table 1.
Sowing rate of diverse planting treatments.
2.2. Collection and Nutrient Analysis of Samples, and Pear Yield Assessment
In the flowering stage, three representative plants per square of each plot were collected. After the samples were brought in lab, the aboveground and underground fresh weight were determined after the plant samples were washed with deioned water to remove the coherent soil and quickly air-dried at room temperature. Then, the dried sample was further dried at 105 ℃ and weighed for determination of sample dry weight, which was denoted as Ybiomass. Finally, the samples were crushed through 0.2 mm sieve and prepared for determination of total contents of nitrogen, phosphorus, and potassium. The plant total nitrogen (TN) content was determined through FOSS Kjeltec™ 8200 Auto Sampler System (Eden Prairie, MN, USA). The plant total phosphorus (TP) content was determined using the molybdate-ascorbic acid method with the H2SO4-H2O2 digestion method [27]. The plant total potassium (TK) content was determined by ICP-OES (Perkin Elmer, Waltham, MA, USA) [28]. At harvest time, all pears in each plot of diverse treatments were harvested and weighted, respectively. The pear yield was calculated based on one hectare.
2.3. Carbon Fixation and Oxygen Production
Fruit trees use solar energy to absorb water from the air through plant photosynthesis, fix carbon dioxide in the atmosphere and release oxygen, and store the organic matter generated into their own tissues. The calculation method of carbon fixation and oxygen production was shown in Equation (1). The carbon fixation amount was calculated based on the photosynthetic equation; every 1.00 g of dry matter produced by plants can fix 1. 63 g of CO2 in the atmosphere and release 1.20 g of O2 [29]. The fixed amounts of CO2 (YCO2) and O2 (YO2) were calculated based on Equations (2) and (3) in which the Ybiomass was denoted as the GM biomass per square of each treatment, and the Sarea referred to the GM area of each treatment.
YCO2 = 1.63 × Ybiomass × Sarea
YO2 = 1.2 × Ybiomass × Sarea
2.4. Flower Parameter Determination
Fifteen plants were randomly selected for each treatment to count the flowering date and number of flowers. After the flowering stage, the opening and withering dates of the first flower were recorded, and the diameter of the first flower was measured with a ruler to count the number of flowers. Diverse diameters were calculated based on following formulas (Equations (4) and (5)) [30]. The RAS is the radius of the umbel composed of florets. ALC is the length of the single floret flag and BLC is the width of the single floret flag.
Single flower area of AS: SAS = π × RAS²
Single flower area of LC: SLC = π × (ALC/2)×(BLC/2)
2.5. Flower Parameter Determination
Excel 2007 and SPSS 18.0 were used for a statistical analysis of the data. One-way ANOVA and Duncan’s method were used for ANOVA and multiple comparison (α = 0.05). Excel 2007 software was used for plotting. Data in the chart are mean ± standard error.
3. Results
3.1. Temporal and Spatial Characteristics of Flowers among Different Treatments
In terms of flowering period (Figure 1), the flowering durations of the two crops are similar, mainly in March and long for c.a. 27–30 days. The flowering time of LC is about 3 days earlier than AS, which is about 3 days shorter than that of AS. The flowering duration of each treatment was similar, but the flowering duration of 50% AS +50% LC treatment was the longest, which was 4 days and 1 day longer than that of 100% LC and 100% AS treatment, respectively. From the aspect of the spatial characteristics of flowers (Figure 2), the plant height of LC is taller than that of AS. When the sowing density is 45 kg/ha, the mean plant height of AS is c.a. 20 cm, the plant height of LC is c.a. 61.7 cm, the mean root length distribution of AS is c.a. 13 cm, and LC is c.a. 18 cm. The plant height of LC decreases with the introduction of AS, but the difference is not significant. The fitting curve is y = −6.1643x2 + 24.076x + 40.26 (R² = 0.8426). The plant height of AS shows an increasing trend, but 100% AS treatment. However, the plant height of AS decreases with the increasing AS proportion. Compared with 100% AS, 50% AS + 50% LC and 35% AS + 65% LC treatment are significantly increased by 81% and 75%, respectively. The fitting curve is y = −6.9929x2 + 45.487x−35.22 (R² = 0.8957). It can be seen that when the ratio of AS and LC is 50%, the difference of plant height between the AS and LC is the smallest.
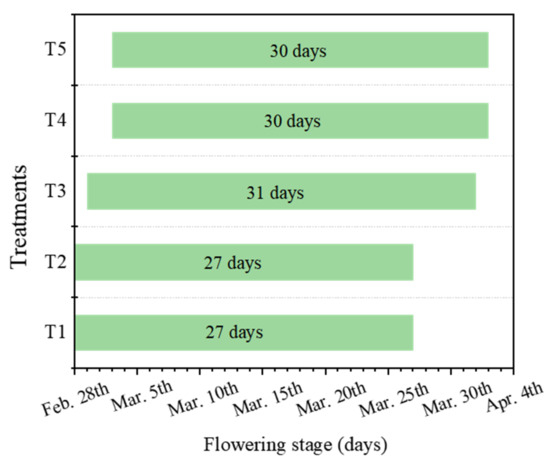
Figure 1.
Flowering stage of green manure under different treatments.
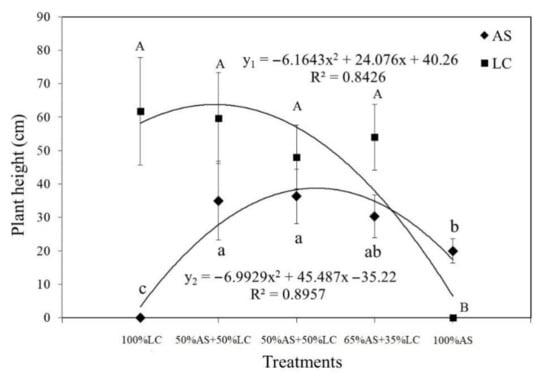
Figure 2.
Plant height of green manure under different treatments. Different letters indicate significant difference among different treatments at p ≤ 0.05.
3.2. Characteristics of the Number of Flowers in Different Treatments
In terms of the flower number (Figure 3), when the sowing density is 45 kg/ha, AS is c.a. 2 flowers/plant and LC is c.a. 15 flowers/plant. The flower number is positively correlated with the change of sowing quantity. The fitting curve of LC is y = 19.243 x2 − 233.86 x + 723.78 (R² = 0.8957), and the fitting curve of AS is y = 7.0514 x2 −3.9086 x − 2.64 (R² = 0.9198), and the total number of flowers fitted well with the curve: y = 26.294 x2 − 237.77 x + 721.14 (R² = 0.8925). In addition, total flower number of 35% AS +65% LC is 34% higher than that of 65% AS +35% LC, but the difference is not significant.
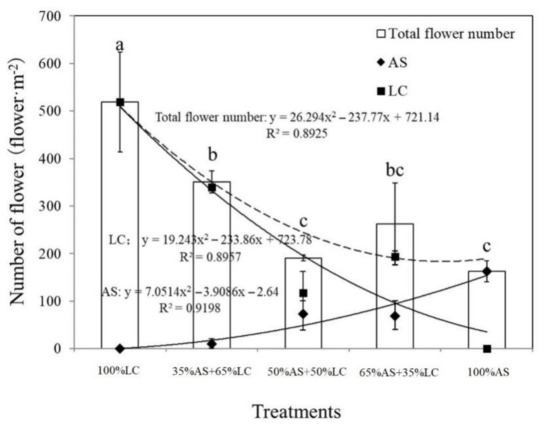
Figure 3.
Number of flowers of green manure under different treatments. Different letters indicate significant difference among different treatments at p ≤ 0.05.
3.3. Characteristics of Flower Area among Different Treatments
When the sowing density is 15 kg/ha, the area of a single flower of AS is larger than LC (Figure 4). The area of a single flower of AS is about 6.6 cm²/flower, and LC is about 1.7 cm²/flower. The unit area of flower area of AS is about 1075 cm²/m2, and LC is about 878 cm²/m2. The flower area of AS is 22.4% higher than that of LC, but the difference is not significant. There is a significant correlation between flower area and sowing amount. The fitting curve of LC is y = 34.909x2 − 409.32x + 1234.4 (R² = 0.8995), and the fitting curve of AS is y = 39.223x2 + 21.167x − 63.232 (R² = 0.9202). The total flower area fitted the curve well: y = 71.131x2 − 388.16x + 1171.2 (R² = 0.9551). The total flower areas of 100% AS were 50.9% and 69.1% higher than that of the 50% AS + 50% LC and 35% AS + 65% LC, respectively. In addition, the flower area of 100% AS is higher than 100% LC. Although it is not significant in a flower area among different treatments, the AS flower is located on the top of fresh grass, while the LC flower is located under the fresh grass, so the flower area of 100% AS is significantly larger than that of 100% LC.
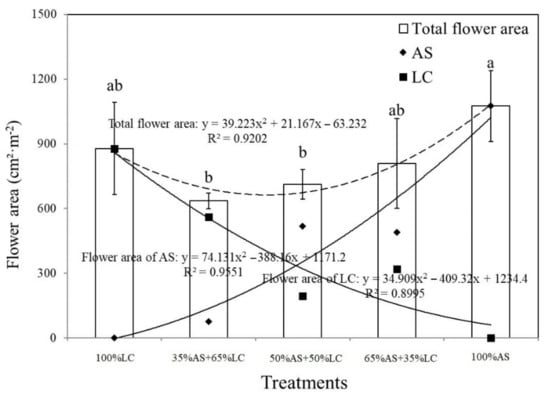
Figure 4.
Area of flower of green manure among different treatments. Different letters indicate significant difference among different treatments at p ≤ 0.05.
3.4. Nutrient Benefits of Different Treatments
In the later stage of viewing, GM can be returned to the field to realize their nutrient function. The nutrient content of LC is a little higher than AS. TheTN, TP and TK of AS are 2.43%, 0.25%, and 1.61%. The TN, TP, and TK of LC are 3.02%, 0.24%, and 1.51%. In terms of the yield of fresh grass, the yield of LC is higher than AS, because the AS was more suitably planted in the paddy field. When the sowing density is 45 kg/ha, the yield of AS is about 2400 kg/ha, and LC is about 25,515 kg/ha. The order of total nutrient accumulation is as follows: 35% AS + 65% LC > 100% LC > 50% AS + 50% LC > 65% AS + 35% LC > 100% AS. Among them, 35% AS + 65% LC is 66.5% higher than 100% LC, which is 16.9 times 100% AS. The difference between 50% AS + 50% LC and 65% AS + 35% LC is small, which is 3~4 times 100% AS.
3.5. Carbon Fixation and Oxygen Production of Diverse Treatments
GM can fix CO2 and release O2 through the photosynthesis process. The amount of oxygen production is determined by the amount of GM dry matter which was shown in Figure 5. It is noteworthy that the oxygen production of the combined treatment of 35% AS + 65% LC is the highest, as well as the carbon fixation amount shown in Table 2. The corresponding oxygen production and carbon fixation of 35% AS + 65% LC were 13,180 kg/ha and 13,290 kg/ha, which were 15 times 100% AS, and 1.6 times 100% LC.
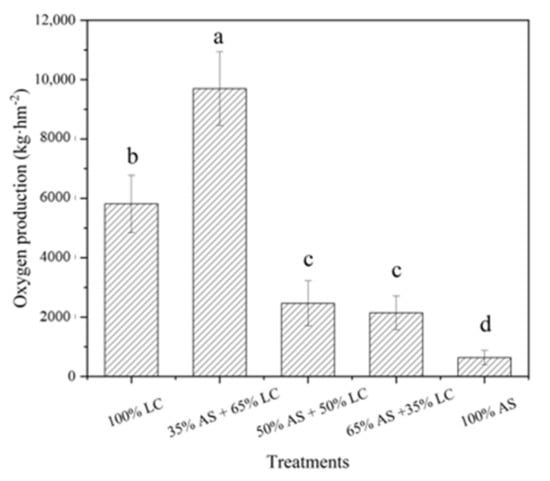
Figure 5.
The content of oxygen production of green manure under different treatments. Different letters indicate significant difference among different treatments at p ≤ 0.05.

Table 2.
The content of carbon-fixation of green manure under different treatments. Different letters indicate significant difference among different treatments at p ≤ 0.05.
4. Discussion
The pear orchard grass-growing system is an important strategy of modern orchard management, to improve fruit quality and produce high-quality fruit, and a soil management mode to achieve sustainable development of fruit orchard industry. Although both AS and LC belong to the Leguminosae Papilionaceae subfamily, their flowers have different visual characteristics (Table 3). Both the flower of AS and LC are racemes, and the implanting parts of the flowers are all axillary. Because the axillary position of the inflorescence is among the leaf axils, the fresh grass can easily produce certain shade for the inflorescence and influence the ornamental value of the axillary inflorescence. However, the inflorescences pedicel of AS is long, and composed of 6 to 10 small flowers, and shows an umbrella shape, similar with visual perception of the terminal inflorescence. LC has a short pedicel and a small flower number. Treatment with LC planting was visually dominated by fresh grass. The single small flower petals of LC spread out and show a butterfly shape among the green grass (Figure 6).

Table 3.
Visual characteristics of flower of the two green manures.
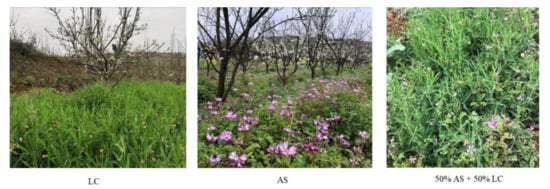
Figure 6.
Visual effects of different treatments of flowers.
It has been reported that normal GM can fix nitrogen 75–150 kg/ha from the air, which was equivalent to 225 Kg urea/ha, and thus indicated that GM plays an important role in increasing soil nitrogen and improving soil fertility [31]. Therefore, GM planting in pear orchard can not only fix nitrogen, improve soil nutrients, and inhibit the growth of weeds, but also improve the ornamental value of the orchard, landscape function, and ecological function.
As we known, the white flower of pear tree has high ornamental value, but its flowering period is short, which usually blossoms in mid-early March and lasts for c.a. 8 days [32]. After the AS and LC with the same flowering period were co-planted in pear orchard, the overall flowering period of pear orchard can be extended from the end of February to the end of March, or even to the beginning of April. The flowering period of LC starts from late February to late March, and the flowering period of AS starts from early March to early April, which is about 3 days later than that of LC. The flowering periods of both AS and LC are about 27~30 days. Among the symbiosis treatments, the flowering period of 50% AS +50% LC treatment is the longest, which is 4 days and 1 day longer than that of 100% LC and 100% AS, because LC can bring forward flowering time and AS delay flower fading time. In addition, it also enriched the spatial ornamental value. Because of the overlapping flowering periods, AS and LC can correspond with pear flowers to form stereoscopic landscape of white flowers on the trees and red flowers on the ground. The raceme of LC is axillary, the pedicel stalk of LC is short, and the number of florets is less [33]. In terms of the vision of LC flowers, it is dominated by the tender green grass, among which the growing florets of LC are orange and butterfly-shaped, which can form the vision of star interspersing in the green grass. The raceme of AS is axillary, long pedicels, and consist of 6 to 10 small flowers in an umbel-shaped, pink inflorescence. The AS flowers are a little above or parallel on the top of the fresh grass, almost free from the shade of the fresh grass. Therefore, the height of GM affects the spatial distribution of flowers. The LC is taller than the AS, indicating that plant height of LC decreases with the increased proportion of AS. Meanwhile, the height of the AS treatment showed an opposite trend. When the proportions of AS and LC are 50% to 50%, the difference in plant height between the two is the smallest. In general, the three-dimensional viewing of this treatment best benefitted the pear orchard by brightening flower color and prolonging the flowering period.
In terms of the flower characteristic of LC and AS, both of them have their own pros and cons. LC has about 15 flowers per plant, but the flower area is relatively small at about 1.7 cm²/plant, and the flower area per unit area is about 878.48 cm²/m2. AS has about 2 flowers per plant, and the flower area per unit area is about 6.6 cm²/flower, and the flower area per unit area is about 1075.28 cm²/m2. It can be seen that LC has a large number of flowers, however, the single flower area of LC and the unit flower area is small. In contrast, the number of flowers of AS is small, but the single flower area and the unit flower area are large. After the AS and LC were co-planted in orchard, the AS and LC showed obvious synergistic ornamental effect. For example, the number and area of flowers respectively significantly correlated with the sowing amount. Specially, the order of total flower number among all treatments follows: 100% LC > 35% AS +65% LC > 65% AS +35% LC > 50% AS +50% LC > 100% AS. In terms of the flower area, its order follows: 100% AS > 100% LC > 65% AS +35% LC > 50% AS +50% LC > 35% AS +65% LC.
GM can serve as a nutrient source for pear orchard growth by returning the GM [34]. It is obvious that the N content of LC was higher than its P and K content (Table 4). In addition, LC’s yield was significantly higher than that of AS. This may be due to the fact that AS was more suitably planted in paddy soil with neutral pH, but the soil of pear orchard belongs to dryland and is a little acidic [11]. The introduction of 35% AS significantly increases the yield of LC, but the total yield of LC and AS greatly decreases after increasing the proportion of LC. It can be seen that the total yield of AS is mainly affected by LC. The yield of AS is also increased after introducing LC. This may be because the LC is higher than that at the breeding period, which caused local shading and herein increased soil moisture for promotion of LC growth [35]. The benefit of carbon fixation and oxygen production is closely related to the quality of dry matter, so it follows the same rule as the nutrient benefit; the order followed: 35% AS +65% LC > 100% LC > 50% AS +50% LC > 65% AS +35% LC > 100% AS. The nutrient benefit of 35% AS +65% LC is 66.5% higher than that of 100% LC. The total amount of carbon fixation and oxygen production is significantly increased by 66.7%, which is 3~4 times of the nutrient benefit of 100% AS, and 15 times of the total amount of carbon fixation and oxygen production (Table 4). The nutrient benefit and total amount of carbon fixation and oxygen production of 50% AS +50% LC and 65% AS + 35% LC are not significantly different. Therefore, the combined planting of LC and AS can significantly reduce realize the carbon fixation and contribute to the reduction of the greenhouse effect to some extent.

Table 4.
The content of N, P and K of green manure under different treatments. Different letters indicate significant difference among different treatments at p ≤ 0.05.
It can be seen from Table 5 that the pear yield of different treatments ranged from 96.7 tons·ha−1 to 100 tons·ha−1. The yield of 35% AS + 65% LC is 3.4% higher than that of 100% AS. This may be due to the high yield of fresh grass treated with 35% AS + 65% LC, and the higher nutrient content returned to the field, thus increasing the supply of soil nutrients to pear trees.

Table 5.
The pear yield of different treatments. Different letters indicate significant difference among different treatments at p ≤ 0.05.
5. Conclusions
The flower number and single flower area of LC are small, but the LC yield is high. Besides, the AS has a relatively larger number of flowers, and a large area of single flowers, but its grass yield is low. The nutrient accumulation, total carbon fixation, oxygen production, and flower number of 35% AS +65% LC are the best, while the flowering period of 50% AS +50% LC is longest. The grass yield of sole AS or LC treatment is lower than that of the AS and LC co-planting treatment. Based on the co-advantages of landscape of pear trees, the ecological functions, total nutrient value, carbon fixation and oxygen production, the combined treatment of 35% AS +65% LC to 50% AS +50% LC is the recommended treatment which can show potential in balancing the tourism and the production of pear orchard. In addition, the LC and AS can also be considered to be co-planted in those fruit orchard systems, with a similar flowering period between March and April to increase tourism and ecological functions, which can not only enrich their tourism value, but also realize orchard green production.
Author Contributions
Q.Z. (Qin Zhang), Y.P., J.W., L.L., D.Y., A.Z., W.W., S.K., H.L. and Q.Z. (Qing Zhu) collected the required materials and prepared the manuscript; B.Z. contributed the design and edition of the manuscript, Q.Z. (Qin Zhang), Y.P. and J.W. reviewed and prepared the revised manuscript. All authors have read and agreed to the published version of the manuscript.
Funding
This research was funded by the science and technology plan project of Guizhou Province ([2020]1Y1026), projects for public welfare agricultural industries (201103005) and China Agriculture Research System (CARS20).
Institutional Review Board Statement
Not applicable.
Informed Consent Statement
Not applicable.
Data Availability Statement
The datasets generated during and/or analyzed during the current study are available from the corresponding author on reasonable request.
Acknowledgments
The authors greatly appreciated the anonymous reviewers for their valuable comments to improve the quality of this manuscript.
Conflicts of Interest
The authors declare no conflict of interest.
References
- Song, X.H.; Xie, K.; Zhao, H.B.; Li, Y.L.; Dong, C.X.; Xu, Y.C.; Shen, Q.R. Effects of different organic fertilizers on tree growth, yield, fruit quality, and soil microorganisms in a pear orchard. Eur. J. Hortic. Sci. 2012, 77, 204. [Google Scholar]
- Badiu, D.; Arion, F.H.; Muresan, I.C.; Lile, R.; Mitre, V. Evaluation of Economic Efficiency of Apple Orchard Investments. Sustainability 2015, 7, 10521–10533. [Google Scholar] [CrossRef] [Green Version]
- Vatsanidou, A.; Fountas, S.; Liakos, V.; Nanos, G.; Katsoulas, N.; Gemtos, T. Life Cycle Assessment of Variable Rate Fertilizer Application in a Pear Orchard. Sustainability 2020, 12, 6893. [Google Scholar] [CrossRef]
- Xie, S.; Yang, F.; Feng, H.; Yu, Z.; Liu, C.; Wei, C.; Liang, T. Organic fertilizer reduced carbon and nitrogen in runoff and buffered soil acidification in tea plantations: Evidence in nutrient contents and isotope fractionations. Sci. Total Environ. 2021, 762, 143059. [Google Scholar] [CrossRef] [PubMed]
- Zuoping, Z.; Min, D.; Sha, Y.; Zhifeng, L.; Qi, W.; Jing, F.; Yan’an, T. Effects of different fertilizations on fruit quality, yield and soil fertility in field-grown kiwifruit orchard. Int. J. Agric. Biol. Eng. 2017, 10, 162–171. [Google Scholar]
- Xiao, Y.; Peng, F.; Zhang, Y.; Wang, J.; Zhuge, Y.; Zhang, S.; Gao, H. Effect of bag-controlled release fertilizer on nitrogen loss, greenhouse gas emissions, and nitrogen applied amount in peach production. J. Clean. Prod. 2019, 234, 258–274. [Google Scholar] [CrossRef]
- Jia, H.; Hou, D.; O’Connor, D.; Pan, S.; Zhu, J.; Bolan, N.S.; Mulder, J. Exogenous phosphorus treatment facilitates chelation-mediated cadmium detoxification in perennial ryegrass (Lolium perenne L.). J. Hazard. Mater. 2020, 389, 121849. [Google Scholar] [CrossRef] [PubMed]
- Lin, H.; Liu, C.; Li, B.; Dong, Y. Trifolium repens L. regulated phytoremediation of heavy metal contaminated soil by promoting soil enzyme activities and beneficial rhizosphere associated microorganisms. J. Hazard. Mater. 2021, 402, 123829. [Google Scholar] [CrossRef]
- Akhter, M.J.; Kudsk, P.; Mathiassen, S.K.; Melander, B. Rattail fescue (Vulpia myuros) interference and seed production as affected by sowing time and crop density in winter wheat. Weed Sci. 2021, 69, 52–61. [Google Scholar] [CrossRef]
- Trianto, M.; Marisa, F. Diversity of Hymenoptera Insect in Cowpea (Vigna sinensis L.) Agricultural Area at Martapura District, Banjar Regency, South Kalimantan. Nat. Sci. J. Sci. Technol. 2020, 9, 29–33. [Google Scholar] [CrossRef]
- Zheng, C.; Liu, C.; Ren, W.; Li, B.; Lü, Y.; Pan, Z.; Cao, W. Flower and pod development, grain-setting characteristics and grain yield in Chinese milk vetch (Astragalus sinicus L.) in response to pre-anthesis foliar application of paclobutrazol. PLoS ONE 2021, 16, e0245554. [Google Scholar] [CrossRef]
- Geng, Y.; Cao, G.; Wang, L.; Wang, S. Effects of equal chemical fertilizer substitutions with organic manure on yield, dry matter, and nitrogen uptake of spring maize and soil nitrogen distribution. PLoS ONE 2019, 14, e0219512. [Google Scholar] [CrossRef] [Green Version]
- Ding, T.; Yan, Z.; Zhang, W.; Duan, T. Green Manure Crops Affected Soil Chemical Properties and Fungal Diversity and Community of Apple Orchard in the Loess Plateau of China. J. Soil Sci. Plant Nutr. 2021, 21, 1089–1102. [Google Scholar] [CrossRef]
- Lee, H.H.; Kim, S.U.; Han, H.R.; Owens, V.N.; Kumar, S.; Hong, C.O. Mitigation of global warming potential and greenhouse gas intensity in arable soil with green manure as source of nitrogen. Environ. Pollut. 2021, 288, 117724. [Google Scholar] [CrossRef]
- Guopeng, Z.; Weidong, C.A.O.; Jinshun, B.A.I.; Changxu, X.U.; Naohua, Z.; Songjuan, G.A.O.; Fugen, D.O.U. Co-incorporation of rice straw and leguminous green manure can increase soil available nitrogen (N) and reduce carbon and N losses: An incubation study. Pedosphere 2020, 30, 661–670. [Google Scholar]
- Wang, Y.X.; Weng, B.Q.; Ye, J.; Zhong, Z.M.; Huang, Y.B. Carbon sequestration in a nectarine orchard as affected by green manure in China. Eur. J. Hortic. Sci. 2015, 80, 208–215. [Google Scholar] [CrossRef]
- Xu, B.; Shao, D.; Chen, S.; Li, H.; Fang, L. Response of water and nitrogen losses to water management practices and green manure application in lowland paddy fields. J. Irrig. Drain. Eng. 2017, 143, 05017007. [Google Scholar] [CrossRef]
- Kausar, R.; Akram, M.I.; Choudhary, M.I.; Malik, A.; Zahid, A.R.; Ali, B. Soil moisture retention and rainfed wheat yield variations by the addition of gypsum and green manure. J. Soil Sci. Environ. Manag. 2020, 11, 6–16. [Google Scholar]
- Jiang, Y.H.; Arafat, Y.; Letuma, P.L.; Ali, L.; Tayyab, M.; Waqas, M.; Li, Y.C.; Lin, W.W.; Lin, S.; Lin, W.X. Restoration of Long-Term Monoculture Degraded Tea Orchard by Green and Goat Manures Applications System. Sustainability 2019, 11, 1011. [Google Scholar] [CrossRef] [Green Version]
- Raheem, A.; Zhang, J.; Huang, J.; Jiang, Y.; Siddik, M.A.; Deng, A.; Gao, J.; Zhang, W. Greenhouse gas emissions from a rice-rice-green manure cropping system in South China. Geoderma 2019, 353, 331–339. [Google Scholar] [CrossRef]
- de Pedro, L.; Perera-Fernández, L.G.; López-Gallego, E.; Pérez-Marcos, M.; Sanchez, J.A. The effect of cover crops on the biodiversity and abundance of ground-dwelling arthropods in a Mediterranean pear orchard. Agronomy 2020, 10, 580. [Google Scholar] [CrossRef] [Green Version]
- Wen, M.; Shi, X.; Nie, Z.; Liu, W.; Zhou, X. Effect of summer green manure in Pankan tangerine orchard. J. Fruit Sci. 2011, 28, 1077–1081. [Google Scholar]
- Ma, Q.; Li, J.; Aamer, M.; Huang, G. Effect of Chinese Milk Vetch (Astragalus sinicus L.) and Rice Straw Incorporated in Paddy Soil on Greenhouse Gas Emission and Soil Properties. Agronomy 2020, 10, 717. [Google Scholar] [CrossRef]
- Mehr, H.M.; Koocheki, A. Physicochemical properties of Grass pea (Lathyrus sativus L.) protein nanoparticles fabricated by cold atmospheric-pressure plasma. Food Hydrocoll. 2021, 112, 106328. [Google Scholar] [CrossRef]
- Yang, L.; Nie, J.; Xu, C.; Cao, W. Biological nitrogen fixation of Chinese Milk Vetch (Astragalus sinicus L.) as affected by exogenous carbon and nitrogen input. Symbiosis 2021, 85, 69–77. [Google Scholar] [CrossRef]
- Lambein, F.; Travella, S.; Kuo, Y.-H.; Van Montagu, M.; Heijde, M. Grass pea (Lathyrus sativus L.): Orphan crop, nutraceutical or just plain food? Planta 2019, 250, 821–838. [Google Scholar] [CrossRef] [Green Version]
- Chen, S.; Zhang, S.; Yan, Z.; Peng, Y.; Chen, Q. Differences in main processes to transform phosphorus influenced by ammonium nitrogen in flooded intensive agricultural and steppe soils. Chemosphere 2019, 226, 192–200. [Google Scholar] [CrossRef]
- Peng, Y.; Sun, Y.; Fan, B.; Zhang, S.; Bolan, N.S.; Chen, Q.; Tsang, D.C. Fe/Al (hydr) oxides engineered biochar for reducing phosphorus leaching from a fertile calcareous soil. J. Clean. Prod. 2021, 279, 123877. [Google Scholar] [CrossRef]
- Romero, E.; Novoderezhkin, V.I.; van Grondelle, R. Quantum design of photosynthesis for bio-inspired solar-energy conversion. Nature 2017, 543, 355–365. [Google Scholar] [CrossRef]
- Mazzini-Guedes, R.B.; Guedes Filho, O.; Bonfim-Silva, E.M.; Couto, J.C.C.; Pereira, M.T.J.; da Silva, T.J.A. Management of corm size and soil water content for gladiolus flower production. Ornam. Hortic. 2017, 23, 152–159. [Google Scholar] [CrossRef] [Green Version]
- He, H.-B.; Li, W.-X.; Zhang, Y.-W.; Cheng, J.-K.; Jia, X.-Y.; Li, S.; Yang, H.-R.; Chen, B.-M.; Xin, G.-R. Effects of Italian ryegrass residues as green manure on soil properties and bacterial communities under an Italian ryegrass (Lolium multiflorum L.)-rice (Oryza sativa L.) rotation. Soil Tillage Res. 2020, 196, 104487. [Google Scholar] [CrossRef]
- Yang, S.; Bai, M.; Hao, G.; Zhang, X.; Guo, H.; Fu, B. Transcriptome survey and expression analysis reveals the adaptive mechanism of’Yulu Xiang’Pear in response to long-term drought stress. PLoS ONE 2021, 16, e0246070. [Google Scholar]
- Rubiales, D.; Barilli, E.; Flores, F. Broomrape as a Major Constraint for Grass Pea (Lathyrus sativus) Production in Mediterranean Rain-Fed Environments. Agronomy 2020, 10, 1931. [Google Scholar] [CrossRef]
- Liu, Z.; Rong, Q.; Zhou, W.; Liang, G. Effects of inorganic and organic amendment on soil chemical properties, enzyme activities, microbial community and soil quality in yellow clayey soil. PLoS ONE 2017, 12, e0172767. [Google Scholar] [CrossRef] [PubMed]
- Vlachostergios, D.N.; Lithourgidis, A.S.; Dordas, C.A. Agronomic, forage quality and economic advantages of red pea (Lathyrus cicera L.) intercropping with wheat and oat under low-input farming. Grass Forage Sci. 2018, 73, 777–788. [Google Scholar] [CrossRef]
Publisher’s Note: MDPI stays neutral with regard to jurisdictional claims in published maps and institutional affiliations. |
© 2021 by the authors. Licensee MDPI, Basel, Switzerland. This article is an open access article distributed under the terms and conditions of the Creative Commons Attribution (CC BY) license (https://creativecommons.org/licenses/by/4.0/).