Article

Do Green Finance and Environmental Regulation Play a Crucial Role in the Reduction of CO2 Emissions? An Empirical Analysis of 126 Chinese Cities

School of Economics, Shandong University of Technology (SDUT), Zibo 255000, China
*
Author to whom correspondence should be addressed.
Sustainability 2021, 13(23), 13014; https://doi.org/10.3390/su132313014
Submission received: 3 November 2021 / Revised: 19 November 2021 / Accepted: 19 November 2021 / Published: 24 November 2021

Abstract

:
Green finance and environmental regulation can reduce CO2 emissions and promote the sustainability of economic development. Based on panel data of 126 resource-based prefecture-level cities in China from 2005 to 2017, the current study used a dynamic panel data model to empirically determine the CO2 emission reduction effects of different green finance instruments under different environmental regulatory intensities. The results showed that green finance tools had significant negative effects on the intensity of CO2 emissions, and green finance can adapt to environmental regulations of different intensities, which cooperated to promote carbon emission reduction. Moreover, in comparison, the debt-based green finance instrument had a stronger effect than the equity-based green finance instrument, and they did not show a coupling relationship. An administrative adjustment in green finance and environmental regulation is required to reduce environmental emissions and to improve sustainable development.

1. Introduction

1.1. Background

Globally, China is the second-largest economy [1] and the largest emitter of greenhouse gases [2,3,4]. Therefore, it is imperative to develop a policy framework to reduce CO2 emissions [5]. During the 14th Five-Year Plan period, China’s ecological civilization construction has shifted to a strategic direction that focuses on CO2 reduction and actively promotes global sustainable development [6,7]. In accordance with the Paris Climate Change Agreement, China rationally planned the “30–60 Target” of “Carbon Peak to Carbon Neutral”. In the context of the “Double-Carbon Goals”, China’s green finance has been further developed and promoted [8]. It is required to understand how to reduce CO2 emissions under the guidance of environmental regulations and policies [9,10].
Recent studies in China focused on green finance to improve corporate green total factor productivity [11,12], optimization of industrial structure [13,14], environmental governance [15,16,17], and protecting the regional ecological environment [18,19,20]. However, there is currently no clear framework for the green finance system in the world [21], and due to the difference in the selection of green finance indicators [22], it is believed that green finance cannot reduce CO2 emissions at the initial stage [23,24]. Some scholars have conducted research from the perspective of micro and macro levels. From the micro perspective, studies have mainly focused on the development of green finance related to the business operations of commercial banks and other financial institutions [25], the financing constraints of high-polluting companies [26], personal consumption behavior trends [27], and personal tourism activities [28]. Similarly, from a macro perspective, studies have focused on the countries where green finance started early and is well structured [29].
Environmental-related regulations are important [30] in restraining the CO2 emissions of resource-based cities [31]. They play a guiding and regulating role in the development of green finance, and to a certain extent regulate the spontaneity of green finance [32]. Environmental regulation has distinct political characteristics [33], and scholars on China’s environmental regulation have mainly focused on three aspects [34]. The first aspect is the direction and transmission mechanism of environmental regulation on economic growth. In the short term, the positive effect of “Innovation Compensation” of environmental regulation lags behind the negative effect of “Following Costs”, which has an inhibitory effect on economic growth. In the long term, the intensity of environmental regulation has a “U”-shaped relationship with technological innovation, which can promote technological progress and economic growth [35,36]. In the second aspect, the impact of the intensity of environmental regulation on the transfer of environmental pollution mainly involves empirical research on the “Pollution Paradise Effect”. There are differences in the intensities of environmental regulations between regions. Regions with high regulatory strength invest in areas with weak regulatory strengths to intensively produce pollution, avoiding the heavily polluting production processes in the local region. This leads to the import of large amounts of carbon emissions and environmental pollutants into the weakly regulated regions through an industrial flight from strongly regulated regions [37]. The third aspect is the game of environmental regulation and the choice of policy tools. Blindly pursuing a faster economic growth rate usually leads to the aggravation of environmental pollution, and the control of environmental pollution has a negative impact on short-term economic growth and human health [38,39,40,41]. Some scholars proposed that the design of environmental regulatory policies should fully encourage market-oriented behaviors such as green investment [42,43].
In the context of the global perspective of the “Greenhouse Effect” and China’s “Double-Carbon Goals”, there are relatively few empirical studies on the low-carbon transition of resource-based cities. Furthermore, after long-term energy exploitation, the conflicts of resource-based cities, such as irrational production structures, low resource utilization, and environmental pollution, have become increasingly prominent, and are the main sources of carbon emissions in China [1]. Regarding the theoretical aspect, environmental regulation can have a “Porter Effect” on the economy for the long term, and green finance can also promote the development of green industries. Green finance has played a significant role in the reduction of CO2 emissions in the transformation of different resource-based cities in China. The current article answers the following questions: Do the different types of green finance play a significant role in the reduction of environmental emissions? Does green finance adapt to different intensities of environmental regulation? Do the green finance instruments have a crowding-out effect in the process of carbon reduction? Based on the above issues, we selected the debt financing methods of green credit, green venture capital, and the green finance development index, equity financing methods, and finance development level indicators to analyze the reduction of CO2 emissions of green finance in China’s resource-based cities in the context of the adjustment of environmental regulation to provide a reference for the development of the green economy.

1.2. Contributions of the Article

This study makes the following contributions:
  • The study empirically estimated a reduction in environmental emissions using regional green finance and environmental regulation.
  • The findings of the study provide a reference for the sustainable development of the regional economy.
  • Moreover, the article focuses on green finance that is subdivided into debt instrument and equity instrument, rather than a general analysis of the total amount of green finance for the reduction in carbon emissions.
  • From the perspective of combining official environmental regulation and market-oriented green finance, this study attempted to support the reduction of carbon emissions and promotion of sustainable regional economic development.

2. A Theoretical Mechanism for Reduction of Environmental Emissions

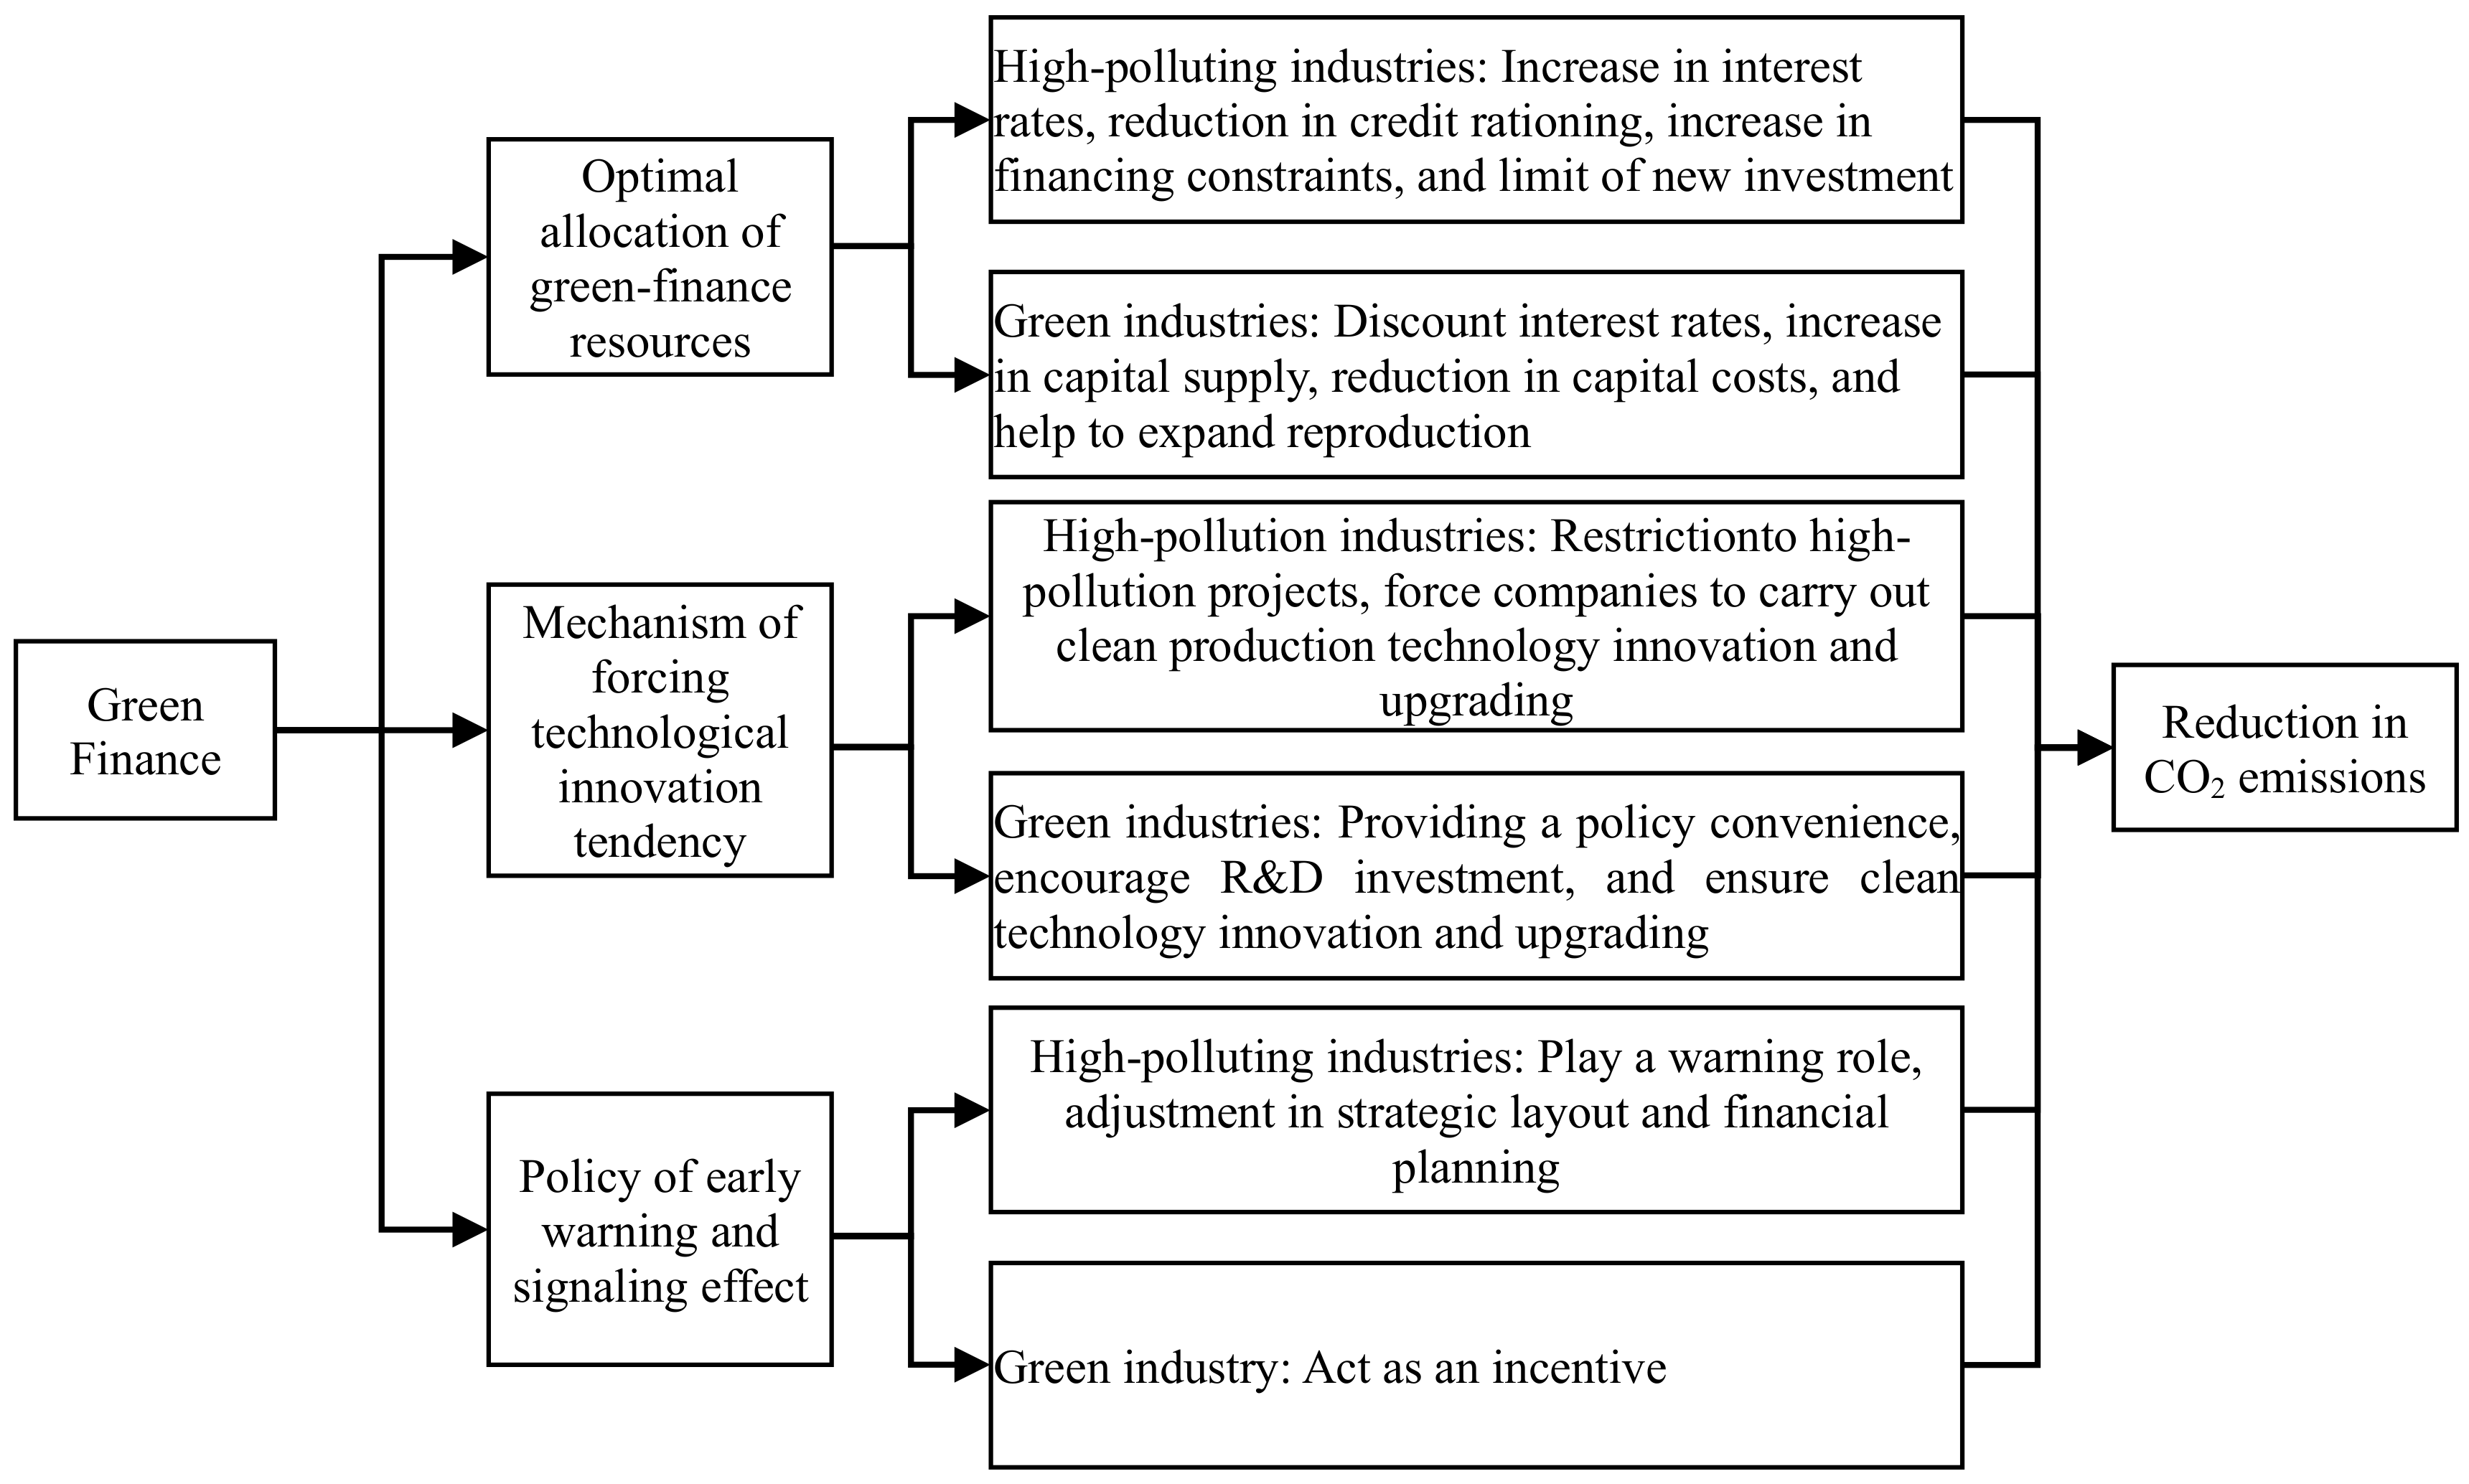
2.1. A Theoretical Mechanism for Reduction of CO2 Emissions with the Perspective of Green Finance

2.1.1. Optimal Allocation of Resources

When debt financing in high-polluting industries, loan financing, in particular, is restricted and its costs rise, and the expansion of production by high-polluting companies is inhibited. This results in a reduction in the amount of energy input in high-polluting industries, a slowdown in production capacity growth, and even a decline in production capacity. Then, CO2 and air pollutant emissions will be reduced. Furthermore, under the influence of debt financing constraints, the profitability of high-polluting companies will decline, and equity financing will also be constrained [44,45]. The synergy with debt financing constraints will help high-polluting companies expand their production process and reduce carbon dioxide emissions. In addition, assuming that the total amount of social credit quotas remains unchanged for a certain period, based on the profitability objectives of commercial banks and the targeted credit rationing objectives of policy banks, the banks’ reduced credit rationing to high-polluting industries will flow to green industries such as new energy, new materials, and environmental protection [46,47]. Green industries will increase investment at lower financing costs and further expand reproduction [48]. This is conducive to the advancement of low-carbon production technology and the substitution of low-carbon products for high-carbon products, thereby reducing CO2 emissions [49].

2.1.2. The Mechanism of Forcing Technological Innovation Tendency

A large quantity of mineral resource factor inputs often leads to a rapid increase in CO2 emissions [50]. To reduce carbon emissions while ensuring a steady growth in output, innovation and upgrading of production technology must be realized [51]. Furthermore, the technological innovation and upgrading of enterprises progressively require capital investment. First, green finance implements a series of policy facilitations for green enterprises [52]. The green enterprises will raise funds at a lower cost of capital to ensure the development of technological innovation and upgrading of their activities, and jointly reduce CO2 emissions with the “Porter Effect” of environmental regulations on enterprises [53]. In addition, through the implementation of differential and even punitive interest rate and quota policies, green finance aims to regulate pollution projects or eliminate major pollution projects. This forces companies with pollution projects as their main business to carry out green technological innovation and operate more clean projects to reduce the negative externalities of high-polluting companies [54].

2.1.3. Early Warning and Signaling Effect

A green finance signal will serve as a warning to high-polluting companies. Based on the contingent decision-making theory, companies will adjust their strategic layout and financial planning to reduce investment in high-polluting projects and increase R&D investment in technological innovation [55]. By comparison, from the perspective of capital market investors, the transmission of this signal results in a depression in new investment for the green industry. The finance capital flowing into the green industry fills up the funding gap for clean companies, and also further promotes green finance [56]. The green signal achieves the effect of CO2 emission reduction through the warning effect on the high-polluting industries and the incentive effect on the green industries [57].
As shown in Figure 1, based on the above analysis, the theoretical mechanism for reduction of CO2 emissions with the perspective of green finance was summarized.
Based on the theoretical analysis, we proposed Hypothesis 1:
Hypothesis 1. (H1).
Green finance can effectively reduce CO2 emissions in resource-based cities.

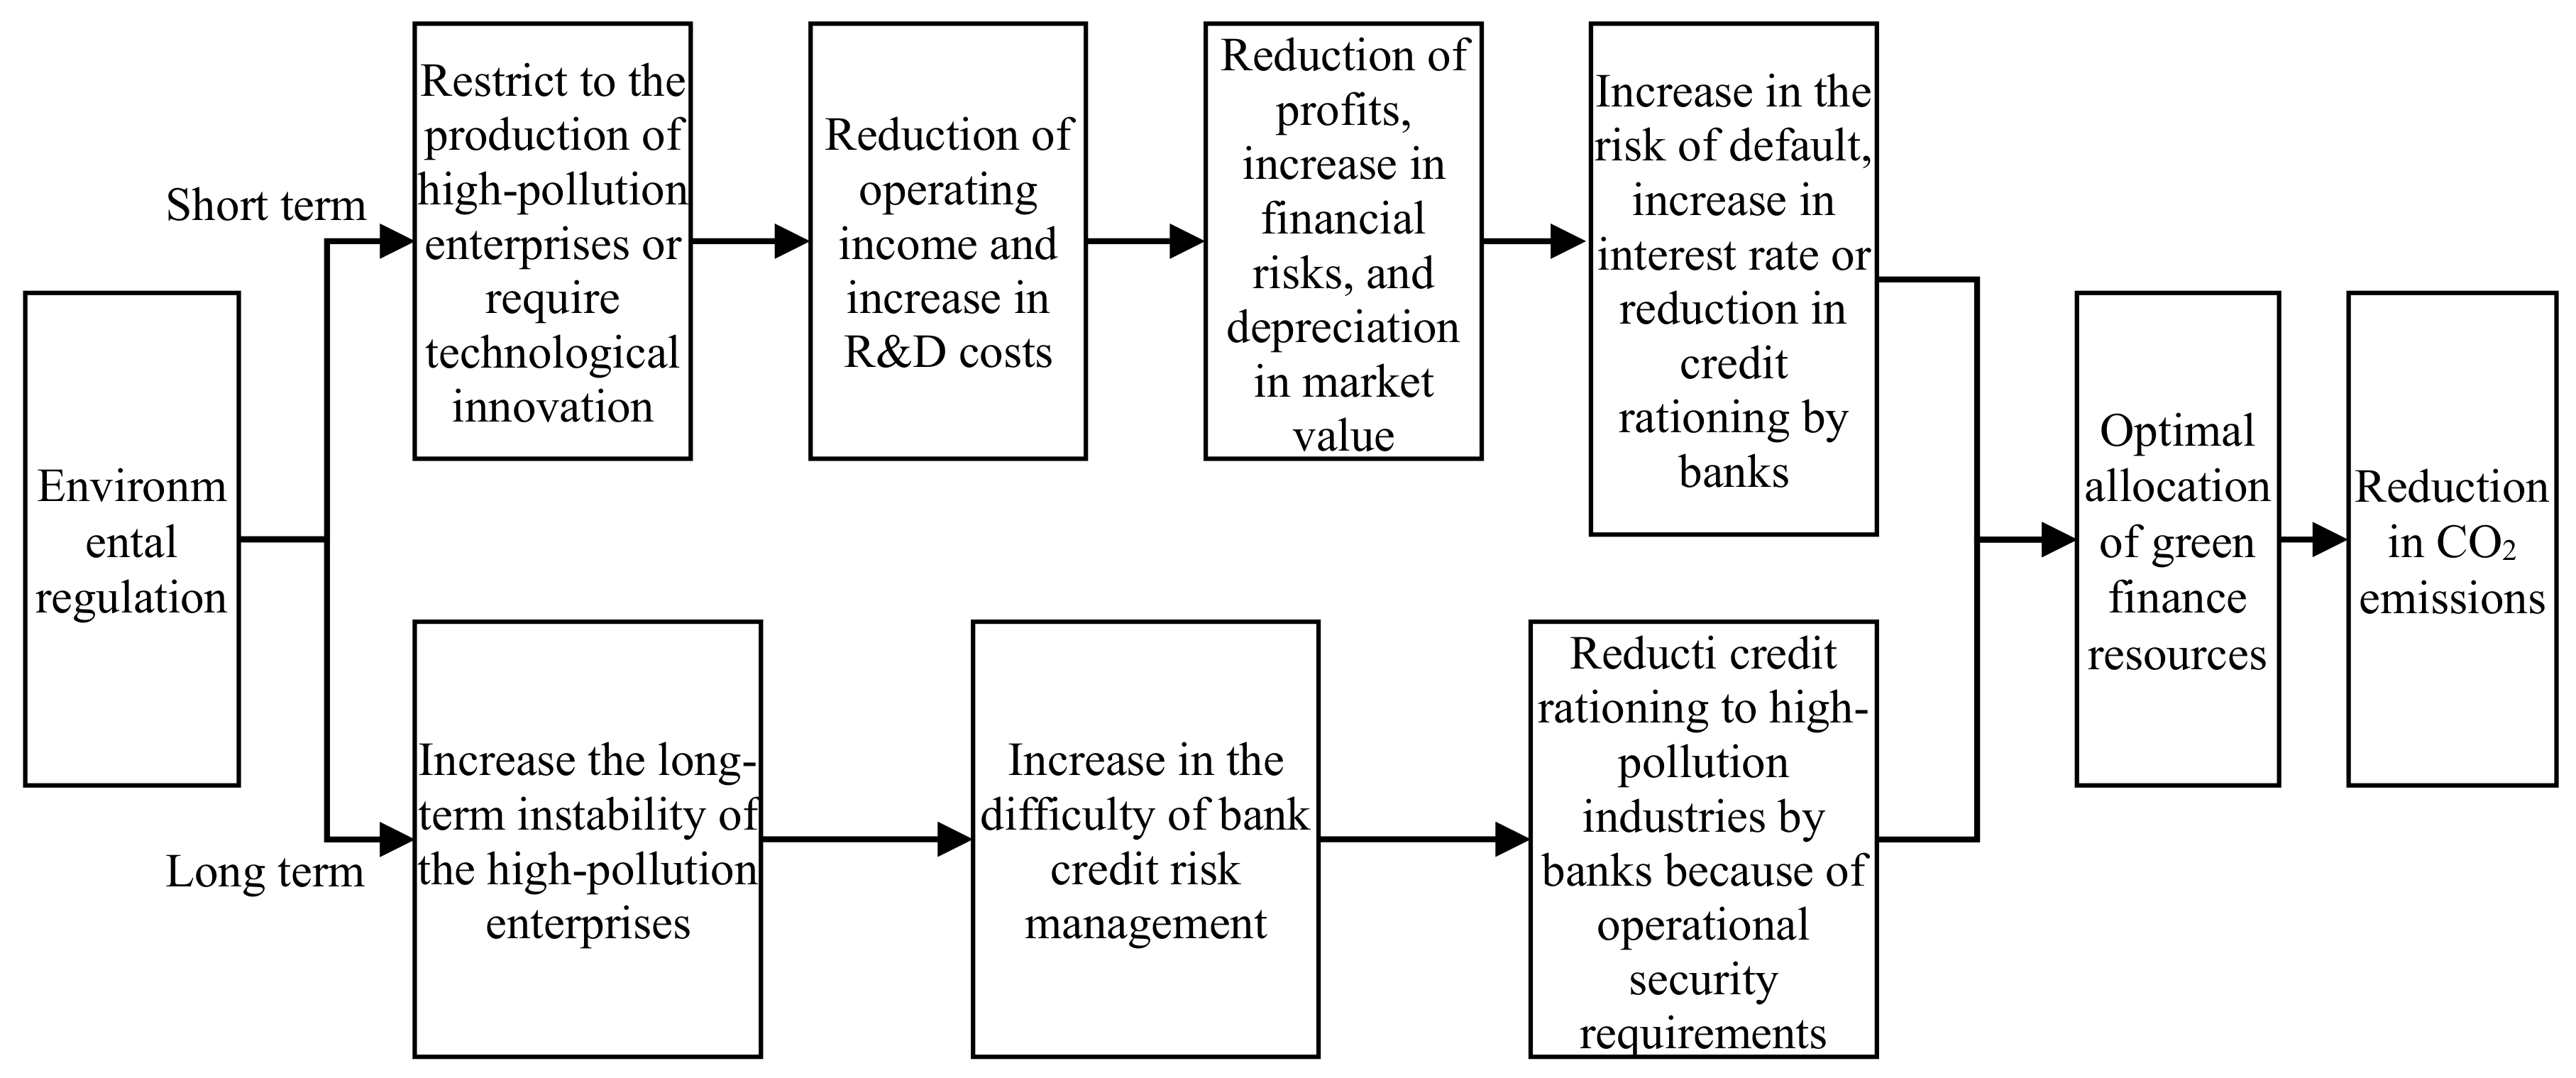
2.2. A Theoretical Mechanism for Reduction of CO2 Emissions with the Perspective of Environmental Regulations

Environmental regulation is an important way to control administrative orders [58,59]. Under the trend of strengthening environmental accountability, environmental regulations and policies are highly restrictive and mandatory for its implementing entities [60]. However, green finance tools are a kind of equity or convenience, and are not mandatory or restrictive [61]. When the benefits of borrowing at a punitive high interest rate and investing in high-polluting projects are greater than the benefits of cleaning projects, micro-entities often give up the policy dividends of green finance and invest in high-polluting projects [62]. Whether it is a compulsory environmental regulation method or a market-based green finance tool, the purpose of both is to control environmental pollution and reduce carbon emissions. However, the current discussion on the internal connection between the two is relatively lacking.

2.2.1. Short-Term Mechanism of Action

In the short term, environmental regulations often restrict enterprises by restricting the production and operation of high-polluting projects or forcing high-polluting enterprises to carry out technological upgrades [63]. The credit loss of high-polluting enterprises makes commercial banks face a higher risk of loan default. In this case, banks usually increase interest rates to high-polluting enterprises to obtain compensation for this higher risk, or directly reduce loan quotas to high-polluting industries [64]. In turn, the credit funds will be invested in other green industries to achieve the optimal allocation of green finance resources, thereby reducing CO2 emissions [65].

2.2.2. Long-Term Mechanism of Action

In the long run, according to the inference of the “Porter Hypothesis”, under appropriate environmental regulations, enterprise production technology will be able to innovate and upgrade [66]. However, it has been found that that most of the enterprises that have completed innovation and upgrading under the requirements of environmental regulations in China have stable sources of funds supporting the investment of the capital elements required for their transformation and upgrading [67]. In addition, most companies have increased the uncertainty of future development under short-term environmental regulations, which creates a challenge for banks’ risk management. Therefore, due to safety requirements, banks will reduce long-term loan rationing to high-polluting industries, and credit funds invested in successful transformation and upgrading enterprises will no longer be available as loans to high-polluting industries. The long-term effective allocation of green finance resources provides a financial guarantee for the long-term reduction of CO2 emissions [61].
As shown in Figure 2, based on the above analysis, the theoretical mechanism analysis of the reduction of CO2 emissions—adjusted by environmental regulation was summarized.
Therefore, according to the analysis of environmental regulation and green finance capital, we proposed the following hypothesis:
Hypothesis 2. (H2).
Green finance and the adoption of environmental regulation effectively reduce carbon emissions.

3. Materials and Methods

3.1. Construction of the Model

Regarding the main financing methods of green enterprises at different development stages, green credit as a debt financing method is more common in the growth and maturity stages of enterprises [68]. However, currently, high-tech enterprises, as the new force and future backbone of the green industry, are mostly at the start-up stage. The financing method in the initial stage mainly adopts equity financing of venture capital. Financial development can promote regional technology upgrades, and the efficiency of financial institutions has a significant threshold effect on financial scale improvement and technological innovation [69]. The green finance development index, released in 2018 as the Local Green Finance Development Index and Evaluation Report, has a comprehensive scale and efficiency dimensions that can be used to evaluate the level of China’s regional green finance development [70]. Considering the availability of China’s municipal green finance measurement data, the study aims, and the representativeness of green finance indicators, we used green finance credit, green venture capital, and the green finance development index as the indicators of green finance [71]. Considering the impact of inertia and possible endogeneity of carbon emissions, a dynamic panel model was constructed to explore the CO2 emission reduction effect of China’s green finance on resource-based cities [72].
Green finance credit and green venture capital, as corporate debt and equity financing methods, are expressed as a “symbiotic” or “competitive” relationship in the process of green corporate financing [73]. When a company’s capital demands are strong and the use of one financing method alone leads to excessive financial leverage or high capital costs, companies often use both methods to combine financing, rationally adjust the financing structure, and save capital costs. Green credit and green venture capital show a symbiotic relationship when the financing gap of a company is small and the use of two financing methods will increase unnecessary financial costs (such as handling fees). In this case, companies will often choose one of the two. At the level of industries, the signal sent by the green finance policy results in a new investment depression for the green industry. Green credit and green venture capital will flock to the green industry at the same time. At the level of corporates, green venture capital will bid for the credit conditions of green credit and tends to conform to the national green development policy-oriented enterprises [74]. The green signal will enable green credit and green venture capital to focus on specific companies in the green industries, and further strengthen the symbiosis and competitive relationships between green credit and green venture capital. Therefore, the interaction term between green finance credit and green venture capital was constructed as an explanatory variable to analyze their coupling relationship in the process of the low-carbon transformation of resource-based cities in China.
The roles of green credit and green venture capital are inseparable from the sound regional financial system and efficient financial market mechanism; that is, the CO2 emission reduction effect of green finance tools relies on the high level of green finance development in the regions [75]. Contrarily, the improvement in the level of regional green finance development can promote the further development and innovation of green finance tools and improve the efficiency of green finance resource allocation [76]. Therefore, the interaction terms of green credit and the green finance development index, and the interaction term of green venture capital and the green finance development index, were constructed separately, and their joint effects on the CO2 emission reduction effect of resource-based cities in China were studied individually.
Regarding other factors that affect carbon dioxide emissions, the increased competition in China’s finance industry and the improvement of finance marketization can hinder the growth of resource-based industries and low-value-added industries, and can significantly reduce CO2 emissions [77]. Technological innovation has an inhibitory effect on carbon dioxide emissions [78], and scientific research investment will also indirectly affect carbon emissions considering its role in promoting technological innovation [79]. The manufacturing industry is the main source of CO2 emissions in China [80]. The total regional finance volume has a threshold effect on technological innovation, which in turn affects the total regional carbon emissions [80]. For these reasons, when analyzing the carbon dioxide reduction effect of green finance, the financial industry competition index, R&D investment, industrial structure, and finance scale were included as control variables. Therefore, based on the principle of item analysis, we used the following equations:
l n C R I i , t = α 0 + α 1 l n C R I i , t 1 + α 2 l n G F C i , t + α 3 l n G V C i , t + α 4 l n G F C · l n G V C i , t + α n l n X n , i , t + μ i + ε i , t
l n C R I i , t = β 0 + β 1 l n C R I i , t 1 + β 2 l n G F C i , t + β 3 l n G F I i , t + β 4 l n G F C · l n G F I i , t + β n l n X n , i , t + μ i + ε i , t
l n C R I i , t = γ 0 + γ 1 l n C R I i , t 1 + γ 2 l n G V C i , t + γ 3 l n G F I i , t + γ 4 l n G V C · l n G F I i , t + γ n l n X n , i , t + μ i + ε i , t
where i represents a resource-based city’s ID, and t represents time. The explained variable lnCRI represents the natural logarithm of the intensity of CO2 emissions, and the core explanatory variables lnGFC, lnGVC, and lnGFI represent the logarithmic values of green-finance credit, green venture capital, and the green finance development index, respectively. In addition, the finance industry competition index (lnFICI), R&D investment (lnR&D), and industrial structure (lnIS) are included in the control variable Xn. μ is the individual effect, and ε is the random error term which is normally distributed [81,82,83,84,85,86].

3.2. Data Source and Selection of Variables

3.2.1. Source of Data

For the data collection, we selected 126 resource-based cities of China in prefecture-level administrative regions. These cities were selected based on the National Sustainable Development Plan for Resource-Based Cities (2012–2020), issued by the State Council of China. The current provincial and municipal resource consumption was up to date in 2017, and due to considerations of data availability and comparability, in addition to model requirements, the period was selected as 2005–2017. The gross domestic product and industrial output values were taken from the National Bureau of Statistics of China, and the data of various energy consumption and sulfur emissions were taken from China Energy Statistics Yearbook. The data of average low calorific value and the standard coal conversion factor of various energy sources were collected from the Comprehensive Energy General Principles for Calculation of Energy Consumption (GB/T 2589-2008), and the carbon content and carbon oxidation rate per unit of calorific value were taken from the Provincial Greenhouse Gas Inventory Compilation Guidelines (China Development and Reform Commission Climate Office (2011) No. 1041)). The data of the total amount of interest paid by industries and the total interest of the six high-energy-consuming industries were taken from the China Industrial Statistical Yearbook (named the China Industrial Economic Statistical Yearbook before 2013), for which some missing data were predicted or reversed using the annual average growth rate. The amount of venture capital investment in new energy, materials, and environmental protection was compiled based on Jiang et al. [72], partly from the China Science and Technology Statistical Yearbook. The data to calculate the green finance development index were taken from the China Statistical Yearbook and partly from the China Insurance Yearbook. The data of financial industry competition were taken from the China Financial Statistics Yearbook, and the data of the number of R&D investments were taken from the China Science and Technology Statistical Yearbook.

3.2.2. Selection of Variables

CO2 Relative Intensity (CRI)

We assume that under the same production technology level, the total amount of carbon dioxide emitted by resource-based cities is dependent on the economic aggregate of each region. Therefore, simply considering the amount of carbon dioxide emissions cannot characterize the carbon emission reduction capacity of a certain place. The ratio of CO2 emissions to current GDP is used as an indicator of carbon dioxide emissions (Equation (4)), which describes the amount of carbon dioxide emitted by each unit of economic output so that resource-based cities of different economic scales have a unified foundation for comparative analysis. First, we referred to the calculation method of the Intergovernmental Panel on Climate Response (IPCC) (Equation (5)) to estimate China’s provincial CO2 emissions. However, at present, there are no sufficient statistics on city-level energy consumption. Because the batches are similar and the internal mineral structure of resource-based cities is similar, the sulfur content of various energy sources is directly proportional to the carbon content. Therefore, a weight was assigned to each resource-based city, and the municipal CO2 emissions of resource-based cities were calculated based on the current carbon emissions of the province in which they are located, to fill in the vacant data (Equation (6)).
C R I = C G D P
In Equation (4), C represents the total amount of carbon dioxide emissions, and GDP represents gross domestic product.
C = S j · β j · α j 12 44
where Sj represents the consumption of the j-th energy, and βj represents the coefficient of carbon dioxide emission of the j-th energy; the calculation formula is carbon dioxide emission coefficient = average low calorific value × standard coal coefficient × carbon content per calorific value × carbon oxidation rate. αj is the conversion factor of the j-th energy into standard coal, and the constant factor represents the mass ratio of carbon.
C c i t y = S c i t y S p r o v i n c e · C p r o v i n c e
where Ccity and Cprovince represent the municipal carbon dioxide emissions of the resource-based city and the current carbon dioxide emissions of the province, respectively. Simultaneously, Scity and Sprovince represent the municipal-level sulfur dioxide emissions of the resource-based city and the current period of the province, respectively.

Green-Finance Credit (GFC)

The data of green-finance credit released by the China Banking and Insurance Regulatory Commission (formerly the China Banking Regulatory Commission) only includes the green credit lines of 21 major commercial banks. The statistical caliber is relatively small, and the statistical time began in 2013; thus, the time span is not suitable for our empirical analysis needs. Additionally, the amount of loans used in the treatment of environmental pollution in the industrial sector is as of 2010, which does not apply to this article [87]. Regarding the reverse construction index method, the interest expenditure of the six high energy-consuming industries defined in the Statistical Report on National Economic and Social Development divided by the industrial interest expenditure reflects the practice of the scale of green finance credit [87]. We directly took taken the difference between the industrial interest expenditure and the interest expenditure of the six energy-intensive industries as the green-finance credit scale variable (Equation (7)), and used the logarithmic form of it in the model. Moreover, subject to the limitations of city-level data statistics, we assigned weights to resource-based cities in prefecture-level administrative regions and completed the missing data based on the province’s green finance credit data (Equation (8)).
G F C = I I E H E I E
where IIE represents the total industrial interest expenditure, and HEIE represents the interest expenditure of the six highest energy-consuming industries.
G F C c i t y = I O c i t y I O p r o v i n c e · G F C p r o v i n c e
where GFCcity and GFCprovince, respectively, represent the total amount of green credit at the municipal level of resource-based cities and the total amount of green credit in the province where it is located in the current period. Similarly, IOcity and IOprovince individually represent the added value of the secondary industry at the resource-based city’s municipal level and the added value of the secondary industry of the province where it is located in the current period.

Green Venture Capital (GVC)

Regarding the definition of green venture capital by Jiang et al. [71], the province-level new energy, new materials, and environmental protection industries’ venture capital investment amounts were summed, and then the resource-based city-level green venture capital investment in prefecture-level administrative regions was weighted to predict the data groups that have not been counted (Equation (9)).
G V C c i t y = I O c i t y I O p r o v i n c e · G V C p r o v i n c e
where GVCcity and GVCprovince, respectively, represent the total amount of green venture capital investment in the resource-based city at the municipal level and the total amount of green venture capital investment in the province in which it is located in the current period.

Green Finance Development Index (GFI)

According to the scoring method of the Local Green Finance Development Index and Evaluation Report in 2018 released by the Central University of Finance and Economics, in addition to considering green credit and green investment, green insurance (= total amount of agricultural insurance ÷ gross agricultural output value) and government support (= fiscal environmental protection expenditure ÷ financial general budget expenditure) are used to calculate the provincial green finance development index [88,89]. The loan scale can characterize the scale of regional financial development to a certain extent [90]. Therefore, we divided the total amount of loans in resource-based cities by the total amount of loans in the province to obtain the resource-based cities’ contribution rate of green finance development. Then, that rate was used to calculate the green finance development index of prefecture-level cities. In addition, to unify the dimensions of other variables, the contribution rate was treated as a percentage (Equation (10)).
G F I c i t y = T L c i t y T L p r o v i n c e · 100 % · G F I p r o v i n c e
where GFIcity and GFIprovince, respectively, represent the resource-based cities’ municipal green finance development index and the current green financial development index of the province where it is located. Furthermore, TLcity and TLprovince represent the total amount of municipal loans in resource-based cities and the total amount of current loans in the province where it is located.

Financial Industry Competition Index (FICI)

According to the calculation method of the financial industry competition index in the Marketization Index of China, and referring to SENG Tianxiang’s (2020) processing method for missing data, we took the finance industry competition index for odd-numbered years as the average of two adjacent even-numbered years, and used the average growth rate of previous years to predict 2017.

Research and Development (R&D)

According to the Cobb–Douglas production function, economic output is directly proportional to the progress of production technology. It is also well known that most of the funds for the progress of production technology come from R&D investment. It can be seen that there is a long-term positive relationship between R&D investment and economic output. Therefore, under the condition that the statistics of R&D investment at the prefecture and city levels are lacking, to replace the missing data, we divided the GDP of the prefecture-level city of the resource-based cities by the GDP of the province-level regions where they are located to obtain the contribution rate of the prefecture-level city to the province’s R&D investment, and reversed the R&D investment scale of the resource-based cities (Equation (11)).
R & D c i t y = G D P c i t y G D P p r o v i n c e · R & D p r o v i n c e
where R&Dcity and R&Dprovince, respectively, represent the city-level R&D investment of resource-based cities and the current R&D investment of the province where it is located. Similarly, GDPcity and GDPprovince represent the city-level GDP of the resource-based city and the current GDP of the province, respectively.

Industrial Structure (IS)

Resource-based cities are mainly dominated by energy development and related industry sectors. Therefore, CO2 emissions are mainly released by the secondary industry sectors. Regardless of whether it is the impact on the carbon dioxide emission reduction effect of green finance or the impact on the allocation of green finance resources guided by environmental regulations, the main influencing role in the industrial structure is the proportion of the output value of the industrial sector. The ratio of the industrial output value to the gross domestic product was used as an indicator of the industrial structure [91].

Finance Scale (FS)

Under the condition of meeting the capital adequacy ratio, the larger the total loan amount, the stronger the profitability of the bank. The larger the total amount of loans in a certain region, the more active the basic business of the banks in the region, the higher the profitability of the bank, and the higher the level of financial development. Limited by data, and to maintain the dimensions and order of unity with other variables, we did not use the loan-to-deposit ratio as an indicator, but used total loans as an indicator of credit scale, which can characterize resource-based cities’ level of financial development to a certain extent.

4. Results and Discussion

4.1. Summary of Basic Statistics

The results in Table 1 show that China’s resource-based cities produce 176 tons of CO2 emissions per CNY 100 million of GDP (the unit of CRI is kt/100 million yuan), having a maximum value of 23.149, and the minimum value is approximately 0, which indicates that the carbon dioxide emission intensity gap of different resource-based cities in China since 2005 is large. The standard deviation reflects that the data fluctuates little. Additionally, the mean value of green credit is 10.009, and the standard deviation is 15.954. China has issued the Green Credit Guidelines since 2012, marking the standardization of China’s green credit policy. Since then, China’s green credit scale has continued to expand, and there is a now a large difference compared to 2012. Nonetheless, the economic development gap between the eastern and western regions of China has also indirectly led to the difference in green credit between resource-based cities in the eastern and western regions [92].
Although it is predetermined, the linear dynamic panel data regression is related to the past error; therefore, there will be endogenous problems after the differential operation. Generally, to avoid the error, diff-GMM or sys-GMM are used to address with the issue [93]. However, based on the observation of descriptive statistics of variables in this article, the selected sample in this article comprised long dynamic panel data. Roodman [94] found a differential GMM and system GMM that is just limited to short dynamic panel data and short static panel data. Therefore, we selected the bias-corrected LSDV method (LSDVC method) for analysis and used the LSDVC self-service method to overcome the problem of heteroscedasticity between groups and autocorrelation within groups. Then, we tested the significance of the first-order lag of the explained variable, and the results showed the selected first-order lag is valid. Simultaneously, the Hausman test was used and from the F value, the data group was adapted to the fixed effect. Although the fixed-effect estimator always produces a downward bias, this bias will decrease as the time dimension increases in our long-term panel model.

4.2. Empirical Analysis of CO2 Emissions Reduction Effects of Green Finance

4.2.1. Empirical Analysis of the CO2 Emissions Reduction Effect of Green Finance without Environmental Regulation

The results of Table 2 showed that with a 1% level of significance, the coefficients of green finance credit, green venture capital, and green finance development index are negative to CO2 emissions. All three have effectively suppressed the carbon dioxide emission intensity of resource-based cities and, in this process, green finance credit and green venture capital have a “symbiotic” relationship in the carbon reduction; however, it is not significant. Similar results were found in previous studies [56,77,90]. However, the intensities of the effect on CO2 emission reduction are different—under a unified significant level, green finance credit inhibits CO2 emissions more strongly than green venture capital. Jiang et al. [71] also found similar results at the provincial level. The reason may be that green finance credit has an earlier start in China than green venture capital [70]. Therefore, the scale of credit is much larger than that of venture capital, and shows a strong CO2 emission reduction effect [70,95]. In addition, the CO2 emission reduction effect of the joint action between the green finance development index and green finance credit or green venture capital is significantly higher than the independent effect, which may be because it is in addition to green finance credit and green venture capital. Green finance instruments such as green bonds, green insurance, and carbon emission rights trading in the green finance market have played a role in reducing CO2 emissions. Moreover, green finance credit and green venture capital have also played a role in the reduction of emissions [70,95].
The overall results depicted that the green finance (green credit and green venture capital) significantly reduced the CO2 emissions, and this finding satisfied Hypothesis 1.

4.2.2. Robustness Test

To test the robustness of the above regression results, based on descriptive statistical analysis, the reason for the large fluctuations in green finance credit may be related to the release time of green finance credit guidelines, and the scale of the gap between green credit before 2012 and that after 2012. Concerning the green symbol, the transmission will also affect the development of green venture capital and green finance. Thus, we reduced the period to 2012–2017 for the return (Table 3). The combined effects of green credit and the green financial development index, and green venture capital and the green financial development index, effectively suppressed CO2 emissions. The intensity of green finance credit is greater than that of green venture capital, and the intensity of the combined effects of variables is greater than the intensity of their independent effects. Simultaneously, the growth in green finance credit and green venture capital showed a competitive relationship, but this relationship is currently not significant. Furthermore, there is no significant coupling relationship between green finance credit and green venture capital. These results indicate that the above regression results are still robust.

4.3. Empirical Analysis of the CO2 Emission Reduction Effect of Green Finance under Environmental Regulation

Environmental regulation will limit regional carbon dioxide emissions with administrative compulsory means such as carbon taxes [96]. At the same time, the regulations guide and optimize the allocation of green finance resources among different regions to achieve the effect of reducing carbon dioxide emissions. Following Fu et al. [97], we averaged the CO2 emission intensity of each city with fixed time and cross-sectional dimensions. Then, those cities having CO2 emission intensity greater than the average value were allocated to the weak environmental regulation group; otherwise, they are allocated to the strong regulation group. Based on the above groupings, we studied the impact of green finance on the CO2 emissions of resource-based cities under different environmental regulatory intensities.

4.3.1. Emission Reduction Due to Green Finance under Strong Environmental Regulation

According to Table 4, it was found that the green finance credit and green venture capital reduced the emissions. However, the green finance development index does not have the effect of carbon dioxide emission reduction, and its joint action with both green finance credit and green venture capital also does not have this effect. By testing the significance of the coefficient difference, it was found that the green finance development index is more powerful than green finance credit and green venture capital due to the following reasons; these results are consistent with the studies of Li, C. et al. [98] and Dong, S. et al. [99]. When environmental regulation is strong and CO2 emissions are less intense, as the “visible hand”, environmental regulation has replaced the role of green finance as the “invisible hand” to a certain extent [98]. The efficiency of the green finance market needs to be improved due to the strength of environmental regulation, and green finance resources have not been effectively channeled to the fund-requiring sectors for technological innovation, resulting in a poor CO2 emission reduction effect in green finance [99]. In addition, green finance credit and green venture capital that have received “regulatory signals” balance profitability and safety, which will reduce investment in areas with strong regulations and will further restrict the development of green finance [100]. Therefore, green finance in areas with strong environmental regulations has not developed well and has not played a role in reducing carbon dioxide emissions. Although the relationship between green finance credit and green venture capital shows competitiveness under strong environmental regulation, it is not significant. The reason that the interrelationship is not yet obvious may be that the level of green finance development in areas with strong environmental regulations is relatively low, and the scale of green finance credit and green venture capital is relatively small [101]. Green finance with strict environmental regulation significantly reduced CO2 emissions (this result satisfied Hypothesis 2).

4.3.2. Emission Reduction Due to Green Finance under Weak Environmental Regulation

The results in Table 5 show that the combined effects of the green finance development index and green finance credit or green venture capital significantly reduced CO2 emissions. A similar result was also found in the study of Wang et al. [9]. This shows that green finance and administrative measures between regions with different intensities of environmental regulation have played a complementary role. In weakly regulated areas, green finance regulates CO2 emissions in a market-oriented manner, whereas green finance funds have not received “regulatory signals”, and transforming or clean companies in these areas have become new investment depressions [102]. Under the influence of weak environmental regulation, the relationship between green credit and green venture capital is also not significant. This shows that in areas with either strong or weak regulation, China’s green finance credit and green venture capital have not yet shown a significant coupling relationship due to the development of their scales. The results showed that green finance and the adoption of environmental regulations effectively reduced carbon emissions, thus satisfying Hypothesis 1. In particular, more green capital adopted weaker environmental regulations and less green capital adopted stronger environmental regulations. In both cases, the CO2 emissions were significantly reduced. These results satisfied Hypothesis 2.

4.3.3. Robustness Test

Green finance credit and green venture capital did not show a significant relationship when Equations (2) and (3) were tested for robustness (Table 6). The combined effects of the green finance development index with green credit and green venture capital did not reduce CO2 emissions in areas with strong regulations but effectively reduced CO2 emissions in areas with weak regulations, which shows that the above regression results are robust.

5. Conclusions, Policy Implications, and Future Research

Based on the panel data (2005–2017) of 126 resource-based cities in China, we constructed a dynamic panel model with green finance credit, green venture capital, and the green finance development index as the core explanatory variables to analyze the CO2 emission reduction effect of green finance. Moreover, we explored a role of environmental regulation in the reduction of the emissions. The main conclusion and policy implications are given below.

5.1. Main Conclusions

Incorporating the green finance development index based on green finance credit and green venture capital, we analyzed the impact of green finance credit and green venture investment on the CO2 emissions of China’s resource-based cities under the current level of green finance development. We found that green finance credit and green venture capital based on the current level of green finance development have a significant inhibitory effect on CO2 emissions. Green finance played a positive role in the reduction of carbon emissions. The main reasons for the role of green credit being stronger than green venture capital are as follows: First, green finance credit in China started earlier than green venture capital, and, compared with venture capital, credit occupied the vast majority of financial resources—currently amounting to about CNY 14 trillion. This allows green credit to penetrate various green industries and form a scale effect. Secondly, green venture capital is affected by factors such as IPO review standards, capital market investor sentiment, and macroeconomic operation trends, resulting in its poor development. To reduce carbon emissions, it is necessary to develop alternative energy sources of mineral energy and improve the energy consumption structure [103]. Compared to other regions such as Europe [103], most of China’s green energy industries, especially those located in resource-based cities, are in the process of transformation. The profit potential has not been transformed into actual productivity. Restrictions and high financing costs made companies increase financial leverage and use debt financing to operate. Therefore, green-finance credit with scale advantages and cost advantages are the main support for the development of the green energy industry, compared with green venture capital, and its performance in terms of CO2 reduction is stronger. Overall, green finance played a significant role in the reduction of environmental emissions.
Furthermore, it was found that the joint effect of the green finance development index with green finance credit or green venture capital has significantly reduced the environmental emissions. However, it was revealed that green finance cannot inhibit CO2 emissions. The green finance capital is affected by the signal transmission of environmental regulation, so that green finance resources flow to enterprises that urgently need technological upgrading and development of clean projects. Therefore, the allocation of green finance resources is optimized well and reduced the intensity of CO2 emission.
Regardless of whether the environmental regulatory factors are included in the test, green finance credit and green venture capital have not shown a significant coupling relationship. There is neither a significant “symbiosis” relationship nor a significant “competitive” relationship between them. The possible reason for this is that when the scales of green finance credit and green venture capital have developed to a certain level, either one of the financial resources of the two can meet the needs of enterprises’ innovation. Similarly, when the green finance resources are relatively too saturated, the demand for funds is dominant, and green finance credit and green venture capital shown a “competitive” relationship. Contrarily, a “symbiotic” relationship was observed. However, as mentioned above, there is still a large funding gap for China’s low-carbon green transformation. Compared with the financing of other more mature traditional industries, the green industries of China have only just started, especially in resource-based cities, which have huge capital absorbing capacity.

5.2. Policy Implications

5.2.1. Development of Green Venture Capital and Innovation of Green Financial Tools

According to the empirical results, green finance credit and green venture capital have effectively suppressed the intensity of the CO2 emissions of resource-based cities in China and promoted the low-carbon transformation of these cities. The green finance development index combined with green finance credit or green venture capital is more significant than green credit or green venture capital alone. This shows that the CO2 reduction effect of green finance instruments depends on the development of green finance. In addition to green finance credit and green venture capital in the market, carbon emission rights trading, green finance bonds, and green finance insurance are all included in the category of green finance instruments, which play a significant role in the low-carbon transformation of resource-based cities. At present, the People’s Bank of China and the European Union, and other major global economies, are continuing to discuss green finance standards and performance appraisal mechanisms. Similarly to developed countries, China should focus on innovative green finance tools and provide financing channels that are more convenient and more diverse for the green development of enterprises and regional low-carbon transformation.

5.2.2. Environmental Regulation and Green Finance

Green finance, as an economic tool that plays a regulatory role, has a certain degree of spontaneity. Therefore, it needs to cooperate with environmental regulations to play a role in the reduction of CO2 emissions. Environmental regulation policies can have a signaling effect on green finance capital, and green capital can follow the signal to find new investment depressions so that funds can flow to clean industries. In addition, to restrain high carbon emissions, environmental regulation forces some companies to withdraw from high-carbon emission projects. Simultaneously, financial institutions will adjust credit supply and loan interest rates according to the financial and operating conditions of the enterprise to achieve the optimal allocation of green finance resources [30,104]. However, excessively strong environmental regulation not only has a negative effect on the economy in the short term, but also inhibits the maturity and development of the green finance market.

5.2.3. Expansion in the Scale of Green Credit and Green Venture Capital

Commercial banks should expand the proportion of green credit businesses. It was found that green credit can effectively reduce the intensity of CO2 emissions; thus, commercial banks should further expand the scale of green credit.

5.3. Future Research

The current article used a dynamic panel data model to empirically estimate the reduction in the CO2 emission effects of different green finance instruments under different environmental regulatory intensities. In this study, green finance included green credit and green venture capital, and environmental regulations that helped to reduce CO2 emissions. However, due to the limitations of regional data statistics and disclosure, this paper did not comprehensively discuss the carbon emission reduction effect. Therefore, the impact of green finance on the environment and the impact of environmental risk on financial stability are two aspects that need to be examined in a future study.

Author Contributions

Conceptualization, F.W. and W.C.; methodology, F.W. and E.E.; software, F.W.; validation, F.W., W.C. and E.E.; formal analysis, F.W.; investigation, F.W.; resources, E.E.; data curation, W.C.; writing—original draft preparation, F.W.; writing—review and editing, F.W. and E.E.; visualization, F.W.; supervision, E.E.; project administration, W.C.; funding acquisition, W.C. and E.E. All authors have read and agreed to the published version of the manuscript.

Funding

This research was funded by the Taishan Young Scholar Program of the Taishan Scholar Foundation of Shandong Province (CN), grant number tsqn202103070 and this paper was funded by the National Natural Science Foundation of China (NSFC), grant number, 71850410541.

Institutional Review Board Statement

Not applicable.

Informed Consent Statement

Not applicable.

Data Availability Statement

The data are not publicly available due to restrictions privacy.

Acknowledgments

This study was sponsored by the Taishan Young Scholar Program (No. tsqn202103070) funded by the Taishan Scholar Foundation of Shandong Province (CN). The financial grant (Grant number 71850410541) of the National Natural Science Foundation of China (NSFC) is highly acknowledged.

Conflicts of Interest

The authors declare no conflict of interest.

References

  1. Teo, E.C. Singapore–China Economic Collaboration 2.0. Singap. Econ. Rev. 2021, 66, 207–217. [Google Scholar] [CrossRef]
  2. Koondhar, M.A.; Tan, Z.; Alam, G.M.; Khan, Z.A.; Wang, L.; Kong, R. Bioenergy consumption, carbon emissions, and agricultural bioeconomic growth: A systematic approach to carbon neutrality in China. J. Environ. Manag. 2021, 296, 113242. [Google Scholar] [CrossRef] [PubMed]
  3. Zhao, Y.; Peng, B.; Elahi, E.; Wan, A. Does the extended producer responsibility system promote the green technological innovation of enterprises? An empirical study based on the difference-in-differences model. J. Clean. Prod. 2021, 319, 128631. [Google Scholar] [CrossRef]
  4. Zhao, X.; Peng, B.; Elahi, E.; Zheng, C.; Wan, A. Optimization of Chinese coal-fired power plants for cleaner production using Bayesian network. J. Clean. Prod. 2020, 273, 122837. [Google Scholar] [CrossRef]
  5. Zheng, C.; Peng, B.; Elahi, E.; Wan, A. Strategies of Haze Risk Reduction Using the Tripartite Game Model. Complexity 2020, 2020, 6474363. [Google Scholar] [CrossRef]
  6. Dong, F.; Zhang, Y.; Zhang, X.; Hu, M.; Gao, Y.; Zhu, J. Exploring ecological civilization performance and its determinants in emerging industrialized countries: A new evaluation system in the case of China. J. Clean. Prod. 2021, 315, 128051. [Google Scholar] [CrossRef]
  7. Peng, B.; Chen, S.; Elahi, E.; Wan, A. Can corporate environmental responsibility improve environmental performance? An inter-temporal analysis of Chinese chemical companies. Environ. Sci. Pollut. Res. 2021, 1–12. [Google Scholar] [CrossRef]
  8. Fan, F.; Wang, Y.; Liu, Q. China’s carbon emissions from electricity sector: Spatial characteristics and interregional transfer. Integr. Environ. Assess. Manag. 2021, 1–16. [Google Scholar] [CrossRef]
  9. Wang, H.; Chen, Z.; Wu, X.; Nie, X. Can a carbon trading system promote the transformation of a low-carbon economy under the framework of the porter hypothesis?—Empirical analysis based on the PSM-DID method. Energy Policy 2019, 129, 930–938. [Google Scholar] [CrossRef]
  10. Peng, B.; Wang, Y.; Elahi, E.; Wei, G. Behavioral game and simulation analysis of extended producer responsibility system’s implementation under environmental regulations. Environ. Sci. Pollut. Res. 2019, 26, 17644–17654. [Google Scholar] [CrossRef]
  11. Li, T.; Liao, G. The heterogeneous impact of financial development on green total factor productivity. Front. Energy Res. 2020, 8, 29. [Google Scholar] [CrossRef] [Green Version]
  12. Peng, B.; Zhang, X.; Elahi, E.; Wan, A. Evolution of spatial–temporal characteristics and financial development as an influencing factor of green ecology. Environ. Dev. Sustain. 2021, 1–21. [Google Scholar] [CrossRef]
  13. Xu, S.; Zhao, X.; Yao, S. Analysis on the effect of green credit on the upgrading of industrial structure. J. Shanghai Univ. Financ. Econ. 2018, 20, 59–72. [Google Scholar]
  14. Peng, B.; Zheng, C.; Wei, G.; Elahi, E. The cultivation mechanism of green technology innovation in manufacturing industry: From the perspective of ecological niche. J. Clean. Prod. 2020, 252, 119711. [Google Scholar] [CrossRef]
  15. Shen, D.; Xia, M.; Zhang, Q.; Elahi, E.; Zhou, Y.; Zhang, H. The impact of public appeals on the performance of environmental governance in China: A perspective of provincial panel data. J. Clean. Prod. 2019, 231, 290–296. [Google Scholar] [CrossRef]
  16. Sheng, X.; Peng, B.; Elahi, E.; Wei, G. Regional convergence of energy-environmental efficiency: From the perspective of environmental constraints. Environ. Sci. Pollut. Res. 2019, 26, 25467–25475. [Google Scholar] [CrossRef]
  17. Wu, B.; Peng, B.; Wei, W.; Ehsan, E. A comparative analysis on the international discourse power evaluation of global climate governance. Environ. Dev. Sustain. 2021, 1–22. [Google Scholar] [CrossRef]
  18. Chiu, A.S.; Yong, G. On the industrial ecology potential in Asian developing countries. J. Clean. Prod. 2004, 12, 1037–1045. [Google Scholar] [CrossRef]
  19. Peng, B.; Li, Y.; Elahi, E.; Wei, G. Dynamic evolution of ecological carrying capacity based on the ecological footprint theory: A case study of Jiangsu province. Ecol. Indic. 2019, 99, 19–26. [Google Scholar] [CrossRef]
  20. Peng, B.; Wang, Y.; Elahi, E.; Wei, G. Evaluation and prediction of the ecological footprint and ecological carrying capacity for yangtze river urban agglomeration based on the grey model. Int. J. Environ. Res. Public Health 2018, 15, 2543. [Google Scholar] [CrossRef] [Green Version]
  21. Zhong, Z.; Peng, B.; Elahi, E. Spatial and temporal pattern evolution and influencing factors of energy–environmental efficiency: A case study of Yangtze River urban agglomeration in China. Energy Environ. 2021, 32, 242–261. [Google Scholar] [CrossRef]
  22. Peng, B.; Tu, Y.; Elahi, E.; Wei, G. Extended Producer Responsibility and corporate performance: Effects of environmental regulation and environmental strategy. J. Environ. Manag. 2018, 218, 181–189. [Google Scholar] [CrossRef]
  23. Dogan, E.; Seker, F. The influence of real output, renewable and non-renewable energy, trade and financial development on carbon emissions in the top renewable energy countries. Renew. Sustain. Energy Rev. 2016, 60, 1074–1085. [Google Scholar] [CrossRef]
  24. Charfeddine, L.; Khediri, K.B. Financial development and environmental quality in UAE: Cointegration with structural breaks. Renew. Sustain. Energy Rev. 2016, 55, 1322–1335. [Google Scholar] [CrossRef]
  25. Li, X.; Xie, Y. Research on the Development Path of Chinese Commercial Banks Based on Green Finance. In Proceedings of the 5th International Conference on Financial Innovation and Economic Development (ICFIED 2020), Sanya, China, 10–12 January 2020; Atlantis Press China: Zhengzhou, China, 2020; pp. 205–211. [Google Scholar]
  26. Liu, X.; Wang, E.; Cai, D. Green credit policy, property rights and debt financing: Quasi-natural experimental evidence from China. Financ. Res. Lett. 2019, 29, 129–135. [Google Scholar] [CrossRef]
  27. Atasu, A.; Sarvary, M.; Van Wassenhove, L.N. Remanufacturing as a marketing strategy. Manag. Sci. 2008, 54, 1731–1746. [Google Scholar] [CrossRef] [Green Version]
  28. Ștefănică, M.; Sandu, C.B.; Butnaru, G.I.; Haller, A.-P. The Nexus between Tourism Activities and Environmental Degradation: Romanian Tourists’ Opinions. Sustainability 2021, 13, 9210. [Google Scholar] [CrossRef]
  29. Mazzucato, M.; Wray, L.R. Financing the Capital Development of the Economy: A Keynes-Schumpeter-Minsky Synthesis; LEM Working Paper Series; Scuola Superiore Sant’Anna, Laboratory of Economics and Management (LEM): Pisa, Italy, 2015. [Google Scholar]
  30. Xia, Y.; Liu, P.; Huang, G. Bank deregulation, environmental regulation and pollution reduction: Evidence from Chinese firms. Econ. Res. Ekon. Istraž. 2021, 34, 2162–2193. [Google Scholar] [CrossRef]
  31. Yu, C.; de Jong, M.; Cheng, B. Getting depleted resource-based cities back on their feet again—The example of Yichun in China. J. Clean. Prod. 2016, 134, 42–50. [Google Scholar] [CrossRef] [Green Version]
  32. Wang, R. Corporate Environmentalism in China; ERIM Ph.D. Series Research in Management; Erasmus University Rotterdam: Rotterdam, The Netherlands, 2017. [Google Scholar]
  33. Shahab, Y.; Ntim, C.G.; Chengang, Y.; Ullah, F.; Fosu, S. Environmental policy, environmental performance, and financial distress in China: Do top management team characteristics matter? Bus. Strategy Environ. 2018, 27, 1635–1652. [Google Scholar] [CrossRef]
  34. Sun, Z.; Wang, X.; Liang, C.; Cao, F.; Wang, L. The impact of heterogeneous environmental regulation on innovation of high-tech enterprises in China: Mediating and interaction effect. Environ. Sci. Pollut. Res. 2021, 28, 8323–8336. [Google Scholar] [CrossRef] [PubMed]
  35. Song, Y.; Yang, T.; Zhang, M. Research on the impact of environmental regulation on enterprise technology innovation—An empirical analysis based on Chinese provincial panel data. Environ. Sci. Pollut. Res. 2019, 26, 21835–21848. [Google Scholar] [CrossRef] [PubMed]
  36. Mo, X.; Changqi, T. The Effect of Environmental Regulation on Technological Innovation from the Optimization Perspective—Empirical Study Based on 29 Sub-Section of China’s Manufacturing Industry. J. Jiangxi Norm. Univ. 2016, 5, 525–530, (Natural Science Edition). [Google Scholar]
  37. Qing-Huang, H.; Ming, G. Quantity and quality effects of environmental regulation on economic growth—Test based on simultaneous equations. Economist 2016, 4, 53–62. [Google Scholar]
  38. Zhang, J.; Wang, J.; Yang, X.; Ren, S.; Ran, Q.; Hao, Y. Does local government competition aggravate haze pollution? A new perspective of factor market distortion. Socio-Econ. Plan. Sci. 2021, 76, 100959. [Google Scholar] [CrossRef]
  39. Gu, H.; Yan, W.; Elahi, E.; Cao, Y. Air pollution risks human mental health: An implication of two-stages least squares estimation of interaction effects. Environ. Sci. Pollut. Res. 2020, 27, 2036–2043. [Google Scholar] [CrossRef]
  40. Gu, H.; Cao, Y.; Elahi, E.; Jha, S.K. Human health damages related to air pollution in China. Environ. Sci. Pollut. Res. 2019, 26, 13115–13125. [Google Scholar] [CrossRef]
  41. Gu, H.; Bian, F.; Elahi, E. Effect of air pollution on female labor supply: An empirical analysis based on data of labor force dynamic survey of China. Soc. Work Public Health 2020, 35, 187–196. [Google Scholar] [CrossRef]
  42. Fu, J.; Lu, X. Enhancing Sustainable Development through Regulatory Means and Market-Oriented Incentives for Waste Management in the GBA. In Sustainable Energy and Green Finance for a Low-Carbon Economy; Springer: Berlin/Heidelberg, Germany, 2020; pp. 271–285. [Google Scholar]
  43. Yijun, Y.; Liu, L. Environmental Regulation and Economic Growth: A Research Based on Different Kinds of Economic Regulation. Econ. Rev. 2013, 1, 27–33. [Google Scholar]
  44. Violi, M.P. Is There Any Future for Green Finance in China? Ph.D. Thesis, Università Ca’Foscari Venezia, Veneto, Italy, 2020. [Google Scholar]
  45. Gong, R.; Wu, Y.-Q.; Chen, F.-W.; Yan, T.-H. Labor costs, market environment and green technological innovation: Evidence from high-pollution firms. Int. J. Environ. Res. Public Health 2020, 17, 522. [Google Scholar] [CrossRef] [Green Version]
  46. Armand, D.M.; Germain, N.T. Incentives Factors for the Performance of Microfinance Institutions in Cameroon. Sch. J. Econ. Bus. Manag. 2021, 2, 58–68. [Google Scholar] [CrossRef]
  47. Elahi, E.; Weijun, C.; Jha, S.K.; Zhang, H. Estimation of realistic renewable and non-renewable energy use targets for livestock production systems utilising an artificial neural network method: A step towards livestock sustainability. Energy 2019, 183, 191–204. [Google Scholar] [CrossRef]
  48. Polukhin, A.; Grudkina, T.; Grudkina, M. Factors increasing the effectiveness of state support in agriculture. In IOP Conference Series: Earth and Environmental Science; IOP Publishing: Beijing, China, 2019; p. 012113. [Google Scholar]
  49. Wang, Z.; Brownlee, A.E.; Wu, Q. Production and joint emission reduction decisions based on two-way cost-sharing contract under cap-and-trade regulation. Comput. Ind. Eng. 2020, 146, 106549. [Google Scholar] [CrossRef]
  50. Wu, S.; Han, H. Sectoral changing patterns of China’s green GDP considering climate change: An investigation based on the economic input-output life cycle assessment model. J. Clean. Prod. 2020, 251, 119764. [Google Scholar] [CrossRef]
  51. Hao, Y.; Ba, N.; Ren, S.; Wu, H. How does international technology spillover affect China’s carbon emissions? A new perspective through intellectual property protection. Sustain. Prod. Consum. 2021, 25, 577–590. [Google Scholar] [CrossRef]
  52. Wang, W.; Yang, F. The Belt and Road Initiative and China’s green foreign direct investment 1. In Green Finance, Sustainable Development and the Belt and Road Initiative; Routledge: London, UK, 2020; pp. 33–57. [Google Scholar]
  53. Dai, Y.; Li, N.; Gu, R.; Zhu, X. Can China’s carbon emissions trading rights mechanism transform its manufacturing industry? Based on the perspective of enterprise behavior. Sustainability 2018, 10, 2421. [Google Scholar] [CrossRef] [Green Version]
  54. Bruce, S. The 2015 Paris Climate Agreement: Design Options and Incentives to Increase Participation and Ambition. J. Soc. Sci. Electron. Publ. 2014, 1, 2525957. [Google Scholar] [CrossRef]
  55. Liu, Y.; Zhu, J.; Li, E.Y.; Meng, Z.; Song, Y. Environmental regulation, green technological innovation, and eco-efficiency: The case of Yangtze river economic belt in China. Technol. Forecast. Soc. Chang. 2020, 155, 119993. [Google Scholar] [CrossRef]
  56. Zhang, S.; Wu, Z.; Wang, Y.; Hao, Y. Fostering green development with green finance: An empirical study on the environmental effect of green credit policy in China. J. Environ. Manag. 2021, 296, 113159. [Google Scholar] [CrossRef]
  57. Karakoç, B. Foreign Capital, Real Sector Financing and Excessive Leverage in Turkey: What Went Wrong? EMAJ Emerg. Mark. J. 2020, 10, 30–39. [Google Scholar] [CrossRef]
  58. Jin, P.; Peng, C.; Song, M. Macroeconomic uncertainty, high-level innovation, and urban green development performance in China. China Econ. Rev. 2019, 55, 1–18. [Google Scholar] [CrossRef]
  59. Chao, X.; Kou, G.; Peng, Y.; Alsaadi, F.E. Behavior monitoring methods for trade-based money laundering integrating macro and micro prudential regulation: A case from China. Technol. Econ. Dev. Econ. 2019, 25, 1081–1096. [Google Scholar] [CrossRef]
  60. Langpap, C.; Shimshack, J.P. Private citizen suits and public enforcement: Substitutes or complements? J. Environ. Econ. Manag. 2010, 59, 235–249. [Google Scholar] [CrossRef]
  61. Zhang, D.; Mohsin, M.; Rasheed, A.K.; Chang, Y.; Taghizadeh-Hesary, F. Public spending and green economic growth in BRI region: Mediating role of green finance. Energy Policy 2021, 153, 112256. [Google Scholar] [CrossRef]
  62. Jefferson, G.H.; Tanaka, S.; Yin, W. Environmental Regulation and Industrial Performance: Evidence from Unexpected Externalities in China. SSRN Electron. J. 2013. [Google Scholar] [CrossRef]
  63. Du, Y.; Li, Z.; Du, J.; Li, N.; Yan, B. Public environmental appeal and innovation of heavy-polluting enterprises. J. Clean. Prod. 2019, 222, 1009–1022. [Google Scholar] [CrossRef]
  64. Huang, B.; Punzi, M.T.; Wu, Y. Do Banks Price Environmental Transition Risks? Evidence from a Quasi-Natural Experiment in China. J. Corp. Financ. 2021, 69, 101983. [Google Scholar] [CrossRef]
  65. Breitenfellner, A.; Pointner, W.; Schuberth, H. The potential contribution of central banks to green finance. Vierteljahrsh. Wirtsch. 2019, 88, 55–71. [Google Scholar] [CrossRef]
  66. Liu, J.; Xie, J. Environmental regulation, technological innovation, and export competitiveness: An empirical study based on China’s manufacturing industry. Int. J. Environ. Res. Public Health 2020, 17, 1427. [Google Scholar] [CrossRef] [Green Version]
  67. Tong, J.; Liu, W.; Xue, J. Environmental regulation, factor input structure and industrial transformation. Econ. Res. J. 2016, 7, 43–57. [Google Scholar]
  68. Lam, P.T.; Law, A.O. Crowdfunding for renewable and sustainable energy projects: An exploratory case study approach. Renew. Sustain. Energy Rev. 2016, 60, 11–20. [Google Scholar] [CrossRef] [Green Version]
  69. Fushuai, W.; Ruichao, X.; Wenxia, C. Research on the Impact of Financial Development on TFP—DEA-Malmquist Index and Hansen Threshold Model Based on Panel Data of Shandong Province, China. J. Financ. Res. 2020, 2, 71–79. [Google Scholar] [CrossRef]
  70. Ren, X.; Shao, Q.; Zhong, R. Nexus between green finance, non-fossil energy use, and carbon intensity: Empirical evidence from China based on a vector error correction model. J. Clean. Prod. 2020, 277, 122844. [Google Scholar] [CrossRef]
  71. Jiang, L.; Wang, H.; Tong, A.; Hu, Z.; Duan, H.; Zhang, X.; Wang, Y. The Measurement of Green Finance Development Index and Its Poverty Reduction Effect: Dynamic Panel Analysis Based on Improved Entropy Method. Discret. Dyn. Nat. Soc. 2020, 2020, 8851684. [Google Scholar] [CrossRef]
  72. Wang, H.; Wang, M. Effects of technological innovation on energy efficiency in China: Evidence from dynamic panel of 284 cities. Sci. Total Environ. 2020, 709, 136172. [Google Scholar] [CrossRef]
  73. Zhang, Y.; Xing, C.; Tripe, D. Redistribution of China’s Green Credit Policy among Environment-Friendly Manufacturing Firms of Various Sizes: Do Banks Value Small and Medium-Sized Enterprises? Int. J. Environ. Res. Public Health 2021, 18, 33. [Google Scholar] [CrossRef]
  74. Pingkuo, L.; Huan, P.; Zhiwei, W. Orderly-synergistic development of power generation industry: A China’s case study based on evolutionary game model. Energy 2020, 211, 118632. [Google Scholar] [CrossRef]
  75. He, L.; Zhang, L.; Zhong, Z.; Wang, D.; Wang, F. Green credit, renewable energy investment and green economy development: Empirical analysis based on 150 listed companies of China. J. Clean. Prod. 2019, 208, 363–372. [Google Scholar] [CrossRef]
  76. Chen, Q.; Ning, B.; Pan, Y.; Xiao, J. Green finance and outward foreign direct investment: Evidence from a quasi-natural experiment of green insurance in China. Asia Pac. J. Manag. 2021, 1–26. [Google Scholar] [CrossRef]
  77. Huang, L.; Zhao, X. Impact of financial development on trade-embodied carbon dioxide emissions: Evidence from 30 provinces in China. J. Clean. Prod. 2018, 198, 721–736. [Google Scholar] [CrossRef]
  78. Zhao, J.; Shahbaz, M.; Dong, X.; Dong, K. How does financial risk affect global CO2 emissions? The role of technological innovation. Technol. Forecast. Soc. Chang. 2021, 168, 120751. [Google Scholar] [CrossRef]
  79. Song, Y.; Zhang, J.; Song, Y.; Fan, X.; Zhu, Y.; Zhang, C. Can industry-university-research collaborative innovation efficiency reduce carbon emissions? Technol. Forecast. Soc. Chang. 2020, 157, 120094. [Google Scholar] [CrossRef]
  80. Xu, R.; Lin, B. Why are there large regional differences in CO2 emissions? Evidence from China’s manufacturing industry. J. Clean. Prod. 2017, 140, 1330–1343. [Google Scholar] [CrossRef]
  81. Elahi, E.; Khalid, Z.; Tauni, M.Z.; Zhang, H.; Lirong, X. Extreme weather events risk to crop-production and the adaptation of innovative management strategies to mitigate the risk: A retrospective survey of rural Punjab, Pakistan. Technovation 2021, 3, 102255. [Google Scholar] [CrossRef]
  82. Elahi, E.; Zhang, H.; Lirong, X.; Khalid, Z.; Xu, H. Understanding cognitive and socio-psychological factors determining farmers’ intentions to use improved grassland: Implications of land use policy for sustainable pasture production. Land Use Policy 2021, 102, 105250. [Google Scholar] [CrossRef]
  83. Elahi, E.; Weijun, C.; Zhang, H.; Abid, M. Use of artificial neural networks to rescue agrochemical-based health hazards: A resource optimisation method for cleaner crop production. J. Clean. Prod. 2019, 238, 117900. [Google Scholar] [CrossRef]
  84. Elahi, E.; Weijun, C.; Zhang, H.; Nazeer, M. Agricultural intensification and damages to human health in relation to agrochemicals: Application of artificial intelligence. Land Use Policy 2019, 83, 461–474. [Google Scholar] [CrossRef]
  85. Elahi, E.; Abid, M.; Zhang, H.; Weijun, C.; Hasson, S.U. Domestic water buffaloes: Access to surface water, disease prevalence and associated economic losses. Prev. Vet. Med. 2018, 154, 102–112. [Google Scholar] [CrossRef]
  86. Elahi, E.; Zhang, L.; Abid, M.; Javed, M.T.; Xinru, H. Direct and indirect effects of wastewater use and herd environment on the occurrence of animal diseases and animal health in Pakistan. Environ. Sci. Pollut. Res. 2017, 3, 1–14. [Google Scholar] [CrossRef]
  87. Xie, T.; Liu, J. How does green credit affect China’s green economy growth. China Popul. Resour. Environ. 2019, 29, 83–90. [Google Scholar]
  88. Elahi, E.; Khalid, Z.; Weijun, C.; Zhang, H. The public policy of agricultural land allotment to agrarians and its impact on crop productivity in Punjab province of Pakistan. Land Use Policy 2020, 90, 104324. [Google Scholar] [CrossRef]
  89. Lv, C.; Bian, B.; Lee, C.-C.; He, Z. Regional gap and the trend of green finance development in China. Energy Econ. 2021, 102, 105476. [Google Scholar] [CrossRef]
  90. Zhang, Y.-J. The impact of financial development on carbon emissions: An empirical analysis in China. Energy Policy 2011, 39, 2197–2203. [Google Scholar] [CrossRef]
  91. Lin, S.-J.; Beidari, M.; Lewis, C. Energy consumption trends and decoupling effects between carbon dioxide and gross domestic product in South Africa. Aerosol Air Qual. Res. 2015, 15, 2676–2687. [Google Scholar] [CrossRef] [Green Version]
  92. Qiu, S.; Wang, Z.; Liu, S. The policy outcomes of low-carbon city construction on urban green development: Evidence from a quasi-natural experiment conducted in China. Sustain. Cities Soc. 2021, 66, 102699. [Google Scholar] [CrossRef]
  93. Wu, H.; Xu, L.; Ren, S.; Hao, Y.; Yan, G. How do energy consumption and environmental regulation affect carbon emissions in China? New evidence from a dynamic threshold panel model. Resour. Policy 2020, 67, 101678. [Google Scholar] [CrossRef]
  94. Roodman, D. How to do xtabond2: An introduction to difference and system GMM in Stata. Stata J. 2009, 9, 86–136. [Google Scholar] [CrossRef] [Green Version]
  95. Zhou, X.; Tang, X.; Zhang, R. Impact of green finance on economic development and environmental quality: A study based on provincial panel data from China. Environ. Sci. Pollut. Res. 2020, 27, 19915–19932. [Google Scholar] [CrossRef]
  96. Zhang, X.; Wang, Y. How to reduce household carbon emissions: A review of experience and policy design considerations. Energy Policy 2017, 102, 116–124. [Google Scholar] [CrossRef]
  97. Fu, Y.; Hu, J.; Cao, X. Different sources of FDI, environmental regulation and green total factor productivity. J. Int. Trade 2018, 2018, 134–148. [Google Scholar]
  98. Li, C.; Liu, X.; Bai, X.; Umar, M. Financial development and environmental regulations: The two pillars of green transformation in China. Int. J. Environ. Res. Public Health 2020, 17, 9242. [Google Scholar] [CrossRef]
  99. Dong, S.; Xu, L.; McIver, R. China’s financial sector sustainability and “green finance” disclosures. Sustain. Account. Manag. Policy J. 2020, 12, 353–384. [Google Scholar] [CrossRef]
  100. Pandey, R.; Sane, R. Financing Biodiversity: The Role of Financial Institutions; Working Papers from National Institute of Public Finance and Policy; National Institute of Public Finance and Policy: New Delhi, India, 2019. [Google Scholar]
  101. Ho, V.H. Beyond regulation: A comparative look at state-centric corporate social responsibility and the law in China. Vand. J. Transnat’l L. 2013, 46, 375. [Google Scholar]
  102. Lovins, L.H.; Cohen, B. Climate Capitalism: Capitalism in the Age of Climate Change; Hill and Wang: New York, NY, USA, 2011. [Google Scholar]
  103. Butnaru, G.I.; Haller, A.-P.; Clipa, R.I.; Ștefănică, M.; Ifrim, M. The Nexus Between Convergence of Conventional and Renewable Energy Consumption in the Present European Union States. Explorative Study on Parametric and Semi-Parametric Methods. Energies 2020, 13, 5272. [Google Scholar] [CrossRef]
  104. Elahi, E.; Abid, M.; Zhang, L.; Ul Haq, S.; Sahito, J.G.M. Agricultural advisory and financial services; farm level access, outreach and impact in a mixed cropping district of Punjab, Pakistan. Land Use Policy 2018, 71, 249–260. [Google Scholar] [CrossRef]
Figure 1. The theoretical mechanism for reduction of CO2 emissions with the perspective of green finance.
Sustainability 13 13014 g001
Figure 2. Theoretical mechanism analysis of the reduction of CO2 emissions—adjusted by environmental regulation.
Sustainability 13 13014 g002
Table 1. Basic statistics.
VariablesSamplesAverageStandard DeviationMinimumMaximum
CRI16380.1760.8690.00023.149
GFC163810.00915.9540.093264.394
GVC16382.7665.4320.00094.584
GFI16385.0793.4710.30032.995
FICI16387.4441.7021.49013.705
R&D163811.73019.7470.003260.117
IS16381.1123.8110.011105.993
FS1638632.646667.89614.8006813.760
Table 2. Empirical analysis of the CO2 emission reduction effects of green finance without environmental regulation.
Dependent Variable: lnCRIEquation (1)Equation (2)Equation (3)
lnCRI(−1)0.029 (1.62)0.086 *** (3.78)0.181 *** (7.35)
lnGFC−0.585 *** (−21.91)−0.125 *** (−5.06)
lnGVC−0.263 *** (−8.69) −0.119 *** (−7.56)
lnGFI −0.841 *** (−5.49)−0.720 *** (−7.21)
(lnGFC) (lnGVC)−0.064 (−2.66)
(lnGFC) (lnGFI) −0.232 *** (−4.97)
(lnGVC) (lnGFI) −0.222 *** (−7.31)
lnFICI0.210 *** (8.19)−0.686 *** (−3.27)0.277 *** (7.96)
lnR&D−0.245 *** (−36.68)−0.416 *** (−24.10)−0.249 *** (−17.92)
lnIS1.613 *** (68.44)1.274 *** (52.67)1.353 *** (43.62)
lnFS−0.034 (−1.48)0.223 * (1.67)−0.321 *** (−13.00)
Constant Term−8.561 *** (−47.47)−6.249 *** (−32.68)−6.287 *** (−25.71)
* and *** indicate the significance of parameters at 10% and 1%, respectively. t-values are given parentheses.
Table 3. Robustness test of CO2 emission reduction effect of green finance without environmental regulation.
Dependent Variable: lnCRIEquation (1)Equation (2)Equation (3)
lnCRI(−1)0.037 ** (2.40)0.001 (0.06)0.200 *** (7.21)
lnGFC−0.512 *** (−20.01)−0.462 *** (−19.41)
lnGVC−0.063 *** (−3.35) −0.082 *** (−5.14)
lnGFI −0.444 *** (−7.62)−0.419 *** (−5.20)
(lnGFC) (lnGVC)0.035 (8.88)
(lnGFC) (lnGFI) −0.487 *** (−4.57)
(lnGVC) (lnGFI) −0.090 *** (−2.36)
lnFICI0.066 (1.11)0.256 *** (3.48)0.144 ** (2.43)
lnR&D−0.245 *** (−19.97)−0.320 *** (−43.08)−0.196 *** (−6.84)
lnIS1.273 *** (33.10)1.322 *** (42.92)1.397 *** (30.92)
lnFS−0.301 *** (−12.26)−0.336 *** (−5.54)−0.200 *** (−3.47)
Constant Term−5.225 *** (−23.79)−5.972 *** (−19.56)−6.837 *** (−15.99)
** and *** indicate the significance of parameters at 5% and 1%, respectively. t-values are given parentheses.
Table 4. Empirical analysis of carbon emission reduction in green finance under strong environmental regulation.
Dependent Variable: lnCRIEquation (1)Equation (2)Equation (3)
lnCRI(−1)0.004 (0.11)0.142 *** (2.95)0.091 ** (2.19)
lnGFC−0.398 *** (−16.44)−0.617 *** (−14.60)
lnGVC−0.135 *** (−6.67) −0.177 *** (−5.89)
lnGFI 0.092 *** (1.00)0.335 *** (5.26)
(lnGFC) (lnGVC)0.005 (1.11)
(lnGFC) (lnGFI) 0.192 *** (5.66)
(lnGVC) (lnGFI) 0.083 *** (9.66)
lnFICI0.030 (1.18)0.550 *** (5.33)−0.242 *** (−2.73)
lnR&D−0.253 *** (−25.82)−0.237 *** (−13.67)−0.379 *** (−23.69)
lnIS1.582 *** (51.89)1.403 *** (23.43)1.284 *** (23.76)
lnFS−0.082 *** (−5.02)−0.474 *** (−7.38)−0.137 ** (−2.42)
Constant Term−8.195 *** (−27.65)−6.014 *** (−16.94)−5.881 *** (−16.53)
** and *** indicate the significance of parameters at 5% and 1%, respectively. t-values are given parentheses.
Table 5. Empirical analysis of carbon emission reduction in green finance under weak environmental regulation.
Dependent Variable: lnCRIEquation (1)Equation (2)Equation (3)
lnCRI(−1)0.091 *** (7.37)0.128 *** (9.09)0.085 *** (7.17)
lnGFC−0.358 *** (−5.32)−0.436 *** (−4.32)
lnGVC−0.207 *** (−3.89) −0.175 *** (−2.30)
lnGFI −0.450 ** (−1.85)−0.144 ** (−1.21)
(lnGFC) (lnGVC)0.002 (0.13)
(lnGFC) (lnGFI) −0.042 ** (−0.95)
(lnGVC) (lnGFI) −0.008 ** (−0.11)
lnFICI0.744 *** (5.04)1.657 *** (7.61)0.405 ** (2.24)
lnR&D−0.196 *** (−8.10)−0.183 *** (−6.59)−0.247 *** (−8.46)
lnIS1.590 *** (39.07)1.534 *** (37.15)1.536 *** (34.93)
lnFS−0.164 *** (−4.88)−0.670 *** (−5.43)−0.263 ** (−2.48)
Constant Term−8.871 *** (−37.33)−7.894 *** (−14.26)−7.777 *** (−20.66)
** and *** indicate the significance of parameters at 5% and 1%, respectively. t-values are given parentheses.
Table 6. Robustness test of the CO2 emission reduction effect of green finance under environmental regulation.
Dependent Variable: lnCRIStrong RegulationWeak Regulation
Equation (2)Equation (3)Equation (2)Equation (3)
lnCRI(−1)−0.078 ** (−2.21)0.143 *** (3.74)0.090 (8.05)0.096 *** (8.07)
lnGFC−0.378 *** (−14.44) −0.875 *** (−4.83)
lnGVC −0.174 *** (−3.00) −0.382 *** (−6.49)
lnGFI0.444 *** (6.24)0.321 *** (4.17)−0.327 ** (−2.54)−0.106 ** (−0.42)
lnGFC·lnGFI0.418 *** (4.10) −0.427 ** (−2.47)
lnGVC·lnGFI 0.079 *** (0.72) −0.032 ** (−0.87)
lnFICI−0.574 *** (−5.80)−0.178 * (−1.68)1.174 (6.07)0.97 *** (4.75)
lnR&D−0.306 *** (−25.62)−0.203 *** (−13.68)−0.166 (−6.89)−0.140 *** (−5.05)
lnIS1.653 *** (35.97)1.451 ** (30.52)1.628 (46.44)1.665 *** (42.44)
lnFS0.293 *** (4.29)0.059 (0.86)−0.465 (−3.89)−0.403 *** (−3.67)
Constant Term−9.114 *** (−30.52)−7.496 *** (−25.14)−8.557 (−27.92)−8.558 *** (−18.54)
*, **, and *** indicate the significance of parameters at 10%, 5%, and 1%, respectively. t-values are given parentheses.
Publisher’s Note: MDPI stays neutral with regard to jurisdictional claims in published maps and institutional affiliations.

