Article

Using Fuzzy AHP-PROMETHEE for Market Risk Assessment of New-Build River Cruises on the Yangtze River

1
School of Transportation and Logistics Engineering, Wuhan University of Technology, Wuhan 430063, China
2
National Engineering Research Center for Water Transport Safety, Wuhan University of Technology, Wuhan 430063, China
3
Shanghai Waigaoqiao Shipbuilding Co., Ltd., Shanghai 200000, China
*
Author to whom correspondence should be addressed.
Sustainability 2021, 13(22), 12932; https://doi.org/10.3390/su132212932
Submission received: 22 September 2021 / Revised: 15 November 2021 / Accepted: 16 November 2021 / Published: 22 November 2021

Abstract

:
Cruise tourism on the Yangtze River Basin has developed rapidly in recent years. However, it is still facing such challenges as homogenization of itinerary and shore attraction arrangement, as well as aging cruise ships and simplification of service facilities, while it is also difficult to satisfy hierarchical and personalized tourist needs. To change such circumstances, new-build river cruise ships are inevitable. Complexity of market supply and demand environment, together with variability of tourist preferences, have increased market uncertainties of new-build cruise products. This study aims to assess market risks of new-build river cruise ships first by identifying risk factors, from the perspective of supply and demand under the actual conditions of the Yangtze River cruise market, then by evaluating potential impacts, caused by risk factors based on multi-criteria decision-making considerations. Fuzzy AHP-PROMETHEE was employed to prioritize the risk factors. The results reveal that among the most significant market risk factors are the following, in sequence: backwardness of support facilities; sudden security crisis; homogenization of cruise products; simplification of tourism route design; and inadequate management of the tourism market. Such findings will provide beneficial insights for strategic and sustainable development of river cruises on the Yangtze River.

1. Introduction

River cruise tourism on the Yangtze River has been greatly developed in the last decade. River cruise ships in operation are increasing every year and exceeded 50 in 2018. Cruise tourists have doubled in the past decade and were more than 600,000 in 2018. Yangtze River cruise tourism, showing high-quality development trends of route extension, product integration and cruise ship luxury, puts forward higher requirements for cruise product design, content operation and resource integration [1]. However, products in the market are highly homogenized, resulting in vicious low-price competition and an inability to meet the multi-level and diversified needs of tourists. Moreover, quantity, product design and service of river cruises on the Yangtze River are inferior to river cruises abroad, showing the significant gap in the product structure. To sum up, contradiction between supply and demand of cruise products, the need for further improvement of cruise product quality and favorable development space are the current conditions of river cruises on the Yangtze River. Building new river cruise ships is necessary to meet the increasing needs of tourists, shorten the gap between domestic river cruises and those abroad, and attract more tourists to travel the Yangtze River on board a cruise.
Normally, new products or projects will face internal and external risks in the market, such as competition risks, product quality and variance risks, management risks and external environmental risks [2]. Due to the high value of cruise products as well as long-term and large investment characteristics, any form of risk in the market can adversely affect cruise performance and cause losses. Furthermore, the impact will be passed onto the development of the whole cruise industry. For example, sudden safety and security crisis events are not conducive to tourist safety, but exert long-term impact on cruise industry and resident travel demand. The “Oriental Star” shipwreck incident in 2015 caused the cruise industry to experience a low ebb in 2017. The COVID-19 pandemic that occurred in 2020 can also pose an uncertain negative impact on river cruises. Therefore, facing such challenges in the river cruise market, the planning to build a new river cruise into the market should analyze the related risks such as consumer demand risks, market entry risks, service risks, pricing risks, and marketing risks as product development is oriented toward consumer demand [3]. It can be considered that the market risk of products mainly comes from the uncertainty of market demand and consumer preference.
Among methods applied to assess market risk, those commonly used include value at risk method (VAR) [4], neural network model [5], analytic hierarchy process (AHP) and fuzzy synthetic evaluation method [6].These methods show their respective applicability and limitations under many circumstances in practical applications. For instance, AHP tends to make errors in evaluation with respect to too many indicators and is therefore not competent to deal with uncertain data, leading to irrational results, while the neural network method requires much quantitative data. In addition, current research on consequences of product market risk usually focuses on a single dimension such as performance. This will not provide enough information for decision making considering the complexity of the river cruise market.
Based on the above analysis, this paper aims to solve the following four problems to reach two objectives: one is to determine the parameters of the risks related with new building related to river cruises; the other is to develop a combined method for risk assessment to give a strategic support for river cruise industry.
  • What situation is the river cruise ship market on the Yangtze River?
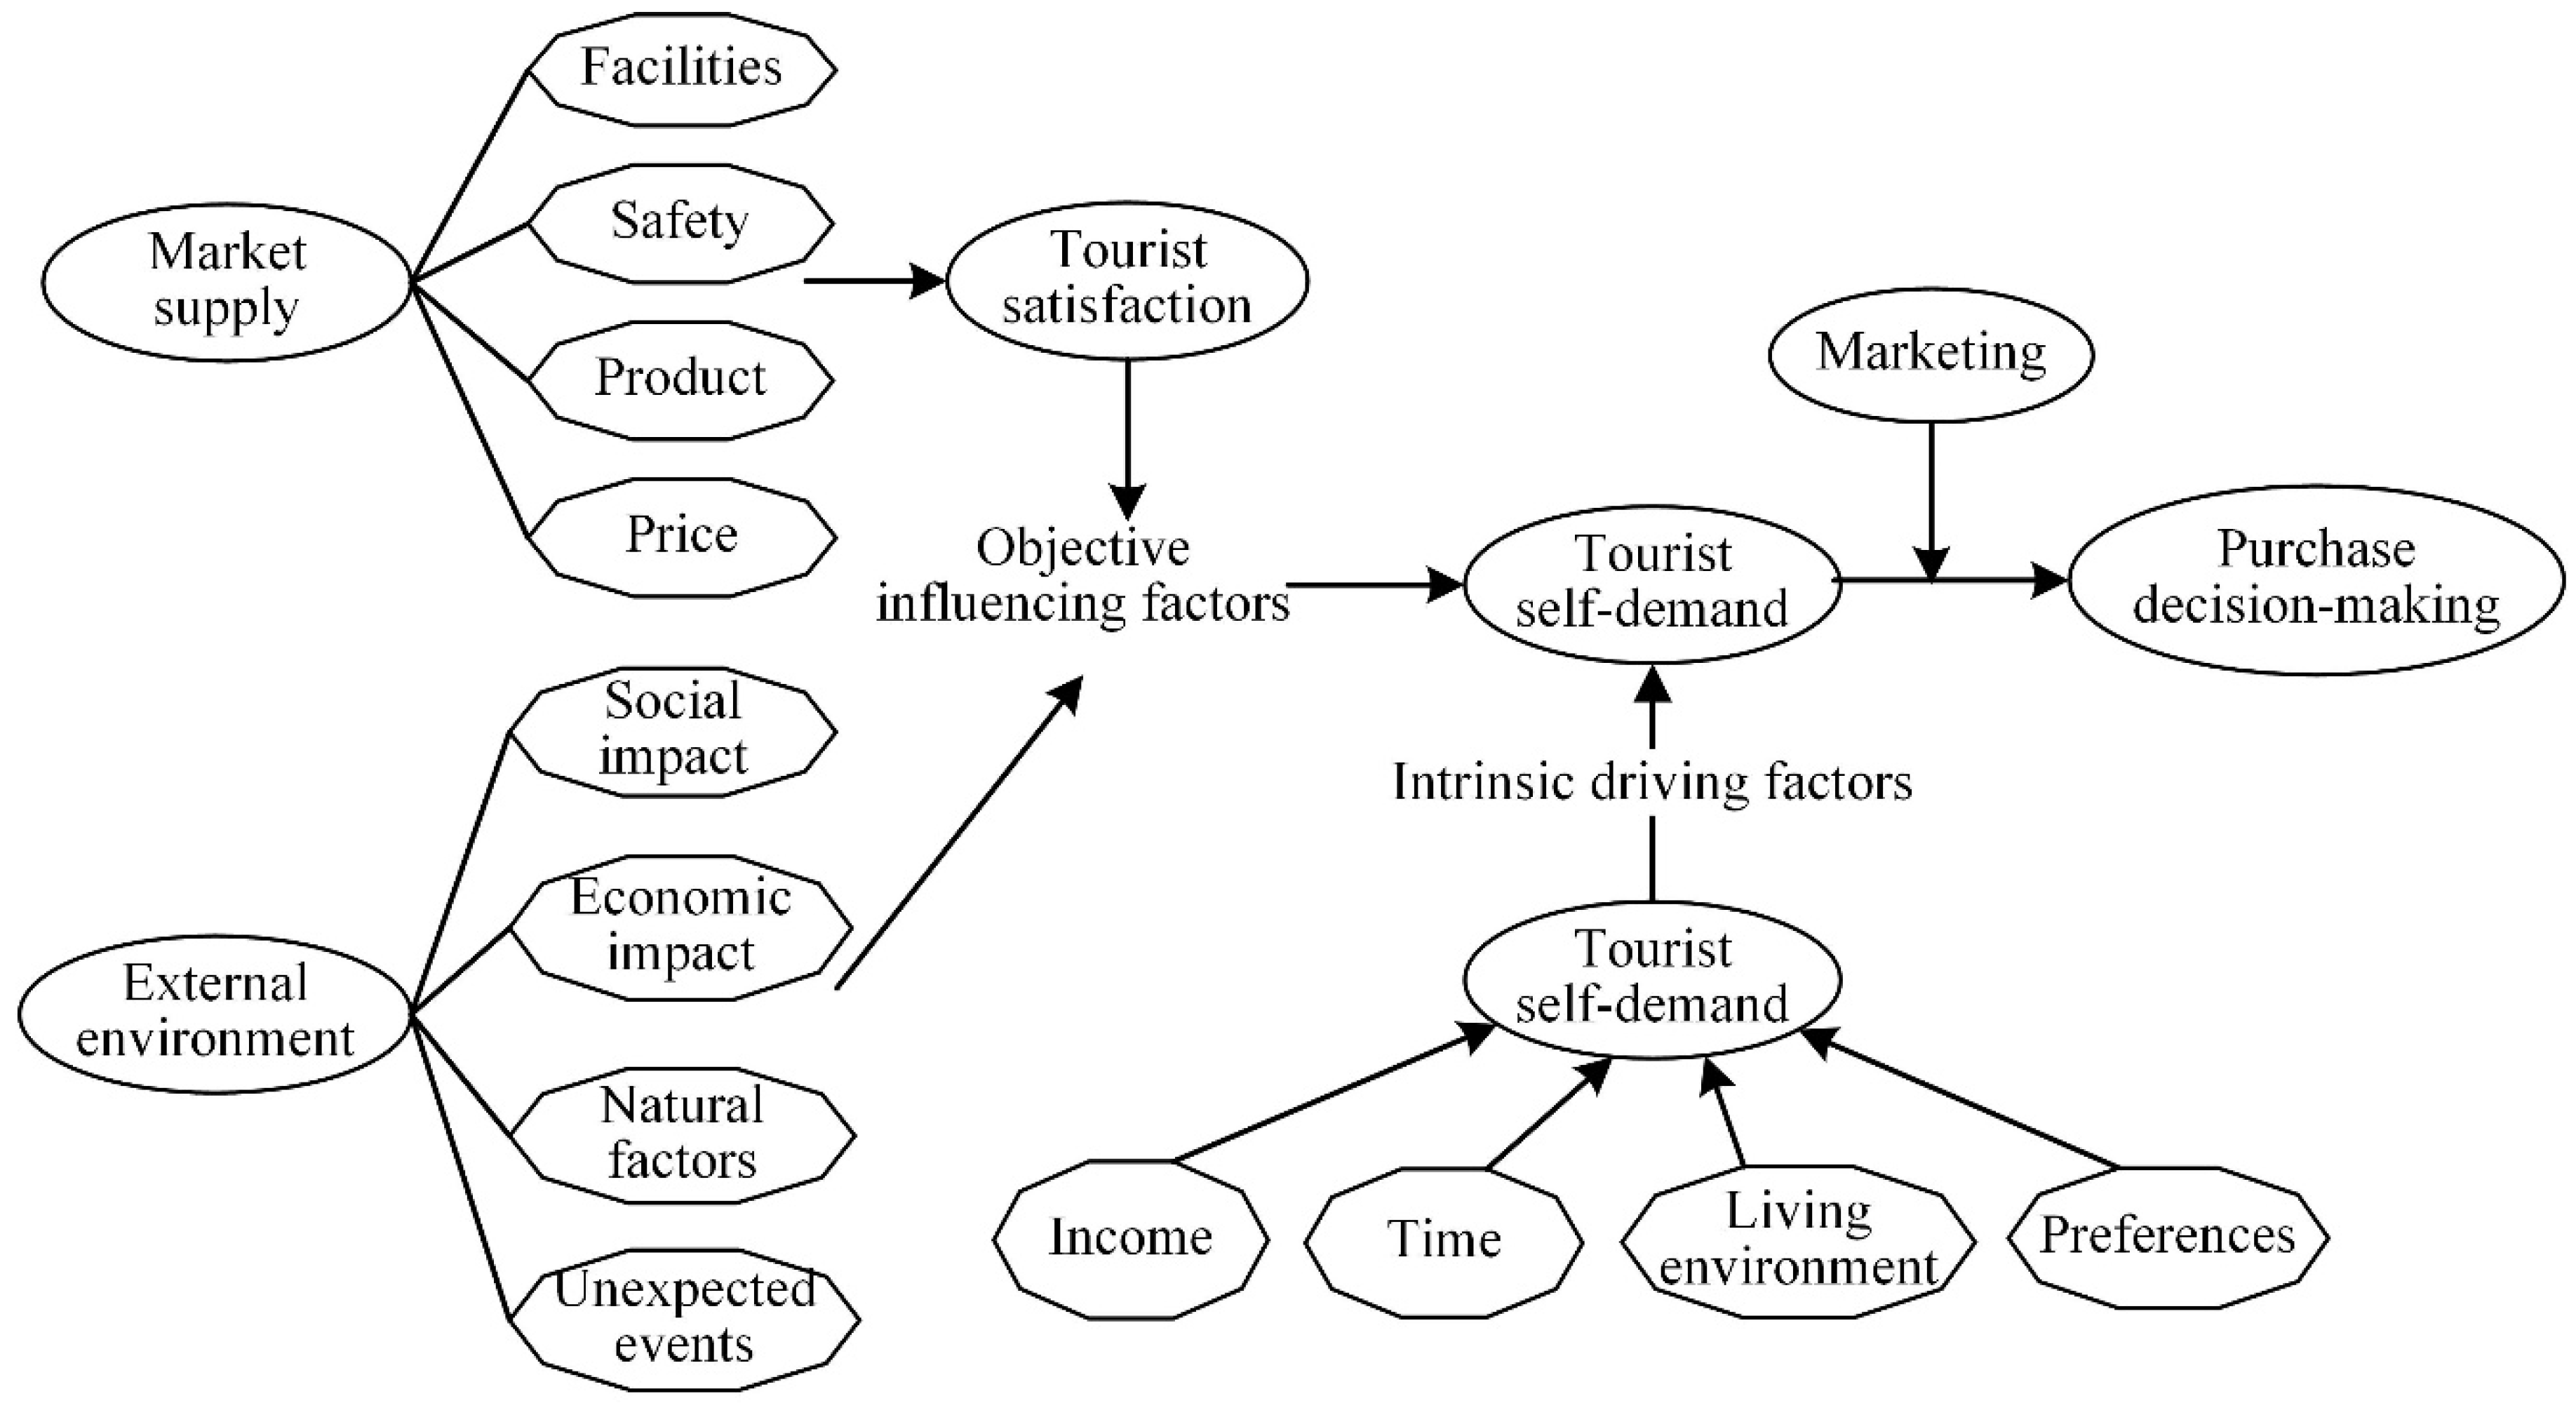
  • How to identify market risks of new-build river cruises from the perspective of consumer demand?
  • How to formulate a rational evaluation criteria framework to represent possible impact of risk factors from different perspectives?
  • How to choose and establish an appropriate risk assessment model to determine risk level?
This paper first summarizes risk factors through analyzing the market supply and demand situation as well as the factors influencing tourist decision-making; thus, this paper establishes a complete risk index system, combined with practical circumstances, of the river cruise market on the Yangtze River. We then utilize five criteria to better show potential impacts caused by risk factors, including impacts on the following: the long-term development of the market, the consistency of supply and demand in the market, tourist safety, tourist decision-making; and degrees of risk control. Therefore, judging risk value of each risk factor based on diverse aspects is transformed into a multi-criteria decision-making problem. Subsequently, a fuzzy-PROMETHEE evaluation method based on multi-criteria decision making was proposed. This method can effectively solve the problem of insufficient quantitative data and uncertain data, and can evaluate the risks from multiple aspects under the perspective of objectively considering the preferences of decision makers, so as to obtain accurate results. This study provides a reference for formulating rational risk control suggestions, as well as a novel way of evaluating market risks. These results and strategies are beneficial for the better operation of new-build river cruise ships and for the effective development of the river cruise industry.
After the introduction, Section 2 mainly reviews the relevant literature and then highlights the research gap. Section 3 presents the approach and steps to conduct the risk assessment of river cruise new-build. Section 4 identifies risk factors considering practical problems in the cruise market of the Yangtze River, as well as determines the risk evaluation criteria and reveals steps for conducting a market risk assessment. Section 5 obtains original ranking of risk factors and the results discussion follows a sensitivity analysis. The main work is concluded in Section 6.

2. Literature Review

2.1. Tourist Preference

New-build river cruise ships provide new products in the market. Whether tourists buy or repeatedly buy a product or service depends on their satisfaction, recognition, loyalty, actual demand and motivation relative to the product. Understanding the intention of tourists to make a purchase is conducive to reasonable marketing and is of great significance to avoiding market risks. With the rapid development of tourism, numerous studies have been carried out on tourist decision-making behavior. This part mainly explores this from the aspects of tourist satisfaction, loyalty, tourism motivation and demand.
Pritchard and Howard [7] believed that highly loyal customers will repeatedly buy a certain product or service and have a positive market impact. Lim and Lee [8] described loyalty as the level of commitment of the customer to purchase preferred product or service. Loyalty is also easily influenced, a conclusion through a survey of tourists that tourist satisfaction and service quality are important factors to determine tourist loyalty [9]. Moreover, tourist satisfaction with the trip and their views on safety, service and environment will also significantly increase their loyalty intention [10].
In addition, the probability of cruise passengers revisiting the cruise port destination depends to a large extent on their travel experience and satisfaction [11]. Some relevant studies make a detailed analysis on tourist satisfaction and travel decision making. Anderson, Fornell, and Lehmann [12] described satisfaction as overall evaluation of the products or services purchased based on previous experience. Chen and Chen [13] further defined cruise experience satisfaction as tourist overall satisfaction with the experience while riding on cruises. Teye and Leclerc [14], taking North American cruise tourists as study subjects, revealed factors affecting tourist satisfaction can be attributed to subjective factors of tourist expectations and objective factors of cruise products and services, including facilities, service level and price. Han et al. [15] believed satisfaction of cruise tourists with itineraries will bring benefits to cruise companies, such as word-of-mouth recommendation, image-building, revisits and profit increases. Accordingly, Castillo-Manzano and López-Valpuesta [16] analyzed the comment data of 105,000 tourists under different cruise brands and determined that tourist satisfaction is related to their service experience, cruise products and self-travel motivation. Wu et al. [17] revealed the higher the perceived experience quality and satisfaction of cruise tourists, the higher the perceived trust. Bayih and Singh [18] further stated the improvement of social and psychological driving forces leads to higher tourist satisfaction, and the stronger the tourist motivation, the higher the overall satisfaction with the destination and the willingness to revisit.
Consumer preference for decision-making is also subjected to their motivation; Jones [19] obtained information about cruise tourists through a questionnaire and believes tourist motivation influences their decision to cruise. In addition, the most influential motivations for cruisers were the ability to both mentally and physically relax, to discover new places and things, and to avoid the hustle and bustle of daily life. Hung and Petrick [20] combined online surveying with the cruise motivation scale, established according to steps recommended by Churchill, and concluded that cruise motivation had a positive impact on tourism intention; they also posited that it is necessary to carry out reasonable marketing in the cruise industry. Finally, some studies summarize various factors that affect cruise tourism motivation as the following: quality, value and satisfaction [21]; familiarity and social influence [22]; and emotional factors and price sensitivity.
Previous research results adequately represent that cruise passenger satisfaction with their itinerary, which indirectly influences recommended or revisited travel, is determined by facilities, environment, safety, service, and price level, which itself affects the probability of recommendations and revisits to a great extent. Meanwhile, cruise tourism motivation that depends on social influence, emotional factors, price, perceived quality and satisfaction has an important influence on travel decision making. Therefore, the cruise market ought to provide products and services that meet the needs of different types of tourists, combined with necessary marketing methods, and equipped with a safe and comfortable environment, in order to enhance tourist awareness of cruise tourism and attract them to travel. The specific influencing factors of tourist decision making can be summarized as Figure 1.

2.2. Fuzzy MCDA Methods

2.2.1. MCDA Methods

Multi-criteria decision making (MCDA) is a discipline of operations research. It utilizes statistical principles, operations research methods and optimization theory according to preferences of decision makers (DMs) to rank solutions from the best to the worst under a number of conflicting criteria [23]. In the practical application of the MCDA method, it contains four main areas, namely, alternatives to be evaluated, criteria based on which alternatives are evaluated, evaluation value of alternatives under each criterion and the relative weight of each evaluation criterion [24]. Decision making is everywhere in life, and numerous problems reveal multi-objective attributes because people often consider multiple goals when making decisions. After continuous research by scholars, a variety of classic MCDA methods have been established such as the Preference Ranking Organization Method for Enrichment Evaluations (PROMETHEE), the Vlsekriterijumska Optimizacija I Kompromisno Resenje (VIKOR) multi-criteria decision-making technique, the Technique for Order Preference by Similarity to Ideal Solution (TOPSIS), etc.; each method has corresponding advantages, disadvantages and applicability [25]. Since many systems in the real world contain uncertainty and fuzziness of information, MCDA methods are often combined with fuzzy theory in practical application to solve practical problems. Since then, the fuzzy MCDA methods have been widely used in solving problems of multi-objective optimal selection, such as supplier selection, site selection, etc. [26]. Krishankumar et al. [27] further analyzed from the perspective of language preference and used PROMETHEE method combined with intuitionistic fuzzy sets to rank suppliers, in which a LBA (language-based aggregation) operator was applied to aggregate group opinions in group decision making. Wu et al. [25] proposed a decision-making framework that combines triangular intuitionistic fuzzy numbers, network analysis method and PROMETHEE for coastal wind power project site selection. Empirical studies on comparative analysis and sensitivity analysis show that the proposed decision-making model is feasible and effective. Moreover, the MCDA method also shows applicability in risk assessment. The fact is that a necessary process for risk assessment is to evaluate identified risks and rank them. Generally speaking, risk evaluation will take several factors such as probability, severity (economy, life safety, etc.), and detectability of the risk into consideration. Thus, it can be learned that evaluation and ranking of risk factors under comprehensive consideration of multiple factors are subordinate to the MCDA problem. In corresponding practice, Mete et al. [28] used a method of combining Pythagorean fuzzy sets and VIKOR to implement risk assessment on occupational risk in natural gas pipeline construction, in which 69 hazards were identified and evaluated under four risk parameters, namely probability, severity, sensitivity to PPE non-utilization and undetectability. Similarly, Pham et al. [29] also conducted a flood risk assessment from the perspective of MCDA analysis. Up to the present, a multi-criteria decision making method (MCDA) has been widely adopted in risk assessment of diverse industries, such as disaster science [30], construction [31], transportation [32], supply chain [33], etc.
AS a kind of MCDA method, PROMETHEE has been widely used in solving circumstances with vagueness. The PROMETHEE method is capable of effectively resolving conflicts between standards. Moreover, PROMETHEE II does a good job of ranking all risk factors, which facilitates risk comparison and identification of risks requiring special attention. Researchers apply fuzzy PROMETHEE to provide application novelty, for instance, Mokrini applied PROMETHEE combined with fuzzy theory to the risk assessment of pharmaceutical supply chain, providing a broader research idea [34]. Although showing many advantages and wider application, this method is qualitatively expressed and usually depends on opinions and experience of decision-maker and does not provide a method to determine the weight of evaluation criteria, hence, easily to be misunderstood by the vagueness of linguistic terms. To cope with the above deficiencies, PROMETHEE are often combined with fuzzy theory and other methods to calculate the weight of criteria [35]. The authors introduce multiple selection criteria for military airport site selection, in which AHP is employed to determine the weight of criteria. Similarly, some scholars consider the utilization of AHP method when choosing the weight involved in some research problems [36,37].

2.2.2. Fuzzy Numbers

With the limitation of decision maker subjective judgment and incomplete cognition, it is difficult for decision makers to give exact numbers to make a judgement. The fuzzy set theory proposed by Zadeh is an effective method to deal with this situation. Chen [38] proposed a fuzzy evaluation method, using fuzzy numbers to evaluate weights of evaluation criteria and grade of evaluation scheme. Fuzzy logic combines linguistic knowledge and digital data systematically so that inaccurate information and uncertainty can be considered properly. Moreover, the concept of linguistic variables makes more sense through the use of fuzzy sets than concise numbers when dealing with complex situations [39]. From a methodological point of view, language rating can better deal with ambiguity and imprecision and can effectively convert language terms into fuzzy values in fuzzy theory [27]. After continuous innovation, fuzzy sets have also been continuously expanded. Based on fuzzy set theory proposed by Zadeh, Atanassov proposed the concept of intuitionistic fuzzy sets that takes three dimensions of membership, non-membership and hesitation into consideration, while traditional fuzzy set only considers the concepts of membership [40]. Based on this, intuitionistic fuzzy sets are more in line with the uncertain nature of objective events and shows flexibility in dealing with uncertainty. At present, intuitionistic fuzzy numbers are widely utilized in the fuzzy evaluation process of multi-criteria decision making. In order to compare and analyze the source function in multi-criteria decision making evaluation, Chen [41] proposed a method of introducing intuitionistic fuzzy sets. Chen [42] further innovated on the basis of intuitionistic fuzzy sets and proposed to use Interval-Valued Intuitionistic Fuzzy (IVIF) sets to deal with decision making problems. Wood [43] pointed out that in the face of varying degrees of uncertainty and subjectivity while evaluating multiple criteria, an effective method is to transform language terms into crisp and fuzzy numerical sets. In view of this, the authors combined the TOPSIS method with intuitionistic fuzzy numbers in the multi-criteria decision making technology. Cavallaro et al. [44] adopted an improved intuitionistic fuzzy technique to process quantitative and qualitative data, among which trigonometric fuzzy entropy was mentioned in the weight measurement.

2.3. Research Gap

From the above analysis, it can be learned that using fuzzy MCDA method to sort alternatives has universal applicability. This paper’s market risk assessment shows a common problem is the lack of objective risk data, while subjective and quantitative data is usually involved with human judgment, inevitably bringing uncertainty due to its vagueness and imprecision [45].
Another problem of product market risk assessment is the perspective of risk identification. New products are oriented by market demand that is constantly changing and easily affected by numerous factors. In this regard, identifying risks from the perspective of analyzing influencing factors in market or consumer demand is reasonable. Risk factors can affect tourist safety, cruise operations and the development of the cruise industry, which indicates risk evaluation cannot be defined solely as the severity of risk consequences, but involves MCDA considerations.
In view of this, a PROMETHEE-based risk assessment method is proposed to evaluate market risks under multi-criteria issues, in which the AHP method is used to determine the weight of evaluation criteria and intuitionistic fuzzy numbers to deal with difficulty in using numbers to quantitatively describe the impact of risk on evaluation criteria and take uncertainty in market environment into consideration. Moreover, PROMETHEE is introduced to rank risk factors with full consideration of preferences for DMs.

3. Methodology

3.1. Intuitionistic Fuzzy Numbers

Definition 1.
Let   X   be a nonempty classical set, thus an intuitionistic fuzzy set A ˜ can be described as follows:
A ˜ = { x , μ A ˜ ( x ) , υ A ˜ ( x ) | x X }
where μ A ˜ ( x ) [ 0 , 1 ] , ν A ˜ ( x ) [ 0 , 1 ] , and 0 μ A ˜ ( x ) + ν A ˜ ( x ) 1 ,   x X . The μ A ˜ ( x ) and ν A ˜ ( x ) are, respectively, the membership degree and non-membership degree of element x belonging to𝐴.
Definition 2.
Let α ˜ = ( μ α ˜ ,   ν α ˜ )represent an intuitionistic number. Thus, μ α   ˜ and ν α ˜ , respectively, represent the degree of membership and non-membership of x. And μ α ˜ [0, 1], ν α ˜ [0, 1], μ α ˜ + ν α ˜ 1 .
Definition 3.
Let α ˜   = ( μ α ˜ ,   ν α ˜ ), α ˜ 1 = ( μ α ˜ 1 ,   ν α ˜ 1 ) and α ˜ 2 = ( μ α ˜ 2 ,   ν α ˜ 2 ) represent three intuitionistic fuzzy numbers and λ be a real number. Then three arithmetical operations are described as follows:
  • α ˜ 1 α ˜ 2 = ( μ α ˜ 1 + μ α ˜ 2 μ α ˜ 1 μ α ˜ 2 ,   ν α ˜ 1 ν α ˜ 2 )
  • α ˜ 1 α ˜ 2 = ( μ α ˜ 1 μ α ˜ 2 , ν α ˜ 1 + ν α ˜ 2 ν α ˜ 1 ν α ˜ 2 )
  • λ α ˜ = ( 1 ( 1 μ α ˜ ) λ , ν α ˜ λ ) , λ > 0
Definition 4.
Let α ˜ i =   ( μ α ˜ i ,   ν α ˜ i ), ( i = 1 ,   2 , , n ) represent n intuitionistic fuzzy numbers, thus the following definition can be obtained.
IFWA ω ( α ˜ 1 ,   α ˜ 2 , , α ˜ n ) = ω 1 α ˜ 1 ω 2 α ˜ 2 ω n α ˜ n
where IFWA operator represents the intuitionistic fuzzy weighted average operator, ω = ( ω 1 ,   ω 2 , , ω n ) T is the weight vector of α ˜ i = ( μ α ˜ i ,   ν α ˜ i ) ( i = 1 ,   2 ,   , n ) and ω i   [ 0 ,   1 ]   ( i = 1 ,   2 , , n ) , i = 1 n ω i   = 1.
Moreover, if ω   = ( 1 / n ,   1 / n , , 1 / n ) T , the IFWA operator degenerates into the intuitionistic fuzzy average (IFA) operator.
IFA ( α ˜ 1 ,   α ˜ 2 , , α ˜ n ) = 1 n ( α ˜ 1 α ˜ 2 α ˜ n )
In order to make an accurate comparison of intuitionistic fuzzy numbers, Gao et al. [46] considered membership, non-membership, and hesitation to construct an improved score value formula for intuitionistic fuzzy numbers and in which introduced an exponential function. When it comes to existing scoring formulas of intuitionistic fuzzy numbers, the proposed formula is more comprehensive and can express information more accurately. The improved score value formula proposed by Gao et al. can be denoted as follows:
Definition 5.
Let α ˜ = ( μ α ˜ ,   ν α ˜ ) represent an intuitionistic fuzzy number. Then define the score value I ( α ˜ )   of α ˜ as follows:
I ( α ˜ ) = exp { μ α ˜ ν α ˜ + ( μ α ˜ ν α ˜ ) 3 π α ˜ } 1 + π α ˜
where μ α ˜ , ν α ˜ and π α ˜ ,   respectively, represent the degree of membership, non-membership and hesitation of x.

3.2. Determining the Weights of Criteria Using AHP

The Analytic Hierarchy Process (AHP) was proposed in the 1970s. As a combination of qualitative and quantitative methods, AHP quantifies the experience of decision-makers and decomposes complex issues into different levels. By expressing the subjective judgment of people in quantitative form, the experience of decision makers can be fully reflected in the decision-making process. The steps of AHP method to calculate indicator weight are defined as follows:
Step 1: Establish hierarchical structure of research problems and construct corresponding judgment matrix. The decision matrix is obtained by evaluating the importance of factors at the same level to a factor at the upper level and using the nine-point evaluation scale to quantify the evaluation results. Supposing A represents a certain factor at a level, and B i ( i = 1 , 2 , n ) represents the factor at the lower level. Thus, let a i j be the relative importance of B i to B j in the A factor. Thus, a judgement matrix B ( a i j ) n × n is defined as follows:
B = [ a 11 a 12 a 1 n a 21 a 22 a 2 n a n 1 a n 2 a n n ]
Step 2: Determine weights. Calculating the product M i of each row of data in judgement matrix. Taking B as the example, then the root V i of M i is calculated. Finally, the weight M i of each factor is obtained according to the feature vector V i .
M i = i = 1 n a i j ,   ( i = 1 , 2 , 3 , n )
V i = M i n
W i = V i i = 1 n V i  
Step 3: Consistency test. The consistency checking aims to clarify whether the decision maker has consistency when constructing the decision matrix; whether the judgment matrix needs to be re-adjusted depends on the calculated consistency indicator CI and consistency ratio CR. If CR is less than 0.1, the consistency test meets the requirements, otherwise the judgment Matrix needs to be modified until the requirements are met.
C I = λ m a x n n 1  
C R = C I R I
where λ m a x represents the largest characteristic root of the judgment matrix and it can be obtained by utilizing MATLAB. n refers to the order of the judgment matrix and RI varying with the order n , as Table 1 shows:

3.3. PROMETHEE Method

PROMETHEE is one of the MCDA methods. Proposed by Brans [47], it has been widely used in the banking industry, location selection, tourism, logistics, transportation and other fields to deal with problem of optimal selection with its mathematical nature and super applicability [48]. Compared with other methods, PROMETHEE takes the preferences of decision makers (DMs) into consideration through six preference function revealing DM attitudes and is suitable for risk ranking due to its simple calculation process. PROMETHEE provides a complete ranking of risk factors and the key in actual application is to determine the type and parameters of the preference function [49]. The steps of PROMETHEE for risk assessment are summarized as follows:
Step 1: Constructing an evaluation matrix g i j . Defining the set of risk factors as A i ( i = 1,2, m ), and evaluation indicators as B j ( j = 1 , 2 , n ) , thus g i j represents the evaluation value of each risk factor with respect to each evaluation criteria.
Step 2: Calculating the evaluation difference d j ( a ,   b ) ( a , b A ). The evaluation difference between risk factors under ach evaluation criteria is defined as follows:
d j ( a ,   b ) = g j ( a ) g j ( b )
where g j ( a ) and g j ( b ) , respectively, represent the evaluation value of risk factor with regard to certain criteria, and d j ( a ,   b ) shows the difference of evaluation value between a and b.
Step 3: Determining the preference functions. Preference function F j is determined by DMs with careful consideration of each evaluation criteria. Detailed definition is shown as follows:
P j ( a ,   b ) = F j ( d j ( a ,   b )   )
where P j ( a ,   b ) denotes the degree to which the risk level of factor a is higher than b with respect to evaluation criteria j as a function of d j ( a ,   b ) .
The smaller the value of preference function, the smaller the difference between risk factors; the higher the value, the opposite is the result. The closer the value is to 1, the influence of a on the evaluation criteria is higher than that of b . Considering the diversity of evaluation criteria and DM preference, PROMETHEE provides six types of preference functions with corresponding scope of application. The following are six kinds of preference functions:
  • Type 1: Usual criterion
P ( d )   = { 0 ,   d     0 1 ,   d   >   0
  • Type 2: U-shape criterion
P ( d )   = { 0 ,   d     q 1 ,   d   >   q
  • Type 3: V-shape criterion
P ( d )   = { 0 ,   d     0   d p ,   0   <   d     p 1 ,   d   >   p
  • Type 4: Level criterion
P ( d )   = { 0 ,   d     q 1 2 ,   q   <   d   p 1 ,   d   >   p
  • Type 5: V-shape with indifference criterion
P ( d )   = { 0 ,   d     q ( d p ) / ( p q ) ,   q   <   d     p 1 ,   d   >   p
  • Type 6: Gaussian criterion
P ( d )   = { 0 ,   d     0 1 e d 2 2 s 2 ,   d   >   0
Among above six preference functions, parameters p, q and s, respectively, represent the indifference, preference and Gaussian threshold and their value is determined by the decision maker.
Step 4: Determining multi-criteria preference index π ( a ,   b ) , which indicates the degree of influence that a takes precedence over b when comparing preference degree of any two risk factors with regard to all evaluation criteria; π ( b , a ) means the degree to which b is more important than a .
π ( a ,   b ) = j = 1 m P j ( a ,   b ) ω j    
π ( b , a ) = j = 1 m P j ( b , a ) ω j    
Moreover, 0 ≤ π ( a ,   b ) ≤ 1, and the closer π ( b , a ) is to 1, the more important a takes precedence over b with regard to a certain criterion.
Step 5: Calculating positive and negative flow of each risk factor.
Positive flow is shown as follows:
φ + ( a ) = 1 n 1 x A π ( a , x )
where φ + ( a ) indicates degree to which the influence of risk factor of a is better than that of all other risk factors in set A .
Negative flow is denoted as follows:
φ ( a ) = 1 n 1 x A π ( x , a )
where φ ( a ) represents influence degree of all other risk factors in set A is better than that of risk factor a .
Step 6: Calculating the net flow.
Net   flow   ( a ) = φ + ( a ) φ ( a )   ( a A )  
The larger φ + ( a ) is and the smaller φ ( a ) is, then ( a ) is larger which indicates the influence of risk factor is greater. Particularly, − 1 ( a ) 1.

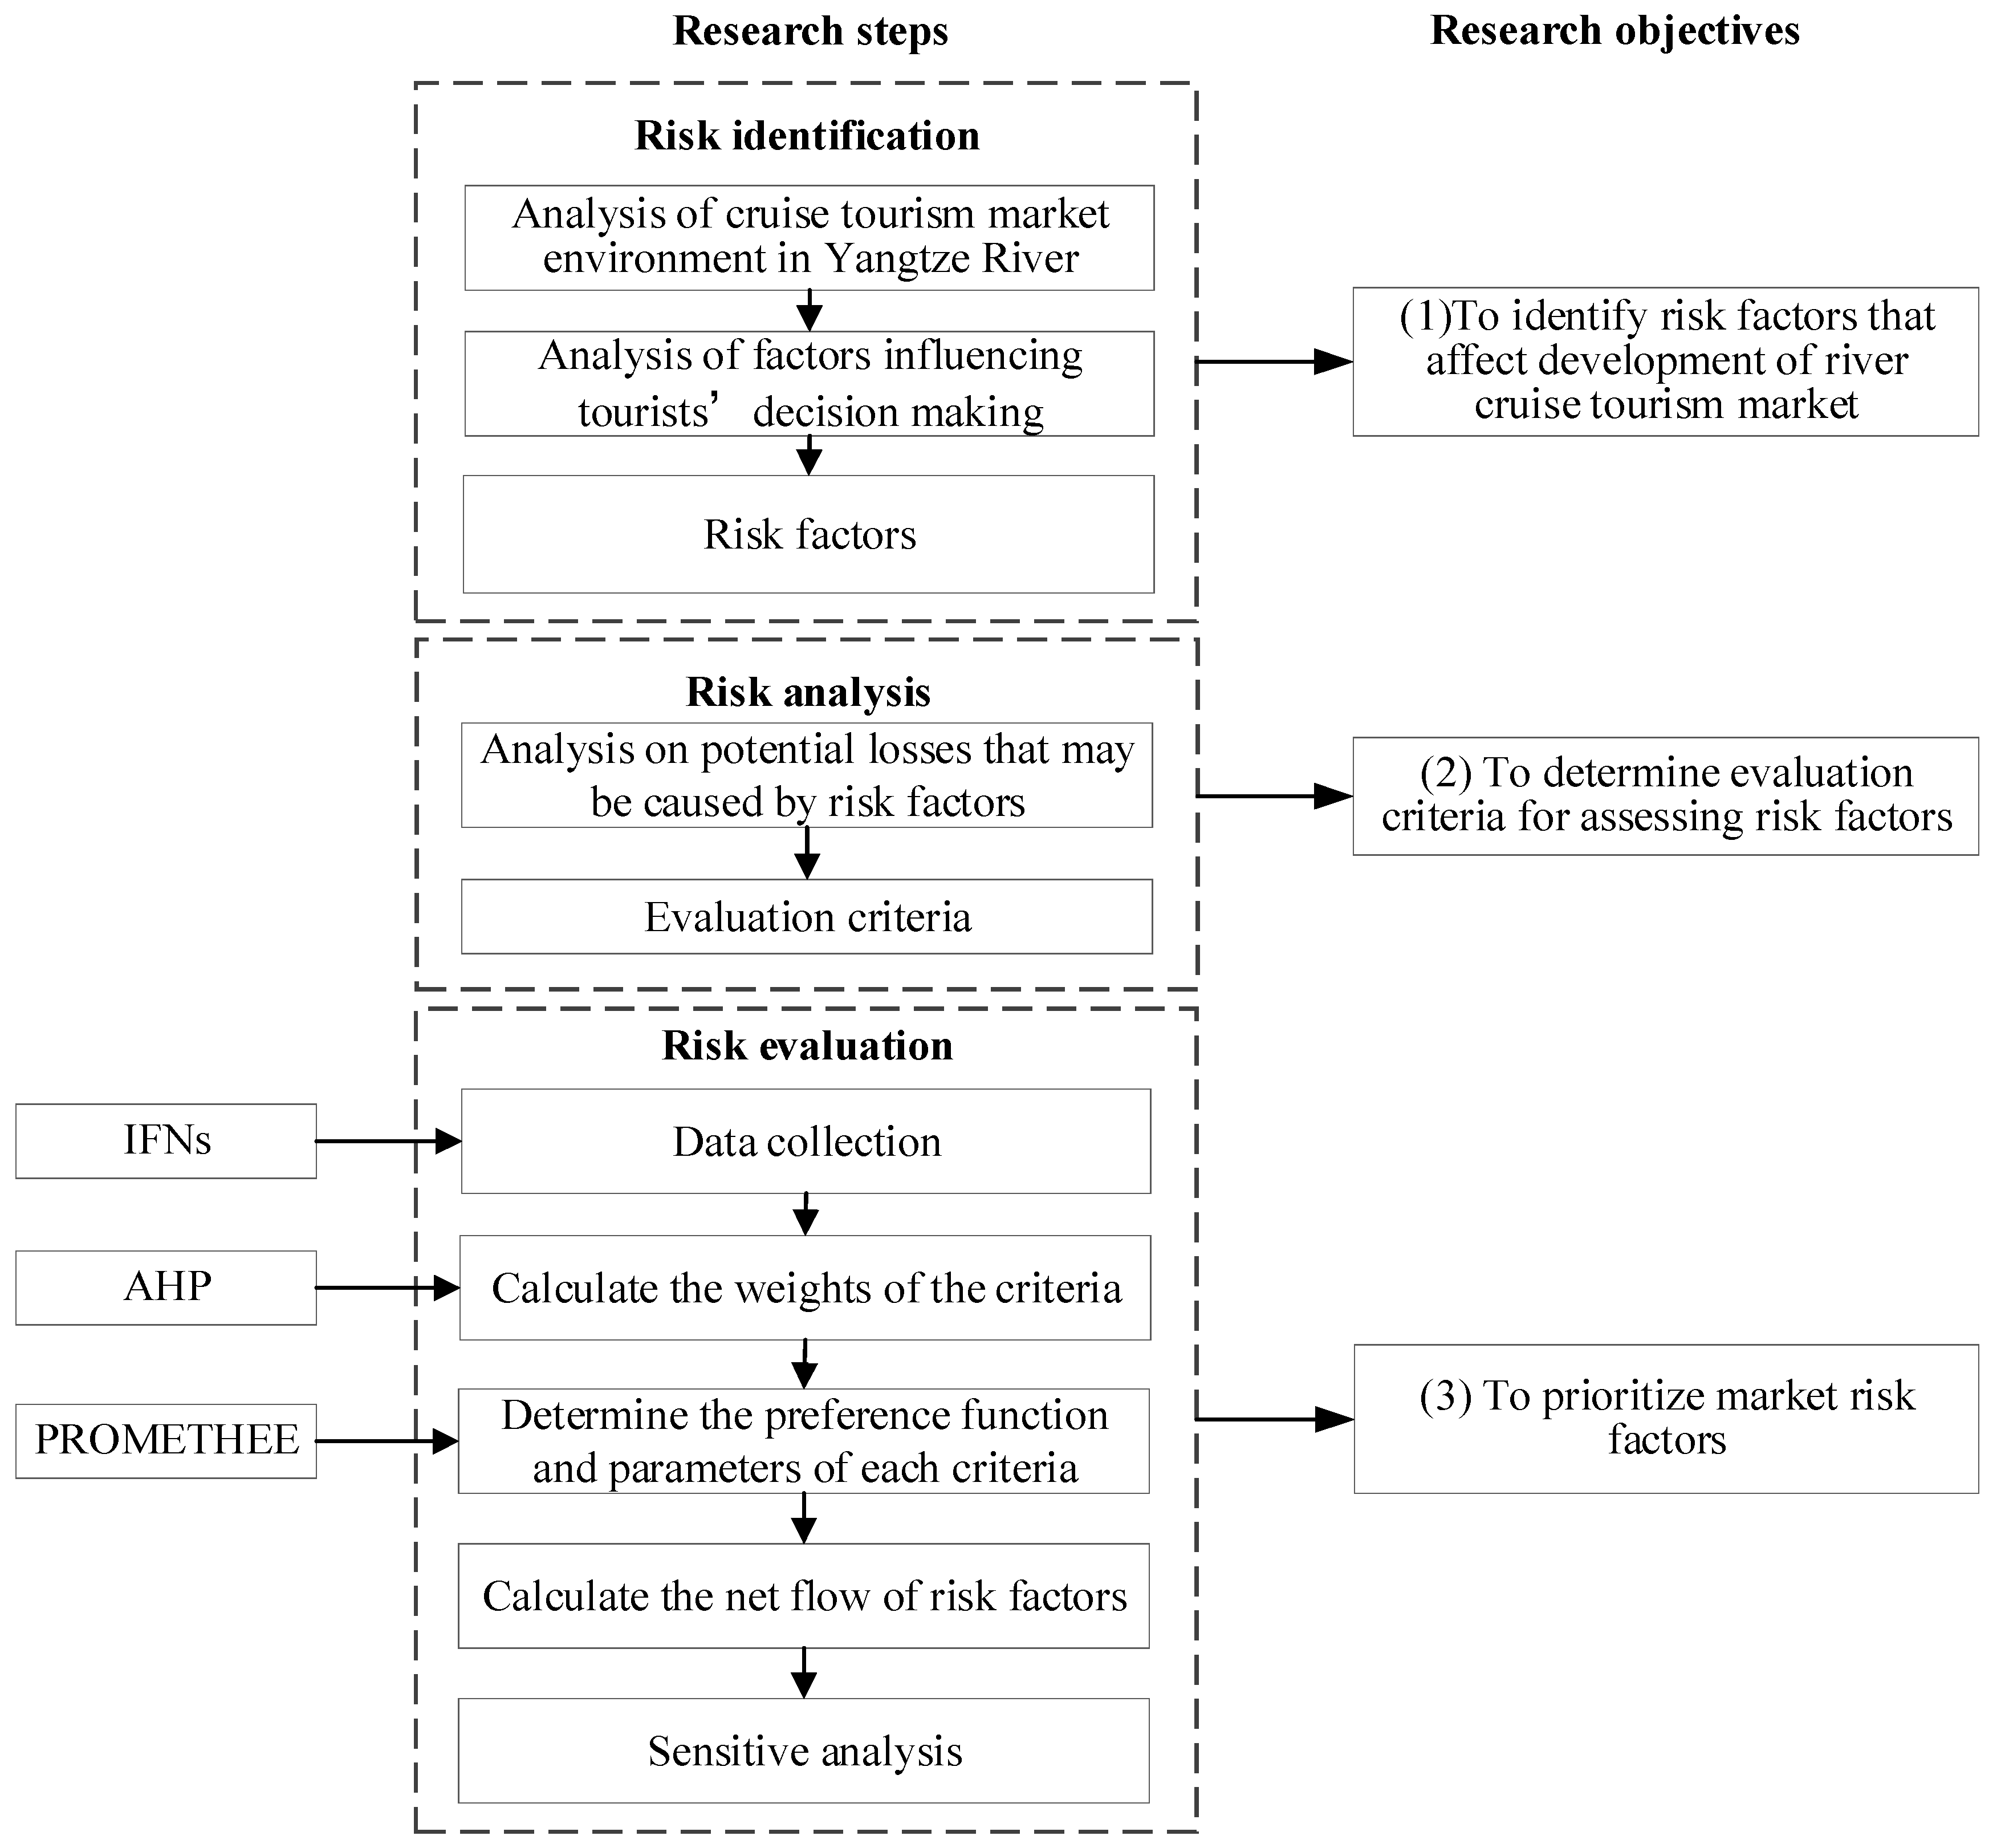
4. Risk Evaluation Framework of River Cruise New-Build

Generally, risk assessment includes three key steps, namely risk identification, risk analysis and risk evaluation. The intuitionistic fuzzy multi-criteria framework combines IFNs, AHP and PROMETHEE together for risk assessment. Correspondingly, the proposed framework can be divided into three main phases: risk identification, analysis and prioritization. The detailed description of each phase together with their corresponding steps is elaborated in Figure 2.

4.1. Risk Identification

The new-build river cruise ships represent the increase in market supply, meaning the necessity to attract tourists to buy new products and generate more market demand. Various factors such as services provided in the market together with external environment will affect demand. This study identifies risk factors based on the analysis of market environment; first, this study clarifies the situation of market supply and demand, then it discusses influencing factors in tourist decision-making and, finally, it summarizes market risk factors of new-build river cruise ships.

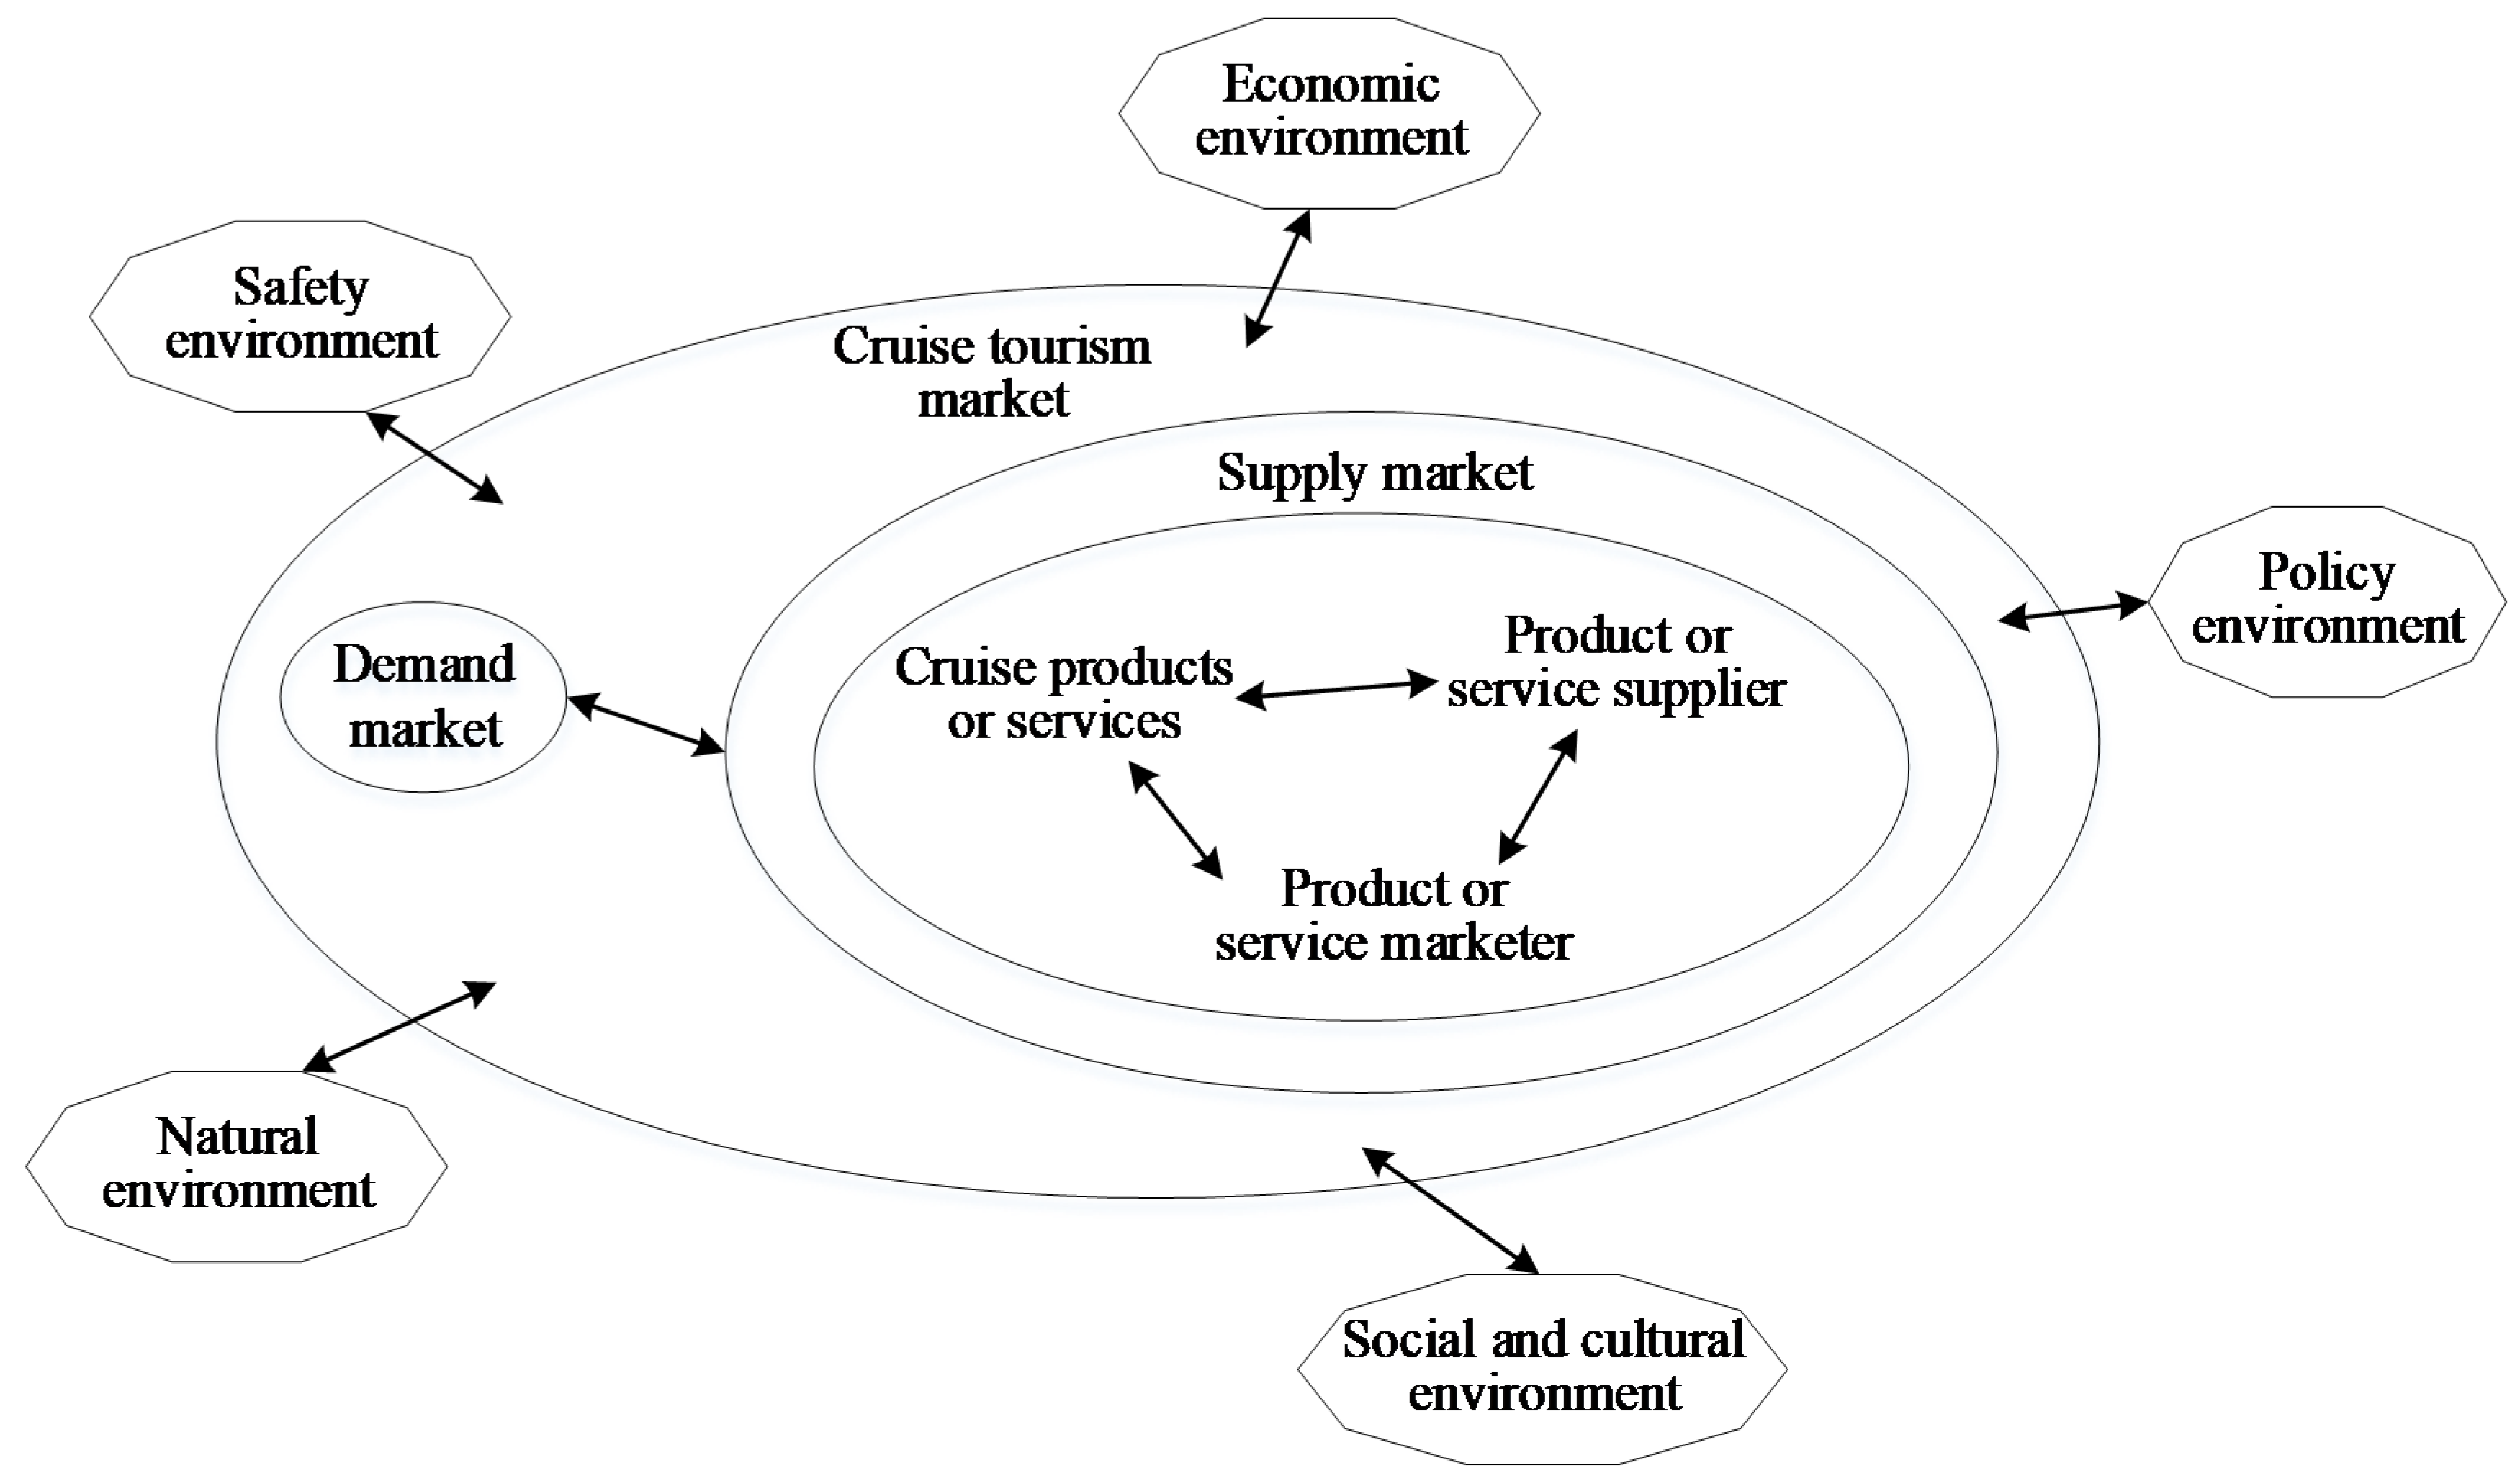
4.1.1. Analysis of Cruise Tourism Market

It can be considered that the cruise tourism market is the sum of supply and demand together with an economy where the supply and demand sides of tourism products or services exchange and influence each other. Market supply-side focuses on actual needs of demand-side, holding an ultimate goal to satisfy tourist needs and achieve long-term development. While in market operations, in addition to being affected by the interaction between supply and demand side, the whole market is also easily affected by external environment. The detailed description of cruise tourism markets is shown in Figure 3.
Subsequently, the current situation of the Yangtze River cruise tourism market is analyzed with regard to market supply and demand. There are mainly 10 tourism enterprises participating in the operation of luxury cruise lines along the Yangtze River, with a total of about 50 cruise ships, and the maximum annual reception capacity is about 650,000 to 700,000. There is little difference in the number of cruise ships, owned by several major cruise travel enterprises, and most of them are invested in the section of the Yangtze River named Three Gorges, located from Chongqing to Yichang, which is dominated by short boutique routes. Therefore, the products, services and scenic spots provided by cruise companies are highly concentrated. Due to various reasons such as the single route, the load rate of cruise ships is relatively low and the industry load rate is only about 70% on average. As a whole, the products provided by cruise companies on the Yangtze River Basin are homogenized, and the product design has not done enough in terms of theme and route diversification. There is still a lot of room for development. At present, the annual demand for luxury cruise ships in the Three Gorges of the Yangtze River is about 500,000–650,000 persons, which is mainly for domestic tourists and shows a trend of diversified growth in demand. Actually, tourist groups there can be roughly divided into four groups, namely, newlyweds, middle-aged and elderly, and family and business, presenting different service needs and price sensitivities. In general, the supply of cruise products with various problems in the market is inconsistent with the increasingly complicated demand of tourists; therefore, new-build cruise products should also take these challenges into account in order to gain a competitive advantage.

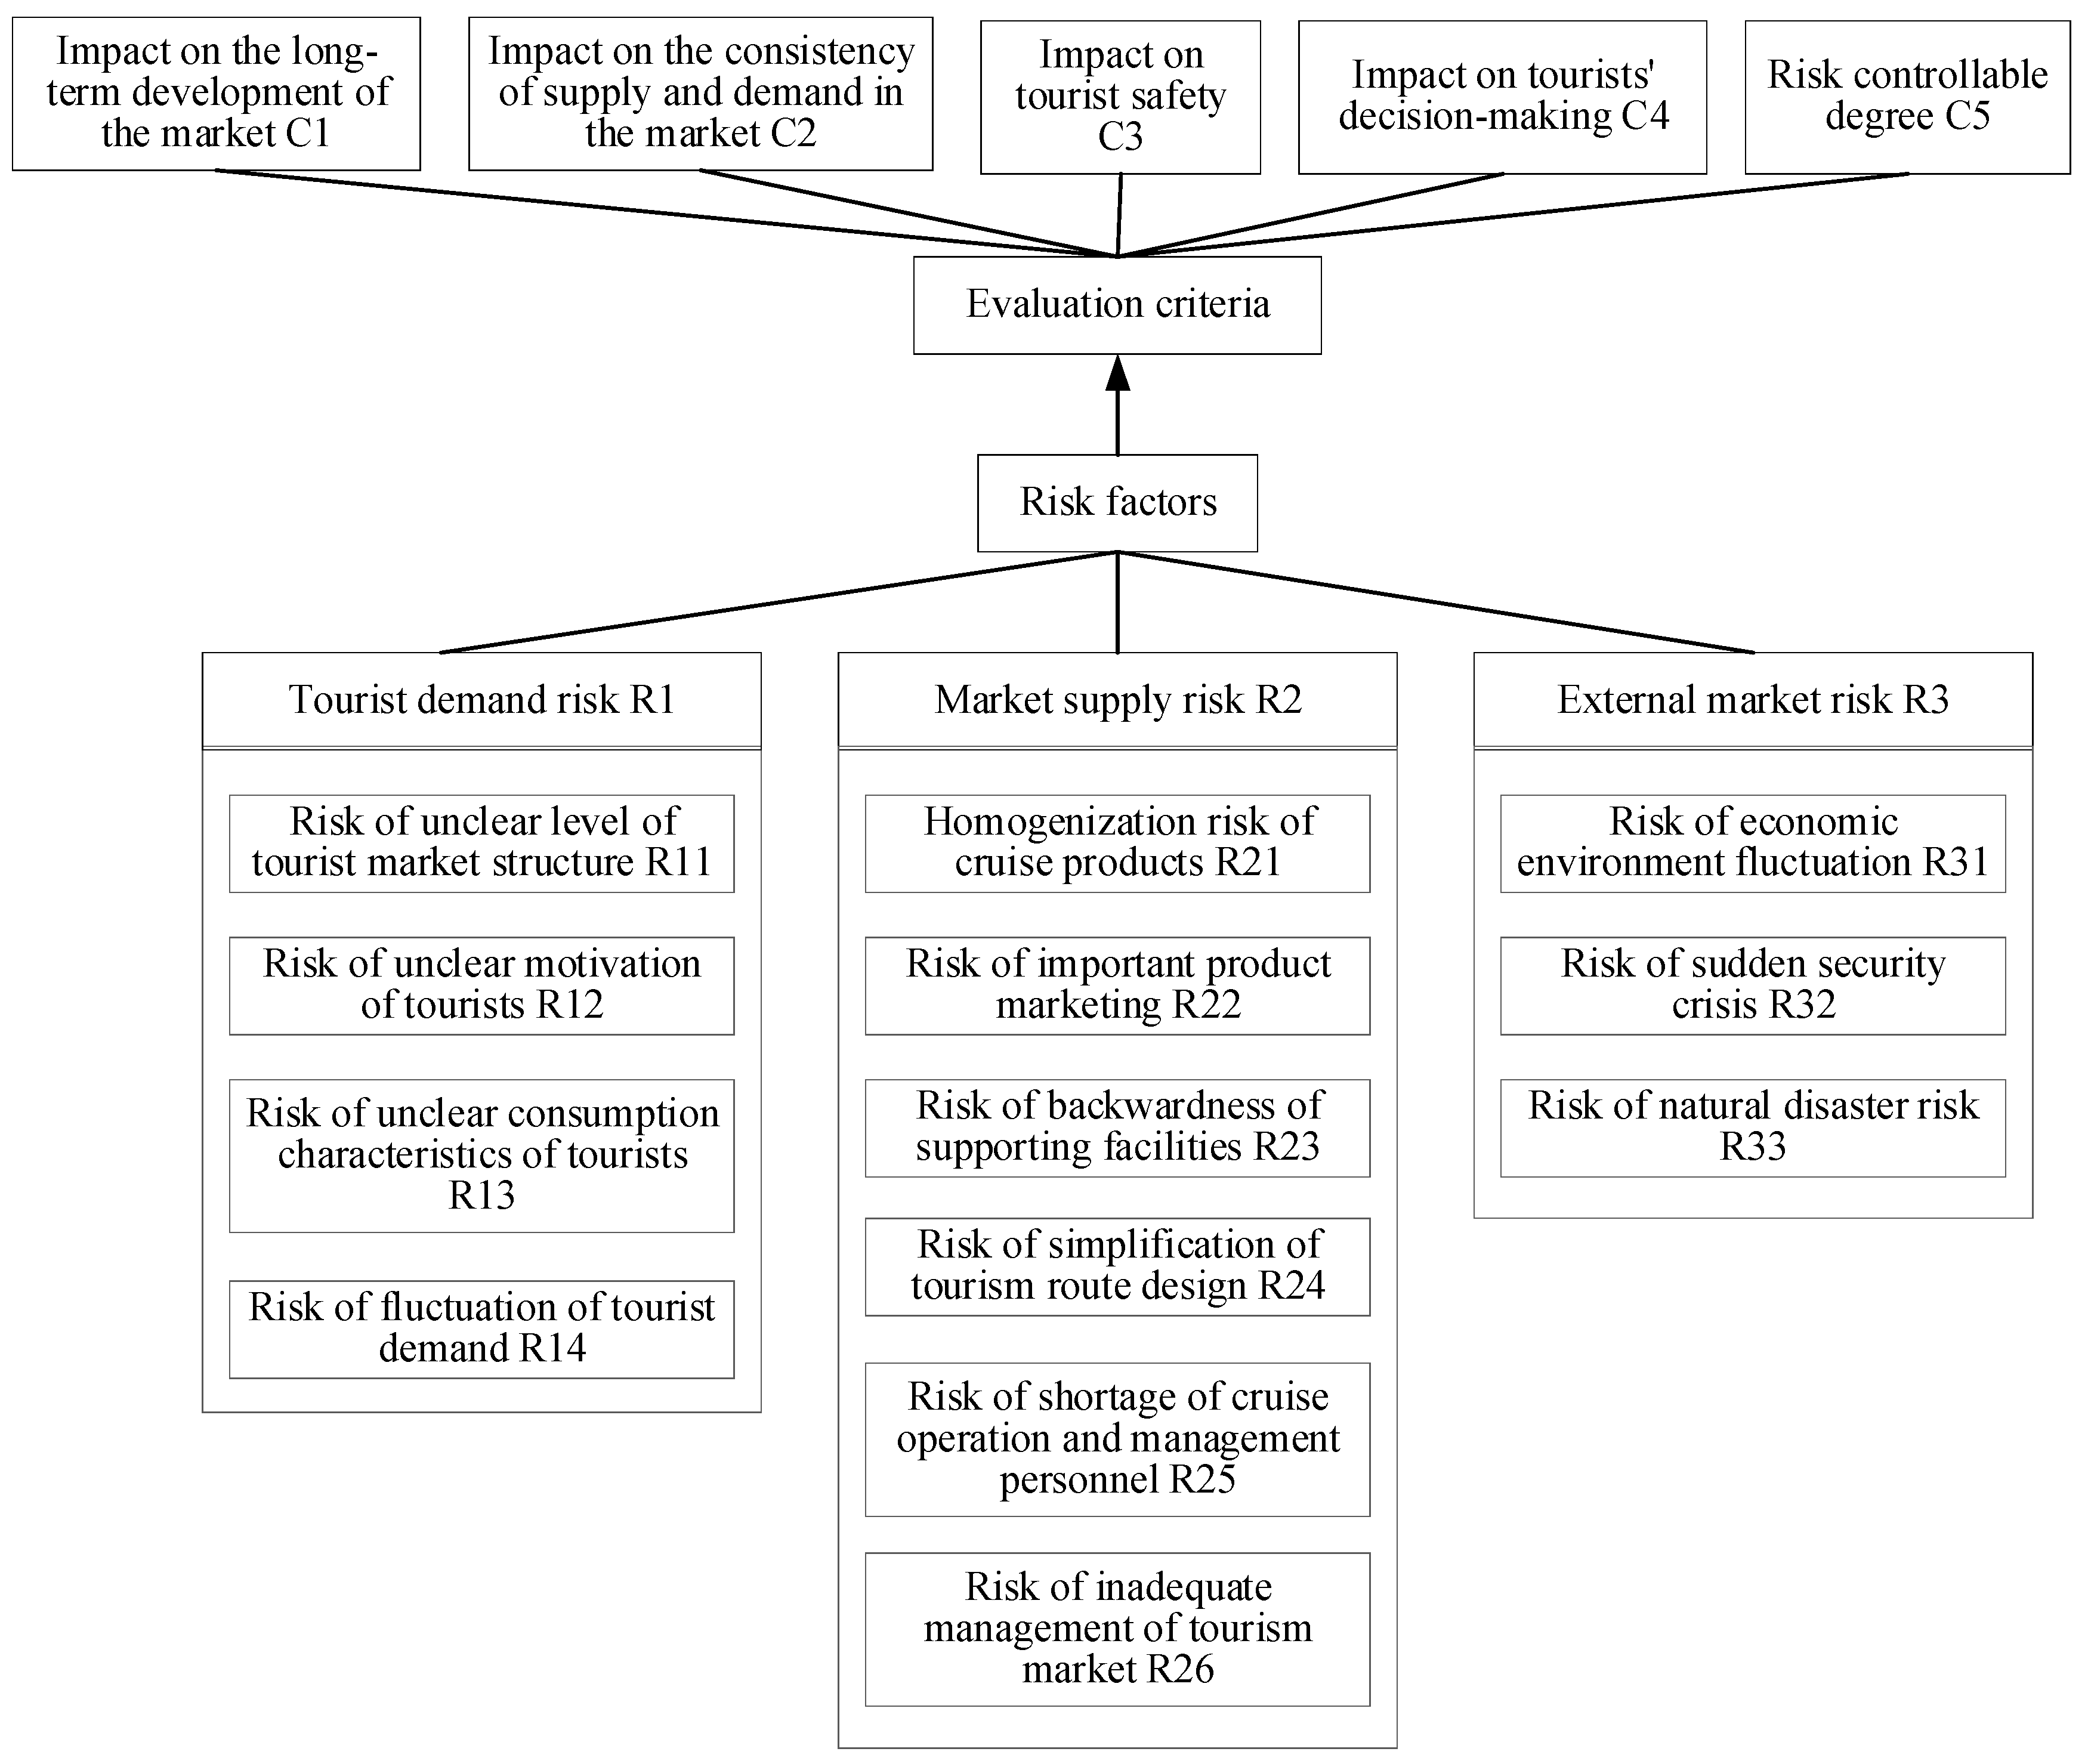
4.1.2. Market Risk Factors of New-Build River Cruises

As demonstrated before, the cruise tourism market is composed of supply and demand side. In addition to mutual influence, the two are also affected by external environmental factors such as economy, culture, and policies. In fact, attracting tourists to make purchasing decisions is critical to new-build cruise ships. From the influencing factors of tourist decision making, as shown in Figure 1, market supply affects tourist travel motivation by influencing tourist satisfaction and external environmental factors by influencing tourist psychology in an objective way. Meanwhile, from a subjective view, another important factor affecting tourism motivation is the demand by tourists themselves that is easily controlled by tourist income, time, life or political environment, age and preferences. It can be considered that tourist demand carries characteristics of diversity and complexity and affects their purchasing decisions to a large extent. Moreover, the most essential risk is the inability to generate consumer decision making needs. Therefore, it is necessary to take tourist demand risk into consideration to carry out a reasonable market positioning while new-build cruise ships enter the market. To sum up, possible market risks can be summarized as market supply risk, external environmental risk and tourist demand risk, among which tourist demand risks mainly come from the diversity of tourism motivation and consumption preferences and levels, as well as the volatility of demand, while external environment risks are found in the economy and some unexpected events.
Actually, market risks can be further specified based on the analysis of actual problems existing in the Yangtze River cruise market. Xie [50] points out that problems in developing cruise tourism on the Yangtze River are lack of professionals, simplification of cruise products, insufficient awareness of cruise tourism, restrictions on cruise activities and vicious competition. The authors further elaborate the characteristics of aging of inland river cruise ships in five aspects: timeliness, flexibility, price, integrity and institutional supply and proposes that supply-side reforms should be carried out to meet the needs of tourists. Moreover, complete support facilities, professional cruise personnel, high-quality inland river cruise routes, and optimization of management mechanism need to be established to achieve integrated development of cruise tourism. In view of this, the main problems are homogenization of products, aging supply of support facilities, inappropriate product marketing, coordination management and route design in cruise supply market. Based on this, a complete risk index system of new-build river cruise market on the Yangtze River is formed as shown in Table 2.

4.2. Determination of Risk Assessment Criteria

Due to the characteristics of high-value, long timelines, and fluctuating market demand in river cruise products, it is necessary to consider whether risks can affect the demand and decision-making of tourists and long-term development of the market while selecting criteria for evaluating the impact of risks. In addition, cruise tourism presents higher requirements for safety and security; the occurrence of some risk factors may adversely influence both body and mind in a long period. Therefore, the evaluation criteria should conclude the impact on tourist safety and whether there is controllability. In conclusion, five criteria are considered here; they are the impacts on: long-term development of the market; consistency of supply and demand in the market; tourist safety; tourist decision-making; and controllable degree of risk. The specific descriptions of these evaluation criteria are shown in Table 3.

4.3. Risk Prioritization Using Fuzzy PROMETHEE

According to above analysis, five evaluation criteria determined and 13 risk factors have been identified from three aspects, namely tourist demand, market supply and external environment. Furthermore, the related steps for fuzzy PROMETHEE are defined as follows:
Step 1: Data collection. The decision maker is first identified when collecting data. This paper identified three decision makers with equal weights based on their academic background and knowledge of the field. Subsequently, obtaining linguistic values of experts on risk factors under various evaluation criteria in the form of questionnaire survey. In this way, the used Linguistic variables are divided into five level, as shown in Table 4.
After data collection, the linguistic values given by the decision makers are converted into intuitionistic fuzzy numbers combined with the weights of the decision makers, and the IFA operator is introduced to aggregate evaluation values of all decision makers. Finally, the fuzzy numbers are further converted into real numbers in order to clarify attitudes of decision makers to risk factors.
Step 2: Calculate the weight of each criteria through the AHP method.
Step 3: Determine the preference function and parameters of each criteria.
In view of the different risk preferences of decision makers, PROMETHEE provides six different preference functions and its parameters are determined by decision makers, which are Usual criterion, U-shape criterion, V-shape criterion, Level criterion, V-shape with indifference criterion and Gaussian criterion, and each of them has its adaptive ranges [25]. Generally speaking, when comparing two risk factors a and b under evaluation criteria, the relations among which are: a is better than b, a and b are indistinguishable, and a and b are incomparable. Specially, usual criterion applies to situations where DMs are unable to distinguish the priority of differences between evaluation criteria. The distinction between u-shape criterion and the usual criterion lies in a difference threshold determined by DMs. V-shape criterion holds that when 0 < d p , the priority relation is linear with d , thus it is suitable for the evaluation criteria whose preference relationship changes linearly. Level criterion refers to a certain value in regard to q < d p . Gaussian criterion is applicable to the evaluation criteria whose preference relationship is non-linear. Particularly, among the above preference functions, Q is the indifference threshold, p is the absolute preference threshold, and s is the value between Q and p .
Step 4: Calculate the net flow of each risk factor and prioritize them. In this part, based on the determined preference function and weights of the evaluation criteria, the processed decision data is calculated step by step according to PROMETHEE, so as to obtain an initial ranking of risks.

4.4. Sensitive Analysis

For the sake of understanding impact imposed on risk ranking when DM information changes, it is necessary to conduct a sensitivity analysis because PROMETHEE relies on DM information in calculation process, but the information is inevitably subjective. Furthermore, DM thoughts are not constant but are easy to change due to different situations. Therefore, accuracy of decision-making based on human experience and preferences in PROMETHEE needs to be further verified. In the fuzzy MCDA method proposed in this paper, sensitivity analysis is carried out by changing types of preference function and parameter values.

5. Results and Discussion

5.1. Data Processing

Based on previous analysis, 13 risk factors have been identified and five evaluation criteria have been determined. In PROMETHEE, the relationship between risk and evaluation criteria is shown in Figure 4.
As mentioned before, the possible adverse effects of market risks are analyzed combining the characteristics of river cruise product. Therefore, five evaluation criteria are determined considering the potential consequences caused by risks. To compare the importance of different evaluation criteria, weight of each criteria is calculated by using AHP. In this study, three experts with relevant background knowledge were invited to make a judgement. The selected experts are university professors or teachers who are engaged in research in the field of water sector. Each of them has more than 10 years of work and scientific research experience as well as a master’s degree or higher education experience. The evaluation results are shown in Table A1. In the case that weights of DMs are equal, then collected data can be sorted to obtain the evaluation matrix (5) as described above, as well as weights of all evaluation criteria are calculated by Formulas (6)–(8). Subsequently, the maximum eigenvalue together with CR are calculated to verify results’ rationality. The result is reasonable as the consistency ratio compared with data revealed in Table 1. Table 5 represents the weights of the five evaluation criteria, in which “impact on the long-term development of the market C1”, “Impact on tourist safety C3” are relatively more important for new-build river cruise market.
Meanwhile, based on the language variables, fuzzy numbers and corresponding risk levels in Table 4, five criteria are used to express the possible impact of risk factors, so that experts with equal weights can use language variables to evaluate risk factors. After decision information of each decision maker is collected (shown in Table A2), the evaluation level is converted into corresponding intuitionistic fuzzy number (shown in Table A3), and then the aggregate fuzzy evaluation matrix is constructed using Formula (3). Then specific score value of the fuzzy aggregation matrix is calculated by Formula (4), as shown in Table 6.

5.2. Ranking of Risk Factors

In this part, we first determine preference function and its parameter values in PROMETHEE. A suitable preference function is of great importance to subsequent ranking results. To improve the accuracy of results, selection of preference function needs to take the characteristics of evaluation criteria into consideration. As far as evaluation criteria given in this paper are concerned, DMs believe that the priority of risk factors is obvious when a certain condition is reached, while in other cases the priority can be considered to show a linear relationship. Thus, V-shape criterion is chosen as the preference function and the corresponding value of p is set as 0.25. Subsequently, the first task is to compare risk factors in pairs under a certain evaluation criterion, and use Formula (11) in combination with the above evaluation value shown in Table 6 to quickly obtain the priority difference between risk factors, as denoted in Table 7. Particularly, Table 7 only presents data of the distance for risk factor R11 to others with regard to all evaluation criterion. Moreover, Table A5 also reveals some relevant information.
Then, based on selected V-shape criterion, utilizing Formulas (12), (14), (19) to determine a multi-criteria preference index π ( a ,   b ) , that is, global priority between any two risk factors when considering that all evaluation criteria is obtained. Table A6 in the Appendix A shows specific calculation information. Based on this, the net flow can be achieved from the Formulas (21)–(23) and then risk factors can be ranked with respect to ( a ) . The final result is denoted as Table 8.
The above shown ranking in Table 8 is: R23 > R32 > R21 > R24 > R26 > R25 > R12 > R13 > R33 = R14 > R22 > R11 > R31. Meanwhile, risk of backwardness of support facilities R23 together with risk of sudden security crisis R32 with net flows of 0.463 and 0.442, respectively, showing the highest risk level as well as meaning influence of the two risk factors on long-term development of market, the consistency of supply and demand in market, tourist safety, tourist decision-making and risk controllable degree is greater than that of other risks.
According to overall analysis of risk results, external risk of the market, especially the risk of sudden security crisis and risk of market supply such as risk of backward support facilities, simplification of tourism route design, lack of market management and product homogenization are higher than that of tourists demand risks as a whole.

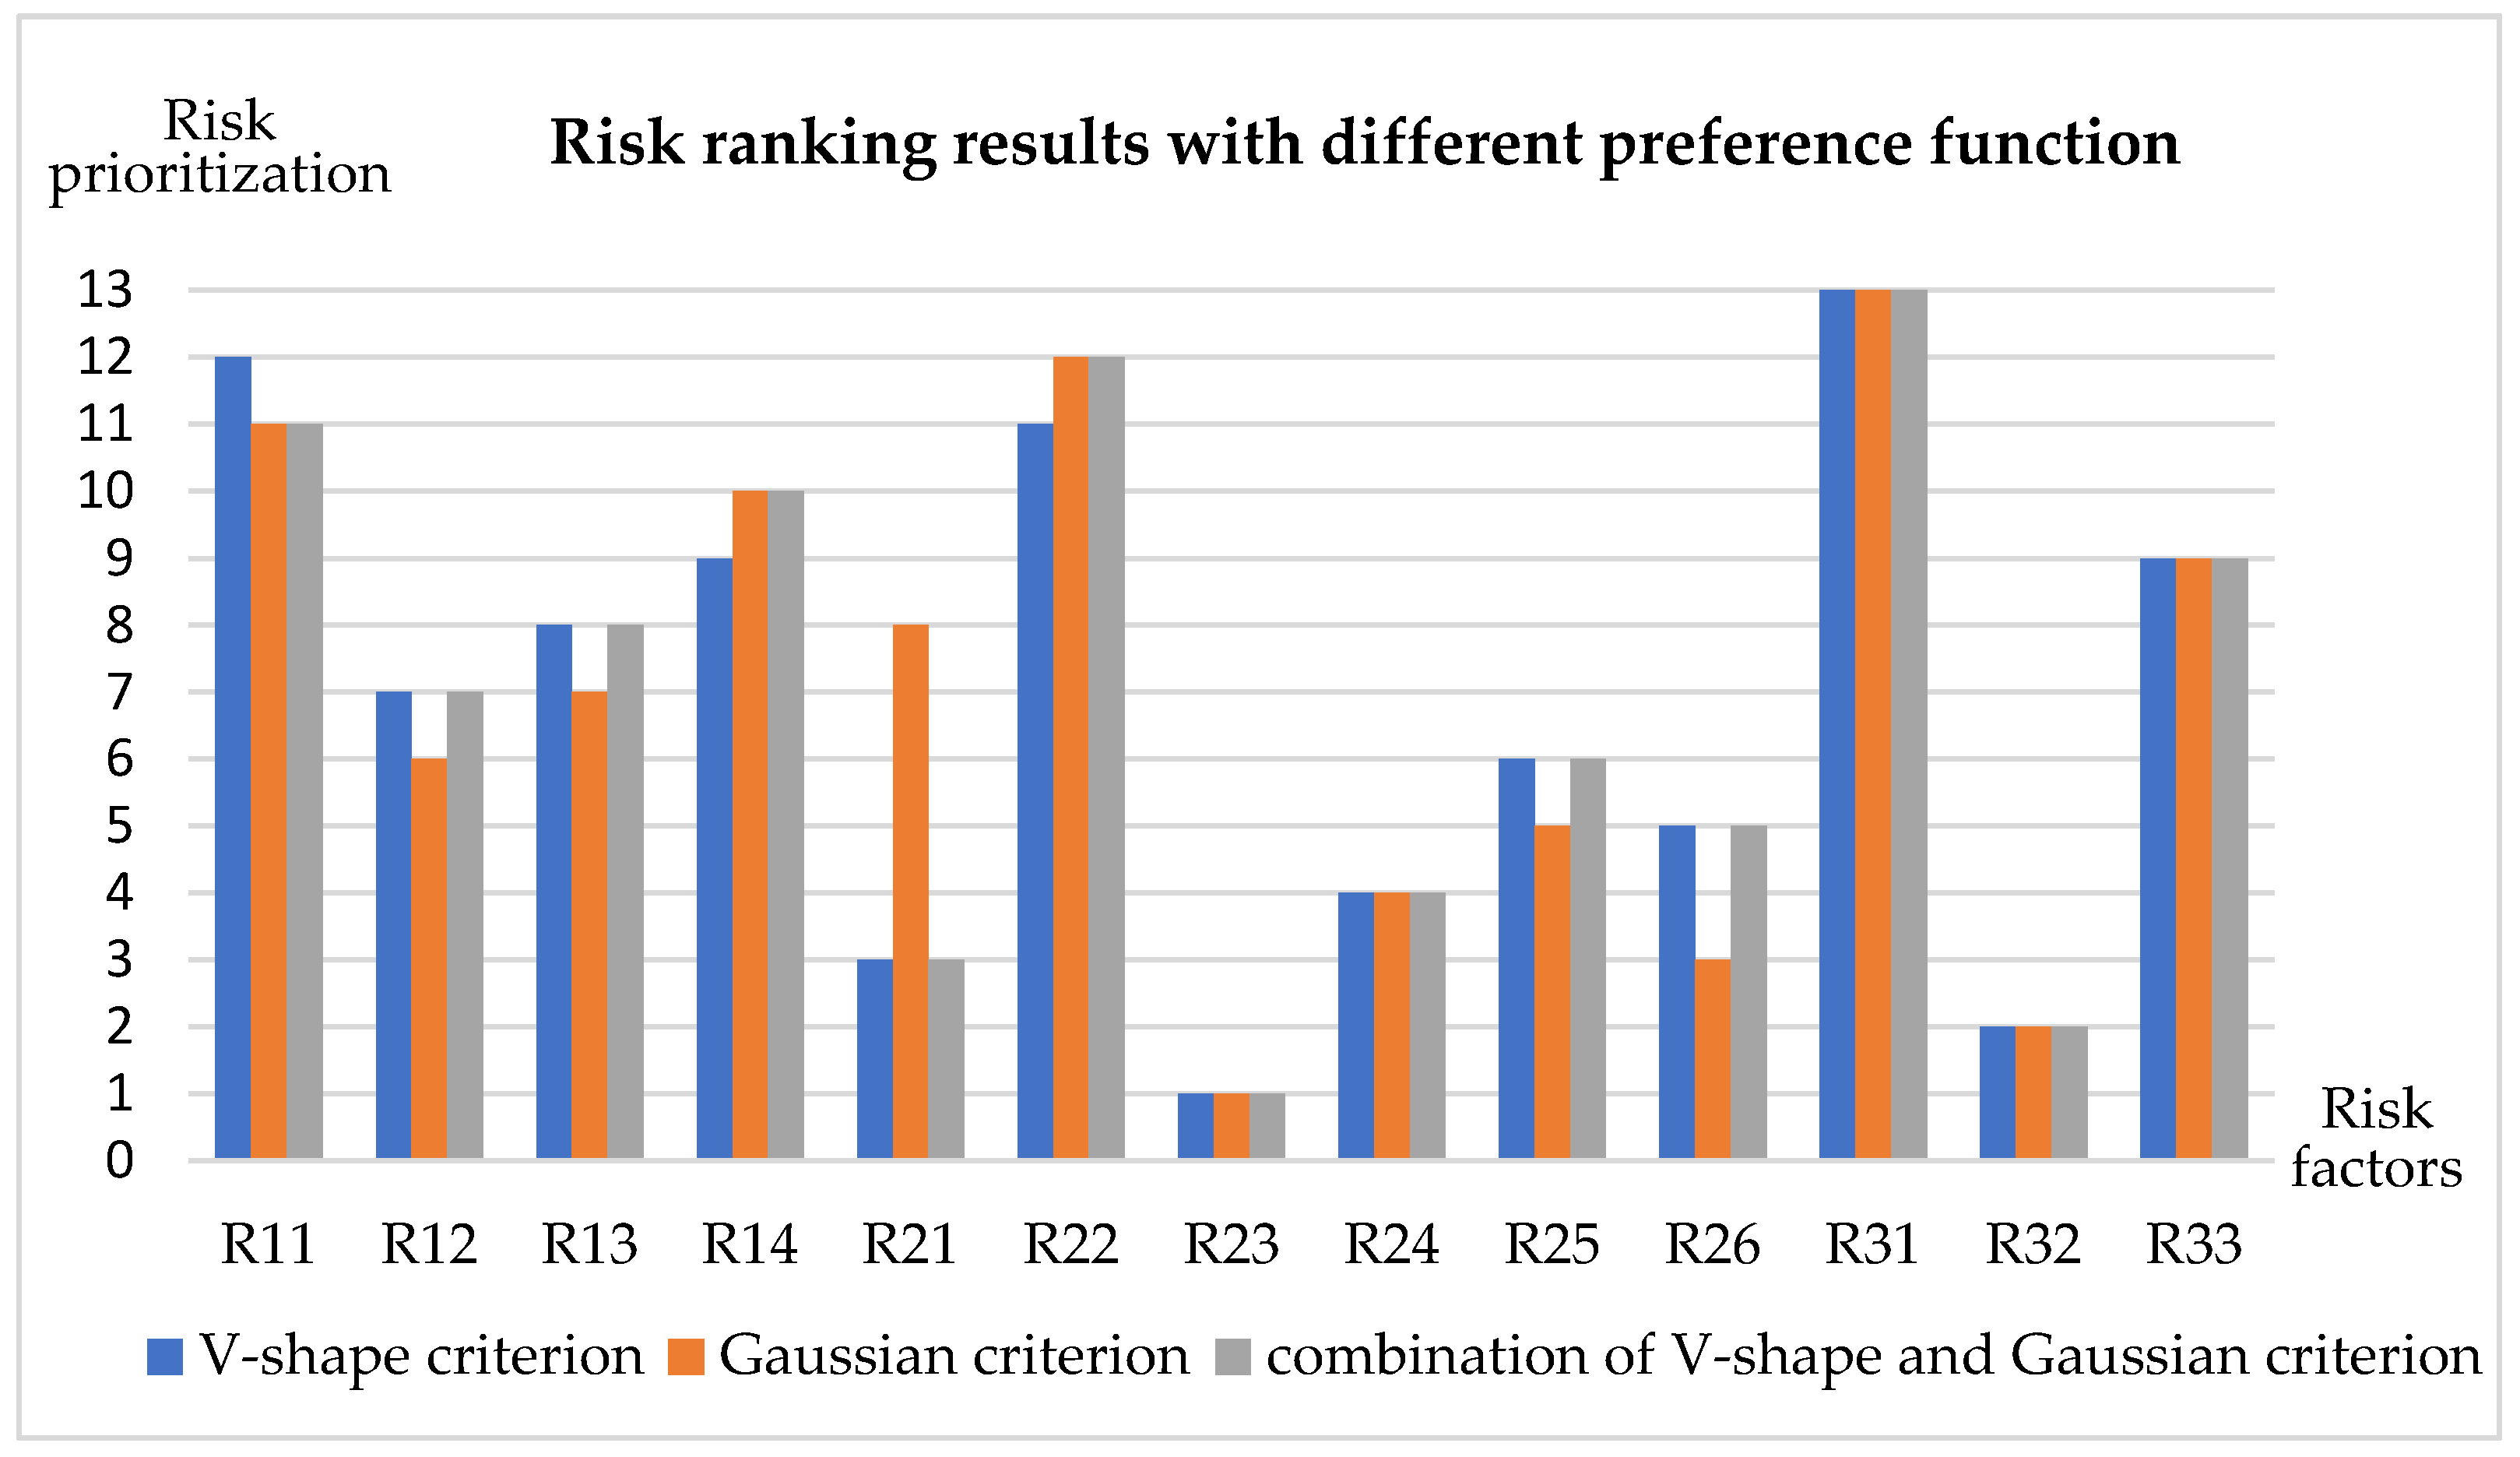
5.3. Model Validation

Among the proposed fuzzy PROMETHEE model, the preference function types and corresponding parameter values which play an indispensable role in ranking of risk factors are determined by DMs. However, opinions of DMs are not always consistent in practice. Therefore, in order to verify accuracy and stability of risk ranking results, this paper changed the parameter values of preference function and types for sensitivity analysis. Considering that the value of p in the aforementioned selected preference function is subjectively determined by DMs, we calculate risk ranking when the value of p changes, the results of which are clearly presented in Table 9.
It can be known from Table 9 that there are little changes in the risk ranking results under the above four different conditions of p value, especially that risk factors with higher risk value have been consistent. Moreover, we further verify reliability of the proposed model by changing preference function type in regard to evaluation criterion. As far as evaluation criteria are concerned, there are numerous uncertain factors that produce nonlinear effects in actual situations, so it is reasonable to take Gaussian criteria into consideration. Specifically, sensitive analysis for preference function is divided into three cases in this paper, namely V-shape criterion with a p value of 0.25 (all criteria), Gaussian criterion with a S value of 0.2 (all criteria), and the combination of V-shape criterion and Gaussian criterion (criteria C1, C3, C4 with V-shape and criteria C2, C5 with Gaussian). The ranking results for three different preference function are clearly elaborated in Figure 5. Furthermore, Table A7 in the appendix elaborates the detailed calculation value.
As shown in Figure 5, overall ranking results have not changed much, especially the higher risk factors that are important for subsequent analysis with the exception of R21. R21 is ranked as eighth in Gaussian criterion and third in other two criteria. Although there are some differences in ranking results, R21can still be considered an important factor. From a holistic perspective, it can be concluded that initial ranking results obtained in this paper have high accuracy and reliability considering the above calculation results. At the same time, the robustness of the proposed risk assessment model is verified.

5.4. Discussion

The analysis of several factors with high-risk value shows that the risk level of sudden safety crisis, backward support facilities, simplification of tourism route design, inadequate market management and homogenized products is superior to others. In terms of specific analysis, the high-risk level of sudden safety crisis in external market risks is mainly due to its severe impact on tourist safety and psychology, to a large extent, taking a long time for the market to return to normal. Support facilities refer to the supporting cruise ports and terminal facilities; the backwardness of facilities leads to an inability to keep pace with the development of luxury cruise ships, which is not conducive to the long-term development of the market and sometimes even results in security risks. The high value at risk relative to the simplification of tourism route design and product homogenization is due to the fact that tourist demand is mainly based on the attractiveness of products and services, and the long-term obsolescence of products will lead to less attraction of tourists, thus influencing tourist purchasing decisions.
To a large extent, compared to risk of tourist demand, market supply and external risk tend to be higher, for which external risk factors are uncontrollable and not conducive to the long-term development of the market, and tourist safety. While market supply is related to products and services provided to tourists, of which the quality level poses a far-reaching impact on tourist travel decisions. On the contrary, risk of tourist demand shows little impact on tourist safety and is relatively easy to control, thus the risk value is lower. Therefore, it is necessary to pay close attention to the external environmental risk of the market and market supply risk, thus to establish an appropriate prevention mechanism in advance and clarify the market positioning of tourists in the process of cruise product design. Some specific suggestions are put forward subsequently.
External risks of the market are relatively difficult to predict, prevent and control in advance, but some advance preparations can be made such as the following: improve overall quality of the staff on cruises; formulate corresponding safety management systems; equip cruises with sufficient rescue equipment; and ensure that the design of cruises is safe and reasonable.
For market supply risks, the first is product design innovation through the following steps: developing cruise products and increasing cultural connotations of products such as culture of the three Kingdoms; meeting individual needs of tourists; and further developing tourism routes in the middle and lower reaches of the Yangtze River, even combining rivers and seas to avoid product homogenization. The second is to increase investment in the construction of support facilities so that the development of port and terminal facilities is synchronized with that of luxury cruises.
With regard to demand risk of tourists, it is necessary to analyze the differentiated needs of tourists and tourism motivation to subdivide the target market. Then combining innovative marketing strategies such as establish online and offline integrated marketing strategy system and promote cruise products by means of large and mature customer platform channels to improve product sales.
In fact, previous studies on cruise tourism market risks, especially those involving the Yangtze River Basin, all reveal that the impact of unexpected safety accidents, the construction of cruise-supporting industries, and the diversification of cruise products have always been research hotspots and can play a profound role in the long-term development of cruise tourism. Similarly, this paper also believes that special attention should be paid to the risks in regard to these aspects. The reason may be that they have a direct influence on tourist perception of the cruise tourism image, and thus have an important orienting effect on tourist purchasing and consumption choice behavior.

6. Conclusions

Aging supply of the Yangtze River cruise market and the complexity of tourist tourism behavior, brings new-build river cruise market much uncertainty. In order to realize long-term development of new-build river cruise ships, this study makes a comprehensive analysis and evaluation of market risks. In this scope, three objectives are achieved: (1) Providing an innovative way to establish a complete risk evaluation index system. This was done by analyzing cruise market supply and demand as well as factors that affect tourist decision-making. This resulted in the summarization of 13 risk factors based on actual conditions on the Yangtze River. (2) From a multi-criteria perspective, five evaluation criteria are proposed to weigh the consequences of risks, avoiding one-sidedness of the results. (3) A fuzzy MCDA method is introduced to establish a risk assessment model based on the fuzzy AHP-PROMETHEE that allows for evaluation in uncertain and complex environments to reduce ambiguity and uncertainty in human judgment. The results reveal risk of sudden security crisis and risk of market supply, especially simplification of tourism route design, backward support facilities, product homogenization and inadequate market management, are higher than risks of tourist demand; a corresponding explanation and suggestions are given for the results. These results provide certain references for decision makers to formulate rational risk control measures for sustainable development of both cruise companies and the whole industry. Furthermore, the results present a risk identification thought to identify market risk based on the perspective of market demand and tourist decision. To sum up, the main contribution of this paper comes from the theoretical and practical level. From a theoretical analysis, this paper systematically considers the possible risks of market supply, demand and external environment from the perspective of new-build river cruise ships, and establishes an evaluation method that can comprehensively evaluate the consequences caused by risks. Furthermore, the constructed method is capable of organically combining the identified risk factors with their possible impacts and can make a clear description of the relationship between the two, which is conducive to integrated evaluation of risk factors. Meanwhile, the proposed model can also flexibly change the risk factors and evaluation criteria according to the actual situation of the cruise tourism market, which provides a reference for more accurate decision making. From a practical point of view, the research results allow cruise companies, ports and stakeholders to identify where they need to change the situation and the direction of their joint efforts.
Moreover, the present study still has certain limitations in the following aspects. First, the research tends to be theoretical, and more detailed practical investigations should be carried out in the future to have a deeper understanding of the cruise market risks on the Yangtze River Basin. Second, the risk assessment process relies on expert subjective judgment, thus it is constructive to consider how risk can be expressed in a quantitative form to reduce uncertainty. Third, in the application of the MADA method of PROMETHEE, the obtained risk-ranking results can be compared with those achieved by other MCDA methods to further verify reliability of the proposed risk evaluation model. Finally, this paper is limited to analyzing and evaluating risks, while future research should focus on practical measures that can deal with risks.

Author Contributions

Conceptualization, J.Z. and H.W.; methodology, J.Z.; data curation, J.Z., H.W. and B.X.; formal analysis, J.Z. and H.W.; investigation, B.X.; writing—original draft preparation, J.Z.; writing—review and editing, H.W.; supervision, H.W.; project administration, B.X. All authors have read and agreed to the published version of the manuscript.

Funding

Grant Number MC-202009-Z03 for this study.

Institutional Review Board Statement

Not applicable.

Informed Consent Statement

Not applicable.

Data Availability Statement

Not applicable.

Acknowledgments

The authors would like to thank those who provided kind help on improving the work. We also thank the editors and the anonymous reviewers for their constructive suggestions on improving the paper.

Conflicts of Interest

The authors declare no potential conflict of interest.

Appendix A

Table A1. Judgement matrix of evaluation criteria by using AHP.
DM1C1C2C3C4C5DM2C1C2C3C4C5DM3C1C2C3C4C5
C113133 13333 111/373
C21/31131/3 1/311/333 111/331
C311151 1/33133 33115
C41/31/31/511/5 1/31/31/315 1/71/3111
C51/33151 1/31/31/31/51 1/311/511
Table A2. Initial evaluation results of risk factors under five criteria.
DM1C1C2C3C4C5DM2C1C2C3C4C5DM3C1C2C3C4C5
R1143243 24132 35242
R1244143 45254 45352
R1334132 45144 44353
R1444143 44133 55252
R2154344 54254 54254
R2243233 42132 53134
R2343444 45544 54445
R2433243 55344 54154
R2544244 53334 34322
R2644444 33533 44433
R3133235 41114 33142
R3245555 53455 43554
R3333444 22544 31445
Table A3. Fuzzy aggregation results of risk factors under five criteria.
C1C2C3C4C5
R11(0.9125,0.0360)(0.9813,0.0060)(0.5590,0.3060)(0.9688,0.0090)(0.7550,0.1440)
R12(0.9844,0.0034)(0.9944,0.0015)(0.6850,0.2040)(0.9944,0.0015)(0.9125,0.0360)
R13(0.9688,0.0090)(0.9906,0.0023)(0.5950,0.2890)(0.9813,0.0060)(0.9125,0.0360)
R14(0.9906,0.0023)(0.9906,0.0023)(0.4330,0.4335)(0.9813,0.0060)(0.8250,0.0960)
R21(0.9966,0.0010)(0.9844,0.0034)(0.7550,0.1440)(0.9944,0.0015)(0.9844,0.0034)
R22(0.9906,0.0023)(0.8250,0.0960)(0.4330,0.4335)(0.8750,0.0640)(0.9125,0.0360)
R23(0.9906,0.0023)(0.9813,0.0060)(0.9906,0.0023)(0.9844,0.0034)(0.9906,0.0023)
R24(0.9888,0.0040)(0.9813,0.0060)(0.6850,0.2040)(0.9906,0.0023)(0.9688,0.0090)
R25(0.9813,0.0060)(0.9688,0.0090)(0.8250,0.0960)(0.9125,0.0360)(0.9563,0.0135)
R26(0.9688,0.0090)(0.9688,0.0090)(0.9906,0.0023)(0.9375,0.0240)(0.9375,0.0240)
R31(0.9375,0.0240)(0.7750,0.1360)(0.4330,0.4335)(0.8875,0.0510)(0.9738,0.0090)
R32(0.9906,0.0023)(0.9625,0.0160)(0.9944,0.0015)(0.9966,0.0010)(0.9944,0.0015)
R33(0.8250,0.0960)(0.6850,0.2040)(0.9906,0.0023)(0.9844,0.0034)(0.9906,0.0023)
Table A4. Real evaluation results of risk factors under five criteria.
C1C2C3C4C5
R112.3654 2.6496 1.1372 2.6050 1.7123
R122.6655 2.6988 1.4742 2.6988 2.3654
R132.6050 2.6863 1.2209 2.6496 2.3654
R142.6863 2.6863 0.8818 2.6496 1.9809
R212.7063 2.6655 1.7123 2.6988 2.6655
R222.6863 1.9809 0.8818 2.1909 2.3654
R232.6863 2.6496 2.6863 2.6655 2.6863
R242.6763 2.6496 1.4742 2.6863 2.6050
R252.6496 2.6050 1.9809 2.3654 2.5556
R262.6050 2.6050 2.6863 2.4721 2.4721
R312.4721 1.7806 0.8818 2.2542 2.6199
R322.6863 2.5689 2.6988 2.7063 2.6988
R331.9809 1.4742 2.6863 2.6655 2.6863
Table A5. The distance between risk factors (taking risk factor R12 as example).
IndexC1C2C3C4C5
d (R12, R11)0.300 0.049 0.337 0.094 0.653
d (R12, R13)0.061 0.012 0.253 0.049 0.000
d (R12, R14)−0.021 0.012 0.592 0.049 0.384
d (R12, R21)−0.041 0.033 −0.238 0.000 −0.300
d (R12, R22)−0.021 0.718 0.592 0.508 0.000
d (R12, R23)−0.021 0.049 −1.212 0.033 −0.321
d (R12, R24)−0.011 0.049 0.000 0.012 −0.240
d (R12, R25)0.016 0.094 −0.507 0.333 −0.190
d (R12, R26)0.061 0.094 −1.212 0.227 −0.107
d (R12, R31)0.193 0.918 0.592 0.445 −0.254
d (R12, R32)−0.021 0.130 −1.225 −0.008 −0.333
d (R12, R33)0.685 1.225 −1.212 0.033 −0.321
d (R11, R12)−0.300 −0.049 −0.337 −0.094 −0.653
d (R13, R12)−0.061 −0.012 −0.253 −0.049 0.000
d (R14, R12)0.021 −0.012 −0.592 −0.049 −0.384
d (R21, R12)0.041 −0.033 0.238 0.000 0.300
d (R22, R12)0.021 −0.718 −0.592 −0.508 0.000
d (R23, R12)0.021 −0.049 1.212 −0.033 0.321
d (R24, R12)0.011 −0.049 0.000 −0.012 0.240
d (R25, R12)−0.016 −0.094 0.507 −0.333 0.190
d (R26, R12)−0.061 −0.094 1.212 −0.227 0.107
d (R31, R12)−0.193 −0.918 −0.592 −0.445 0.254
d (R32, R12)0.021 −0.130 1.225 0.008 0.333
d (R33, R12)−0.685 −1.225 1.212 −0.033 0.321
Table A6. Multi-criteria preference index π ( a ,   b ) (taking V-shape criterion with p value of 0.25 as example).
π ( 1 ,   b ) π ( 2 ,   b ) π ( 3 ,   b ) π ( 4 ,   b ) π ( 5 ,   b ) π ( 6 ,   b ) π ( 7 ,   b ) π ( 8 ,   b ) π ( 9 ,   b ) π ( 10 ,   b ) π ( 11 ,   b ) π ( 12 ,   b ) π ( 13 ,   b )
0.000 0.816 0.584 0.502 0.795 0.462 0.773 0.767 0.751 0.737 0.274 0.787 0.444
0.000 0.394 0.000 0.027 0.462 0.027 0.449 0.436 0.390 0.345 0.133 0.452 0.422
0.289 0.448 0.422 0.107 0.573 0.107 0.535 0.516 0.449 0.345 0.133 0.549 0.428
0.000 0.021 0.013 0.013 0.466 0.133 0.428 0.422 0.422 0.422 0.133 0.442 0.428
0.538 0.538 0.538 0.249 0.697 0.000 0.300 0.289 0.289 0.289 0.000 0.309 0.300
0.000 0.043 0.023 0.023 0.049 0.000 0.671 0.671 0.612 0.595 0.156 0.671 0.512
0.000 0.036 0.023 0.036 0.361 0.013 0.345 0.000 0.000 0.000 0.000 0.036 0.000
0.115 0.171 0.142 0.190 0.262 0.048 0.525 0.492 0.289 0.289 0.008 0.359 0.332
0.076 0.221 0.116 0.223 0.357 0.107 0.319 0.281 0.103 0.327 0.034 0.503 0.448
0.538 0.792 0.713 0.531 0.870 0.409 0.855 0.822 0.721 0.701 0.079 0.327 0.184
0.051 0.083 0.075 0.075 0.088 0.000 0.051 0.051 0.023 0.023 0.000 0.862 0.414
0.488 0.500 0.488 0.488 0.500 0.488 0.488 0.488 0.488 0.488 0.488 0.524 0.000
π ( a ,   1 ) π ( a ,   2 ) π ( a ,   3 ) π ( a ,   4 ) π ( a ,   5 ) π ( a ,   6 ) π ( a ,   7 ) π ( a ,   8 ) π ( a ,   9 ) π ( a ,   10 ) π ( a ,   11 ) π ( a ,   12 ) π ( a ,   13 )
0.816 0.000 0.000 0.289 0.000 0.538 0.000 0.000 0.115 0.076 0.538 0.051 0.488
0.584 0.000 0.394 0.448 0.021 0.538 0.043 0.036 0.171 0.221 0.792 0.083 0.500
0.502 0.027 0.107 0.422 0.013 0.538 0.023 0.023 0.142 0.116 0.713 0.075 0.488
0.795 0.462 0.573 0.466 0.013 0.249 0.023 0.036 0.190 0.223 0.531 0.075 0.488
0.462 0.027 0.107 0.133 0.000 0.697 0.049 0.361 0.262 0.357 0.870 0.088 0.500
0.773 0.449 0.535 0.428 0.300 0.671 0.000 0.013 0.048 0.107 0.409 0.000 0.488
0.780 0.142 0.523 0.435 0.000 0.666 0.007 0.345 0.525 0.319 0.855 0.051 0.488
0.751 0.390 0.449 0.422 0.289 0.612 0.000 0.289 0.180 0.270 0.806 0.051 0.495
0.737 0.345 0.345 0.422 0.289 0.595 0.000 0.289 0.327 0.103 0.721 0.023 0.488
0.274 0.133 0.133 0.133 0.000 0.156 0.000 0.008 0.034 0.079 0.701 0.023 0.488
0.787 0.452 0.549 0.442 0.309 0.671 0.036 0.359 0.503 0.327 0.862 0.000 0.488
0.444 0.422 0.428 0.428 0.300 0.512 0.000 0.332 0.448 0.184 0.414 0.000 0.524
Table A7. Final calculation results of risk factors.
V-Shape Criterion with p Value of 0.15 (All Criteria)
R11R12R13R14R21R22R23R24R25R26R31R32R33
φ + ( a ) 0.184 0.379 0.295 0.244 0.515 0.173 0.519 0.470 0.409 0.405 0.136 0.527 0.340
φ ( a ) 0.674 0.255 0.401 0.379 0.133 0.548 0.025 0.196 0.300 0.290 0.754 0.072 0.497
Net   flow   ( a ) −0.490 0.124 −0.105 −0.135 0.382 −0.375 0.494 0.274 0.108 0.115 −0.618 0.455 −0.157
V-shape criterion with p value of 0.25 (all criteria)
φ + ( a ) 0.175 0.338 0.261 0.205 0.457 0.150 0.478 0.436 0.378 0.380 0.120 0.485 0.326
φ ( a ) 0.642 0.238 0.345 0.372 0.128 0.537 0.015 0.174 0.246 0.199 0.684 0.043 0.493
Net   flow   ( a ) −0.467 0.101 −0.084 −0.167 0.329 −0.387 0.463 0.262 0.132 0.182 −0.564 0.442 −0.167
V-shape criterion with p value of 0.35 (all criteria)
φ + ( a ) 0.149 0.304 0.236 0.177 0.404 0.130 0.447 0.405 0.348 0.359 0.102 0.454 0.313
φ ( a ) 0.588 0.213 0.297 0.362 0.120 0.512 0.011 0.159 0.214 0.142 0.607 0.031 0.490
Net   flow   ( a ) −0.439 0.091 −0.062 −0.185 0.284 −0.381 0.436 0.246 0.134 0.218 −0.505 0.423 −0.177
V-shape criterion with p value of 0.45 (all criteria)
φ + ( a ) 0.128 0.274 0.204 0.155 0.364 0.114 0.418 0.380 0.328 0.348 0.091 0.424 0.299
φ ( a ) 0.516 0.192 0.263 0.347 0.115 0.485 0.008 0.150 0.187 0.110 0.554 0.024 0.483
Net   flow   ( a ) −0.388 0.082 −0.059 −0.192 0.249 −0.371 0.410 0.230 0.140 0.237 −0.464 0.400 −0.183
Gaussian criterion with S value of 0.2 (all criteria)
φ + ( a ) 0.123 0.277 0.200 0.138 0.1900.102 0.409 0.375 0.312 0.348 0.095 0.414 0.303
φ ( a ) 0.478 0.186 0.215 0.324 0.271 0.464 0.001 0.096 0.167 0.065 0.518 0.012 0.471
Net   flow   ( a ) −0.356 0.091 −0.015 −0.186 −0.081 −0.362 0.408 0.279 0.1440.283−0.423 0.402 −0.168
criteria C1, C3, C4 with Gaussian and criteria C2, C5 with V-shape (p = 0.25, S = 0.2)
φ + ( a ) 0.130 0.276 0.208 0.158 0.366 0.110 0.430 0.392 0.332 0.350 0.109 0.428 0.317
φ ( a ) 0.514 0.212 0.266 0.347 0.118 0.507 0.008 0.154 0.198 0.120 0.545 0.041 0.482
Net   flow   ( a ) −0.384 0.064 −0.058 −0.190 0.249 −0.396 0.421 0.238 0.134 0.231 −0.436 0.387 −0.166

References

  1. Wang, H. Report on the Development of Cruise Industry in China (2019); Springer: Singapore, 2020. [Google Scholar] [CrossRef]
  2. Strömberg, P.; Steven, N.K. Characteristics, Contracts, and Actions: Evidence from Venture Capitalist Analyses. J. Financ. 2004, 59, 2177–2210. [Google Scholar]
  3. Tian, F.J.; Li, Z.Y. Study on Choosing of Enterprise’s Market Innovation Domain and Its Venture-eluding. Sci. Sci. Manag. S. T. 2007, 28, 68–72. (In Chinese) [Google Scholar]
  4. Sun, B.; Wang, F.; Xie, J.; Sun, X. Electricity Retailer Trading Portfolio Optimization Considering Risk Assessment in Chinese Electricity Market. Electr. Power Syst. Res. 2021, 190, 106833. [Google Scholar] [CrossRef]
  5. Zhu, B.M.; Zhang, H.; Wang, X.J. Analysis and Evaluation of Project Cost Risk Based on BP Algorithm. Syst. Eng. Procedia 2011, 1, 264–270. [Google Scholar] [CrossRef] [Green Version]
  6. HE, S.B.; Wang, F. Default Risk Level from Voluntary Carbon Market—A Simple but Effective Assessment Method. Int. Bus. Manag. 2015, 10, 124–128. [Google Scholar]
  7. Pritchard, M.P.; Howard, D.R. The Loyal Traveler: Examining a Typology of Service Patronage. J. Travel Res. 1997, 35, 2–10. [Google Scholar] [CrossRef]
  8. Lim, S.; Lee, B. Loyalty programs and dynamic consumer preference in online markets. Decis. Support Syst. 2015, 78, 104–112. [Google Scholar] [CrossRef]
  9. Cheng, K.T.G.; Kasiri, L.A.; Samsinar, M.S.; Sambasivan, M. Integration of standardization and customization: Impact on service quality, customer satisfaction, and loyalty. J. Retail. Consum. Serv. 2017, 35, 91–97. [Google Scholar] [CrossRef]
  10. Silvestre, A.L.; Santos, C.M.; Ramalho, C. Satisfaction and behavioural intentions of cruise passengers visiting the Azores. Tour. Econ. 2008, 14, 169–184. [Google Scholar] [CrossRef]
  11. Paolo, C.; Gabriel, B.J. Tourist’s Intention of Returning to a Visited Destination: Cruise Ship Passengers in Cartagena De Indias, Colombia. Tour. Mar. Environ. 2012, 8, 127–143. [Google Scholar] [CrossRef]
  12. Anderson, E.W.; Fornell, C.; Lehmann, D.R. Customer Satisfaction, Market Share, and Profitability: Findings from Sweden. J. Mark. 1994, 58, 53–66. [Google Scholar] [CrossRef]
  13. Chen, C.F.; Chen, F.S. Experience quality, perceived value, satisfaction and behavioral intentions for heritage tourists. Tour. Manag. 2010, 31, 29–35. [Google Scholar] [CrossRef]
  14. Teye, V.B.; Leclerc, D. Product and service delivery satisfaction among North America cruise passengers. Tour. Manag. 1998, 19, 153–160. [Google Scholar] [CrossRef]
  15. Han, H.; Hwang, J.; Lee, M.J. Antecedents of travellers’ repurchase behaviour for luxury cruise product. Curr. Issues Tour. 2018, 21, 821–841. [Google Scholar] [CrossRef]
  16. Castillo-Manzano, J.I.; López-Valpuesta, L. What does cruise passengers’ satisfaction depend on? Does size really matter? Int. J. Hosp. Manag. 2018, 75, 116–118. [Google Scholar] [CrossRef]
  17. Wu, H.C.; Cheng, C.C.; Ai, C.H. A study of experiential quality, experiential value, trust, corporate reputation, experiential satisfaction and behavioral intentions for cruise tourists: The case of Hong Kong. Tour. Manag. 2018, 66, 200–220. [Google Scholar] [CrossRef]
  18. Bayih, B.E.; Singh, A. Modeling domestic tourism: Motivations, satisfaction and tourist behavioral intentions. Heliyon 2020, 6. [Google Scholar] [CrossRef] [PubMed]
  19. Jones, R.V. Motivations to Cruise: An Itinerary and Cruise Experience Study. J. Hosp. Tour. Manag. 2011, 18, 30–40. [Google Scholar] [CrossRef]
  20. Hung, K.; Petrick, J.F. Why do you cruise? Exploring the motivations for taking cruise holidays, and the construction of a cruising motivation scale. Tour. Manag. 2011, 32, 386–393. [Google Scholar] [CrossRef]
  21. Petrick, J.F. The Roles of Quality, Value, and Satisfaction in Predicting Cruise Passengers’ Behavioral Intentions. J. Travel Res. 2004, 42, 397–407. [Google Scholar] [CrossRef]
  22. Petrick, J.F.; Li, X.R.; Park, S.Y. Cruise Passengers’ Decision-Making Processes. J. Travel Tour. Mark. 2007, 23, 1–14. [Google Scholar] [CrossRef]
  23. Mateus, R.; Ferreira, J.A.; Carreira, J. Multicriteria decision analysis (MCDA): Central Porto high-speed railway station. Eur. J. Oper. Res. 2008, 187, 1–18. [Google Scholar] [CrossRef]
  24. Amaral, T.M.; Costa, A.P.C. Improving decision-making and management of hospital resources: An application of the PROMETHEE II method in an Emergency Department. Oper. Res. Health Care 2014, 3, 1–6. [Google Scholar] [CrossRef]
  25. Wu, Y.; Tao, Y.; Zhang, B.; Wang, S.; Zhou, J. A decision framework of offshore wind power station site selection using a PROMETHEE method under intuitionistic fuzzy environment: A case in China. Ocean Coast. Manag. 2019, 184, 105016. [Google Scholar] [CrossRef]
  26. Mavi, R.K.; Goh, M.; Mavi, N.K. Supplier Selection with Shannon Entropy and Fuzzy TOPSIS in the Context of Supply Chain Risk Management. Procedia Soc. Behav. Sci. 2016, 235, 216–225. [Google Scholar] [CrossRef]
  27. Krishankumar, R.; Ravichandran, K.S.; Saeid, A.B. A new extension to PROMETHEE under intuitionistic fuzzy environment for solving supplier selection problem with linguistic preferences. Appl. Soft Comput. 2017, 60, 564–576. [Google Scholar]
  28. Mete, S.; Serin, F.; Oz, N.E.; Gul, M. A decision-support system based on Pythagorean fuzzy VIKOR for occupational risk assessment of a natural gas pipeline construction. J. Nat. Gas Sci. Eng. 2019, 71, 102979. [Google Scholar] [CrossRef]
  29. Pham, B.T.; Luu, C.; Dao, D.V.; Tran, P.; Nguyen, H.D.; Le, H.V.; Meding, J.V. Flood risk assessment using deep learning integrated with multi-criteria decision analysis. Knowl.-Based Syst. 2021, 219, 106899. [Google Scholar] [CrossRef]
  30. Luu, C.; Meding, J.V.; Mojtahedi, M. Analyzing Vietnam’s national disaster loss database for flood risk assessment using multiple linear regression-TOPSIS. Int. J. Disast. Risk. Reduct. 2019, 40, 101153. [Google Scholar] [CrossRef]
  31. Taylan, O.; Bafail, A.O.; Abdulaal, R.M.S.; Kabli, M.R. A Construction projects selection and risk assessment by fuzzy AHP and fuzzy TOPSIS methodologies. Appl. Soft Comput. 2014, 17, 105–116. [Google Scholar] [CrossRef]
  32. Chen, F.; Wang, J.J.; Deng, Y.J. Road safety risk evaluation by means of improved entropy TOPSIS–RSR. Saf. Sci. 2015, 79, 39–54. [Google Scholar] [CrossRef]
  33. Lamba, N.; Thareja, P. Developing the structural model based on analyzing the relationship between the barriers of green supply chain management using TOPSIS approach. Mater. Today Proc. 2021, 43, 1–8. [Google Scholar] [CrossRef]
  34. Mokrini, A.E.; Kafa, N.; Dafaoui, E.; Mhamedi, A.E.; Berrado, A. Evaluating outsourcing risks in the pharmaceutical supply chain: Case of a multi-criteria combined fuzzy AHP-PROMETHEE approach. IFAC-PapersOnLine 2016, 49, 114–119. [Google Scholar] [CrossRef]
  35. Sennaroglu, B.; Celebi, G.V. A military airport location selection by AHP integrated PROMETHEE and VIKOR methods. Transp. Res. Part D Transp. Environ. 2018, 59, 160–173. [Google Scholar] [CrossRef]
  36. Polat, G.; Damci, A.; Gurgun, A.P.; Demirli, I. Urban Renewal Project Selection Using the Integration of AHP and PROMETHEE Approaches. Procedia Eng. 2016, 164, 339–346. [Google Scholar] [CrossRef]
  37. Akram, M.; Alcantud, J.C.R. An m-Polar Fuzzy PROMETHEE Approach for AHP-Assisted Group Decision-Making. Math. Comput. Appl. 2020, 25, 26. [Google Scholar] [CrossRef]
  38. Chen, S.M. A new method for tool steel materials selection under fuzzy environment. Fuzzy Set. Syst. 1997, 92, 265–274. [Google Scholar] [CrossRef]
  39. Celik, E.; Gul, M.; Aydin, N.; Gumus, A.T.; Guneri, A.F. A comprehensive review of multi criteria decision making approaches based on interval type-2 fuzzy sets. Knowl.-Based Syst. 2015, 85, 329–341. [Google Scholar] [CrossRef]
  40. Atanassov, K.T. More on intuitionistic fuzzy sets. Fuzzy Set. Syst. 1989, 33, 37–45. [Google Scholar] [CrossRef]
  41. Chen, T.Y. A comparative analysis of score functions for multiple criteria decision making in intuitionistic fuzzy setting. Inform. Sci. 2011, 181, 3652–3676. [Google Scholar] [CrossRef]
  42. Chen, T.Y. Multiple criteria decision analysis using a likelihood-based outranking method based on interval-valued intuitionistic fuzzy sets. Inform. Sci. 2014, 286, 188–208. [Google Scholar] [CrossRef]
  43. Wood, D.A. Supplier selection for development of petroleum industry facilities, applying multi-criteria decision making techniques including fuzzy and intuitionistic fuzzy TOPSIS with flexible entropy weighting. J. Nat. Gas. Sci. Eng. 2016, 28, 594–612. [Google Scholar] [CrossRef]
  44. Cavallaro, F.; Zavadskas, E.K.; Streimikiene, D.; Mardani, A. Assessment of concentrated solar power (CSP) technologies based on a modified intuitionistic fuzzy topsis and trigonometric entropy weights. Technol. Forecast. Soc. 2019, 140, 258–270. [Google Scholar] [CrossRef]
  45. Wan, C.; Yan, X.; Zhang, D.; Qu, Z.; Yang, Z. An advanced fuzzy Bayesian-based FMEA approach for assessing maritime supply chain risks. Transp. Res. Part E Logist. Transp. Rev. 2019, 125, 222–240. [Google Scholar] [CrossRef]
  46. Gao, J.; Guo, F.; Ma, Z.; Huang, X. Multi-criteria decision-making framework for large-scale rooftop photovoltaic project site selection based on intuitionistic fuzzy sets. Appl. Softw. Comput. 2021, 102, 107098. [Google Scholar] [CrossRef]
  47. Brans, J.P.; Vincke, P.; Mareschal, B. How to select and how to rank projects: The Promethee method. Eur. J. Oper. Res. 1986, 24, 228–238. [Google Scholar] [CrossRef]
  48. Mohamadabadi, H.S.; Tichkowsky, G.; Kumar, A. Development of a multi-criteria assessment model for ranking of renewable and non-renewable transportation fuel vehicles. Energy 2009, 34, 112–125. [Google Scholar] [CrossRef]
  49. Albadvi, A.; Chaharsooghi, S.K.; Esfahanipour, A. Decision making in stock trading: An application of PROMETHEE. Eur. J. Oper. Res. 2007, 177, 673–683. [Google Scholar] [CrossRef]
  50. Xie, X. Supply Aging of Inland Cruise ships and its solution. China Ship Insp. 2017, 19, 45–48. (In Chinese) [Google Scholar]
Figure 1. Impact Factors in Purchase Preference for Decision Making.
Sustainability 13 12932 g001
Figure 2. The evaluation framework of risk assessment.
Sustainability 13 12932 g002
Figure 3. Components of cruise tourism market.
Sustainability 13 12932 g003
Figure 4. The framework for risk assessment of new-build river cruises.
Sustainability 13 12932 g004
Figure 5. Risk ranking results with different preference function.
Sustainability 13 12932 g005
Table 1. RI values at different orders.
RI Value Table
n 1234567891011
R I 000.580.901.121.241.321.411.451.491.51
Table 2. Categories of risk factors.
CategoryRisk FactorDescription
Tourist demand risk R1Risk of unclear level of tourist market structure R11Unclear hierarchical structure is not conducive to the study of tourist spending capacity and situation, and product design is difficult to accurately match customer needs.
Risk of unclear motivation of tourists R12Motivation is the internal driving force that drives tourists to carry out tourism activities, which will affect tourist consumption behavior and purchase decisions. Unknown motivation can’t accurately design and sell products.
Risk of unclear consumption characteristics of tourists R13Unclear consumption characteristics can’t accurately locate tourist consumption preferences, which is not conducive to further optimize market positioning and meet customer needs.
Risk of fluctuation of tourist demand R14The demand of tourists is vulnerable to the influence of the group, the surrounding environment and culture, so that the perception of cruise products is easy to change.
Market supply risk R2Homogenization risk of cruise products R21Homogenization leads to no comparative advantage and no attraction to consumers, and there is vicious low-price competition, which can hinder the long-term development of market.
Risk of improper product marketing R22The commonly used charter and cabin-cutting sales mode adopts low-price competition to aggravate the market supply competition.
Risk of backwardness of support facilities R23The lack of matching of port and terminal facilities with cruise ships affects tourism experience and long-term development, and there are security risks.
Risk of simplification of tourism route design R24The singleness of the route design and the lack of connection with the coastal resources lead to the inability to highlight the characteristics of inland river tourism and face the pressure of sea cruise tourism.
Risk of shortage of cruise operation and management personnel R25The lack of cruise operation and management personnel affects the overall service level of cruise ships, resulting in poor tourist experience.
Risk of inadequate management of tourism market R26The lack of coordination of information among coastal management agencies and low administrative efficiency lead to non-standard management, man-made tourism safety accidents and not conducive to the integration of coastal resources, ultimately affecting tourist sense of experience and safety.
External market risk R3Risk of economic environment fluctuation R31The price of cruise tourism, which belongs to high-end tourism products, is relatively high. Thus changes in the economic environment, such as economic crisis and exchange rate changes, having a great impact on the tourism market.
Risk of sudden security crisis R32The occurrence of infectious or mass diseases of unknown causes will seriously affect the physical and mental health of tourists, taking a long time for the market to recover.
Risk of natural disaster risk R33Mountain torrents and storms directly affect the normal operation of cruise ships, posing a threat to the safety of tourists and having a short and serious impact on the market.
Table 3. Statement of evaluation criteria.
Evaluation CriteriaDescription
Impact on the long-term development of the market C1Indicates the long-term and far-reaching impact on the development of the market when there is a certain risk.
Impact on the consistency of supply and demand in the market C2Indicates the extent to which the supply of products meets the needs of tourists when there is a certain risk.
Impact on tourist safety C3Indicates the severity of the impact on tourist safety and psychological repercussions when there is a certain risk.
Impact on tourist decision-making C4Indicates the degree of influence on tourist decision to choose a cruise when there is a certain risk.
Risk controllable degree C5Indicates the difficulty of taking control or mitigation measures to reduce a risk when it occurs.
Table 4. The fuzzy linguistic term for risk factors.
Influence LevelLinguistic VariablesIntuitionistic Fuzzy Values
1Very slightEasy to control (manage)(0.10, 0.85)
2SlightRelatively easy to control (manage)(0.30, 0.60)
3MediumRelatively difficult to control (manage)(0.50, 0.40)
4SevereDifficult to control (manage)(0.75, 0.15)
5DangerousForce majeure(0.85, 0.10)
Table 5. Evaluation criterion weights.
Evaluation CriterionWeights
Impact on the long-term development of the market C10.329
Impact on tourist safety C30.289
Impact on the consistency of supply and demand in the market C20.159
Risk controllable degree C50.133
Impact on tourist decision-making C40.090
Table 6. Evaluation value in IFNS of risk factors.
IndexC1C2C3C4C5
R112.36542.64961.13722.60501.7123
R122.66552.69881.47422.69882.3654
R132.60502.68631.22092.64962.3654
R142.68632.68630.88182.64961.9809
R212.70632.66551.71232.69882.6655
R222.68631.98090.88182.19092.3654
R232.68632.64962.68632.66552.6863
R242.67632.64961.47422.68632.6050
R252.64962.60501.98092.36542.5556
R262.60502.60502.68632.47212.4721
R312.47211.78060.88182.25422.6199
R322.68632.56892.69882.70632.6988
R331.98091.47422.68632.66552.6863
Table 7. The distance between risk factors.
IndexC1C2C3C4C5
d (R11, R12)−0.300 −0.049 −0.337 −0.094 −0.653
d (R11, R13)−0.240 −0.037 −0.084 −0.045 −0.653
d (R11, R14)−0.321 −0.037 0.255 −0.045 −0.269
d (R11, R21)−0.341 −0.016 −0.575 −0.094 −0.953
d (R11, R22)−0.321 0.669 0.255 0.414 −0.653
d (R11, R23)−0.321 0.000 −1.549 −0.061 −0.974
d (R11, R24)−0.311 0.000 −0.337 −0.081 −0.893
d (R11, R25)−0.284 0.045 −0.844 0.240 −0.843
d (R11, R26)−0.240 0.045 −1.549 0.133 −0.760
d (R11, R31)−0.107 0.869 0.255 0.351 −0.908
d (R11, R32)−0.321 0.081 −1.562 −0.101 −0.987
d (R11, R33)0.384 1.175 −1.549 −0.061 −0.974
Table 8. Results of risk prioritization.
Index φ + ( a ) φ ( a ) Net   Flow   ( a ) Ranking
R110.175 0.642 −0.467 12
R120.338 0.238 0.101 7
R130.261 0.345 −0.084 8
R140.205 0.372 −0.167 9
R210.457 0.128 0.329 3
R220.150 0.537 −0.387 11
R230.478 0.015 0.463 1
R240.436 0.174 0.262 4
R250.378 0.246 0.132 6
R260.380 0.199 0.182 5
R310.120 0.684 −0.564 13
R320.485 0.043 0.442 2
R330.326 0.493 −0.167 9
Table 9. Ranking of different p in V-shape criterion.
Index p =   0.15 p = 0.25 p = 0.35 p = 0.45
R1112121212
R125777
R138888
R14991010
R213333
R2211111111
R231111
R244445
R257666
R266554
R3113131313
R322222
R3310999
Publisher’s Note: MDPI stays neutral with regard to jurisdictional claims in published maps and institutional affiliations.

