
Modelling Multi-Species Connectivity at the Kafue-Zambezi Interface: Implications for Transboundary Carnivore Conservation


Abstract
:1. Introduction
2. Methods
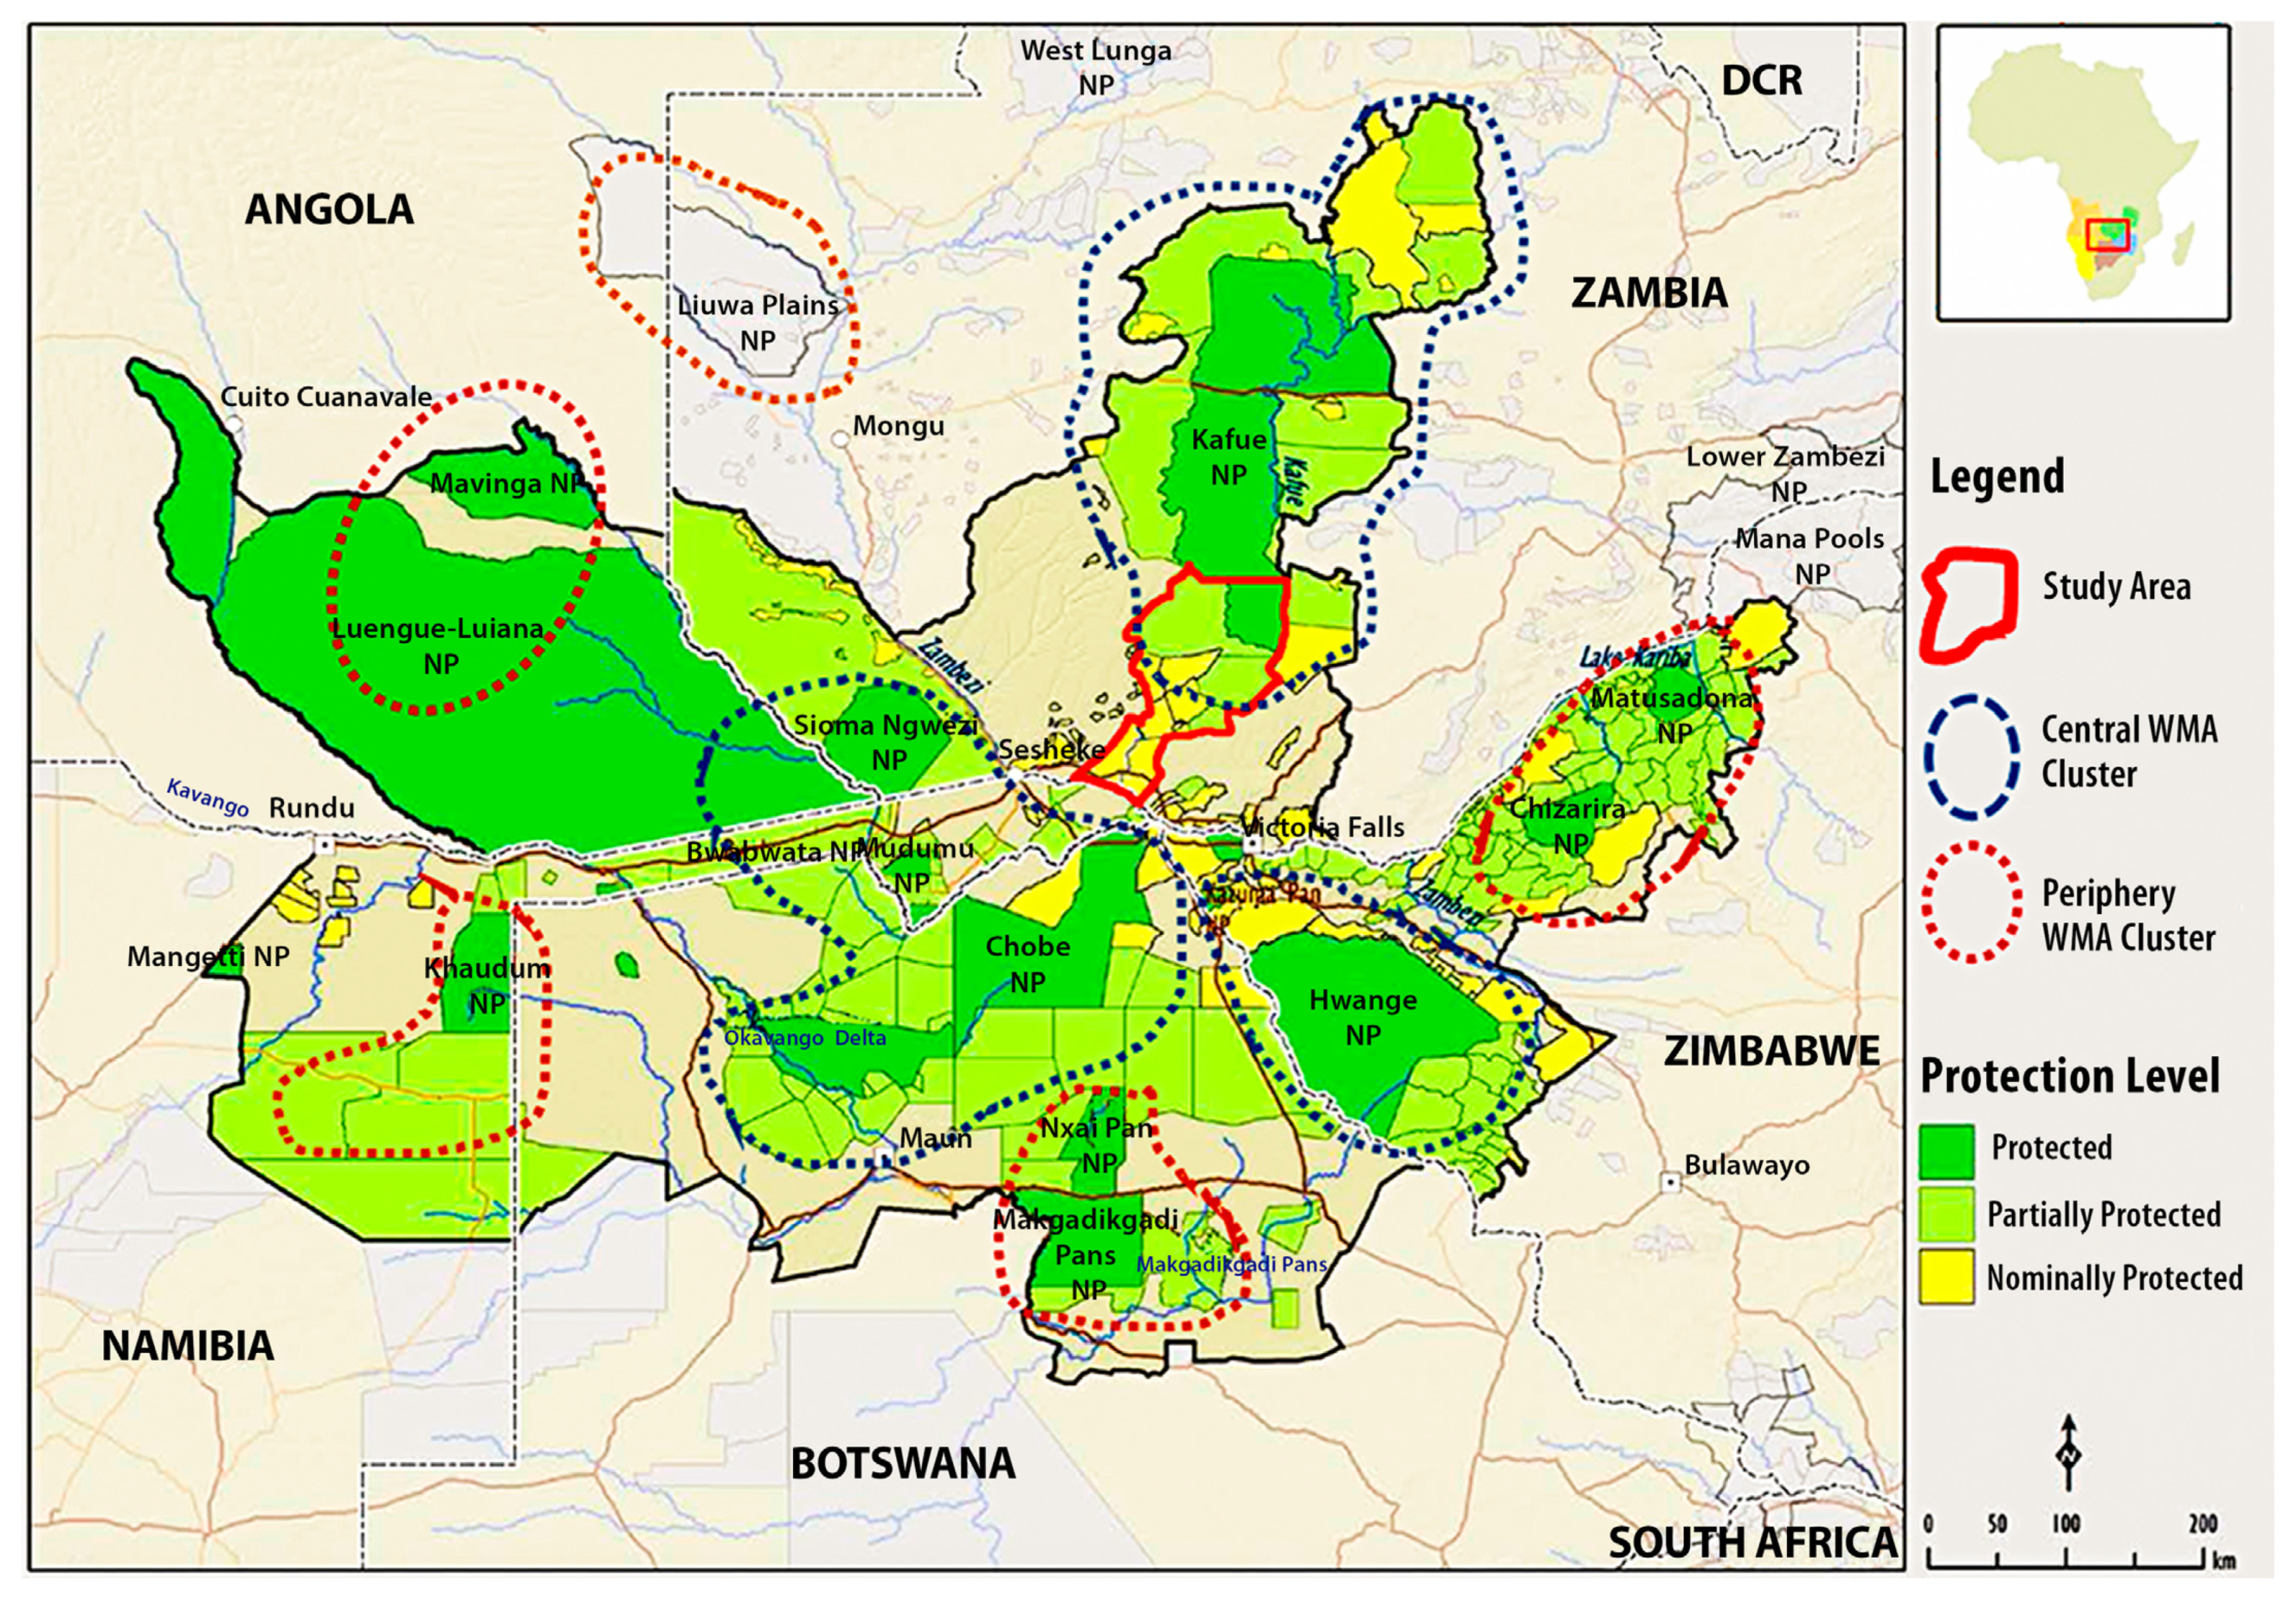
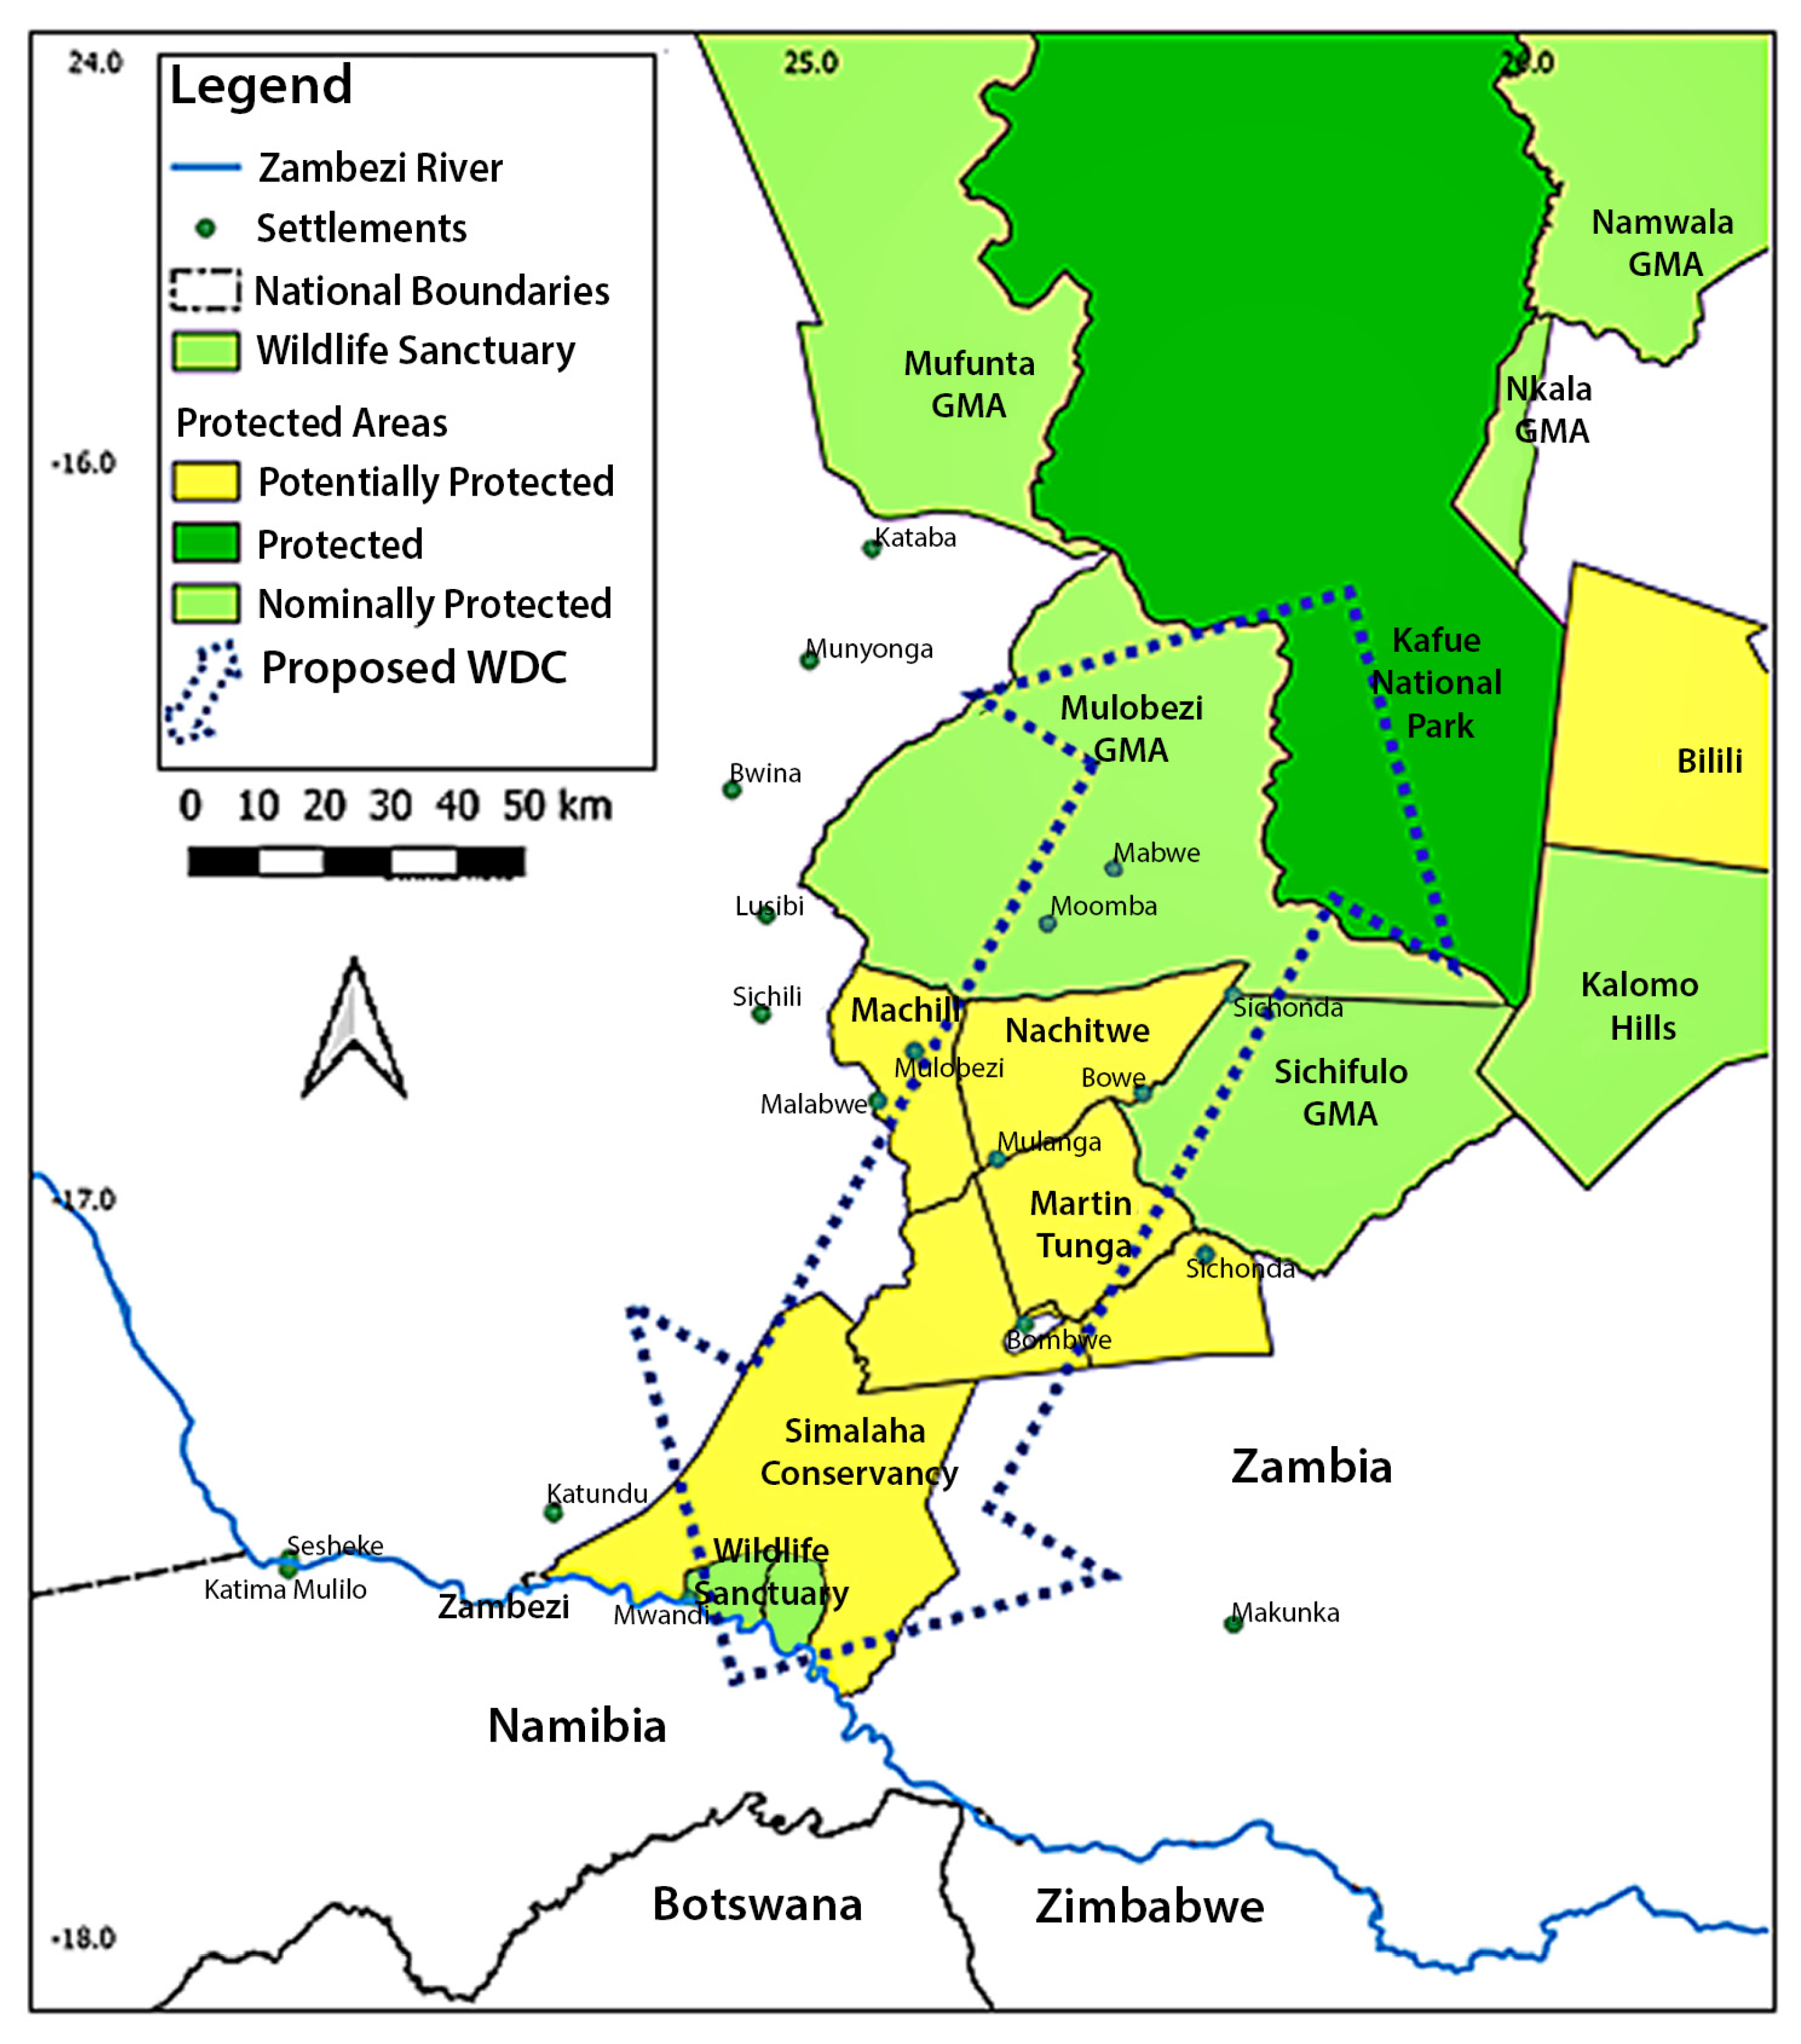
2.1. Study Area
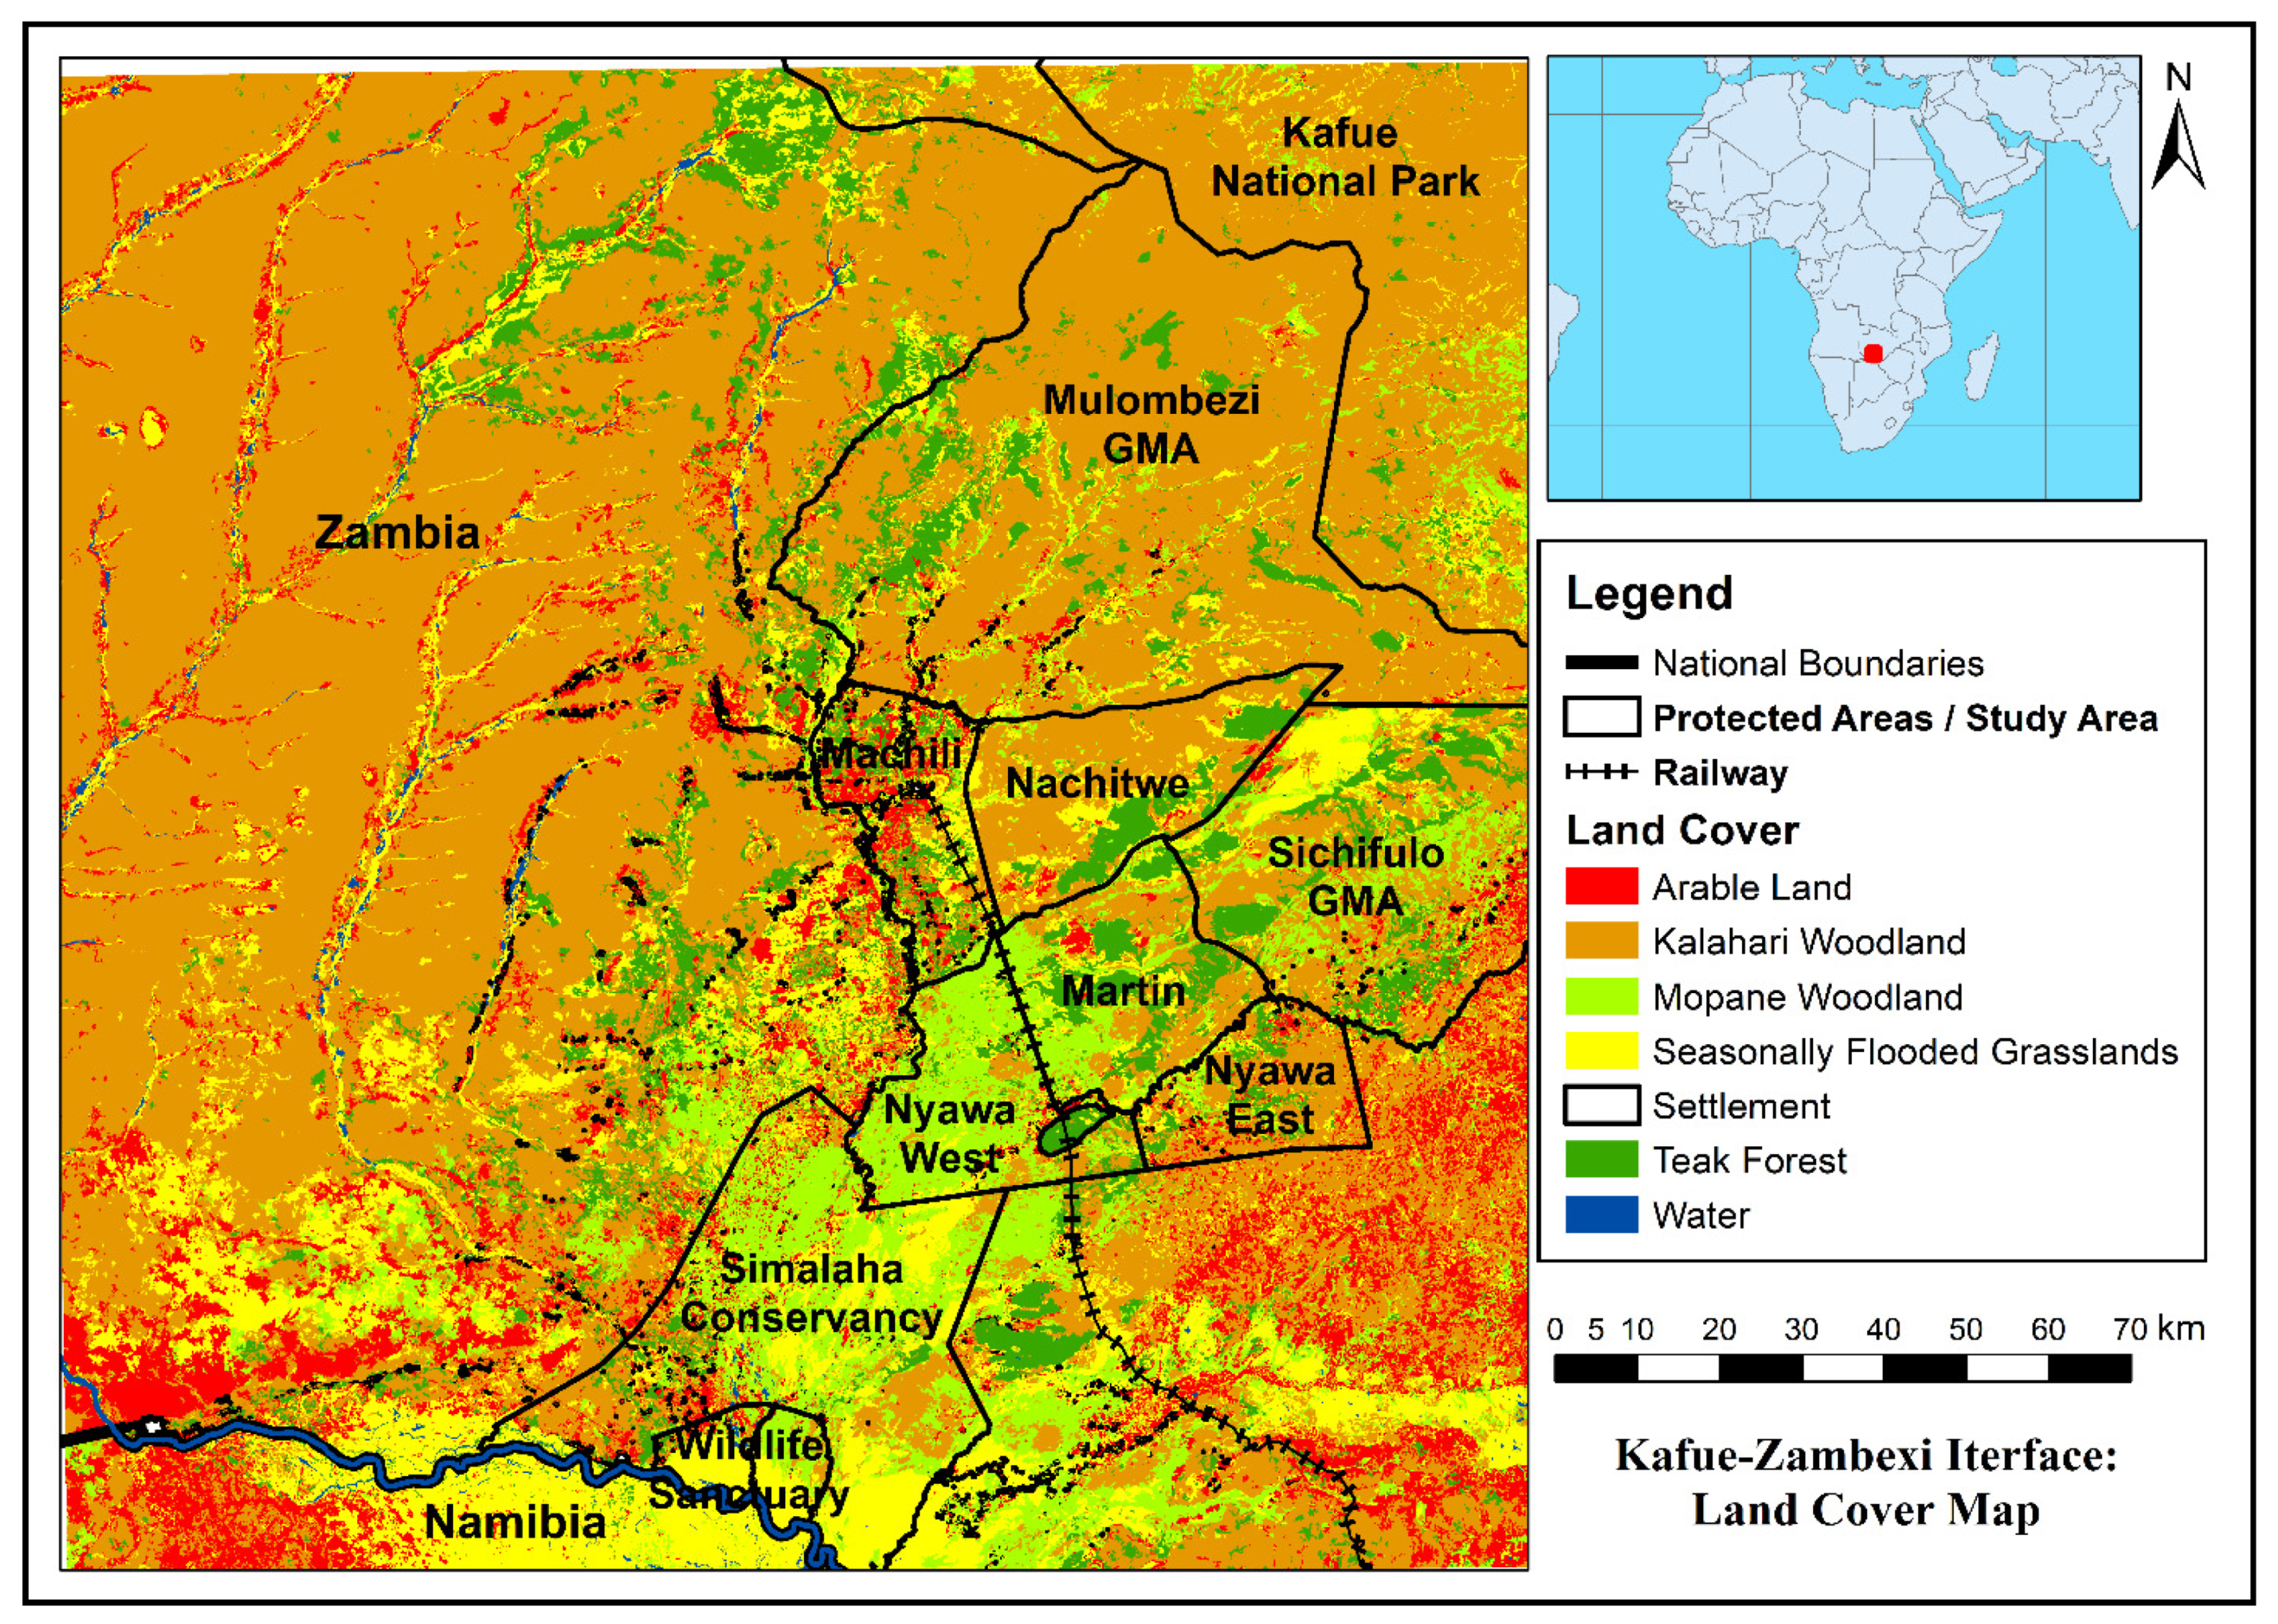
2.2. Landcover Mapping
2.3. Habitat Suitability Modelling

| Predictor Variables | |||
|---|---|---|---|
| 1 | Proportion of arable land (3) | 10 | Distance to minor roads (unpaved) (1,2) |
| 2 | Proportion of Kalahari woodland (3) | 11 | Distance to major and minor roads, combined (1,2) |
| 3 | Proportion of Mopane woodland (3) | 12 | Distance to major, minor roads & rail, combined (1,2) |
| 4 | Proportion of Teak woodland (3) | 13 | Distance to train tracks (1) |
| 5 | Proportion of grassland (3) | 14 | Altitude (DEM) (4) |
| 6 | Proportion of settlements (at 1, 2 and 3 km radius) (3) | 15 | Topographic Position Index (4) |
| 7 | Distance to water (4) | 16 | Slope (4) |
| 8 | Distance to settlements (4) | 17 | Enhanced Vegetation Index (5) |
| 9 | Distance to major roads (paved) (2) | ||
2.4. Connectivity Modelling
3. Results
3.1. Land Cover Mapping
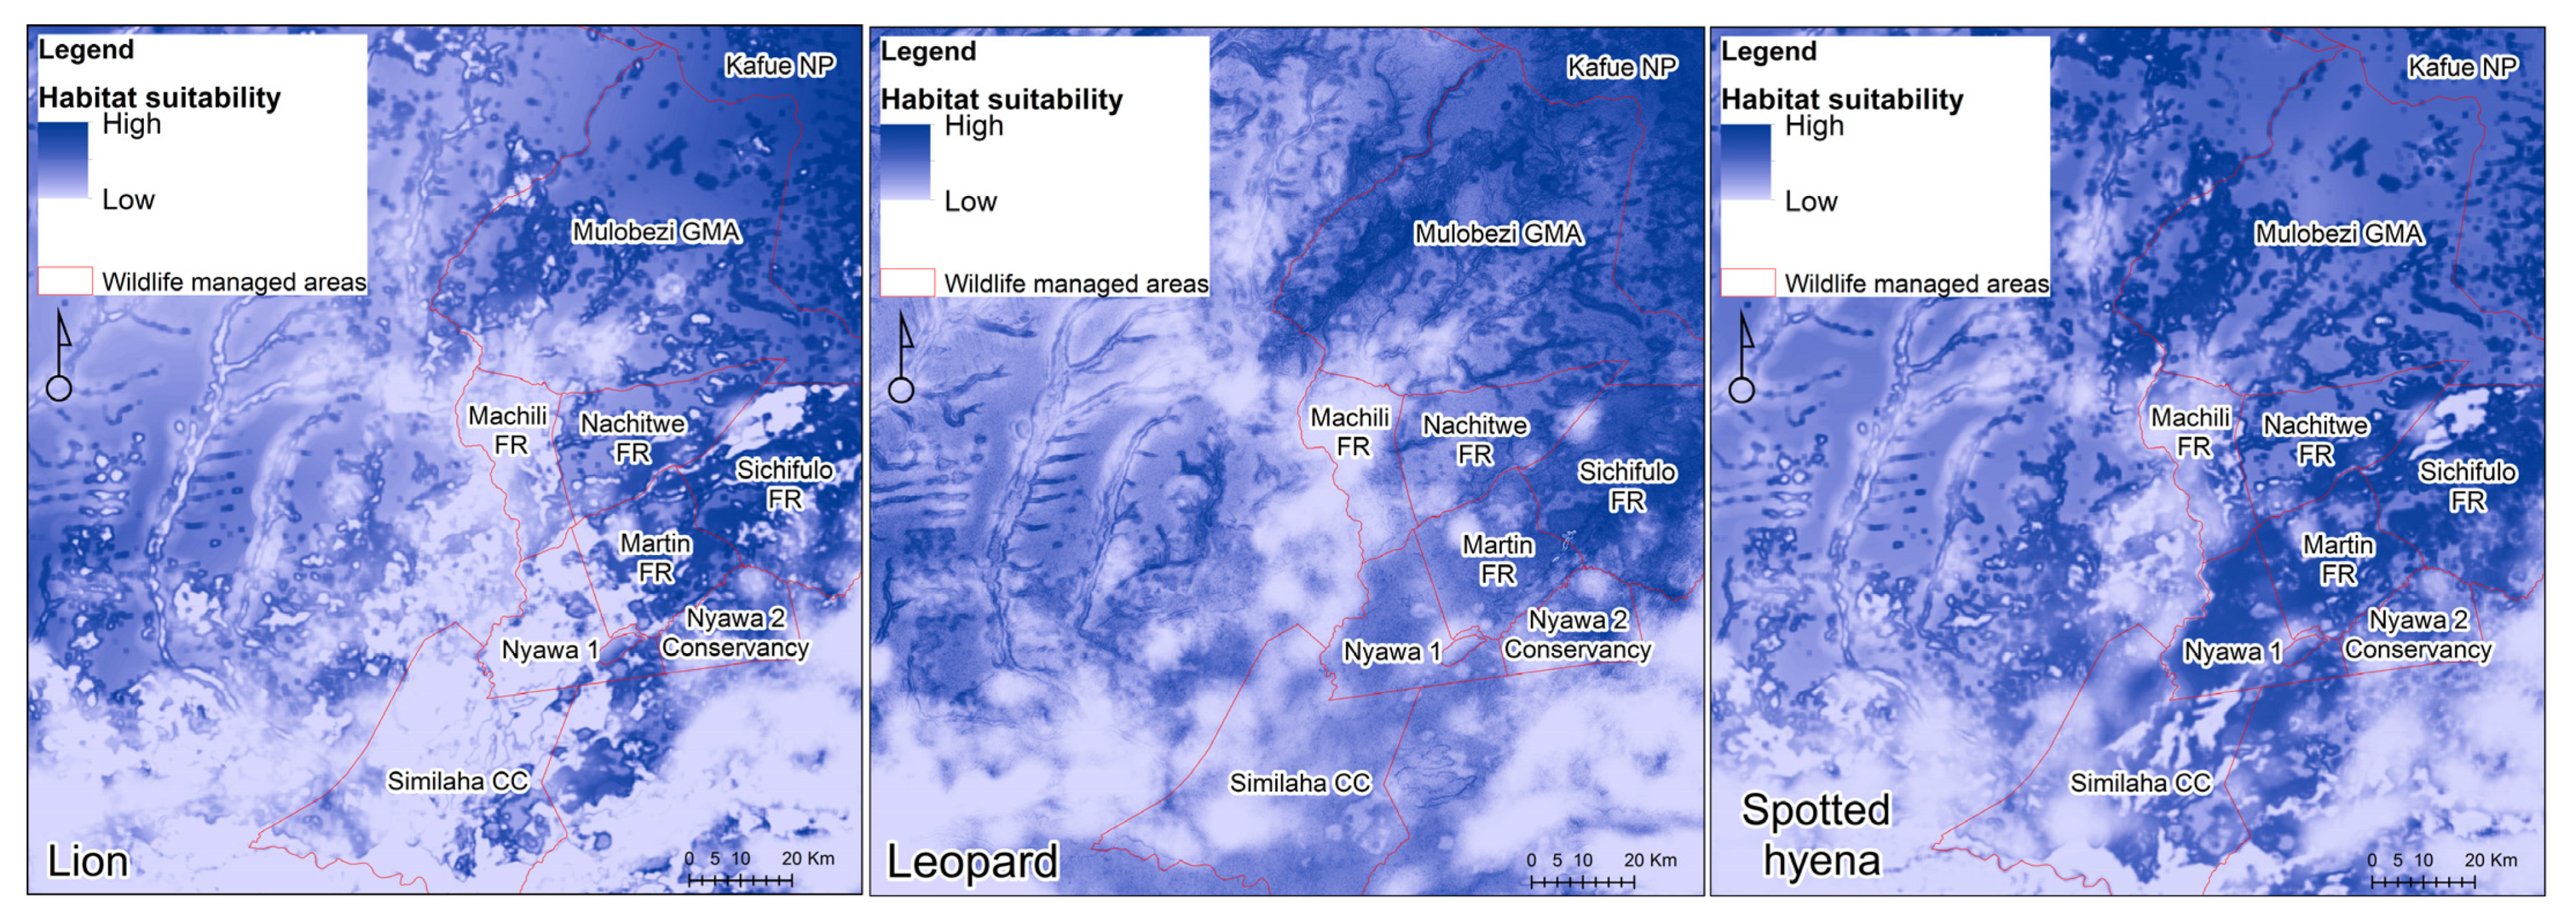
3.2. MaxEnt Habitat Suitability Models
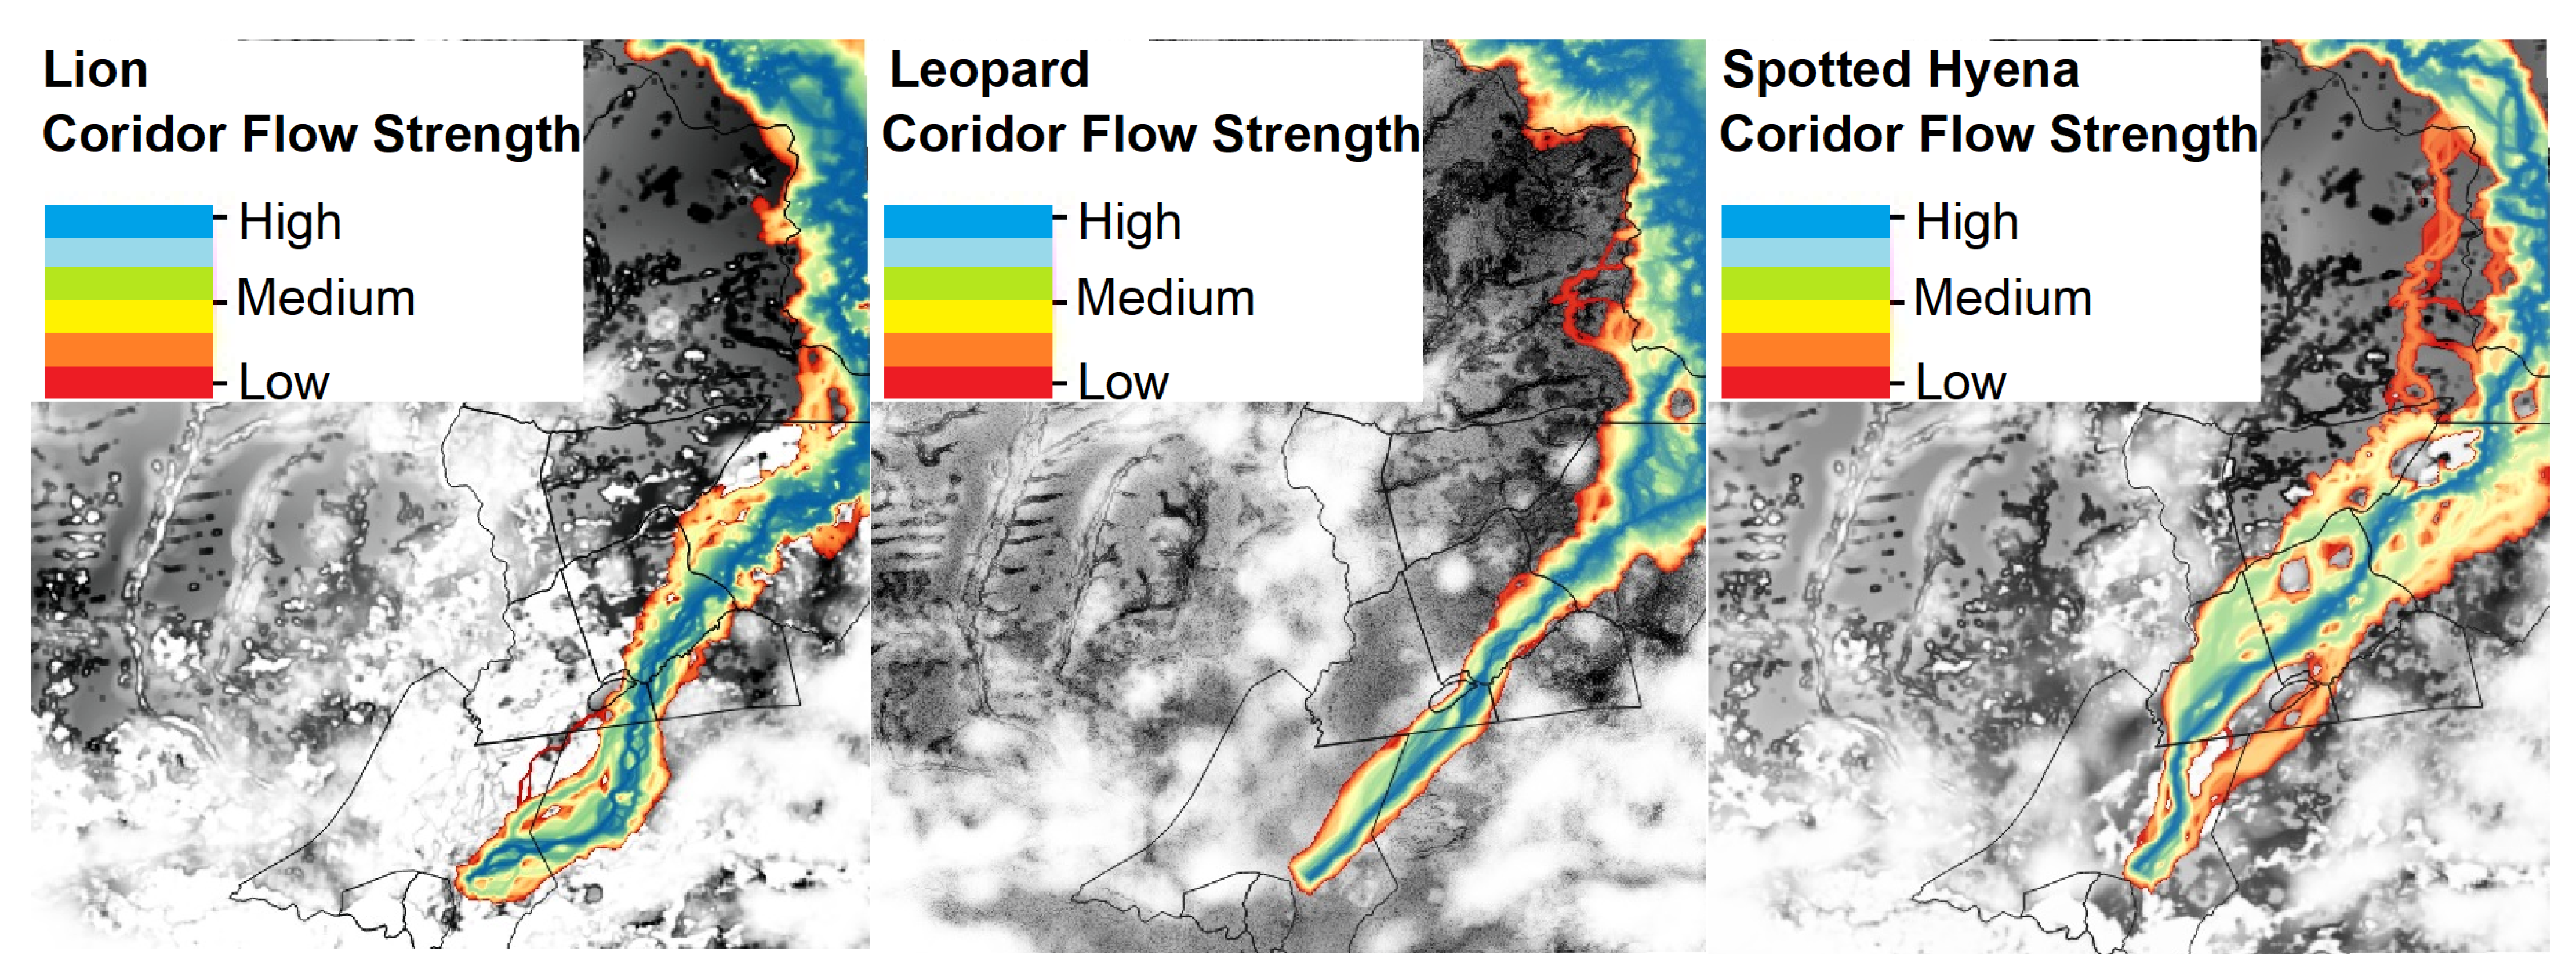
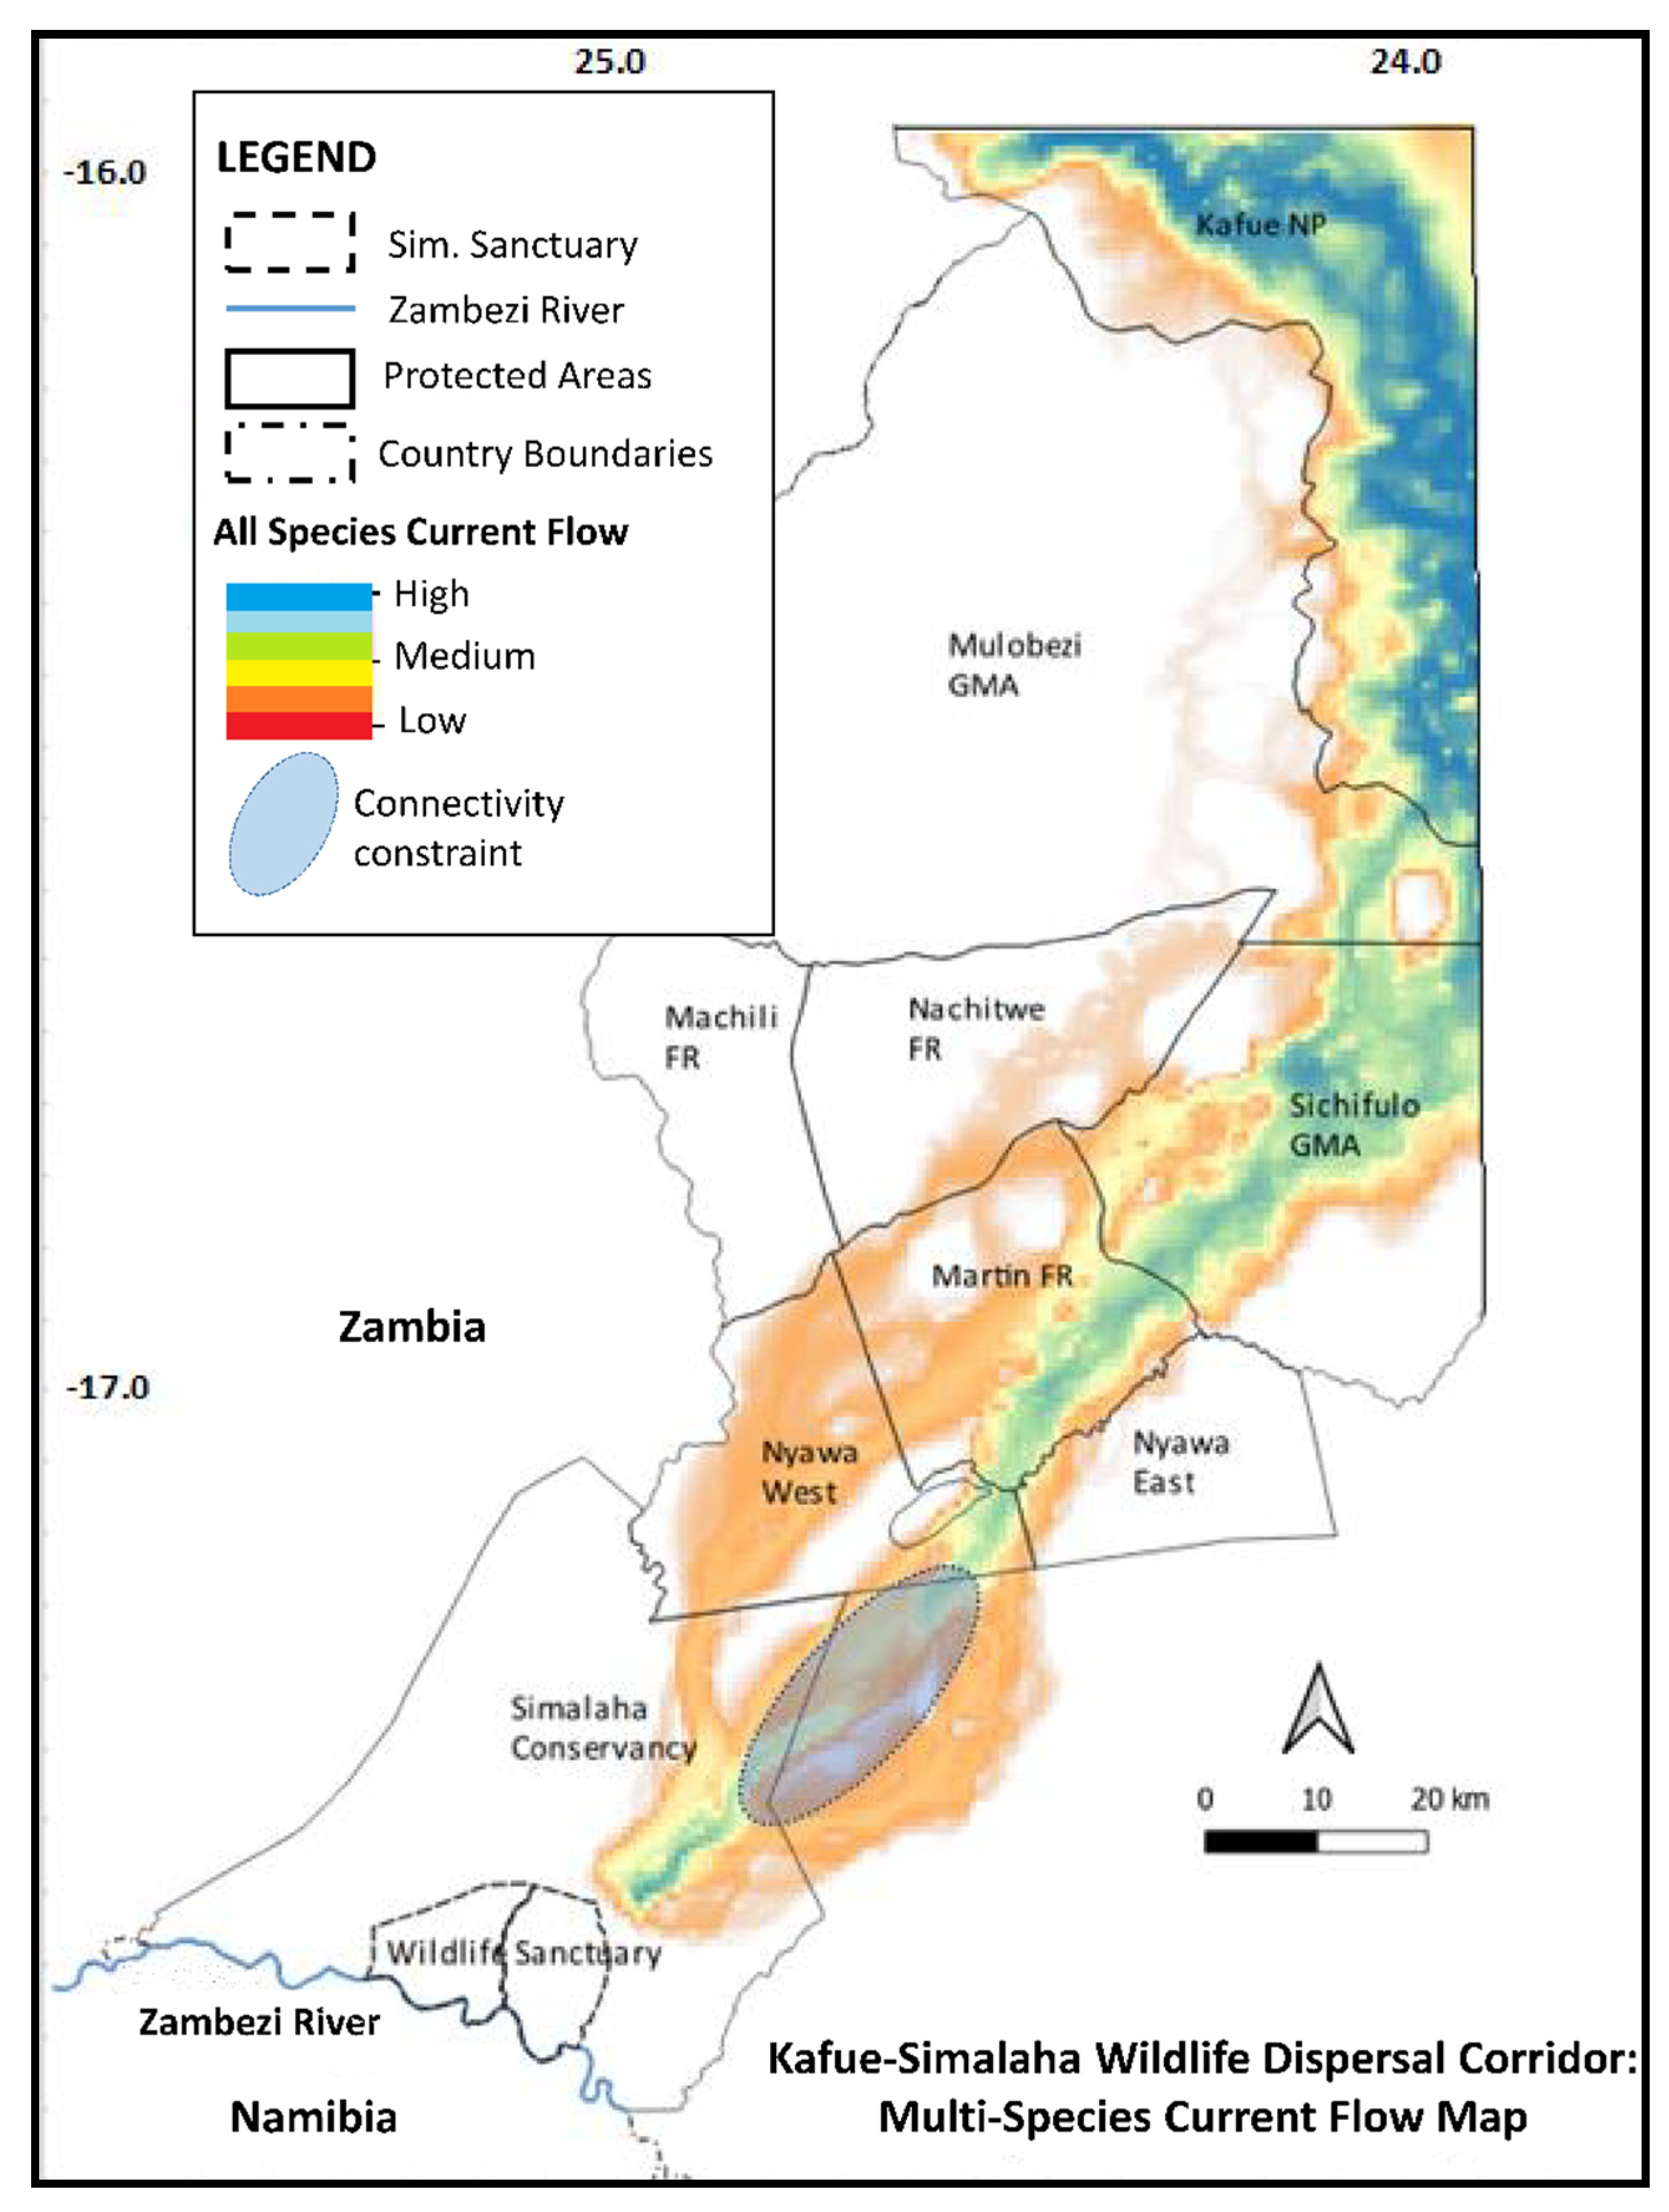
3.3. Connectivity Modelling
4. Discussion
5. Conclusions
Supplementary Materials
Author Contributions
Funding
Institutional Review Board Statement
Informed Consent Statement
Acknowledgments
Conflicts of Interest
References
- Maxwell, S.L.; Fuller, R.A.; Brooks, T.M.; Watson, J.E. Biodiversity: The ravages of guns, nets and bulldozers. Nat. News 2016, 546, 143. [Google Scholar] [CrossRef] [PubMed]
- Di Marco, M.; Boitani, L.; Mallon, D.; Hoffmann, M.; Iacucci, A.; Meijaard, E.; Visconti, P.; Schipper, J.; Rondinini, C. A retrospective evaluation of the global decline of carnivores and ungulates. Conserv. Biol. 2014, 28, 1109–1118. [Google Scholar] [CrossRef] [PubMed]
- Purvis, A.; Gittleman, J.L.; Cowlishaw, G.; Mace, G.M. Predicting extinction risk in declining species. Proc. Biol. Sci. 2000, 267, 1947–1952. [Google Scholar] [CrossRef] [PubMed] [Green Version]
- Cardillo, M.; Mace, G.M.; Jones, K.E.; Bielby, J.; Bininda-Emonds, O.R.; Sechrest, W.; Orme, C.D.; Purvis, A. Multiple causes of high extinction risk in large mammal species. Science 2005, 309, 1239–1241. [Google Scholar] [CrossRef] [Green Version]
- Ripple, W.J.; Estes, J.A.; Beschta, R.L.; Wilmers, C.C.; Ritchie, E.G.; Hebblewhite, M.; Berger, J.; Elmhagen, B.; Letnic, M.; Nelson, M.P. Status and ecological effects of the world’s largest carnivores. Science 2014, 343, 124–148. [Google Scholar] [CrossRef] [Green Version]
- Wolf, C.; Ripple, W.J. Range contractions of the world’s large carnivores. R. Soc. Open Sci. 2017, 4, 170052. [Google Scholar] [CrossRef] [Green Version]
- Cushman, S.A.; McRae, B.; Adriaensen, F.; Beier, P.; Shirley, M.; Zeller, K. Biological corridors and connectivity. In Key Topics in Conservation Biology 2; Macdonald, D.W., Willis, K.J., Eds.; Wiley-Blackwell: Hoboken, NJ, USA, 2013; pp. 384–404. [Google Scholar]
- Fahrig, L. Effects of habitat fragmentation on biodiversity. Annu. Rev. Ecol. Evol. Syst. 2003, 34, 487–515. [Google Scholar] [CrossRef] [Green Version]
- Crooks, K.R.; Burdett, C.L.; Theobald, D.M.; Rondinini, C.; Boitani, L. Global patterns of fragmentation and connectivity of mammalian carnivore habitat. Philosophical Transactions of the Royal Society B. Biol. Sci. 2011, 366, 2642–2651. [Google Scholar] [CrossRef] [PubMed]
- Funston, P.J.; Groom, R.J.; Lindsey, P.A. Insights into the management of large carnivores for profitable wildlife-based land uses in African savannas. PLoS ONE 2013, 8, e59044. [Google Scholar] [CrossRef]
- KAZA. Treaty Between the Governments of Angola, Botswana, Namibia, Zambia and Zimbabwe on the Establishment of the Kavango–Zambezi Transfrontier Conservation Area; Kavango–Zambezi TFCA Secretariat: Kasane, Botswana, 2011. [Google Scholar]
- Cumming, D.H.M.; Anderson, J.A.; de Garine-Wichatitsky, M.; Dzingirai, V.; Giller, K.E. Whither TFCAs and people on the edge in Southern Africa? In Transfrontier Conservation Areas: People Living on the Edge; Andersson, J.A., de Garine-Wichatitsky, M., Cumming, D., Dzingirai, V., Giller, K., Eds.; Taylor & Francis: London, UK, 2017; pp. 192–203. [Google Scholar]
- Pullinger, M.G.; Johnson, C.J. Maintaining or restoring connectivity of modified landscapes: Evaluating the least-cost path model with multiple sources of ecological information. Landsc. Ecol. 2010, 25, 1547–1560. [Google Scholar] [CrossRef]
- Hofmann, D.D.; Behr, D.M.; McNutt, J.W.; Ozgul, A.; Cozzi, G. Bound within boundaries: Do protected areas cover movement corridors of their most mobile, protected species? J. Appl. Ecol. 2021, 58, 1133–1144. [Google Scholar] [CrossRef]
- Cumming, D.H. Large Scale Conservation Planning and Priorities for the Kavango-Zambezi Transfrontier Conservation Area; Conservation International: Arlington, VA, USA, 2008. [Google Scholar]
- ΚAΖA. Master Integrated Development Plan; KAZA Secretariat. Victoria Falls: Kasane, Botswana, 2014. [Google Scholar]
- Worboys, G.; Francis, W.L.; Lockwood, M. Connectivity Conservation Management: A Global Guide (with Particular Reference to Mountain Connectivity Conservation); Earthscan: London, UK; Washington, DC, USA, 2010. [Google Scholar]
- UNEP-WCMC. United Nations Environment Programmes World Conservation Monitoring Centre. Protected Planet Database. 2015. Available online: https://www.protectedplanet.net/ (accessed on 1 May 2015).
- PPF. Integrated Development Plan for the Zambian Component of the Kavango-Zambezi Transfrontier Conservation Area; Peace Parks Foundation: Stellenbosch, South Africa, 2008. [Google Scholar]
- ZAWA. General Management Plan for Kafue National Park; ZAWA: Chilanga, Zambia, 2010. [Google Scholar]
- Geldmann, J.; Manica, A.; Burgess, N.D.; Coad, L.; Balmford, A. A global-level assessment of the effectiveness of protected areas at resisting anthropogenic pressures. Proc. Natl. Acad. Sci. USA 2019, 116, 23209–23215. [Google Scholar] [CrossRef]
- IUCN; UNEP-WCMC. The World Database on Protected Areas (WDPA). Available online: https://www.protectedplanet.net/ (accessed on 1 May 2015).
- Lines, R.; Tzanopoulos, J.; MacMillan, D. Status of terrestrial mammals at the Kafue–Zambezi interface: Implications for transboundary connectivity. Oryx 2018, 53, 764–773. [Google Scholar] [CrossRef]
- Machina, H. Land is Life. In Land Policy and Administration in Zambia; 2005; pp. 1–5. [Google Scholar]
- eCognition Developer, T. 9.0 User Guide; Trimble Germany GmbH: Munich, Germany, 2014.
- Drusch, M.; Del Bello, U.; Carlier, S.; Colin, O.; Fernandez, V.; Gascon, F.; Hoersch, B.; Isola, C.; Laberinti, P.; Martimort, P. Sentinel-2: ESA’s optical high-resolution mission for GMES operational services. Remote Sens. Environ. 2012, 120, 25–36. [Google Scholar] [CrossRef]
- ESRI. Environmental Systems Research Institute.ArcGIS Release 10.1; ESRI: Redlands, CA, USA, 2012. [Google Scholar]
- Congalton, R.G. A review of assessing the accuracy of classifications of remotely sensed data. Remote Sens. Environ. 1991, 37, 35–46. [Google Scholar] [CrossRef]
- Ortigosa, G.R.; De Leo, G.A.; Gatto, M. VVF: Integrating modelling and GIS in a software tool for habitat suitability assessment. Environ. Model. Softw. 2000, 15, 1–12. [Google Scholar] [CrossRef]
- Phillips, S.J.; Anderson, R.P.; Schapire, R.E. Maximum entropy modeling of species geographic distributions. Ecol. Model. 2006, 190, 231–259. [Google Scholar] [CrossRef] [Green Version]
- Elith, J.; Phillips, S.J.; Hastie, T.; Dudík, M.; Chee, Y.E.; Yates, C.J. A statistical explanation of MaxEnt for ecologists. Divers. Distrib. 2011, 17, 43–57. [Google Scholar] [CrossRef]
- Jackson, C.R.; Marnewick, K.; Lindsey, P.A.; Røskaft, E.; Robertson, M.P. Evaluating habitat connectivity methodologies: A case study with endangered African wild dogs in South Africa. Landsc. Ecol. 2016, 31, 1433–1447. [Google Scholar] [CrossRef]
- Di Minin, E.; Macmillan, D.C.; Goodman, P.S.; Escott, B.; Slotow, R.; Moilanen, A. Conservation businesses and conservation planning in a biological diversity hotspot. Conserv. Biol. 2013, 27, 808–820. [Google Scholar] [CrossRef] [PubMed] [Green Version]
- Angelieri, C.C.S.; Adams-Hosking, C.; Barros, D.; Micchi, K.M.P.; de Souza, M.P.; McAlpine, C.A. Using species distribution models to predict potential landscape restoration effects on puma conservation. PLoS ONE 2016, 11, e0145232. [Google Scholar] [CrossRef] [PubMed]
- Ahmadi, M.; Nezami Balouchi, B.; Jowkar, H.; Hemami, M.; Fadakar, D.; Malakouti-Khah, S.; Ostrowski, S. Combining landscape suitability and habitat connectivity to conserve the last surviving population of cheetah in Asia. Divers. Distrib. 2017, 23, 592–603. [Google Scholar] [CrossRef] [Green Version]
- Team, Q.D. QGIS Geographic Information System. Open Source Geospatial Foundation Project. 2016. Available online: http://qgis.osgeo.org (accessed on 20 December 2016).
- Fitzpatrick, M.C.; Gotelli, N.J.; Ellison, A.M. MaxEnt versus MaxLike: Empirical comparisons with ant species distributions. Ecosphere 2013, 4, 1–15. [Google Scholar] [CrossRef]
- Merow, C.; Smith, M.J.; Silander, J.A., Jr. A practical guide to MaxEnt for modeling species’ distributions: What it does, and why inputs and settings matter. Ecography 2013, 36, 1058–1069. [Google Scholar] [CrossRef]
- Parolo, G.; Rossi, G.; Ferrarini, A. Toward improved species niche modelling: Arnica montana in the Alps as a case study. J. Appl. Ecol. 2008, 45, 1410–1418. [Google Scholar] [CrossRef]
- Chen, F.; Du, Y.; Niu, S.; Zhao, J. Modeling forest lightning fire occurrence in the Daxinganling Mountains of Northeastern China with MAXENT. Forests 2015, 6, 1422–1438. [Google Scholar] [CrossRef] [Green Version]
- Moreno-Amat, E.; Mateo, R.G.; Nieto-Lugilde, D.; Morueta-Holme, N.; Svenning, J.C.; García-Amorena, I. Impact of model complexity on cross-temporal transferability in Maxent species distribution models: An assessment using paleobotanical data. Ecol. Model. 2015, 312, 308–317. [Google Scholar] [CrossRef]
- Çoban, H.O.; Örücü, Ö.K.; Arslan, E.S. MaxEnt modeling for predicting the current and future potential geographical distribution of Quercus libani Olivier. Sustainability 2020, 12, 2671. [Google Scholar] [CrossRef] [Green Version]
- PPF. In House Dataset for the Zambian Component of the Kavango-Zambezi Transfrontier Conservation Area. Unpublished Data; Peace Parks Foundation: Stellenbosch, South Africa, 2016. [Google Scholar]
- McRae, B.H.; Kavanagh, D.M. Linkage Mapper Connectivity Analysis Software; The Nature Conservancy: Seattle, WA, USA, 2011. [Google Scholar]
- Wolf, C.; Ripple, W.J. Rewilding the world’s large carnivores. R. Soc. Open Sci. 2018, 5, 172–235. [Google Scholar] [CrossRef] [PubMed] [Green Version]
- Castilho, C.S.; Hackbart, V.C.; Pivello, V.R.; dos Santos, R.F. Evaluating landscape connectivity for Puma concolor and Panthera onca among Atlantic forest protected areas. Environ. Manag. 2015, 55, 1377–1389. [Google Scholar] [CrossRef] [PubMed]
- Carroll, C.; McRAE, B.H.; Brookes, A. Use of linkage mapping and centrality analysis across habitat gradients to conserve connectivity of gray wolf populations in western North America. Conserv. Biol. 2012, 26, 78–87. [Google Scholar] [CrossRef] [PubMed]
- Musgrave, M. Scale, Governance and Change in Zambezi Teak Forests: Sustainable Development for Commodity and Community; Cambridge Scholars Publishing: Newcastle upon Tyne, UK, 2016. [Google Scholar]
- Wittemyer, G.; Elsen, P.; Bean, W.T.; Burton, A.C.; Brashares, J.S. Accelerated human population growth at protected area edges. Science 2008, 321, 123–126. [Google Scholar] [CrossRef] [PubMed] [Green Version]
- Watson, F.G.; Becker, M.S.; Milanzi, J.; Nyirenda, M. Human encroachment into protected area networks in Zambia: Implications for large carnivore conservation. Reg. Environ. Chang. 2015, 15, 415–429. [Google Scholar] [CrossRef]
- Beier, P.; Majka, D.R.; Spencer, W.D. Forks in the road: Choices in procedures for designing wildland linkages. Conserv. Biol. 2008, 22, 36–851. [Google Scholar] [CrossRef]
- Yirga, G.; Leirs, H.; De Iongh, H.H.; Asmelash, T.; Gebrehiwot, K.; Deckers, J.; Bauer, H. Spotted hyena (Crocuta crocuta) concentrate around urban waste dumps across Tigray, northern Ethiopia. Wildl. Res. 2016, 42, 563–569. [Google Scholar] [CrossRef]
- Athreya, V.; Odden, M.; Linnell, J.D.; Krishnaswamy, J.; Karanth, U. Big cats in our backyards: Persistence of large carnivores in a human dominated landscape in India. PLoS ONE 2013, 8, e57872. [Google Scholar] [CrossRef] [Green Version]
- Woodroffe, R. Predators and people: Using human densities to interpret declines of large carnivores. Anim. Conserv. Forum 2000, 3, 165–173. [Google Scholar] [CrossRef]
- Linnell, J.D.; Thomassen, J.; Jones, K. Wildlife-Human Interactions: From Conflict to Coexistence in Sustainable Landscapes; Norsk Institutt for Naturforskning (NINA): Trondheim, Norway, 2011. [Google Scholar]
- Trombulak, S.C.; Frissell, C.A. Review of ecological effects of roads on terrestrial and aquatic communities. Conserv. Biol. 2000, 14, 18–30. [Google Scholar] [CrossRef]
- Coffin, A.W. From roadkill to road ecology: A review of the ecological effects of roads. J. Transp. Geogr. 2007, 15, 396–406. [Google Scholar] [CrossRef]
- Forman, R.T.; Sperling, D.; Bissonette, J.A.; Clevenger, A.P.; Cutshall, C.D.; Dale, V.H.; Fahrig, L.; France, R.L.; Heanue, K.; Goldman, C.R. Road Ecology: Science and Solutions; Island Press: Washington, DC, USA, 2003. [Google Scholar]
- Elliot, N.B.; Cushman, S.A.; Loveridge, A.J.; Mtare, G.; Macdonald, D.W. Movements vary according to dispersal stage, group size, and rainfall: The case of the African lion. Ecology 2014, 95, 2860–2869. [Google Scholar] [CrossRef]
- Oriol-Cotterill, A.; Valeix, M.; Frank, L.G.; Riginos, C.; Macdonald, D.W. Landscapes of coexistence for terrestrial carnivores: The ecological consequences of being downgraded from ultimate to penultimate predator by humans. Oikos 2015, 124, 1263–1273. [Google Scholar] [CrossRef]
- Loveridge, A.J.; Valeix, M.; Elliot, N.B.; Macdonald, D.W. The landscape of anthropogenic mortality: How African lions respond to spatial variation in risk. J. Appl. Ecol. 2017, 54, 815–825. [Google Scholar] [CrossRef]
- Schaller, G.B. The Serengeti Lion: A Study of Predator-Prey Relations; University of Chicago Press: Chicago, IL, USA, 1976. [Google Scholar]
- Hayward, M.W.; Kerley, G.I. Prey preferences and dietary overlap amongst Africa’s large predators. Afr. J. Wildl. Res. 2008, 38, 93–109. [Google Scholar] [CrossRef]
- Munthali, S.M.; Smart, N.; Siamundaala, V.; Mtsambiwa, M.; Harvie, E. Integration of Ecological and Socioeconomic Factors in securing Wildlife Dispersal Corridors in the Kavango-Zambezi Transfrontier Conservation Area, Southern Africa; Selected Studies in Biodiversity; Sen, B., Ed.; IntechOpen, 2018; Available online: https://www.intechopen.com/chapters/56778 (accessed on 1 May 2021).
- Cushman, S.A.; Elliot, N.B.; Bauer, D.; Kesch, K.; Bothwell, H.; Flyman, M.; Mtare, G.; Macdonald, D.W.; Loveridge, A.J. Prioritizing core areas, corridors and conflict hotspots for lion conservation in southern Africa. PLoS ONE 2018, 13, e0196213. [Google Scholar] [CrossRef]
- Cushman, S.A.; Elliot, N.B.; Macdonald, D.W.; Loveridge, A.J. A multi-scale assessment of population connectivity in African lions (Panthera leo) in response to landscape change. Landsc. Ecol. 2016, 31, 1337–1353. [Google Scholar] [CrossRef]
- IUCN. Conservation Strategy for the Lion in Eastern and Southern Africa; IUCN SSC Cat Specialist Group: Gland, Switzerland; Cambridge, UK, 2006. [Google Scholar]
- Jacobson, A.P.; Gerngross, P.; Lemeris, J.R., Jr.; Schoonover, R.F.; Anco, C.; Breitenmoser-Würsten, C.; Durant, S.M.; Farhadinia, M.S.; Henschel, P.; Kamler, J.F.; et al. Leopard (Panthera pardus) status, distribution, and the research efforts across its range. PeerJ 2016, 4, e1974. [Google Scholar] [CrossRef] [Green Version]
- RWCP; IUCN/SSC. Regional Conservation Strategy for the Cheetah and African Wild Dog in Southern Africa; Revised and Updated, August 2015; IUCN: Gland, Switzerland, 2015. [Google Scholar]
- Berger, J.; Cain, S.L.; Berger, K.M. Connecting the dots: An invariant migration corridor links the Holocene to the present. Biol. Lett. 2006, 2, 528–531. [Google Scholar] [CrossRef] [PubMed]
- Mueller, T.; Olson, K.A.; Dressler, G.; Leimgruber, P.; Fuller, T.K.; Nicolson, C.; Novaro, A.J.; Bolgeri, M.J.; Wattles, D.; DeStefano, S. How landscape dynamics link individual-to population-level movement patterns: A multispecies comparison of ungulate relocation data. Glob. Ecol. Biogeogr. 2011, 20, 683–694. [Google Scholar] [CrossRef]


| Predictor Variable | Lion | Leopard | Spotted Hyena |
|---|---|---|---|
| Proportion of arable land | - | 0.67 | 0.64 |
| Proportion of settlements | 0.57 | 0.53 | 0.52 |
| Distance to settlements | - | - | - |
| Distance to major roads (paved) | - | - | 0.65 |
| Distance to minor roads (unpaved) | - | - | - |
| Distance to major and minor roads (combined) | 0.72 | - | - |
| Distance to major and minor roads and rail (combined) | 0.70 | - | |
| Distance to train tracks | - | - | - |
| Proportion of Kalahari woodland | −0.64 | −0.56 | −0.52 |
| Proportion of Mopane woodland | −0.64 | - | - |
| Proportion of Teak woodland | −0.55 | - | - |
| Proportion of grassland | −0.58 | - | −0.60 |
| Distance to water | - | −0.60 | −0.59 |
| Topographic Position Index | −0.64 | - | - |
| Slope | - | −0.65 | - |
Publisher’s Note: MDPI stays neutral with regard to jurisdictional claims in published maps and institutional affiliations. |
© 2021 by the authors. Licensee MDPI, Basel, Switzerland. This article is an open access article distributed under the terms and conditions of the Creative Commons Attribution (CC BY) license (https://creativecommons.org/licenses/by/4.0/).
Share and Cite
Lines, R.; Bormpoudakis, D.; Xofis, P.; Tzanopoulos, J. Modelling Multi-Species Connectivity at the Kafue-Zambezi Interface: Implications for Transboundary Carnivore Conservation. Sustainability 2021, 13, 12886. https://doi.org/10.3390/su132212886
Lines R, Bormpoudakis D, Xofis P, Tzanopoulos J. Modelling Multi-Species Connectivity at the Kafue-Zambezi Interface: Implications for Transboundary Carnivore Conservation. Sustainability. 2021; 13(22):12886. https://doi.org/10.3390/su132212886
Chicago/Turabian StyleLines, Robin, Dimitrios Bormpoudakis, Panteleimon Xofis, and Joseph Tzanopoulos. 2021. "Modelling Multi-Species Connectivity at the Kafue-Zambezi Interface: Implications for Transboundary Carnivore Conservation" Sustainability 13, no. 22: 12886. https://doi.org/10.3390/su132212886
APA StyleLines, R., Bormpoudakis, D., Xofis, P., & Tzanopoulos, J. (2021). Modelling Multi-Species Connectivity at the Kafue-Zambezi Interface: Implications for Transboundary Carnivore Conservation. Sustainability, 13(22), 12886. https://doi.org/10.3390/su132212886